


Introduction
From the seventeenth to nineteenth centuries, abundant land and low disease risk in settler colonies enabled a continued inflow of European migrants that opened up new farmland at relative low cost (Acemoglu et al. Reference Acemoglu, Johnson and Robinson2001; Engerman and Sokoloff Reference Engerman and Sokoloff2012). Europeans could arrive in the newly colonized territories almost empty handed, it is said, and gradually accumulate wealth by tilling fresh land or as wage workers in the high-wage environment (Carter and Sutch Reference Carter, Sutch, Lloyd, Metzer and Sutch2013). Mainland North America is often cited as an example of how poor but hard-working Europeans were able to escape poverty in Europe and build a more prosperous future in the “New World” (Abramitzky and Boustan Reference Abramitzky and Boustan2017), and evidence from South America suggests similar conclusions (Pérez Reference Pérez2017). The implication is that upward income mobility among settlers must have been high.
This is confirmed by estimates from the United States during the nineteenth century. Kearl and Pope (Reference Kearl and Pope1984) match household in US censuses in the second half of the nineteenth century and calculate the distribution and mobility of wealth. They find “considerable mobility” in this period, aided by large numbers of new immigrants that reported no wealth (Kearl and Pope Reference Kearl and Pope1984: 194). Steckel (Reference Steckel1990: 277), using a nationally representative sample from the censuses, finds less upward mobility among those at the bottom of the distribution but “roughly the same pattern of movement among those who were initially rich.” Steckel also emphasizes that the 1850s, his period of analysis, coincided with America’s industrialization. More recent literature measuring intergenerational mobility, matching fathers to sons across US censuses ten years apart, also reports relatively high levels of mobility (Long and Ferrie Reference Long and Ferrie2013; Olivetti and Paserman Reference Olivetti and Paserman2015).
There are a number of concerns with both the earlier intragenerational estimates and recent intergenerational estimates. Data availability is an important limitation. Because US censuses before 1940 do not record income, occupations are often used as a proxy for economic status. Occupations are, at best, an imprecise indicator of income or wealth. Using occupations as a proxy is especially challenging in preindustrial agrarian economies, where the majority of settlers are farmers. Farmers are often treated as one category despite significant differences in wealth and income within the group. Poor matching rates between fathers and sons complicate matters further. Finally, most recent studies refer to the period after 1850, when census data is readily available (Long and Ferrie Reference Long and Ferrie2013; Song et al. Reference Song, Massey, Rolf, Ferrie, Rothbaum and Xie2020). Yet this period is characterized by the industrial transformation of both the Old and the New World. For those interested in the mobility of a settler society before structural change, census data are too late.
The main contribution of this paper is to provide a detailed study of late-eighteenth and early-nineteenth-century intragenerational income mobility in a preindustrial, colonial society. We use the Cape Colony, today part of South Africa, as a case study. We can do so because, since 2015, we have transcribed annual tax censuses started by the Dutch East India Company (VOC) of the settler population at the Cape. These rich data sources allow us to calculate household-level incomes for settler farmers in the Colony, and then match these households across time at a much higher rate and time resolution than are available for other settings (Rijpma et al. Reference Rijpma, Cilliers and Fourie2020). Our baseline results, based on 138,784 observations, suggest that intragenerational income mobility was surprisingly low; in other words, we find high levels of persistence, contradicting the stereotypical view of high upward mobility in settler societies. Our rich sources allow us to investigate to what extent our methodological choices explain this surprisingly low mobility in a way that existing mobility studies based on census data cannot.
Our dataset allows us to calculate mobility in several ways. Instead of only matching households every ten years, we can measure income mobility across one-year, five-year, and ten-year transitions and compare the results. The number of transition years matters; fewer years between starting and finishing periods yield higher persistence estimates. We also find more mobility at the top of the distribution as the number of transition years increase.
The Cape Colony was a frontier society, characterized by a continuous expansion of its borders. The traditional view has been to emphasize that the expanding frontier enabled migrating men and women who were willing to work hard to experience upward income and/or social mobility (Mann Reference Mann1984; McGregor Reference McGregor1966; Mendolia and Siminski Reference Mendolia and Siminski2016). Because frontier expansion is key to explaining upward income mobility in settler economies, there may be spatial variation in the opportunities available to settlers at the center and the periphery (Bazzi et al. Reference Bazzi, Fiszbein and Gebresilasse2020). Although some scholars distinguish between open and closed frontiers, one assumption, particularly in earlier studies, was that the results of one district (or state) would be externally valid (Lamar Reference Lamar1981; Willebald and Juambeltz Reference Willebald, Juambeltz, Pinilla and Willebald2018). But because land is still in abundance in an open frontier, and the social and economic order is fluid, we would expect upward income mobility to be greater there than in a closed frontier characterized by land shortages and an institutional order that tends to favor those who are already well established. This paper, then, compares income mobility between the Stellenbosch district, considered a closed frontier, and the Graaff-Reinet district, an open frontier. We find evidence of initial differences that support our hypothesis. Surprisingly, however, the mobility estimates soon reverse, with the frontier experiencing lower levels of mobility rapidly after the district became economically established. Frontier and closed districts provide the same opportunities for economic mobility within a short space of time.
We test several additional assumptions. We calculate income mobility elasticities that both include and exclude zero-income households. Zero-income households might include non-farmers, farmers with alternative income streams not recorded in the tax censuses or households that are mismeasured for a variety of reasons. Although including zeros does inflate the bottom of the distribution, resulting in higher persistence, the differences are not as large as might be expected. We compare mobility estimates when capital goods – notably slave holdings – are included and excluded. Our estimates do not change substantially, suggesting that it is not slave ownership that determines the high levels of persistence, though the agricultural outputs produced by enslaved people may well do so. We also compare mobility estimates for households with a single (male) household head versus those that are married. Here singleness may proxy for being young, engaging in other nonagricultural activities, or simply lower-quality matches when constructing the panel. We indeed find evidence of higher persistence when limiting the analysis to single-headed households, suggesting that poor matching rates (and thus higher measurement error) may result in overestimating mobility (Bailey et al. Reference Bailey, Cole, Henderson and Massey2020).
Finally, we split income mobility into the three main types of production – crop, viticulture, and stock farming. We would expect that agricultural activities with immovable inputs such as vines, for example, would have substantially higher persistence. We find, by contrast, the highest income mobility amongst viticulturalists and the lowest among crop farmers, suggesting that temporary shocks such as weather changes have little bearing on calculating mobility estimates when using a large sample.
Although our study provides new insights into intragenerational income mobility in a preindustrial, settler society, it has its own limitations. As we use tax censuses as primary source, we primarily consider a population of farmers in our analysis; while that would include more than 90% of settlers in the districts we study, the numbers would be substantially lower for the Cape district, which included Cape Town with its large services sector. Second, just as others derive income from occupational classifications, we impute (gross) income from agricultural output available in tax censuses. We fail to include output not reported in these tax censuses. Third, although we look at two districts, one at the center and one on the periphery, we do not account for in- and out-migration between districts or, indeed, to other districts.
Yet by utilizing annual, matched tax censuses over a long-time span, we are able to test many assumptions standard in the historical intergenerational literature. Our results reveal surprising levels of immobility in our preindustrial setting. They thus emphasize caution when calculating and interpreting historical social mobility estimates. Measurement error affects income mobility elasticities; a data-generating process affected by poor data recording and transcription practices, low match rates across time, and the use of proxies are likely to overestimate mobility. Incomes in the past were probably more persistent than we currently think, even in settler societies that promised a better life for those settlers at the bottom of the distribution.
Income mobility in the present and past
Social mobility was measured by calculating the likelihood that an individual – or class of individuals – would move from one occupational category to another (Grusky and Sørensen Reference Grusky and Sørensen1998). Intergenerational social mobility linked parents to children, measuring the extent of social mobility between generations (Erikson and Goldthorpe Reference Erikson and Goldthorpe2002).
Estimating intergenerational mobility elasticities (IGE) has a long tradition in the social sciences. The intuition behind the IGE is simple: A low IGE indicates that parental earnings have a minimal impact on the earnings of their children, thereby allowing for greater economic mobility across generations. In other words, a lower IGE value implies that individuals have higher chances of changing their economic status independent of their family’s financial background. Initial work suggested very high mobility (or a low IGE) for US males; Becker and Tomes (Reference Becker and Tomes1986), for example, find an IGE of less than 0.2. But later studies that account for possible measurement error or use administrative data tend to find more intergenerational persistence (i.e., low mobility) (Mazumder Reference Mazumder2005; Solon Reference Solon, Ashenfelter and Card1999).
Measurement error is one reason for the higher rates of persistence. If left unaccounted for, such an error will create the appearance of more mobility than actually exists. There are many reasons why earnings data may not be completely reliable, and these have been well documented in the literature on contemporary intergenerational earnings mobility. Self-reported earnings or wealth data taken from surveys or census data may not exactly match actual earnings (Blattman et al. Reference Blattman, Jamison, Koroknay-Palicz, Rodrigues and Sheridan2016; Bruckmeier et al. Reference Bruckmeier, Müller and Riphahn2015). When we compare parents’ and children’s earnings at different points in their lifecycles, this noncomparability will produce inflated estimates of earnings mobility. IGE estimates can also be biased by temporary shocks to household incomes; Mazumder (Reference Mazumder2005) demonstrates that persistence may be underestimated by 50% if temporary shocks are unaccounted for.
One way to overcome such measurement error is to use instrumental variables; Solon (Reference Solon, Ashenfelter and Card1999) reports that studies using this method usually find IGE estimates closer to 0.5. To combat the effect of temporary shocks, income is measured by using the average mid-life earnings. Another way to improve mobility estimates is to use more reliable data. Lee and Solon (Reference Lee and Solon2009) use the full Panel Study of Income Dynamics and report IGEs of between 0.43 and 0.56. Chetty et al. (Reference Chetty, Hendren, Kline and Saez2014) use US tax returns to calculate a surprisingly low IGE of around 0.3. Mazumder (Reference Mazumder, Cappellari, Polachek and Tatsiramos2016: 83) demonstrates, however, that the age structure and limited panel dimension of the data used by Chetty et al. (Reference Chetty, Hendren, Kline and Saez2014), notably the short panels that cover only certain portions of the lifecycle, lead to “considerable downward bias in estimating the IGE.” He shows that when these data limitations are relaxed, the IGE of family income in the US is likely to be higher than 0.6.
The problem of measurement error extends to estimating intragenerational social mobility. It is more pronounced in high frequency data over individuals’ life course, and specifically in developing country contexts where respondents find it hard to report on irregular incomes from informal and self-employment activities (Fields et al. Reference Fields, Cichello, Freije, Menéndez and Newhouse2003). But it is also true of data created before the twentieth and twenty-first centuries. The first wave of mobility studies on historical data for the US found unrealistically high rates of mobility (Galenson and Pope Reference Galenson and Pope1989; Parkerson Reference Parkerson1982; Steckel Reference Steckel1989). Armed with stronger computing power, Ferrie (Reference Ferrie2005) was one of the first to construct more reliable estimates of mobility, calculating that white American men of the mid-nineteenth century were indeed highly socially mobile. In later work, Long and Ferrie (Reference Long and Ferrie2013), comparing American and British intergenerational occupational mobility, confirm these results by finding higher social mobility in the United States until the 1950s. American exceptionalism – its higher social mobility – seems to disappear during the second half of the twentieth century, although there is some disagreement about the timing of this decline. Olivetti and Paserman (Reference Olivetti and Paserman2015) calculate IGE for both sons and daughters in the United States and find a sudden increase in mobility from 1900 to 1920. By contrast, Song et al. (Reference Song, Massey, Rolf, Ferrie, Rothbaum and Xie2020) argue that most of the decline happened prior to 1900, largely driven by the movement of children from farm to factory during the era of industrialization.
The field has since extended in many directions. One line of inquiry has been to calculate intergenerational mobility estimates for more regions, time periods, and groups previously unaccounted for, like Black Americans (Alesina et al. Reference Alesina, Hohmann, Michalopoulos and Papaioannou2021; Chen et al. Reference Chen, Naidu, Yu and Yuchtman2015; Collins and Wanamaker Reference Collins and Wanamaker2022; Derenoncourt Reference Derenoncourt2022; Pérez Reference Pérez2019). One hypothesis is that land abundance made the transition towards independent farming easier in the Americas compared to Europe, which in turn spurred upward occupational mobility.
A second line of inquiry has been to link more generations. One finding is that grandfathers matter: adding more generations results in lower intergenerational mobility estimates (or higher persistence) (Collado et al. Reference Collado, Ortuño-Ortín and Stuhler2023; Long and Ferrie Reference Long and Ferrie2018; Solon Reference Solon2018). This is because adding more generations captures cumulative advantages or disadvantages that are passed down through family networks. Using rich Swedish population data, for example, Adermon et al. (Reference Adermon, Lindahl and Palme2021) show that traditional two-generation estimates underestimate intergenerational persistence by at least one-third.
A third line has been to measure intergenerational mobility for various subgroups of society. Migrants have been a particular focus (Abramitzky et al. Reference Abramitzky, Boustan, Jácome and Pérez2021a; Collins and Wanamaker Reference Collins and Wanamaker2015; Ward Reference Ward2022). A fourth line has been to develop more sophisticated matching techniques (Abramitzky et al. Reference Abramitzky, Boustan, Eriksson, Feigenbaum and Pérez2021b; Bailey et al. Reference Bailey, Cole, Henderson and Massey2020; Helgertz et al. Reference Helgertz, Price, Wellington, Thompson, Ruggles and Fitch2022). A fifth line of inquiry has been attempts at causal explanations for social mobility, including inheritance (Adermon et al. Reference Adermon, Lindahl and Waldenström2018), education (Card et al. Reference Card, Domnisoru and Taylor2022), and land (Collins et al. Reference Collins, Holtkamp and Wanamaker2022).
Despite these advances in the field, valid concerns remain regarding the study of income mobility. Many of these concerns apply to both intergenerational and intragenerational studies. One major concern is the classification and ranking of occupations, which becomes problematic in a preindustrial agrarian setting. Farmers, who comprise a significant portion of historical occupations, pose a challenge as there is no information available to distinguish between more and less prosperous farmers, leading to inevitable bias in mobility estimates. The categorization of farmers as a single occupational category introduces another potential bias. If a farmer is classified as “farmer” in one census but given a more specific job title, such as “milkman” or “breeder” in the next census while performing the same tasks, social mobility is likely to be overestimated. Additionally, the wages and status associated with occupations are expected to change over time (Ward Reference Ward2023). In short, measurement error in data generation for farmers may be larger than for other occupations.
A second concern is the issue of matching. Most studies rely on historical censuses conducted a decade apart, and match rates of 30% or lower are considered fair but may contain errors (Bailey et al. Reference Bailey, Cole, Henderson and Massey2020; Massey Reference Massey2017). Common names, such as John Smith in the United States, are unlikely to be matched correctly across datasets separated by several years. The selection into being matched may introduce bias in mobility estimates.
Another limitation is the focus on the industrial era. National censuses, which form the basis for many mobility studies, only became part of government bureaucratic functions during the second half of the nineteenth century, coinciding with the expansion of industrial production (Whitby Reference Whitby2020). Therefore, available estimates primarily cover countries during or at the dawn of industrialization, limiting our understanding of mobility in preindustrial societies.
In our paper, we aim to address these limitations by estimating household-level income mobility in a settler colonial setting: the Cape of Good Hope at the southern tip of Africa. Leveraging the wealth of information preserved by the Dutch East India Company and its successors, we combine annual tax censuses spanning over 70 years for two districts – one close to the colonial center and one on the colonial periphery – to calculate measures of social mobility in a preindustrial, colonial context. Our findings reveal low mobility at the Cape, with some variation observed at the frontier. These results confirm the existence of a “colonial landed elite” (Dooling Reference Dooling2005; Guelke and Shell Reference Guelke and Shell1983; Ross Reference Ross1983; Williams Reference Williams2013). They also raise questions about the assumed high mobility of settler societies during the phase of frontier expansion.
The Cape and its institutions
The Cape Colony was established when a small group of VOC employees was sent by the Company to establish a refreshment station for ships sailing between Europe and the East Indies in Table Bay. Soon after their arrival, in 1652, the commander of the station, Jan van Riebeeck, recognized the need to expand production to service the more than 6000 sailors and soldiers that arrived in the fledgling community every year (Boshoff and Fourie Reference Boshoff and Fourie2010). He thus released nine Company servants in 1657 to become settlers: farmers that produced wheat and meat to be sold to the fort in Cape Town.
The history of the Dutch Cape Colony is a history of geographical expansion. Twenty-five years after the establishment of the trading post the area of the VOC’s territorial control was still small, yet by the end of the eighteenth century, it was about the same size as Great Britain – a truly remarkable expansion (Guelke Reference Guelke1976). Stellenbosch is located in the south-west and was one of the earliest settlements in the Cape Colony, established in 1679, while Graaff-Reinet is located in the interior and was established more than a century later.
Limited knowledge about local climatological conditions made farming difficult for these early farmers, while constant skirmishes with the indigenous Khoesan, a pastoral people that inhabited most of the fertile land in the area for the past 2000 years, made it dangerous. It was only after a series of violent conflicts with the Khoesan in the 1670s that the fertile valleys below the first mountain ranges opened up. The numbers of the settler population increased substantially and so, too, did the crops and vines under cultivation, satisfying the demand of the passing ships. By contrast, Khoesan numbers dwindled as a result of violence or migration deeper into the interior, though some remained, sometimes forcibly, on settler farms as laborers (Fourie and Green Reference Fourie and Green2015).
The abundance of land that could be acquired relatively cheaply through the loan farm system that was applied in the frontier regions – a system where a settler had to pay an annual fee to get a farm registered – gave poorer settlers a relatively fair chance to accumulate wealth by investing in land. The fee remained unchanged for long periods of time. Farmers had to pay 12 rixdollars annually until 1732 when it was doubled to 24 rixdollars. It then remained unchanged throughout the 18th century. Land in the eastern and northern frontiers was of lower quality compared to the commercial center of the southwestern Cape and the distance to the market (i.e., Cape Town) was significantly longer. However, land at the frontier was in general suitable for pastoral farming and the demand for livestock from passing ships steadily increased throughout the nineteenth century. It is this demand, argues Neumark (Reference Neumark1957), the explains the rapid expansion of the frontier during the second half of the eighteenth century, relying on a system, as Swanepoel and Fourie (Reference Swanepoel and Fourie2018) shows, of loan farms rather than farms endowed with freehold property rights. Neumark (Reference Neumark1957) argues that settlers with limited means were rational profit-maximizers by moving towards the frontier, establishing cattle farms.
Yet despite Neumark’s (Reference Neumark1957) emphasis on economic profitability, the general perception of the Cape economy was one of economic backwardness, a settler society that, with the exception of a few elite families, struggled for survival. Ross (Reference Ross1983) first suggested a reinterpretation of the Cape economy. Instead of “more a static than progressing community” that “advanced with almost extreme slowness (Fourie Reference Fourie2013: 419),” Duin and Ross (Reference Duin and Robert1987) proposed that the Cape had a thriving agricultural sector, one that was expanding over the eighteenth century. His views have received recent support. Using both probate inventories that record household assets and tax censuses, empirical evidence now supports the notion that Cape settlers were, on average, relatively affluent, at least compared to other settler societies of the time (Fourie Reference Fourie2014; Fourie and Garmon Reference Fourie and Garmon2023).
Not everyone was equally well-off. According to Ross (Reference Ross1983: 206–207), “this new prosperity was not spread evenly throughout the colony.” When the German traveler, Otto Mentzel (Reference Mentzel1925), visited the Cape in the 1730s, he classified the settlers into four categories: absentee-landlords who lived in Cape Town and employed wage laborers on their farms to oversee productions, resident landlords who lived on large estates in affluence, just “like a gentry” (Mentzel Reference Mentzel1925: 102), settlers who worked alongside their workers, producing for a market, and, finally, the poor stock farmers of the interior.
Historians have expanded on Mentzel’s observations, documenting the seemingly deep and entrenched class divisions within Cape society. Guelke and Shell (Reference Guelke and Shell1983: 265) noted that the early eighteenth century was a period of rationalization in settler society: “Large estates swallowed up unsuccessful small farms and a few were enlarged by dynastic marriages. Large-scale production yielded low returns on capital, but small farms often ceased to make profits.” Indeed, as Fourie and Von Fintel (Reference Fourie and Von Fintel2011) show using select tax censuses, Cape settler society was a highly unequal society. A “colonial landed elite” emerged, giving rise to severe levels of inequality and, given the static nature of the economy, low social mobility (Dooling Reference Dooling2005: 148).
It is in this setting that we turn to tax censuses – the opgaafrollen – to measure the nature of mobility in two districts of the Cape: the wheat and wine farmers of the fertile Stellenbosch district close to Table Bay, and the largely pastoral farmers of the eastern frontier district, Graaff-Reinet. The tax censuses mainly record essential household and production details. Footnote 1 They count the number of men, women, and children (sons and daughters), as well as the number of European settler laborers and enslaved people (by age and sex). In Graaff-Reinet, they also include a count of the number of Khoesan laborers by age and sex. Quantities of livestock (horses, cattle, and sheep), crops (wheat, barley, rye, and oats), vines, and wine production represent agricultural production. For some years, the records included counts of weapons like flintlocks, pistols, and swords. Post-1800 censuses sometimes added more production details, such as brandy volume, and occasionally listed other assets like wagons and carts. The censuses also sometimes included summaries, mortality rates, church donations, and taxes paid. In some cases, the household head’s signature was present. The Cape of Good Hope Panel project is currently transcribing these records to cover more years and districts (Rijpma et al. Reference Rijpma, Cilliers and Fourie2020). Footnote 2
The tax censuses also have limitations. Apart from district or subdistrict names, they included no information about the location of farms or, importantly, of the size of farms. The Cape had two property right regimes: smaller, freehold farms in the regions closer to Cape Town and larger, loan farms in the interior (Swanepoel and Fourie Reference Swanepoel and Fourie2018). We have no way of knowing either the value of farms or ownership type.
The censuses also exclude all nonagricultural production. Despite manufacturing being prohibited by the Dutch East India Company at the Cape, there is some evidence from settler probate inventories of light manufacturing – barrel making, for example (Fourie Reference Fourie2013). Even where information about output was recorded, such as cattle ownership, for example, we should also worry about underreporting. Fourie (Reference Fourie2013), in comparing the probates to the tax censuses, finds substantial underreporting in those goods that were taxed, notably cattle and sheep. In the context of measuring mobility, however, such underreporting is unlikely to vary systematically year-by-year.
Importantly, though, the tax censuses include the names of the household head and, often, his wife. This allows us to link households between years, making it possible to ascertain the likelihood that individuals of different classes were able to move up or down in the late eighteenth and early nineteenth centuries.
Constructing the panel
The tax censuses for our two districts comprise a total of 138,784 observations, necessitating the use of automatic record linkage to create a panel that traces households over time. We employ an updated version of the supervised machine-learning approach introduced by Rijpma et al. (Reference Rijpma, Cilliers and Fourie2020). This approach estimates optimal weights and thresholds using manually labeled data, which tends to outperform manual linking rules and unsupervised machine learning methods in similar contexts (Aiken et al. Reference Aiken, Dórea, Acedo, de Sousa, Dias and de Magalhães Rosa2019). Additionally, this approach provides precise measures of the linkage’s accuracy.
The first step involves selecting candidate pairs from the cross sections, which are plausible links based on an efficient metric. In this case, we use the cosine similarity between the bigrams of household heads’ surnames to identify candidates. The original training data created for linking the Graaff-Reinet dataset, using manual methods to match households to themselves, demonstrated that this metric captured over 99% of all true links, with true links accounting for 9% of all candidates generated by the cosine similarity procedure. Therefore, the dataset is of manageable size.
To address the discrepancy in performance between districts, a separate training dataset was created for the Stellenbosch district. The model that was trained solely on the Graaff-Reinet data underperformed when applied to the Stellenbosch data due to the higher prevalence of single-headed households in Stellenbosch, which weakened some of the heuristics employed for Graaff-Reinet. We ultimately combined the two training datasets to make predictions for both districts. Footnote 3
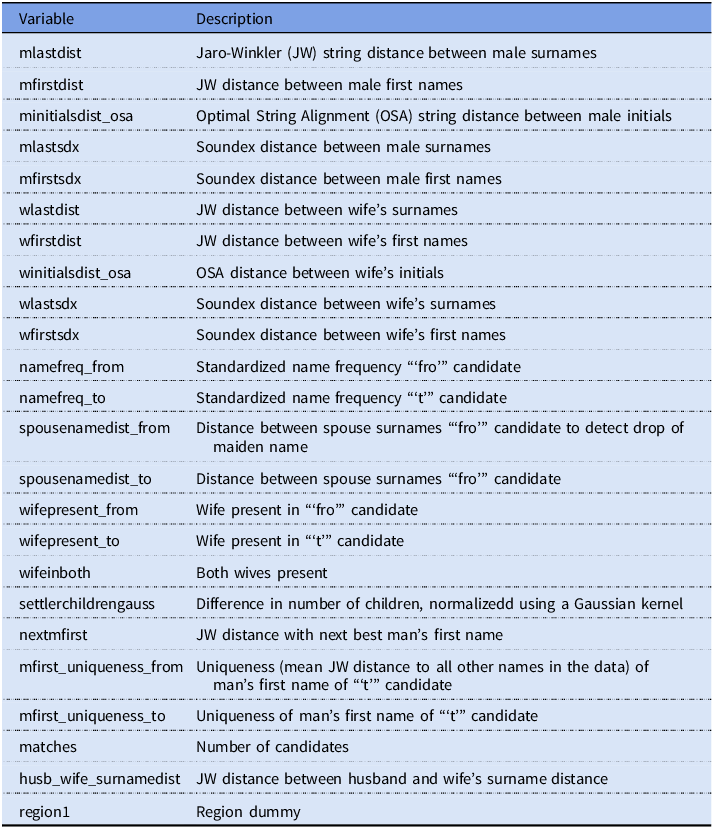
The manually labeled data was split into 70% training and 30% evaluation sets for training a predictive model. Table 1 lists the features used in the model, which includes Jaro-Winkler string distances to measure differences between string variables across tax census cross sections. Based on the evaluation data’s performance, we selected gradient boosting as the predictive model, as it can handle nonlinearities in string distances and missing data (Chen and Guestrin Reference Chen and Guestrin2016). The most influential features in the final model were the first and last names of the husband and wife.
Features used to predict links in gradient boosting model
The predictive model’s performance is evaluated using two metrics: precision, which measures the share of all true predictions that are accurate links, and recall, which measures the share of all true links correctly predicted. Our procedure achieves a recall of 86% and a precision of 93%, resulting in a combined F1 score of 89% (Table 2). Footnote 4 This performance is similar that of logistic regression and random forests models used by Rijpma et al. (Reference Rijpma, Cilliers and Fourie2020): 89% and 86% recall; 90% and 94% precision respectively. However, gradient boosting was found to scale better, helping us solve several computational bottlenecks, and it allowed us to include missing values such as names in our data, easing data handling and increasing the performance of the model for these records. This performance compares favorably to other historical record linkage studies and instils confidence in the presented results (Abramitzky et al. Reference Abramitzky, Boustan, Eriksson, Feigenbaum and Pérez2021b; Massey Reference Massey2017; Price et al. Reference Price, Buckles, Van Leeuwen and Riley2021).
The procedure’s success can be attributed to several factors. First, the use of annual data reduces issues related to data attrition compared to census linkage studies with longer intervals. Second, the utilization of household-level data, as opposed to individual-level data, provides more information for accurate linking (Akgün et al. Reference Akgün, Dearle, Kirby, Eilidh, Dalton, Christen, Dibben and Williamson2020; Rijpma et al. Reference Rijpma, Cilliers and Fourie2020). While a single person’s name might not uniquely identify them, the combination of names for a couple often does. This linking strategy, however, does imply that marital status affects the probability of being linked. Performance is excellent for individuals married in two cross sections (F1: 0.95) and good for single individuals in two cross-sections (F1: 0.81), but weaker for individuals married in one year and not in the other (F1: 0.55, with a recall of 50%, meaning that we recover only 50% of these links) due to the difficulty of determining whether the change in marital status represents a widow or a son succeeding the household. It should be noted that this aspect is inherent to the data rather than an artifact of the procedure. Overall, the record linkage procedure performs well, although households that experience changes in marital status may be underrepresented. Since disrupted households would probably face downward mobility, we potentially overestimate persistence. In online Appendix A we quantify the impact of this bias, finding that the overall results are robust to reweighting for this type of attrition.
The predicted links are utilized to construct a panel by working backward from the most recent cross-section. For each household in each base year, the candidate with the highest predicted probability being a match – and a predicted probability of at least 0.5 – is selected. This approach results in approximately 80% of households being linked to at least one other year in the resulting panel. The linking rates are slightly lower in years where spouse information is not recorded in the tax censuses. Footnote 5 Moreover, the resulting series are of sufficient length, with the combined data from the two districts revealing the presence of 10 series with a minimum length of 40 observations, over 1,000 series with a minimum length of 18, and more than 12,000 series with a minimum length of 3 (see Figure 1). This panel dataset, known as the Cape of Good Hope Panel, enables the calculation of social mobility across time and in various districts.
Evolution of sample in Stellenbosch and Graaff-Reinet.
Notes: Linked and unlinked households are shown in this figure. Unlinked households are, by definition counted as having entered the panel 0 years ago. Figures inside the bars indicate the sample size.

With regards to weighting, Bailey et al. (Reference Bailey, Cole, Henderson and Massey2020) emphasize that longitudinal matching generates both errors of inclusion (“false matches” or low precision in our terminology) and exclusion (“missed matches” or low recall). Both errors introduce significant bias in estimating social mobility. The extent of the first problem can be investigated by limiting samples using “validation variables,” auxiliary information which supports when matches are “real” or not, such as agreement over time about where parents were born. The second problem can be addressed by reweighting estimates of social mobility using inverse propensity scores. This process gives greater weight to households possessing characteristics with typically poor match rates, and are, consequently, mostly underrepresented in estimation samples. Because we do not have age and birthplace in our sample, we use “name commonness” in our matching algorithm, similarly to Abramitzky et al. (Reference Abramitzky, Platt Boustan and Eriksson2014). This information would have been our strongest candidate for a validation variable. But because this variable was used to generate matches, it cannot be used as a validation variable for sensitivity testing. However, our data are suited to reweighting using a logit specification. Appendix A provides full details of how our weights were generated. The strongest predictor of matching households over time was whether the tax records included two names of a couple, providing sufficient information to verify that the same household was traced over time. Our results – both estimates of persistence elasticities and transition plots – do not change meaningfully when we reweight our data and when we trim samples to exclude observations with low propensity scores – those at the greatest risk of not being matched. However, in the case of 10-year transitions, the results are sensitive to trimming. Because most of our analysis focuses on 5-year transitions, our results are highly robust to these methodological variations. Going forward, all results in the main text are reweighted by propensity scores and all observations with propensity scores below 0.3 are omitted from the estimation sample. In the online appendix, we report results using unweighted, weighted, and trimmed estimates.
Measuring social mobility at the Cape
Method
The Cape of Good Hope Panel enables the measurement of social mobility within the same household over time. To accomplish this, we construct the total annual income for each household by combining flow and stock variables that generate income. Flow variables involve the difference between the volumes of crops reaped and sowed by households, multiplied by their respective prices to derive crop income. Stock variables, such as slave ownership and livestock (cattle, horses, and sheep), are assessed using prices multiplied by 6% of each household’s capital stock. The 6% figure represents the standard interest rate at the Cape. As per Fourie and Garmon (Reference Fourie and Garmon2023), we do not account for depreciation.
We rely on price data based on a limited set of auction records spanning approximately 1798 to 1802. While prices may have varied over the long term, our assumption of fixed prices is unlikely to significantly impact social mobility estimates within districts and over relatively short periods of time, such as five years. One reason for this is that the VOC fixed the prices of agricultural goods for sale in Cape Town; if anything, the Cape experienced deflationary pressures for most of the eighteenth century (Du Plessis and Du Plessis Reference Du Plessis and Du Plessis2012). We further examine the assumption of price stability by presenting separate estimates based on income sources. It is our hope that future research will explore the unaccounted price effects in this analysis.
Empirical studies on income mobility seek to understand the persistence of income for the same household (h) over time. Footnote 6 Denoting the natural logarithm of household income as y in year t, we estimate the following equation using annual panel data:
 $${y_{th}} = \;\mu + \;\beta {y_{t - k;h}} + {u_{th}}$$
where k=1, 5, 10 and u is an idiosyncratic error term. The estimated elasticity (β) reflects the percentage change in current income associated with a 1% change in past income. Elasticities approaching 1 indicate perfect persistence in incomes, implying no mobility. We present these elasticities in brackets in all our figures and provide an estimation summary in Table 3.
Confusion matrices for training and validation data, comparing actual links (rows) from the manually labeled data with the predictions from the model (columns)
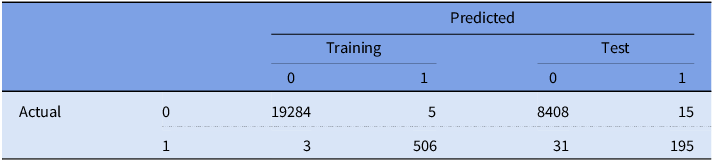
Test set precision = 195/(195 + 15) =0.93; recall = 195/(195 + 31) = 0.86; F1 = 2/(1/0.93 + 1/0.86) = 0.89.
Summary of elasticity estimates by period, district and assumption
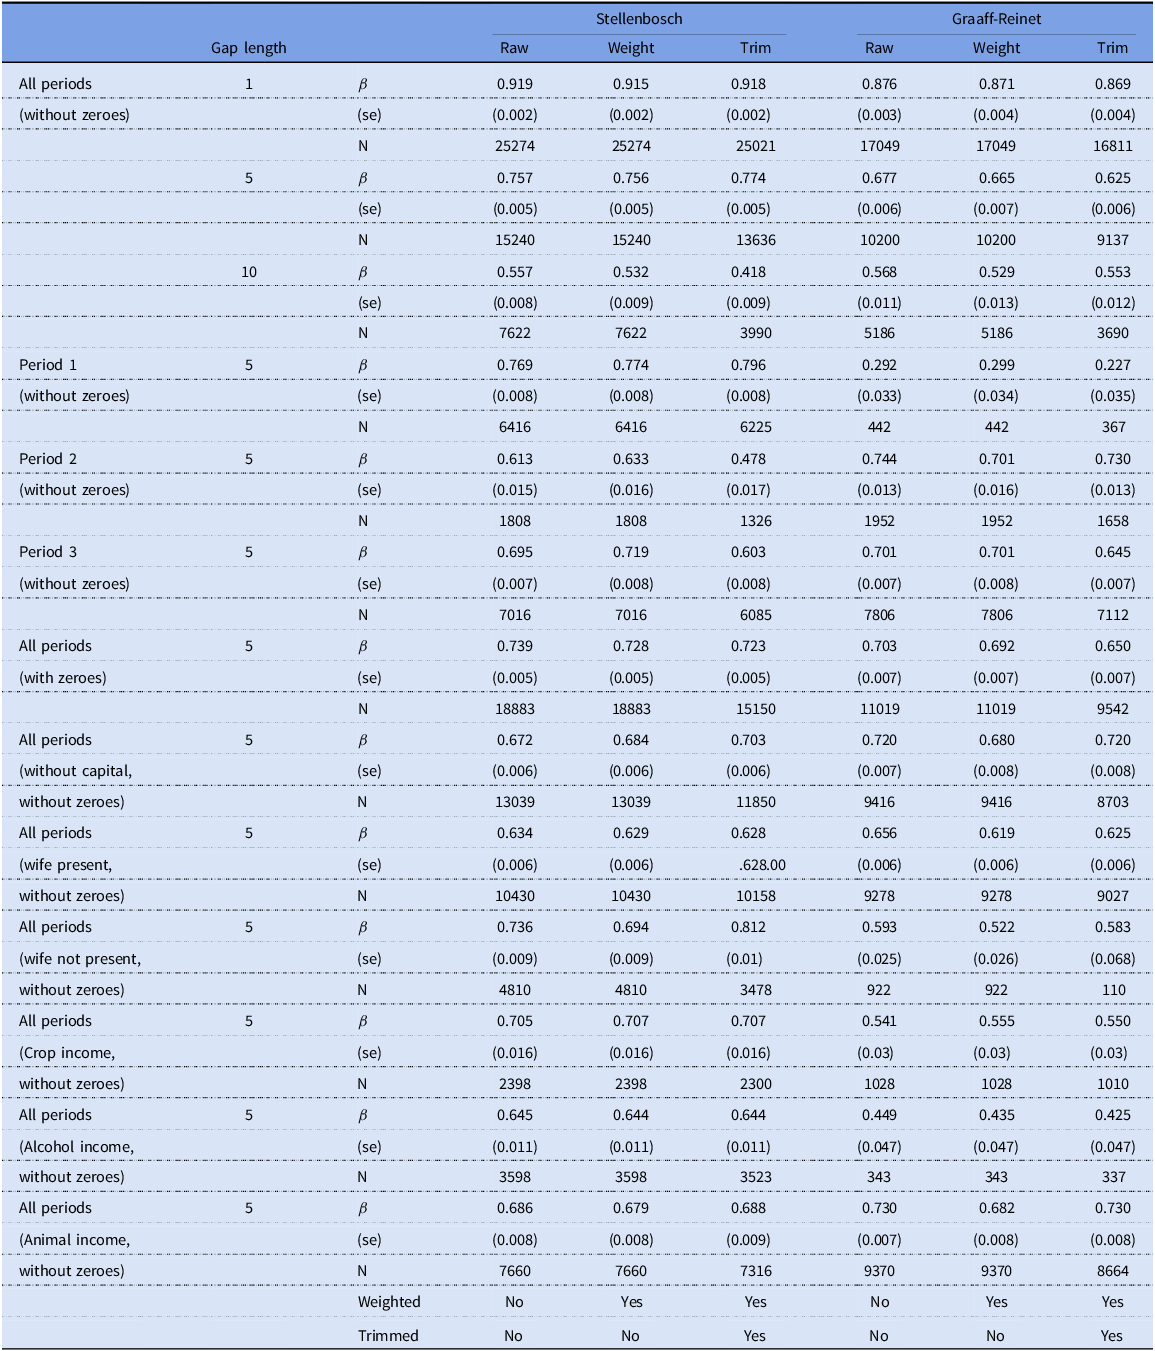
Notes: Own calculations from Opgaafrollen. Inverse propensity weights were generated from columns (1) and (4) in Table A1. The first column of figures presents unweighted estimates, the second column uses the same sample as in the first column, but reweights, while the third column reweights, but also limits the sample to observations with propensity scores above 0.3. In Stellenbosch, period 1 corresponds to 1780–1798, period 2 to 1803–1811, and period 3 to 1812–1829. In Graaff-Reinet, period 1 corresponds to 1792–1800, period 2 to 1805–1813, and period 3 to 1814–18.
While elasticities offer a holistic perspective on mobility/persistence across the entire distribution of households, new analytical tools enable a more disaggregated examination. We utilize transition probability color plots to visualize mobility across the entire income distribution (Van Kerm Reference Van Kerm2011). Each row in a transition probability color plot represents a marginal distribution, with rows arranged so that low-income groups occupy the top and high-income groups occupy the bottom in the origin period. Different shades indicate the marginal distribution in the destination period, with low-income groups shown in white and high-income groups in black. A plot with horizontal white lines at the top and horizontal black lines at the bottom exemplifies complete immobility: individuals at the bottom of the income distribution (top row) remain at the bottom (white). In the case of complete reversal, the top line would become black, indicating that individuals at the bottom of the income distribution (top row) transition to the top of the distribution (black), while those at the top of the income distribution (bottom row) move to the bottom (white). Conversely, a plot with vertical lines represents complete independence, signifying an equal likelihood of mobility for groups at the bottom and top of the income distribution. The usual situation falls between these extremes, with movements the proportions in each quintile changing over time.
We use these transition probability color plots to provide a more nuanced understanding of mobility patterns. By visualizing the movement of different income groups over time, we can identify trends and variations in mobility across the income distribution.
Data and descriptive statistics
We start by exploring the nature of the analysis sample. Figure 1 displays the number of households in each district by year and classifies them according to how long they have been in the panel. In the first year of our panel, as expected, all households have been in the panel for zero years. Starting from 1776, we consistently observe that approximately two-thirds of the Stellenbosch observations are linked to at least one previous year. By 1780, nearly half of the Stellenbosch panel matches to five or more years, and by 1785, one-fifth of the panel matches to ten or more years. By 1795, around one-tenth of the panel matches to 20 or more years. A similar increase in match rates emerges for Graaff-Reinet.
Figure 1 also reveals the presence of outlier years, such as 1800 in Stellenbosch, where the sample size decreases by over 50% from the previous observation, and 1802, where the sample size increases by more than 10%, only to decline the following year. These discrete sample changes correspond with times when record-keeping was disrupted by transition from VOC to British rule (such as a drop in sample size in 1800 in Stellenbosch and the high proportion of “new entrants” in Graaff-Reinet in 1801) and in some cases boundary changes (with some of the sample being included in newly established districts – as is evident in 1814 and 1819 in Graaff-Reinet and after 1830 in Stellenbosch). As noted before, these periods also correspond to times when spouses’ names were not reported. We therefore limit our sample appropriately so that individual analyses do not span any of these discrete changes. We therefore focus on three distinct periods: the first spans from 1780 to 1798, coinciding largely with the Dutch East India Company era. The second period, from 1803 to 1811, encompasses the transition from the Batavian Republic to British rule when major legislative changes were introduced, including the cessation of the slave trade. The third period, from 1812 to 1829, covers a phase of stable British rule. Our choice of periods also ensures, to the extent possible, the use of data within common district boundaries for each episode.
The advantage of an annual panel is the flexibility to vary transition lengths. We start by calculating three types of year-transitions: one-year, five-year, and ten-year transitions. One-year transitions are by nature associated with low mobility since a household’s movement up or down the income ladder is likely to be less significant over one compared to ten years. This exercise illustrates that panel data with an annual frequency is well-suited to analyze more precisely the time it takes for households to achieve upward mobility. In subsequent estimation, we utilize five-year transitions, requiring a match to an observation at least five years earlier in the panel. This entails that more than half of all observations are consistently used to estimate mobility, a rarity in the historical mobility literature (Ward Reference Ward2023). Furthermore, as discussed in online Appendix A, patterns in 5-year transitions are robustly estimated, regardless of whether we reweight for the propensity of being matched across waves, or whether we truncate households that have low propensity scores of being matched.
Table B1 in the online appendix presents descriptive statistics for each period and district, including all families that appear in the tax records, regardless of whether they are linked or not. In both the Stellenbosch and Graaff-Reinet districts the majority of households report positive incomes, indicating the large contribution of agricultural activity to the economy. However, there are notable differences in income sources and trends between the two districts. Stellenbosch gradually diversifies beyond agriculture, with an increasing proportion of households reporting zero agricultural incomes over time. As documented by Fourie and Von Fintel (Reference Fourie and Von Fintel2011), many households report zeroes on agricultural assets, because they are involved in other sectors of the economy. The increase in zero incomes suggests a transition to alternative sources of income beyond traditional farming activities. On the other hand, Graaff-Reinet shows a rise in positive incomes from animal holdings, indicating the importance of livestock-related activities in the district.
In Stellenbosch, there is a significant increase in incomes across various percentiles of the distribution after 1800, indicating overall economic growth and prosperity. However, it is important to note that these aggregate statistics do not capture changes in individual rankings and relative income mobility. In Graaff-Reinet, the distributional aggregates remain relatively stagnant over time, with incomes starting at lower levels compared to Stellenbosch. Although there is a modest increase in incomes derived from crops and alcohol in Graaff-Reinet, the overall income dynamics in the district are less pronounced than in Stellenbosch.
These descriptive statistics already demonstrates the dynamic nature of economic mobility over time, highlighting how income mobility can differ significantly between districts and across periods marked by political and administrative transitions. In the next sections, we test how robust these results are to changes in sampling and methodological approaches.
Baseline results
Our baseline analysis excludes households with zero incomes. Zero-income households are not necessarily independent households. The officials who administered the censuses often included adult children (older than 16 years) who were still living with their parents as separate observations. Additionally, some of these households were involved in nonagricultural production, which is not recorded in the opgaafrollen, so that our data falsely reflects zero incomes for these households. To avoid artificially inflating persistence, we remove these zero-income households from the analysis. Below we offer additional robustness tests to examine how this approach affects our results.
Panel (a) of Figure 2 starts by comparing mobility estimates for one-year, five-year, and ten-year transitions using pooled data from 1780 to 1829 in Stellenbosch. Estimates are weighted by inverse propensity scores of being matched and the sample truncated to observations with propensity scores above 0.3. As expected, mobility is lower when measured over one-year transitions, with a persistence elasticity of 0.918, compared to five-year (0.774) and ten-year (0.418) transitions. Table 3 shows these estimates, but also presents them for Graaff-Reinet where similar reductions in persistence occur depending on the transition period. The table also shows that weighting and trimming by propensity scores does not change conclusions significantly.
Transition plots by various transition lengths, by historical period and by district.
Notes: Estimates are weighted and trimmed using inverse propensity weights that were generated from columns (2) and (5) in Table A1. Only observations with propensity scores above 0.3 are included. The first row in panel (a) presents 1, 5, and 10 year transitions for Stellenbosch, pooled over the entire period covered by the data. Panel (b) shows only five-year transitions for Stellenbosch, but differentiated by period of analysis. Panel (c) shows 5 year transitions for Graaff-Reinet.

Examining multiple transition years also allows us to observe mobility differences across the income distribution. The one-year transition plot shows almost symmetric results across rows, indicating that those at the top and bottom of the distribution are equally likely (or unlikely) to experience very short-term mobility. However, as we move to longer transition periods, the plots become less symmetric, with those at the top of the distribution exhibiting more persistence than those at the bottom. This pattern can only be observed with the benefit of an annual panel over an extended period of time.
A further benefit of a very long panel dataset is that it is possible to measure mobility in different periods that correspond to changing political regimes and economic contexts. We compare 5-year transitions in Figure 2(b) for Stellenbosch, an established district at the core of agricultural activity at the time. Mobility is low at the end of the 18th century in Stellenbosch – incomes are highly persistent with an elasticity of 0.796. Mobility increases in the second period, with the elasticity declining to 0.478. In the third period, mobility decreases again, although not to the same level as in the first period, with a persistence elasticity of 0.603. The first plot in panel (b), corresponding to Stellenbosch from 1780 to 1790, shows a white horizontal line at the top, indicating that households at the bottom of the income distribution remained trapped in the lowest quintile five years later. Some upward mobility is observed for those starting in the middle of the distribution, as well as limited downward mobility for those starting at the top. In contrast, the second and third plots for later periods show that upward social mobility is more likely for those at the bottom of the distribution, and both upward and downward mobility are spread across the distribution. During the third period (1812–1829), greater persistence returns, with those at the very bottom of the distribution being less likely to move up the rankings. Interestingly, those at the top of the distribution also show more persistent outcomes compared to the previous periods. The main takeaway from the baseline results is that calculating income mobility over different periods we find higher persistence in shorter intervals and more mobility at the upper income levels over longer periods.
An important question is whether these elasticities are indeed high and whether Cape settler income was persistent. Comparisons are complicated by two factors: first, most estimates measure inter- rather than intragenerational mobility, and secondly, our unit of analysis is the family farm rather than the individual incomes or occupations followed in most studies (Ward Reference Ward2023). Nonetheless, we conclude that our estimates of Cape persistence seem high compared to a range of studies. They are higher than twentieth-century intragenerational persistence estimates ranging from 0.3 to 0.6 (Chetty et al. Reference Chetty, Hendren, Kline and Saez2014). They are also substantially higher than those of the four countries analyzed by Fields et al. (Reference Fields, Cichello, Freije, Menéndez and Newhouse2003) in the 1990s, of which South Africa’s estimate of 0.44 over 5 transition years was the most persistent. They also seem high compared to the historical intergenerational estimates by Long and Ferrie (Reference Long and Ferrie2013). They instead seem akin to the high historical intergenerational estimates of Clark and Cummins (Reference Clark and Cummins2014) who, using surname matches, find much higher intergenerational elasticities of between 0.7 and 0.9 for England over the last 800 years.
Sadly, there are few direct historical comparisons of intragenerational income mobility. Ward (Reference Ward2023), using occupations for the United States, is an exception. He reports the fraction of fathers with the same occupation across two US censuses between 1840 and 1910, ranging from 0.58 in 1850 to 0.51 in 1910. Although these numbers are not directly comparable, they suggest a less mobile society not too dissimilar from what we find in our ten-year transitions.
Adding another district
To examine regional variation in mobility estimates, we compare the Stellenbosch and Graaff-Reinet districts. These two regions had notable differences, of which property rights was the most important (Swanepoel and Fourie Reference Swanepoel and Fourie2018). Stellenbosch farms, established in 1679, were smaller in size and predominantly owned by settlers in freehold. In contrast, Graaff-Reinet farms were larger loan farms, mainly dedicated to livestock production. The district was formally established in 1786 and experienced significant geographic mobility in the first two decades as settlers moved to and from the frontier. Factors such as conflicts with the Khoesan and later the amaXhosa, as well as dissatisfaction with VOC colonial rule, contributed to this mobility. Although the announcement of an independent Republic of Graaff-Reinet in 1795 was short-lived due to British intervention, the frontier only stabilized after the second British takeover in 1806. We anticipate a high degree of social mobility in Graaff-Reinet initially, followed by a decline after the turn of the century.
Figure 2(b) and (c) compare the transition probability plots for Stellenbosch and Graaff-Reinet over the three periods. The results support our hypothesis of a significant distinction between the two regions, but only in the first period. Social mobility is low in Stellenbosch, indicated by the white horizontal lines at the top, while Graaff-Reinet exhibits high social mobility. The almost vertical color bars demonstrate that even households lower down the income distribution in the origin year have a significant chance of reaching the top of the income distribution five years later.
The situation changes dramatically in both regions in the second and third periods after the British take-over. Social mobility in Stellenbosch increases, while mobility in Graaff-Reinet declines. In fact, during the second and third periods, social mobility in Stellenbosch (with persistence elasticities of 0.478 and 0.603) surpasses that of Graaff-Reinet (0.730 and 0.645).
This unexpected finding helps us reinterpret the impact of British annexation. First, British arrival in 1795, followed by three years of Batavian rule, contributed to a period of high mobility in Stellenbosch. By contrast, British rule had little impact on increasing mobility on the frontier. An alternative interpretation is that the higher mobility estimates reflect not an actual increase in mobility, but rather greater measurement error as new officials visited farms or some antagonism towards the British contributed to higher variation in reporting quality. However, considering the results for Graaff-Reinet, where greater antagonism would be expected, this alternative seems unlikely. Second, by the turn of the century, the frontier had closed, and new arrivals to the frontier had similar or even poorer prospects compared to the inhabitants of the more established regions near Cape Town. Third, despite some convergence in mobility estimates, these rankings persisted well into the nineteenth century, with Graaff-Reinet remaining a place of relatively high persistence. This persistence in mobility rankings may explain why, by the early 1830s, groups of frontier farmers began moving further into the South African interior in search of better opportunities. The limited prospects for upward mobility in Graaff-Reinet likely contributed to this outward migration. The comparison of mobility between the Stellenbosch and Graaff-Reinet districts illustrates significant regional differences and shifting patterns over time, highlighting just how important data availability is in shaping our interpretation of historical events on income mobility.
Robustness Checks
Adding zeros
One potential explanation for the reversal of social mobility estimates between Stellenbosch and Graaff-Reinet is that our results may be influenced by excluding zero-income and zero-asset households. As noted before, young men aged sixteen were recorded as separate households in these censuses, even if they were still living with their parents and did not report separate assets. If there were relatively more of these men on the frontier compared to the interior or specific time periods, it could distort our mobility estimates. To retain zero incomes in the regression samples, they are transformed by the inverse hyperbolic sine transformation instead of the log transformation (Bellemare and Wichman Reference Bellemare and Wichman2020).
The second row of Figure C1 in the online appendix includes zero-income households for both Stellenbosch and Graaff-Reinet to examine the impact. The inclusion of zeros increases the sample size by 23,873 observations in Stellenbosch and 4,263 observations in Graaff-Reinet. Table B1 in the online appendix provides information on the proportion of households reporting no assets or income, ranging from 5% to 30% depending on the period. However, reintroducing the zeroes does not significantly alter our overall observations about household mobility.
The incorporation of zeros leads to a small decrease in persistence elasticities in Stellenbosch. This minor shift could be attributed to young men who initially reported no assets but quickly accumulated their own belongings and incomes as they established separate households from their parents. However, despite this adjustment, the ranking of the two districts remains the same: households in Stellenbosch exhibit slightly less mobility than those in Graaff-Reinet over the entire period.
Removing capital goods
The relatively high persistence we calculate for the Cape Colony may be influenced by the inclusion of returns on capital goods, which are likely to be more persistent across time than income from other streams. As we show in Table 3 and Figure C2 in the online appendix, we find this to be true for Stellenbosch but not for Graaff-Reinet. In Stellenbosch, the income persistence elasticity is 0.774. However, when excluding income from capital goods, specifically the 6% interest earned on the value of horses and slave holdings, the persistence elasticity falls to 0.703. Conversely, for Graaff-Reinet, where incomes are primarily derived from other stock variables such as cattle holdings (contributing around 40% of income), the exclusion of capital goods increases the persistence elasticity.
Disaggregating by type of household
We further analyze the sample by splitting it into households with or without a wife present. It is expected that married households exhibit lower mobility, while single male-headed households, typically starting with limited resources, may experience faster upward mobility. This division also indirectly captures age differences, as more established families are likely to have lower mobility. Household composition and marriage patterns have played a formative role in determining patterns of social mobility at the Cape, particularly for single men (Dooling Reference Dooling2005; von Fintel et al. Reference Von Fintel, Du Plessis and Jansen2013). Specifically, Roman Dutch inheritance laws favored widows, with sizeable proportions of deceased estates allocated to them. This created significant opportunity for single men to achieve rapid social mobility by marrying wealthy widows.
Our hypothesis is supported in the frontier district of Graaff-Reinet. Single households in Graaff-Reinet demonstrate high income mobility, with an elasticity of 0.583. Married households, on the other hand, exhibit greater persistence, with an elasticity of 0.625. Surprisingly, the opposite pattern is observed for households in Stellenbosch. Figure C3 in the online appendix illustrates that income mobility is higher in Stellenbosch when a wife is present compared to households without a wife. One possible explanation for this anomaly is that young men who were less likely to establish separate farming operations from their fathers were also less likely to marry. Marriage and upward mobility may be closely linked. Additionally, we observe a significant “underclass” of single men with minimal mobility in both the first and last periods. Those seeking better opportunities and facing limited prospects in Stellenbosch may have migrated to the frontier, where single men had greater chances of upward mobility. While we cannot directly match households across districts, this presents a promising avenue for future research.
Another factor to consider is that our matching algorithm may partly contribute to the low mobility observed among single men. As mentioned earlier, our match rates are lowest for single men who subsequently marry. This means we are more likely to select single men who remain single in our sample and underestimate the mobility of single men who marry and likely experience upward mobility. The selective matching process may result in lower estimates of social mobility for single men than what they actually experience. Future improvements to our matching algorithm, including enhancing match rates for single men and matching across districts, will help clarify the unexpectedly high mobility observed among married households compared to single, male-headed households.
Disaggregating by type of production
We return to our baseline estimates and examine mobility by differentiating between types of production. We categorize them as crop production (wheat, barley, rye, and oats), stock farming (cattle and sheep), and viticulture (wine and brandy). We anticipate higher volatility in the first production type, given the requirement to sow every year and the higher likelihood that returns could be affected by extreme weather. Since most farmers did not specialize in a single type of production, individual households may contribute to all three mobility estimates. Figure C4 in the online appendix presents the results, where we study all families, but limit analyses to incomes associated only with the respective sources.
We find, surprisingly, the lowest income mobility in crop production (with an elasticity of 0.707 in Stellenbosch, as shown in Table 3). This is surprising because crop yields – outputs minus inputs – are dependent on many external factors beyond the farmers’ control, including climate shocks. Earlier research has also shown that crop production was most likely to be correlated with ship arrivals in Table Bay (Boshoff and Fourie Reference Boshoff and Fourie2010). Table B1 confirms that around 90% of households in both districts earned no incomes from crops. This emphasizes the unpredictable nature of cultivation and the low rates of engagement in this economic activity.
Stock farming (cattle and sheep) has a lower income persistence elasticity than crop farming. Mobility is highest for viticulture. Again, this is somewhat surprising; many more idiosyncratic factors potentially affect the ownership of cattle and sheep – theft and wild animals, for example – than planting vines. One possible explanation for the high-income persistence of wine and brandy is the low units of account used in reporting wine and brandy output (leaguers, approximately 500 liters), increasing the volatility. This demonstrates yet again the types of measurement error that might contribute to overestimating the extent of mobility in a settler society.
Conclusions
Measuring social mobility accurately, today and in the past, is necessary for a full understanding of the distributional effects of growth. Historical social mobility estimates – notably those before the twentieth century – have relied almost entirely on occupational classifications found in censuses. Individuals are linked across censuses ten years apart, often at low rates. The measurement error of occupations, and the low matching rates, can potentially bias mobility upwards (Bailey et al. Reference Bailey, Cole, Henderson and Massey2020).
One way to overcome some of these biases, Ward (Reference Ward2023) shows, is by using an average of multiple observations for the same individual to proxy for their permanent status. Almost all early intergenerational studies use only one observation for the father and one for the son. A single observation may, however, be a noisy signal of an individual’s permanent income, especially if social status is measured when individuals are young and only starting out or old and retiring, rather than in prime age. Such measurement error is likely to increase variation in the incomes of both fathers and sons, variation that will likely decrease persistence elasticities and overstate mobility. Improving measurement, as we have done in this paper, is likely to lower mobility estimates, and reflect more precisely the true persistence of the society.
Estimates of historical intergenerational mobility often still rely on occupational classifications. For the reasons detailed above, this remains a problematic measure. Our use of income, despite its own limitations as detailed above, requires no assumptions about the exact ranking of occupations. Constructing an annual panel allows us to study the life course of a household within a generation, and without the need to link households intergenerationally, where fathers and sons are observed at different ages and eras.
We find high levels of persistence for settler households at the Cape. Although Otto Mentzel visited the Cape about half a century before the time period that our analysis covers, his observation of a highly stratified settler society seems accurate, in particular the existence of a highly persistent colonial elite. Yet our results also question several stylized facts. We find high levels of mobility in the early years of the Cape’s Eastern Frontier, but persistence soon set in after British arrival. This contrasts with the more settled regions close to Cape Town where British arrival was associated with greater social mobility, perhaps because of the demise of VOC networks of power and privilege. More work is needed to disentangle who benefited, and why, from this tumultuous period.
The detailed information contained in the tax censuses allows us to test data choices, which is what we believe to be the main contribution of our paper. Exploring income mobility over different periods, our results reveal higher persistence in shorter intervals and more mobility at the upper income levels over longer periods. Further analyses test assumptions around zero-income households, the impact of slave ownership, household head marital status, and type of agricultural production on mobility, indicating high persistence across different conditions and challenging previous understandings of mobility determinants in preindustrial societies.
This is important considering the limitations of current studies that depend largely on US census data, which is only available for every ten years. Our results confirm that using better linkage methods (Bailey et al. Reference Bailey, Cole, Henderson and Massey2020; Ghosh et al. Reference Ghosh, Il Myoung Hwang and Squires2024) or matching census data to additional sources (Bailey et al. Reference Bailey, Lin, Mohammed, Mohnen, Murray, Zhang and Prettyman2023; Buckles et al. Reference Buckles, Haws, Price and Wilbert2023) would strengthen the reliability of existing estimates – or perhaps expose inaccuracies. We show that the choice of samples and methods significantly influences the interpretation of historical income mobility. Of course, our results also have limitations too. Another concern Ward (Reference Ward2023) raises is that mobility studies often exclude marginalized groups in society. Most of the intergenerational estimates produced for the United States exclude African Americans. When these subgroups are included, mobility falls further; African Americans, given the various discriminatory laws of the time, were less likely to experience upward mobility, even for those who were geographically mobile (Derenoncourt Reference Derenoncourt2022). Our estimates, sadly, suffer from the same bias; the Khoesan, to a large degree, and the enslaved are excluded from our analysis. There is no doubt that some Khoesan and manumitted slaves are included in the tax censuses we use, but this is the exception rather than the rule. Our results are therefore likely to be a lower-bound estimate of persistence in the Cape Colony.
There are several extensions that we hope to pursue in future work. We are busy transcribing the tax censuses further back in time; extending the series to the mid-seventeenth century will tell us whether VOC rule was generally characterized by high persistence or whether there was initial mobility that gradually settled into a stratified colony. We would also benefit from adding more Cape districts, and to link households across districts. A third extension would be to add more accurate (and volatile) regional market prices to our calculation of incomes. A final extension is to link the tax censuses intergenerationally. This is possible by linking the tax records to genealogical records, which would provide a more reliable way of matching individuals across generations. All these attempts are likely to reduce measurement error. Given what we have shown in this study, that is likely to further increase our estimates of income persistence. Owing to better data and methods, the Cape – and other settler societies in all likelihood – were far less mobile than previous estimates of social mobility that economic historians have proposed.
Supplementary material
The supplementary material for this article can be found at https://doi.org/10.1017/ssh.2024.24
Acknowledgements
The authors would like to thank Hoyt Bleakley, Rulof Burger, Jeanne Cilliers, Bill Collins, James Fenske, Joseph Ferrie, Igor Martins, Anne McCants, Paul Rhode, Robert Ross, Marianne Wanamaker, Zach Ward, Yiling Zhao, the editors Kris Inwood and Rebecca Jean Emigh, and seminar participants at the University of Michigan, Peking University, University of Southern Denmark, Stellenbosch University, the EHDR seminar and the EHS conference for helpful comments on an earlier version. The authors would like to acknowledge financial support from the Riksbankens Jubileumsfond (Cape of Good Hope Panel project: M20-0041)), the Andrew W. Mellon Foundation (Biography of an Uncharted People project) and South Africa’s National Research Foundation. For more information about the project, visit www.capepanel.org.


 Open access