


Introduction
The European Maritime and Fisheries Fund (EMFF; EU, 2014), with a budget of 6.4 billion euro in the period 2014–2020, is the main financial instrument to reach the goals of the European Union’s (EU’s) Common Fisheries Policy (CFP). In addition to promote sustainable fisheries, an important part of the EMFF is to stimulate growth in aquaculture and fish processing. In total, 20% of the EMFF funds are allocated to the aquaculture sector and 18% of the funds are distributed to marketing and processing of fish products (EU, 2020). A significant part of these funds is in form of investment support to firms. The aim of the investment support is to stimulate firms to invest in efficient and sustainable production processes, which in the long-run increases production and competitiveness of aquaculture and fish processing in the EU. Examples of supported investments are workboats, fish pumps, mussel rafts, feeding systems, freezer equipment, vacuum packing machines, and other production facilities and equipment that increase firms’ production capacity and productivity.
However, firm support does not necessarily generate more investments since firms have incentives to make profitable investment also without support (e.g. Brandsma, Kancs, and Ciaian, Reference Brandsma, Kancs and Ciaian2013). Therefore, there is a risk that the support will fund investments that would have been undertaken anyway. This effect is often referred to in the literature as the ‘deadweight loss’ (DWL) of the investment support (e.g. Lenihan, Reference Lenihan2004).Footnote 1 Studies of firm investment support in other sectors, such as the Common Agricultural Policy (CAP), have shown that the DWL can be substantial and in some cases close to 100% (Michalek, Ciaian, and Kancs, Reference Michalek, Ciaian and Kancs2016), see Dvouletý and Blažková (Reference Dvouletý and Blažková2019) for a comprehensive review of studies evaluating CAP support. In such cases, firms use public support to substitute for private investments and the policy may not stimulate new investments to the extent anticipated by policy makers. Thus, a positive effect of support schemes on firm investments is a pre-requisite for promoting productivity and profitability in the sector. To what extent investment support to firms in aquaculture and fish processing generates new investments is unclear as there, to the best of our knowledge, exists no empirical studies of firm-level data for these sectors. On the other hand, there exists a large literature on fisheries subsidies, which have been identified as a driving force for the buildup of excessive fishing capacity that may threaten sustainability of marine resources around the world (e.g. Clark, Munro, and Sumaila, Reference Clark, Munro and Sumaila.2005; Munro and Sumaila, Reference Munro and Sumaila2002; Sumaila et al., Reference Sumaila, Lam, Manach, Swartz and Pauly2016). Consequently, the EMFF regulation (EU, 2014; article 11) prohibits the use of support measures that increase fishing capacity and building of new fishing vessels.Footnote 2 EMFF investment support to fisheries instead focuses on, for example, innovation and collaboration with researchers, diversification of incomes, investments in selective gears and other measures to reduce unwanted catches (EU, 2014). Thus, the types of investments supported by the EMFF are very different in the aquaculture and fish processing sectors compared to fisheries. The current study analyzes the effects of investment support aimed at increasing production capacity and productivity, which implies that the focus is solely on the aquaculture and fish processing sectors.
In doing so, the paper analyzes the effects of investment support to Swedish firms in aquaculture and fish processing. The main purpose is to investigate to what extent the support has increased firm investments, and by doing so quantify the DWL. However, the paper also investigates if the investment support impacts the economic performance of the supported firms, where economic outcomes are measured by production value and value added. The empirical analysis is based on panel data including all firms in these sectors in Sweden over the period 2007–2015. The availability of panel data makes it possible to apply a fixed effects (FE) panel data approach that can address the problem of confounding firm-specific factors inherent in program evaluation studies. In other words, the methodology makes it possible to control for unobserved firm characteristics that influence investment activity and, at the same time, may be correlated with the propensity to apply for support.
The results show that the investment support has increased investments in both sectors, although DWL exists. In aquaculture, the EU support increased investments with a factor of 0.65, thus with a DWL of 0.35. This implies that if a supported firm makes 100,000 euro of investment, 65,000 euro may be regarded as newly generated investments and 35,000 would have been undertaken also without the support. The corresponding number for the support to fish processing is an effect of 0.23, thus a DWL of 0.77. However, for fish processing, the analysis finds substantial differences depending on the size of the firms. For firms with less than 20 employees, the results show that the EU support increased investments with a factor of 0.64, thus with a DWL of 0.36. Interestingly, this is very similar to the results in the aquaculture sector in which all supported firms may be regarded as small firms (SF). For fish processing firms larger than 20 employees, the study finds a small positive effect of 0.17, but the effect is not statistically significant. The discrepancy between small and large firms is in line with previous studies of the CAP support to agriculture showing heterogeneous effect of investment support depending on farm size (e.g. Nilsson, Reference Nilsson2017; Ratinger, Medonos, and Hruska, Reference Ratinger, Medonos and Hruska2013).
Since the support seems to increases firm investments, at least for SF, it is interesting to analyze whether the support also impacts firm’s economic performance. Results from FE panel data regressions show that the investment support in aquaculture increases economic performance measured by production value and value added. No significant effects are found for the investment support in fish processing irrespective of firm size.
The rest of the paper is organized as follows. Section 2 gives a short background on the EU investment support to firms in aquaculture and fish processing as well as a discussion about previous literature. Sections 3 and 4 describe the data and methodology, respectively. Section 5 presents the results, and a discussion is provided in section 6. Concluding remarks are given in section 7.
Background and Motivation of the Study
The EU support measures to aquaculture and fish processing are distributed through the European Maritime and Fisheries Fund (EMFF) in 2014–2020 and its precursor the European Fisheries Fund (EFF; EU, 2006) in the years 2007–2013. The public financing of granted investments in the EFF ranges from 20 to 40% of the total investment. Investments aiming at positive environmental effects are eligible to up to 40% public funding of the total investment amount. Other investments not considered to have a positive environmental impact are eligible to a maximum of 30% public funding (Government Offices of Sweden, 2013). In the EMFF, 30–50% of the total investment in aquaculture is supported depending on the size of the firm (large firms have lower support; Board of Agriculture, 2021a) and for investments in fish processing 50% is supported (Board of Agriculture, 2021b). Due to data limitations, the EFF will be in focus in this paper, but since the purpose and regulations are similar to those of the EMFF the analysis is relevant also for the EMFF. While aquaculture firms can apply for investments in fish processing and vice versa, it turns out that firms in aquaculture/fish processing almost exclusively receive funding from their respective support category (more details in the Data section).
The EFF had a total budget of 4.3 billion euro for the period 2007–2013 (European Commission, 2017). The time period for EFF was extended to 2015 due to the delay of the EMFF implementation and the availability of funds after 2013. Out of the total EFF budget, around 12% was committed to aquaculture and 17% to fish processing (European Commission, 2017).Footnote 3 The majority of these funds were granted to firms with the objective to stimulate investments in construction and modernization of existing production units and building of new units.
The ex-post evaluation of the EFF concluded that the funds allocated to the aquaculture and fish processing sectors contributed to new investments and increased production capacity in the EU (European Commission, 2017). The evaluation was mainly theory-based using intervention logics about how the EFF funds were intended to achieve the objectives. This approach was complemented with data on sector-aggregated indicators, as well as information from interviews and surveys in different member states. A similar approach was used in the half-time evaluation of the Swedish EFF program (Ramböll, 2013). Since aggregated measures of production growth and value added per employee in Swedish aquaculture and fish processing had not increased sufficiently over time, the conclusion was that the investment support did not achieve the objectives. More specifically, the objective for the aquaculture sector was an increase in production and value added per employee of 8% between 2006 and 2015, while the objective for fish processing was an increase of 12%. As these measures varied between −20 and +1%, the objectives were not reached (Ramböll, 2013). Guillen et al. (Reference Guillen, Asche, Carvalho, Fernández Polanco, Llorente, Nielsen, Nielsen and Villasante2019) provide a comprehensive overview of the allocation of EU support to the aquaculture sector in all EU countries over the period 2000–2014. During this period, aggregate EU production volume decreased with around 8% despite 1.17 billion euro in aquaculture support. Thus, while aquaculture production grows rapidly in many parts of the world (e.g. Garlock et al., Reference Garlock, Asche, Anderson, Bjørndal, Kumar, Lorenzen, Ropicki, Smith and Tveterås2020), EU aquaculture production has not taken off. Possible explanations for this development are strict environmental regulations and high administrative burden (e.g. Guillen et al., Reference Guillen, Asche, Carvalho, Fernández Polanco, Llorente, Nielsen, Nielsen and Villasante2019 and the references therein). However, none of the studies discussed above analyzed the effects of the investment support using firm-level data. The question of to what extent firm subsidies stimulate productive investments and the underlying arguments in support of such policies have received growing attention in the wider economics literature. This is especially the case in agriculture where a growing body of studies use firm-level data to estimate the effects of support on farm performance (e.g. Michalek, Ciaian, and Kancs, Reference Michalek, Ciaian and Kancs2014; Nilsson, Reference Nilsson2017; Pufahl and Weiss, Reference Pufahl and Weiss2009). The results from these studies are mixed. The effects of support on farm investments and other economic outcomes range from zero or even negative to significant positive depending on time period, region, and the type of support (Dvouletý and Blažková, Reference Dvouletý and Blažková2019; Michalek, Ciaian, and Kancs, Reference Michalek, Ciaian and Kancs2016; Rizov, Pokrivcak, and Ciaian, Reference Rizov, Pokrivcak and Ciaian2013). Interestingly, studies separating between small and large farms tend to find a larger positive effect for small farms (e.g. Nilsson, Reference Nilsson2017; Ratinger, Medonos, and Hruska, Reference Ratinger, Medonos and Hruska2013). One possible explanation for this finding is that SF to a larger extent face credit constraints and thus find it more difficult to carry out profitable investments without public support. If SF are credit constrained because of market failures (e.g. limited knowledge of financiers), public investment support has potential to stimulate investments and growth in the sector (e.g. Brandsma, Kancs, and Ciaian, Reference Brandsma, Kancs and Ciaian2013). Another argument put forward in favor of public investment support to firms is that the social return to investments is higher than the private return due to technology transfers and diffusion of innovations (e.g. Bergström, Reference Bergström2000; De Long and Summers, Reference De Long and Summers1991; Guellec and Pottelsberghe, Reference Guellec and Pottelsberghe2003).
When it comes to the effects of EU investment support to firms in aquaculture and fish processing there exists, to the best of our knowledge, no previous empirical studies analyzing support data at the firm level. This is somewhat surprising given the importance of these sectors in achieving the objectives of the CFP. This study provides some initial evidence on the effects of the EFF investment support to Swedish firms in aquaculture and fish processing. Between 2007 and 2015, a total of 147 and 190 investment projects received EFF funding in aquaculture and fish processing, respectively (see more in the data section below). These numbers are very small compared to the total EFF program in the EU, which granted a total of 8130 and 5192 projects in aquaculture and fish processing, respectively (European Commission, 2017).
The small number of supported projects in Sweden reflects the small-scale nature of the Swedish aquaculture and fish processing sectors (e.g. Guillen et al., Reference Guillen, Asche, Carvalho, Fernández Polanco, Llorente, Nielsen, Nielsen and Villasante2019). In 2014, there were only 6 aquaculture firms with more than 10 employees and the majority of firms had less than 6 employees (STECF, 2016). The fish processing sector is somewhat larger with 8 companies with more than 50 employees in 2014, and 28 companies having 11–49 employees (STECF, 2017). In 2018, the production value in Swedish aquaculture and fish processing was around 60 and 600 million euro, respectively, which constitute around 0.012 and 0.12% of national GDP (Swedish Agency for Marine and Water Management, 2020). Rainbow trout is the most important species in aquaculture production in Sweden, which constitutes around 80% of the total production value (Statistics Sweden, 2018). Other important species include Arctic char and eel. Swedish aquaculture is in a nascent stage, but many actors see great potential to expand production throughout the country, which has over 2000 km of coastline and almost 100,000 lakes (Swedish Agency for Marine and Water Management, 2020). As mentioned above, the Swedish fish processing sector is very heterogeneous with small family businesses processing their own landings as well as large firms with large-scale industrial production. On the aggregate level, the sector is heavily dependent on imported raw material as approximately 90% of the raw material is imported (STECF, 2019). While being small sectors in a European context, the Swedish EFF program provides an interesting case study because of the availability of detailed data. As will be discussed in the next sections, information about investment support is linked to firm-level data on investment activity facilitating a panel data analysis.
Data
The data for the analysis come from two sources. First, information about investment supports from the EFF to Swedish firms was obtained from the Swedish Board of Agriculture for the period 2007–2015.Footnote 4 The data include the date of disbursement of the support, the type of support (aquaculture or fish processing), and the total amount of the supported investment. The total investment amount is also specified into two parts: public and private financing. Second, firm-level data were obtained from Statistics Sweden on a yearly basis for the same time period (2007–2015) and contain detailed information about economic performance including investment activity, production value, and value added (value of production minus production costs). The information from Statistics Sweden was merged with data on investment support to obtain a panel data set of all supported and non-supported Swedish firms in the aquaculture and fish processing sectors.
During the period 2007–2015, a total of 149 and 191 investment projects were supported in aquaculture and fish processing, respectively. In total, 68.5 million Swedish crowns (SEK) of public funding was paid out to aquaculture investments and the corresponding number for fish processing was 124.3 million Swedish crowns (one euro is approximately 10 Swedish crowns). When matched to the firm-level data, two investment projects in aquaculture and one project in fish processing could not be linked by firm identity numbers. Table 1 shows some descriptive statistics of the total number of firms receiving support and average public funding per firm for the period 2007–2015. As can be seen from the table, the number of supports payments sums to 147 in aquaculture and 190 in fish processing. However, it is common that the same firm receives several supports during the period and hence the number of unique firms is lower; 65 in aquaculture and 123 in fish processing. This implies that the average number of supports received per firm is 2.3 and 1.5 in aquaculture and fish processing, respectively. The five most common investments supported in aquaculture were as follows: 1) mussel rafts, 2) workboats, 3) fish pumps, 4) new fish ponds, and 5) feeding systems. Common investments supported in fish processing include 1) pin bone removers, 2) fridge and freezer equipment, 3) investments in smokehouses, 4) vacuum packing machines, and 5) reconstruction and modernization of premises.
Number of supported firms and public support (EFF) per firm 2007–2015
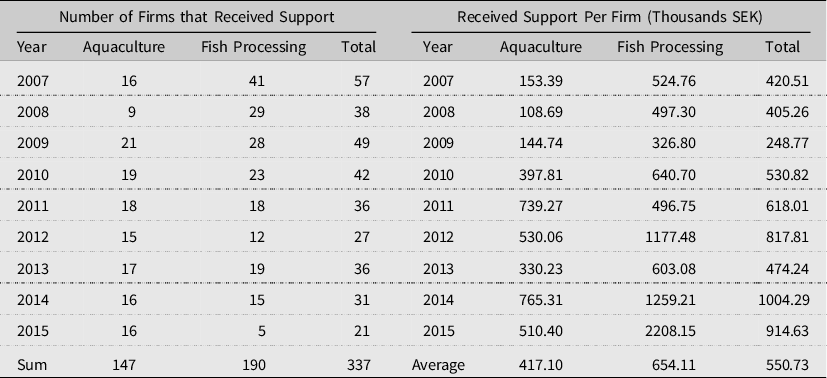
Notes: Number of firms receiving support and the average support per firm for the period 2007–2015. SEK is shorthand for Swedish crowns (1 euro ∼ 10 Swedish crowns).
Turning to the firm-level data, the first step is to investigate which types of firms receive support using the International Standard Industrial Classification (ISIC) codes. Not surprisingly, firms in the aquaculture sector (ISIC code #032) receive the vast majority of the aquaculture funds (80% are firms classified as aquaculture). When it comes to the fish processing support, there is a more diverse set of sectors receiving funds. Around 50% of the firms are classified as fish processing firms according to the ISIC codes (code #102). Other sectors receiving support include marine fisheries (17%), fish wholesale (14%), freshwater fisheries (6%), fish retail (4%), and aquaculture (2%). Thus, it turns out that very few aquaculture firms receive support for investments in fish processing. Similarly, only two processing firms have received aquaculture support. In the following, the focus is on firms with ISIC codes in aquaculture (for the aquaculture support) and fish processing (for the processing support), which leaves us with 257 firms in aquaculture of which 48 received investment support during the period. In fish processing, there are 281 firms in total of which 53 received support.
Table 2 gives an overview of the supported firms’ total investment activity in relation to the investment support. Column 2 of the table shows total EFF (public) funding of investments, column 3 shows total investments undertaken via the EFF (public funding + private funding), and column 4 shows total firm investments (investments undertaken via the EFF + all other investments at the firm). The numbers are expressed in millions of Swedish crowns (MSEK) and cover the period 2007–2015. Column 5 of the table shows the share of total firm investments undertaken via the EFF. As can be seen in column 5, investment projects funded via the EFF constitute a significant part of the total investment activity in the supported firms. This is especially the case in aquaculture where more than 50% of total firm investments are projects carried out within the EFF. For supported firms in fish processing, the EFF-funded investments constitute 36% of total firm investments.
EFF investment support and total investments of supported firms, 2007–2015
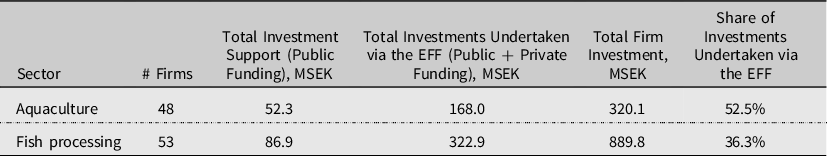
Notes: Columns 1 and 2 show investment support paid out from the EFF. These data were obtained from the Swedish Board of Agriculture. Column 3 shows total gross investments, and these data were obtained from Statistics Sweden.
One explanation of the difference between the two sectors is the size distribution of firms. The Swedish aquaculture sector predominantly consists of SF and only one of the supported firms had more than 10 employees in 2007. The fish processing sector, on the other hand, consists of firms between 0 and 500 employees and approximately 70% of the funds is received by firms with more than 20 employees. In large firms, investments funded by the EFF tend to make up a relatively small share of total firm investments. For example, in fish processing firms with less than 10 employees, the share of total investments undertaken via the EFF is 49%, which is similar to the aquaculture sector. Although EFF investment projects constitute a significant part of the investment activity in SF in particular, it is not certain that they generate more investments than would be the case if no support was available. This is the topic of the next two sections.
Methods
The purpose of this paper is to study the effect of the investment support on firms’ investment activity. As is well known in the policy evaluation literature, unobserved confounding factors at the firm level and non-random assignment of support make it challenging to estimate effects of policy interventions (e.g. Imbens and Wooldridge, Reference Imbens and Wooldridge2009). If both pre- and post-intervention data are available for all firms in a sector, as in our case, a FE panel data implementation of the difference-in-difference (DID) estimator can be used to deal with potential bias arising from unobserved time-constant factors at the firm level (e.g. Angrist and Pischke, Reference Angrist and Pischke2009). The FE estimates the effect of the support on investment activity by comparing the change over time in investments for the supported firms, compared to the change over time for a control group of firms. By analyzing firm-level changes over time, the FE approach removes biases that could arise from permanent differences between firms, as well as biases from comparisons over time that may be due to overall trends affecting all firms, such as business cycle fluctuations.
The first step in the analysis is to define a variable measuring the investment support. In this paper, this variable is defined as total investments undertaken via the EFF (public + private funding). This is the most natural definition given that the aim is to analyze to what extent EFF investment projects stimulate total firm investments.Footnote
5
According to the managing authority (Board of Agriculture, 2018), it normally takes 1–2 years from the application date to the date of disbursement of a granted investment project. This time lag includes both an initial assessment as well as documentation after the investment project has been carried out. It is also quite common that a granted investment amount is paid out to firms over more than 1 year. This implies that there is likely to be a time lag between the actual investment date and the date of disbursement of funds from EFF. Since our data for the investment support are based on the date of distribution of funds, we define the variable measuring investment support as a 3-year average, that is $S_{it}={\sum _{p\,=\,0}^{2}s_{it+p} \over 3}$
, where s
it + p
is the EFF investments by firm i in year t + p. The outcome variable of interest is gross investments, Inv
it
, for firm i in year t. The baseline FE estimator can then be defined as,
$S_{it}={\sum _{p\,=\,0}^{2}s_{it+p} \over 3}$
, where s
it + p
is the EFF investments by firm i in year t + p. The outcome variable of interest is gross investments, Inv
it
, for firm i in year t. The baseline FE estimator can then be defined as,
 $${\rm In}{\rm v}_{it}=\alpha _{i}+\gamma _{t}+\beta ^{{\rm FE}}S_{it}+\epsilon _{it},$$
where α i is firm FE and γ t time specific effects controlling for general time trends affecting all firms. The β FE coefficient shows to what extent the investment support increases investment activity for the receiving firms. The DWL is defined as 1 − β FE and is equal to 1 in case the investment support generates no new investments. On the other hand, if firms increase their investments proportional to the EFF investment project, β FE = 1, and there is no DWL. A value larger than 0 but smaller than 1 indicates that the support increase firm investments but not one-to-one. The error term, ϵ it , is assumed to be a mean zero stationary variable and we follow the suggestion by Bertrand, Duflo, and Mullainathan (Reference Bertrand, Duflo and Mullainathan2004) and use Arellano (Reference Arellano1987) clustered covariance matrix estimator, which allows for both serial correlation and heteroscedasticity in the errors.Footnote 6 The FE regression is estimated separately for firms in aquaculture (ISIC code #032) and firms in fish processing (ISIC code #102). In addition, as discussed above, evidence from studies in other sectors shows that investment support primarily has an effect on SF. To investigate this issue, the β FE coefficient is estimated separately for small (≤20 employees in 2007) and large (>20 employees in 2007) firms by interacting S it with a dichotomous dummy variable D i taking a value of one for large firms. Thus, the regression equation becomes,
 $${\rm In}{\rm v}_{it}=\alpha _{i}+\gamma _{t}+\beta _{1}^{{\rm FE}}S_{it}+\beta _{2}^{{\rm FE}}D_{i}S_{it}+\epsilon _{it},$$
Similar to above, DWL is calculated as 1 − β 1 FE for SF and 1 − (β 1 FE+β 2 FE) for large firms.
It may be noted that the FE approach in (1) and (2) can be implemented with other outcome variables to analyze the effects on economic outcomes. For example, to investigate whether the investment support increases a receiving firm’s value added, Inv it may be replaced by VA it , where VA it is the firm’s value of production minus production costs. In this case, the β FE coefficients show the effects of investment support on firm economic performance. We return to this in the next section.
Results
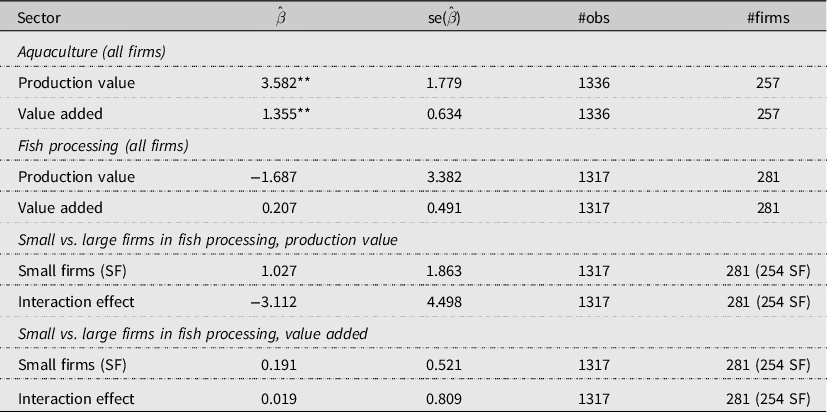
This section presents the empirical results from estimating equations (1) and (2). As mentioned above, the effects of the investment support are estimated separately for aquaculture and fish processing. The top panel of Table 3 shows the results of β FE from equation (1) including all firms, and the DWL is calculated as 1 − β FE. To statistically test whether the DWL is larger than zero, a one-sided t-test of the hypothesis H 0: βˆ FE < 1 is performed (column 3 in Table 3). A rejection of this null hypothesis indicates a statistically significant DWL. The lower panel of the table shows the results from equation (2) where we allow the effect of the investment support to differ between small and large firms in the fish processing sector.Footnote 7
Fixed effects estimation results

* Indicates significance at P < 0.1.
** Indicates significance at P < 0.05.
*** Indicates significance at P < 0.01.
Notes: SF is shorthand for “Small Firms”.
As can be seen in the top panel of the table, the firm support has a significant positive effect on investment activity in the aquaculture sector. More specifically, the support increases investments with a factor of 0.65. This implies that an EFF investment project of 100,000 euro increases firm investment with approximately 65,000 euro. Thus, there is a DWL of about 35,000 euro which is statistically significant at the 10% level, but not at the 5% level. Looking at the results for fish processing firms, β FE is positive but it is not statistically significant from zero. Thus, the effect of the support is much smaller than in aquaculture and the DWL is close to one and statistically significant.
The lower panel of Table 3 shows the results when the effect is allowed to differ between small and large firms in the fish processing sector. In total, 259 SF and 22 large firms are included in the regression. Interestingly, there is a striking difference between the two groups of firms. The β 1 FE estimate for SF is 0.64 and highly significant, which is in line with the results in aquaculture. The interaction effect shows to what extent the effect differs for large firms compared to the baseline (SF). As can be seen, the interaction effect is negative but statistically insignificant. However, an F-test of the restriction β 1 FE + β 2 FE = 0 cannot be rejected at any conventional significance level (p-value = 0.66), indicating that the investment support has no significant effect on investments in large fish processing firms. The estimated DWL for large firms is 0.83 (1–0.17) and an F-test of the restriction β 1 FE + β 2 FE = 1 is firmly rejected (p-value = 0.03) suggesting that the DWL is statistically significant.
As discussed in section 4 above, the FE approach can be used to analyze the effects of investment support on economic outcomes. Since Table 3 indicates that the support increases firm investments, at least for SF, it is interesting to analyze whether the support also affect firm’s economic performance. In the firm-level data obtained from Statistics Sweden, production value and value added are available on a yearly basis. To investigate if the investment support has an effect on receiving firms’ production value and value added, equations (1) and (2) are estimated with Inv it replaced by these variables. As before, the regression is estimated separately for aquaculture and fish processing.
The top two panels of Table 4 show the results of β FE from equation (1) for all firms in aquaculture and fish processing. For aquaculture, the investment support has a positive and statistically significant effect on both production value and value added. These results indicate that investments undertaken via the EFF indeed have a positive effect on economic outcomes. More specifically, Table 4 suggests that an EFF investment project of 100,000 euro increases firm production value and value added with approximately 360,000 and 135,000 euro, respectively. Looking at the results for fish processing (all firms), the estimated coefficients are not statistically significant and this holds true for both production value and value added. This result is not surprising given the finding in Table 3, which suggests that the support has no significant effect on investment activity in the receiving processing firms.
Fixed effects estimation results; production value and value added
*Indicates significance at P < 0.1.
** Indicates significance at P < 0.05.
***Indicates significance at P < 0.01.
Notes: SF is shorthand for “Small Firms”.
The lower panels of Table 4 show the results from equation (2), where the effect of the support is allowed to differ between small and large firms in the fish processing sector. From the results in Table 3, it may be expected that the effect is higher for SF. Looking first at the result for production value, the estimated effect for SF is positive and the interaction effect is negative, which is consistent with the results obtained in Table 3. However, none of the estimated coefficients are statistically significant in Table 4, which casts doubt on the existence of a positive effect on production value for SF in fish processing. Similarly, the coefficient for SF in the value added regression is positive but not statistically significant.
To sum up the results, there is evidence of a positive effect of firm investment support on investment activity in the aquaculture sector, although DWL exists. Moreover, the investments undertaken via the EFF have increased production value and value added in the supported firms. For the fish processing sector, there is evidence of a positive effect of support on firm investment, but only for SF. However, we find no statistically significant effects on production value and value added, and this holds for both small and large fish processing firms.
Discussion
The purpose of the EMFF and its precursor the EFF is to support the CFP to reach a set of EU priorities concerning sustainable and competitive fisheries, aquaculture, and processing sectors (EU, 2014). To reach these priorities, it is crucial that the funds are used efficiently. The EMFF regulation actually proposes a Common Monitoring and Evaluation System (CMES; EU, 2014, article 107) with the purpose to assess the efficiency and relevance of EMFF operations, to contribute to better-targeted support for the CFP, and to support a common learning process related to monitoring and evaluation. However, while the CMES provides a framework for common performance indicators, etc. (EU, 2017), the purpose is not to go deeper into suitable methodologies for specific evaluation topics. This may be necessary for answering many of the issues arising within the support system, especially when it comes to firm support. An example is the Swedish investment support for aquaculture where CMES result indicators show considerable progress and the support has been very attractive leading to budget limitations for new projects (Board of Agriculture, 2019). However, it is not clear from aggregate indicators of investments, employment, revenues, etc., to what extent the progress of the sector is a consequence of the EMFF support compared to other factors. So far, the official evaluations of the EU funds have focused on such aggregate indicators complemented with interviews with beneficiaries. The current paper takes an alternative approach by analyzing firm-level data of both supported and non-supported firms. This makes it possible to compare the investment activity of supported firms over time to the development of non-supported firms, which provides a more precise estimation of the effects of firm investment support.
Based on evidence from the agriculture sector (Rizov, Pokrivcak, and Ciaian, Reference Rizov, Pokrivcak and Ciaian2013; Michalek, Ciaian, and Kancs, Reference Michalek, Ciaian and Kancs2016; Dvouletý and Blažková, Reference Dvouletý and Blažková2019), an efficient use of EU investment support is far from obvious. One problem identified by this literature is that support to firm investments may replace investments that would have been undertaken also without the support (so-called DWL). The results from the current study show that the EFF support has increased investment activity in Swedish aquaculture and fish processing firms, but also that there are DWL. While the DWL is relatively small in Swedish aquaculture (about 35% of EFF investments would have taken place also without support), it is considerably larger (about 77%) for the Swedish fish processing sector.
The analysis indicates that this is due to the firm structure, and for small processing firms in Sweden the DWL is similar to what is found in the aquaculture sector (36%), while about 83% for the large processing firms. A possible explanation for this discrepancy, which would be interesting to explore in future research, is that SF may be credit constrained to a higher degree than large firms (e.g. Audretsch and Elston, Reference Audretsch and Elston2002). Indeed, as discussed in Brandsma, Kancs, and Ciaian (Reference Brandsma, Kancs and Ciaian2013), the investment support is expected to increase investments only if the support relaxes firms’ financial constraints. Firms that have easy access to capital and can exploit all investment opportunities also without the support (operating in perfectly competitive markets) are unlikely to change their investment plans because of the support. In recent years, there has been an increasing concentration in the EU fish processing sector and several Swedish processing firms have been acquired by foreign companies from, for example, Norway and China (STECF, 2019). Thus, large processing firms are likely to be more integrated in international food corporations having access to international capital markets. This study provides some initial evidence of DWL of EU-financed investment to firms in the maritime sector. However, the Swedish aquaculture and fish processing sectors are small in the European context (e.g. Guillen et al., Reference Guillen, Asche, Carvalho, Fernández Polanco, Llorente, Nielsen, Nielsen and Villasante2019; STECF, 2019), and further case studies are necessary to complement and confirm the research findings in a wider context. It should also be pointed out that the existence of DWL does not rule out that the support increases investments—only that it is less than fully efficient. It should also be noted that our study estimates DWL in terms of the amount of investments undertaken, which says nothing about what types of investments are supported by the EFF. For example, the EFF may provide support for certain equipment having the best workplace security features. If less secure but slightly cheaper alternatives are available, a firm may opt for such equipment if support is not available. In this case, the DWL may be close to 100%, but the support may still be effective in improving workplace security.
Further, the DWL estimates do not provide information whether the investments promote a sustainable and competitive development of these sectors, only to what extent the support actually add to new investments, which is a pre-requisite for such broader effects. For example, investment support to SF may increase investment activity but still not achieve maximum contribution to the policy objectives for other reasons, such as regulatory issues affecting the growth potential. Such topics need additional analyses. However, our study provides some preliminary evidence of positive effects of the aquaculture investment support on economic outcomes measured by production value and value added. No significant effects are found for the fish processing support. The positive effect on value added in aquaculture is particularly interesting as value added is typically used as a measure of competitiveness (see e.g. Bergström, Reference Bergström2000; Dvouletý and Blažková, Reference Dvouletý and Blažková2019). Increased value added may be a result of, for example, more effective production processes (new equipment, etc.) that reduce operating costs per unit produced, improved internal business organization, and stronger market position. The results of this study therefore provide some preliminary positive evidence for the aquaculture support, which has so far been questioned given the slow growth of the sector at the EU level (Guillen et al., Reference Guillen, Asche, Carvalho, Fernández Polanco, Llorente, Nielsen, Nielsen and Villasante2019). It should, however, be stressed that more studies are needed to confirm these findings in a wider context. It should also be noted that the analysis of economic outcomes focuses on the effects in the receiving firms. It may be the case that the support crowds out economic opportunities for competing, non-supported, firms (e.g. Bronzini and De Blasio, Reference Bronzini and De Blasio2006; Michalek, Ciaian, and Kancs, Reference Michalek, Ciaian and Kancs2016). Such crowding-out effects are likely to be particularly important when the market is small and when firms produce similar products (e.g. farm the same fish species).
Conclusion
Investment support to firms in the aquaculture and fish processing sectors is one of the main policy measures within the European Maritime and Fisheries Fund, and an essential component of the productivity enhancing strategy in the CFP in the EU. Form a policy perspective, a key question is whether the investment support actually stimulates private investment, and if so, to what extent the support affects production and competitiveness. This study focuses on the effects of investment support to Swedish firms in aquaculture and fish processing. The main purpose is to investigate to what extent the support increases firm investments. However, the paper also investigates if the investment support impacts economic performance measured by firms’ production value and value added. The empirical analysis is based on panel data including all firms in these sectors in Sweden over the period 2007–2015. The availability of panel data makes it possible to apply a FE panel data approach that can address the problem of confounding firm-specific factors inherent in program evaluation studies.
The results show that the investment support has increased investments in both sectors, although DWL exist. In aquaculture, the support increases investments with a factor of 0.65, thus with a DWL of 0.35. This implies that if a supported firm makes 100,000 euro of investment, 65,000 euro may be regarded as newly generated investments and 35,000 would have been undertaken also without the support. In fish processing, the analysis finds substantial differences depending on the size of the firms. For firms with less than 20 employees, the results show that the EU support increased investments with a factor of 0.64, thus with a DWL of 0.36. For fish processing firms larger than 20 employees, the study finds no significant effects on investments. Moreover, the results show that the aquaculture support has a positive effect on production value and value added in the supported firms. No such effects are found for the investment support to fish processing firms.
Financial support
This work was supported by the Swedish Board of Agriculture [grant number 3.2.11-07290/2018].
Conflict of interest
None.
Data availability
The data that support the findings of this study are available from Statistics Sweden and the Swedish Board of Agriculture. Restrictions apply to the availability of these firm-level data, which were used under license for this study.


 Open access