


Introduction
Among international organizations, the EU stands out for the scope and intensity of its supranational authority. In exercising this authority, it remains bound by the rule of law – a principle that, among other things, requires that no branch of government stands above the law and that laws are applied consistently. To honour this commitment, EU legal acts are subject to judicial review through actions for annulment, and compliance with EU law is centrally enforced through actions for failure to fulfil obligations, alongside preliminary references. When the Court of Justice of the EU (CJEU) hears these cases, Member States that are not directly involved can express their views by submitting amicus briefs. The frequency of annulment actions, as well as the occurrence and content of amicus interventions, offer insight into how and when Member State governments legally contest supranational authority.
This study explores the extent to which legal contestation by Member States reflects the evolving scope of legislative, executive, and administrative authority exercised by the EU over time. From the perspective of delegation theory, annulment litigation and third-party interventions serve as instruments through which Member States can recalibrate the discretion afforded to EU institutions (Hawkins et al., Reference Hawkins, Lake, Nielson and Tierney2006; Pollack, Reference Pollack2003). Since the Treaty of Maastricht, Member States have become increasingly protective of their sovereignty (Bickerton et al., Reference Bickerton, Hodson and Puetter2015), while European governance has grown more politicized (de Wilde et al., Reference de Wilde, Leupold and Schmidtke2016; Grande and Kriesi, Reference Grande, Kriesi, Hutter, Grande and Kriesi2016). Throughout the process of European integration, ever more authority has nevertheless shifted toward the EU. Yet while the Union’s legislative powers steadily expanded (Hix and Høyland, Reference Hix and Høyland2022, 17–18), recent years saw a more cautious exercise of enforcement and implementation powers by the European Commission (Di Carlo et al., Reference Di Carlo, Eisl and Zurstrassen2024; Kelemen and Pavone, Reference Kelemen and Pavone2023).
We argue that the intensity and direction of Member States’ legal contestation responds to shifts in the EU’s exercises of authority across different domains. Through annulment actions, Member States have increasingly challenged the adoption of European legislative acts and implementation decisions. Litigation against EU legislation has become more salient, though not more polarized, whereas challenges to administrative decisions have grown more polarized but remain relatively low-profile. Member States also reacted to the Commission’s more assertive infringement litigation by intervening more often and with greater unity and opposition. In response, the Commission eventually adopted a more conciliatory enforcement approach.
Focusing on Member States’ litigation activity in direct actions, we complement existing research on European legal mobilization, which primarily examines domestic courts and private litigants (see Conant et al., Reference Conant, Hofmann, Soennecken and Vanhala2018). While preliminary references by private parties contribute to apolitical integration through law (Alter, Reference Alter1998; Pavone, Reference Pavone2022; Schmidt, Reference Schmidt2018; Stone Sweet and Brunell, Reference Stone Sweet and Brunell1998; Weiler, Reference Weiler1994), Member State litigation in direct actions typically aims to contain agency losses stemming from delegated authority (Adam et al., Reference Adam, Bauer, Hartlapp and Mathieu2020). By showing that legal contestation and the Commission’s willingness to pursue infringements before the CJEU are mutually dependent, we also add to compliance research on the Commission’s increasing reluctance to enforce EU law in court (Börzel, Reference Börzel2022; Falkner, Reference Falkner2018; Hofmann, Reference Hofmann2025; Kelemen and Pavone, Reference Kelemen and Pavone2023). Finally, we show how core concepts from politicization research can be adapted to study legal contestation, and suggest that, next to directly responding to authority transfer, legal contestation may be driven by societal “bottom-up pressure” (Bressanelli et al., Reference Bressanelli, Koop and Reh2020, 338).
We begin by outlining our unit of analysis: direct action proceedings involving government parties. Drawing on new intergovernmentalist and postfunctionalist theory, we then develop expectations about how EU authority is contested through different judicial procedures. After presenting our data and methods, we examine the empirical trajectory of legal contestation across EU-level rule-making, implementation, and enforcement, comparing it to the extent of authority the EU exercises in each domain. We conclude with a discussion of implications.
Direct actions with government parties
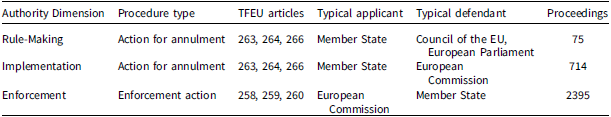
Our unit of analysis are direct action proceedings that involve Member States as applicants or defendants (see Table 1). The sample includes all actions for failure to fulfil obligations (hereafter: enforcement actions) and all government-submitted actions for annulment, jointly accounting for 93% of the relevant litigation (online Appendix A). Enforcement actions are the judicial stage of the infringement procedure by which the Commission enforces EU law. They allow the CommissionFootnote 1 to ask the CJEU to determine that a Member State has failed to comply, and to impose a penalty. The annulment procedure allows Member States to challenge the legality of an EU legal act. Annulment actions can be subdivided into those targeting legislative rules and those against implementation decisions. Each type concerns different issues and actor constellations. By including legislative and implementation annulments as well as enforcement actions, our sample covers the main dimensions of political authority, namely the making, the implementation, and the monitoring and enforcement of binding rules (see de Wilde and Zürn, Reference de Wilde and Zürn2012, 142).
Main direct action procedures with litigant constellations and authority dimensions

Note: Only proceedings with Member State parties are considered. Actions for annulment may also be brought by private actors (so-called non-privileged applicants with direct and individual concern) not included in the sample. See text for details. Source: Own compilation from Eurlex and Curiae.
In the annulment actions in our sample, Member States are the applicants, whereas in enforcement actions they are the defendants. Next to becoming a party, a Member State can also join a proceeding as amicus curiae by submitting an intervention. Interventions provide the CJEU with relevant legal and factual information, and they signal how the penning Member State likes the Court to rule (Dederke and Naurin, Reference Dederke and Naurin2018). According to the Rules of Procedure of the Court of Justice, interventions must explicitly support either one or the other party “in whole or in part” (Art. 129 (1)).Footnote 2 When the Court publishes a ruling, it indicates which interveners, if any, support which party, revealing information on the number of interveners and their positions. We use this data to assess the degree and direction of legal contestation.
Legal contestation and EU authority
We argue that the extent and quality of legal contestation is related to the amount of authority the EU exercises in a given period and domain of European integration. Borrowing from the concept of politicization, we define the dependent variable, legal contestation, in terms of mobilization, salience, and polarization (Grande and Kriesi, Reference Grande, Kriesi, Hutter, Grande and Kriesi2016; Hutter and Kriesi, Reference Hutter and Kriesi2019, 999; Zürn et al., Reference Zürn, Binder and Ecker-Ehrhardt2012). But while politicization research focuses on the behaviour of societal actors in public fora, we study government elites in a relatively secluded judicial setting. In this context, legal mobilization refers to how Member States “use European law to pursue their interests” (Conant et al., Reference Conant, Hofmann, Soennecken and Vanhala2018, 1376). Specifically, we are concerned with the rate at which Member States file annulment actions against European rule-making and implementation over time. While we also examine the rate at which the Commission mobilizes EU law in enforcement actions, this is part of our independent variable as a manifestation of supranational enforcement authority. Salience or “awareness” (Zürn et al., Reference Zürn, Binder and Ecker-Ehrhardt2012, 71) refers to how visible a proceeding is among Member States, and polarization refers to how much they diverge in their positions (de Wilde et al., Reference de Wilde, Leupold and Schmidtke2016, 6–7). Empirically, the more governments intervene, the more salient is the proceeding; and the more they intervene on opposing sides, the more polarized it is.
Beyond describing patterns of legal contestation across time and procedures, we also seek to explain them. The basic idea is that, as the EU gains authority, its decisions concern more sensitive issues and more often contradict the preferences of some Member States, which then leads to contestation before the CJEU. The postulated relation may be caused directly by a backlash against European integration from national governments or indirectly by its societal politicization. The former would be consistent with new intergovernmentalist scholarship, which argues that integration has slowed down with each Treaty reform since Maastricht (effective 1993). Although Member States continue to include more policy areas under the umbrella of EU authority, they have become increasingly protective of their sovereignty and try to limit the exercise of supranational authority (Bickerton et al., Reference Bickerton, Hodson and Puetter2015; Fabbrini and Puetter, Reference Fabbrini and Puetter2016). Along with the alleged turn from pooled and delegated decision-making under the community method to intergovernmental bargaining under the “Union method” (Angela Merkel cited in Puetter, Reference Puetter2014, 29), Member States could also contain integration through legal contestation. This includes mobilizing against supranational acts and intervening in support of each other in supranational enforcement actions.
Further, authority transfer may give rise to legal contestation due to the societal politicization of EU affairs. This would be consistent with postfunctionalist research. EU politics used to be characterized by a “permissive consensus” (Lindberg and Scheingold, Reference Lindberg and Scheingold1970, Chapter 8) when citizens paid scant attention to the goings-on in Brussels – less Luxembourg – and afforded supranational and domestic elites considerable discretion over EU issues. Postfunctionalist scholars argue that since Maastricht, EU decisions increasingly enter the realm of mass politics and have become more salient and contested (Grande and Kriesi, Reference Grande, Kriesi, Hutter, Grande and Kriesi2016, 270; Hooghe and Marks, Reference Hooghe and Marks2009, 21; de Wilde et al., Reference de Wilde, Leupold and Schmidtke2016, 5), especially in areas with overt distributive implications or close to sovereign statehood (Genschel and Jachtenfuchs, Reference Genschel and Jachtenfuchs2016, 49). Societal politicization “is taken up by national representatives and translated again at the EU level” (Saurugger, Reference Saurugger2016, 936), where it exerts “pressure on the level and scope of integration” (Hooghe and Marks, Reference Hooghe and Marks2009, 21). Arguably, this “bottom up pressure” (Bressanelli et al., Reference Bressanelli, Koop and Reh2020, 338) also spills over into the judicial arena, manifesting in legal contestation.
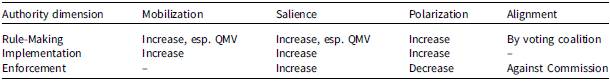
This discussion illustrates two theoretically plausible mechanisms that relate EU authority to legal contestation, but we leave it to future research to compare their empirical purchase. Our independent variable is thus the degree of EU authority, which refers to the right of EU institutions to formulate, implement, and enforce binding rules (de Wilde and Zürn, Reference de Wilde and Zürn2012, 142). We assess the extent of European rule-making, implementation, and enforcement authority in terms of scope (policy areas covered), intensity (degree of supranational decision-making), and territory (membership size) (see Börzel, Reference Börzel2005). Overall, we expect legal contestation to track the exercise of authority at the EU level over time. In the following, we explain this idea in detail and develop separate expectations for each authority domain (Table 2).
Main expectations

Rule-making authority
From humble beginnings as a customs union for coal and steel, the EU matured into an Economic and Monetary Union and “regulatory state” (Majone, Reference Majone1997) with growing redistributive capacities (Caporaso et al., Reference Caporaso, Kim, Durrett and Wesley2015; Schoeller and Weismann, Reference Schoeller, Weismann, Fromage, Héritier and Weismann2025) and the ability to regulate “core state powers” that traditionally were national prerogatives (Genschel and Jachtenfuchs, Reference Genschel and Jachtenfuchs2016). In seven enlargements, the EU spread from six to 28 countries (before Brexit), greatly increasing its heterogeneity and conflict potential. Each Treaty reform moreover pooled additional rule-making authority in the EU Council by subjecting further areas to qualified majority voting (QMV), and delegated more rule-making authority to the Commission and the European Parliament (EP) as agenda-setter and, respectively, veto-player (Börzel, Reference Börzel2005; Hix and Høyland, Reference Hix and Høyland2022, 17–18). In the years following Maastricht, however, the growth in territory and scope, especially in economic and monetary policy, outpaced the growth in intensity, which led some to argue that the EU entered a phase of “integration without supranationalism” (Bickerton et al., Reference Bickerton, Hodson and Puetter2015, 706).
Despite the recent deceleration, the EU continuously accumulated rule-making authority. As the scope of EU rule-making increases, it covers more sensitive and salient issues. As rule-making covers more territory, it must accommodate more diverse preferences. And as rule-making intensifies due to delegation and pooling, it becomes less aligned with the preferences of all Member States. Especially in the post-Lisbon period, characterized by multiple crises and the accession of thirteen new Member States, the EU Council’s long-standing consensus culture came under pressure and negative votes increased (Pircher and Farjam, Reference Pircher and Farjam2021, 480; Plechanovová, Reference Plechanovová2011). The transfer of rule-making authority should lead Member States to disapprove of and contest EU legislation before the CJEU more often. In other words, we expect the judicial mobilization against legislative rules to grow, in particular when the contested act was adopted under QMV. Pending cases become more relevant for and contested between third-party Member States for the same reasons. Thus we expect both the salience and the polarization of direct actions against legislative rules to increase. Substantively, we expect the positions that interveners take to reflect how they voted on the disputed legislation, as political conflict spills over into the judicial arena.
Implementation authority
Originally the Commission was mainly responsible for implementing Treaty provisions in competition law and agriculture. From the early 1990s on, the “Completion of the Internal Market” (European Commission, 1985) and the rise of a regulatory state in its wake extended the formal scope of implementation authority beyond these traditional realms (Joerges, Reference Joerges, Leibfried and Zürn2006; Majone, Reference Majone1997). With the move to QMV, it moreover became “much easier for the Commission to create coalitions among Member States for legislation that would free its hands at the implementation stage” (Bergström et al., Reference Bergström, Farrell and Héritier2007, 347). Anxious to control the Commission’s discretion, Member States extended “comitology,” a network of oversight committees, to several policy areas outside agriculture, where it originated (Falke, Reference Falke, Andenæs and Türk2000, 347). The heterogeneity of Member States after the following enlargements perhaps counteracted the push by QMV toward broader implementation mandates in new secondary legislation. But it also made it more difficult to overrule the Commission in comitology, extending discretion over the implementation of the existing acquis (Junge et al., Reference Junge, König and Luig2015; Tsebelis and Yataganas, Reference Tsebelis and Yataganas2002, 301). Finally, the Commission’s focus of activity shifted over time. Around the turn of the century, agricultural policy reform repatriated some discretion over farm subsidies to the national level (Bulmer et al., Reference Bulmer, Parker, Bache, George and Burns2020, 404; Snyder, Reference Snyder, Jones, Weatherill and Menon2014, 486–487), and the Commission granted “block exemptions” to ever more (non-agricultural) state-aid categories, restoring domestic autonomy also in this area (Blauberger, Reference Blauberger2009; Di Carlo et al., Reference Di Carlo, Eisl and Zurstrassen2024).
Overall, we thus observe a growth of supranational implementation authority that tails off in the early 2000s. We expect legal contestation to mirror this trend. As the scope of EU implementation extends outside its traditional realms, its subject-matter becomes more sensitive and salient. The territorial expansions introduce more diverse preferences that may clash with how the Commission handles implementation. Moreover, secondary law-making by QMV and intergovernmental differences in comitology potentially increase the Commission’s discretion, enabling it to adopt decisions that Member States oppose. We therefore expect the judicial mobilization against implementation decisions to grow, and the salience and polarization of direct actions against implementation to increase accordingly. However, since in agriculture and state aid, traditionally responsible for the bulk of supranational implementation, the Commission has become more restrained since the turn of the century, we expect legal contestation over implementation to grow at a lower rate after the turn of the century.
Enforcement authority
The growth of the EU’s acquis also implies a larger scope of the Commission’s enforcement authority, including over narrowly adopted and controversial policies. Some policy areas came under supranational enforcement later than others. For example, interior policy was fully included only with the Treaty of Amsterdam, and foreign policy remains largely exempt today (Hix and Høyland, Reference Hix and Høyland2022, 17–18). Still, the scope of Commission enforcement has only ever grown and was never formally curtailed. By contrast, its intensity has changed immensely, albeit mostly in practice rather than formal mandate. Ever since the Treaty of Rome, the Commission enjoyed the right to file enforcement actions, but it largely refrained from doing so before the 1980s (see below). In 1993, Maastricht introduced the possibility of a second ruling – after the CJEU has determined a national breach of EU law – that authorizes a penalty. The second procedure was expedited in Lisbon in 2009 (Falkner, Reference Falkner2018). Despite the increase in formal authority, the Commission has in the past decade reverted to a level of restraint similar to the early years (Hofmann, Reference Hofmann2018; Kelemen and Pavone, Reference Kelemen and Pavone2023).
In enforcement proceedings, the roles of the litigants are reversed compared to annulment proceedings. The Member States are on the defendant side, and the Commission is typically the applicant (Table 1). Here, the Commission’s legal mobilization does not reflect contestation but is a manifestation of its enforcement authority, while critical government interventions still signal contestation. We are interested in the relation between enforcement and contestation. Assuming that the Commission and Member States interact strategically, two directions of causality are at play. On the one hand, hard-nosed legal enforcement might provoke stronger contestation. We thus expect Member States to intervene more often and more critically of the Commission the more enforcement cases it launches in a given period. On the other hand, the Commission might respond to contestation and dial back enforcement. The corresponding expectation is that the Commission reduces legal enforcement as Member State interventions become more frequent and critical (and, by implication, less polarized) on average.
Empirical strategy
We examine the plausibility of our expectations using original data on all interventions in all main proceedings with Member State parties decided between 1954 until 2022 and procedural information from the Iuropa project (Brekke et al., Reference Brekke, Fjelstul, Hermansen, Naurin, Lindholm, Naurin, Šadl, Ghavanini, Brekke, Fjelstul, Hermansen, Larsson, Moberg, Näsström, Ovádek, Pavone and Schroeder2023a, Reference Brekke, Fjelstul, Hermansen and Naurin2023b).Footnote 3 To collect the intervener data, we identified all proceedings with Member State parties and scraped the corresponding ruling from the EU’s legal repository EUR-Lex. Missing judgements were added from the CJEU’s archive InfoCuria. Each document includes a section that lists the parties along with the corresponding interveners in a semi-standardized format, which allowed us to programmatically extract the number of interveners supporting each party in each proceeding. We manually verified the resulting information.
Our dependent variables are the extent of legal mobilization, the salience and polarization of each proceeding, and the average intervener disposition. We measure legal mobilization by the number of cases lodged in each year, salience by the number of interventions in each proceeding, and polarization by the share of proceedings in which the interveners support different parties, as well as by a polarization score. In the procedures of interest, each proceeding has two parties, and interveners must support either one or the other. Accordingly, the polarization is lowest when all interventions accrue to one party, and highest when the interventions are evenly split between the parties, that is, when each party’s share is 50%. The polarization score is the normalized absolute difference between this maximum and the applicant’s actual share of interventions, bound by 0 (no polarization) and 100 (maximal polarization). A proceedings’ average intervener disposition is measured by the share of interventions that support the applicant.
Our independent variable is the authority exercised by the EU. For rule-making authority, we mainly consider whether the legislative acts disputed in annulment proceedings have been adopted under QMV and whether litigation happened around major Treaty reforms. For implementation authority, we consider the scope of the Commission’s formal implementation powers and trends in the actual application of this authority, drawing on specialized literature and qualitative information. We also examine how much new Member States contributed to legal mobilization in both kinds of annulment proceedings. For enforcement litigation, finally, we consider the rare extensions of the Commission’s relevant formal powers, and we examine to what extent it pursued infringements before the Court.
To ensure that the time trends in the number of annulment proceedings and interventions do not simply track the number of potential litigants with each enlargement and the proliferation of litigation opportunities with the growing acquis, we control for the number of Member States in each year and for the yearly output of legislative rules and implementation decisions, using the European Union Member States (EUMS) dataset (Fjelstul, Reference Fjelstul2021) and data collected from EUR-Lex using eurlex 0.4.8 for R (Ovádek, Reference Ovádek2021). Annulment actions can only be filed within two months following the adoption of the contested act, according to Article 263 (6) Treaty on the Functioning of the EU (TFEU), so the temporal lag in the relation between our variables is almost constant.
Our distinction between legislative rule-making, implementation, and enforcement decisions is based firstly on the procedure. All actions for failure to fulfil obligations were categorized as enforcement decisions. Second, we considered actions for annulment in which the Commission or an EU agency was on the defending side as litigation against an implementation decision. We considered actions for annulment in which the Council was a defendant as litigation against legislative rule-making, unless the disputed act was adopted on the basis of secondary law. While most implementation decisions are taken by the Commission, the Council may, exceptionally, likewise be entrusted with implementation. This option is enshrined in Article 291 (2) TFEU for implementing acts, but it existed also before the Lisbon Treaty.
Legal contestation across procedures
Our data consists of 3329 unique proceedings decided between 1954 and 2022, including 135 appeals that we dropped so as not to confound the analysis. We also dropped four annulment proceedings that attacked an administrative and a legislative act at the same time, and six cases in which a Member State launched enforcement litigation under Article 259 TFEU. Of the 3184 remaining cases, 2395 are enforcement cases, 714 are annulment actions against implementation, and 75 are annulment actions against legislation. Although enforcement litigation has strongly declined, as discussed later, across the whole time period it is responsible for the bulk of Member State litigation. Few instances of EU legislative rule-making are brought before the Court, but these cases are naturally most salient with 2.05 interventions on average. By contrast, litigation against enforcement and implementation decisions attracts just 0.26 and, respectively, 0.37 interventions on average (Figure 1, left).
National Interventions.
Note: Left: Mean count of government interventions for different kinds of Member State litigation. Right: Distribution of government interventions in legislation annulments. Source: Procedural data from Iuropa (Brekke et al., Reference Brekke, Fjelstul, Hermansen, Naurin, Lindholm, Naurin, Šadl, Ghavanini, Brekke, Fjelstul, Hermansen, Larsson, Moberg, Näsström, Ovádek, Pavone and Schroeder2023a, Reference Brekke, Fjelstul, Hermansen and Naurin2023b), intervention data compiled from Eurlex and Curiae.

The distribution of government interventions is moreover highly skewed towards zero. There are up to twelve interventions in enforcement cases and in annulment cases against implementation, but most of these proceedings (88 and 80 percent, respectively) see no intervention at all. By contrast, Member States intervene in two-thirds of all annulment cases against legislative rule-making, and the Commission routinely intervenes as well. The right-hand panel in Figure 1 shows how government interventions are distributed across the latter proceedings. The different salience of the various procedures reflects the unequal sizes of the affected groups. Legislation applies to all Member States, whereas most infringement proceedings and implementation decisions only affect the parties to the dispute.
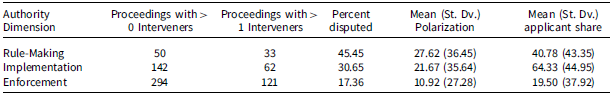
How controversial are the different kinds of proceedings among the intervening governments? Table 3 compares the share of interventions supporting the applicant, polarization scores, and the percentage of disputed cases across procedures. The possible range of polarization stretches from zero to one hundred, and a proceeding is disputed when at least one intervener supports a different party than the other(s). Both measures are only defined for cases with two or more interventions. Overall, the degree of controversy in Member State litigation is moderate. Just above one in six enforcement cases, close to two in six implementation cases, and just under three in six legislative rule-making cases are disputed. On polarization, both types of annulment litigation are closer, accentuating their difference from enforcement litigation.
Government intervener polarization and alignment by procedure

Source: Own compilation from Eurlex and Curiae. Polarization ranges from 0 to 100; see “Empirical Strategy” for details. Interveners refers to government interveners. Applicant share is based on proceedings with at least one percent disputed and polarization is based on proceedings with at least two government interveners.
Moreover, although governments rarely intervene in enforcement cases, they strongly tend to support each other when they do, consistent with the idea that Member States defend their autonomy against supranational intrusions. By contrast, interventions in rule-making and implementation litigation are distributed more evenly between the parties, suggesting that economic and ideological issues, where Member States have more heterogeneous interests, structure the conflict rather than autonomy per se. This supports the finding by Bauer and Hartlapp (Reference Bauer and Hartlapp2010) that many judicial implementation disputes concern issues related to domestic and EU-level subsidies with immediate redistributive consequences. We discuss examples later on. Substantive policy interests seem even more relevant for litigation about legislative rule-making, where almost half of all proceedings are disputed and polarization is highest. Yet in contrast to implementation litigation, the majority of interveners here supports the defendant EU Council (and EP), seeking to uphold the contested legislation. Arguably, the difference in applicant support stems from the fact that most legislation challenged before the CJEU was originally adopted by a qualified majority of Member States, which reemerges in litigation. Most implementation decisions, by contrast, are adopted unilaterally by the Commission. We return to this interpretation below.
Litigation about rule-making: More frequent and salient but not more polarized
We begin our exploration of legal contestation with the EU’s authority to adopt binding legislative rules. EU legislation is subject to increasing legal mobilization in response to the pooling and delegation of authority as new policy areas were subjected to QMV and co-decision, and in response to territorial expansion. The proceedings in this category have moreover gained salience, with more governments intervening over time. However, aside from the principled opposition of some eurosceptic governments, we do not find higher levels of polarization between interveners, indicating that the expansion of QMV rather than growing heterogeneity shapes legal contestation.
Before 1987, when the Single European Act (SEA) entered into force, legal challenges to secondary law were rare. Between the first annulment of secondary law in 1973 and 1986, the CJEU received an annulment action every second year on average, amounting to 0.04 cases per Member State and year. Yet the caseload grew strongly after the SEA had brought several policy areas under QMV, notably the Single Market. Averaged over the years 1986 through 2020, the yearly arrival of new proceedings more than doubled to 0.1 cases per Member State (almost two cases overall). Although the Treaty of Rome already provided for QMV in some policy areas, the informal Luxembourg compromise in practice gave each Member State a veto (Bulmer et al., Reference Bulmer, Parker, Bache, George and Burns2020, 128–129), so governments did not have to resort to litigation to block rule-making. Rather than ordinary legislative matters, the first legal challenges therefore concerned transitional arrangements after EU accessionFootnote 4 or autonomous decisions of the EP on the location of its seat and meetings.Footnote 5
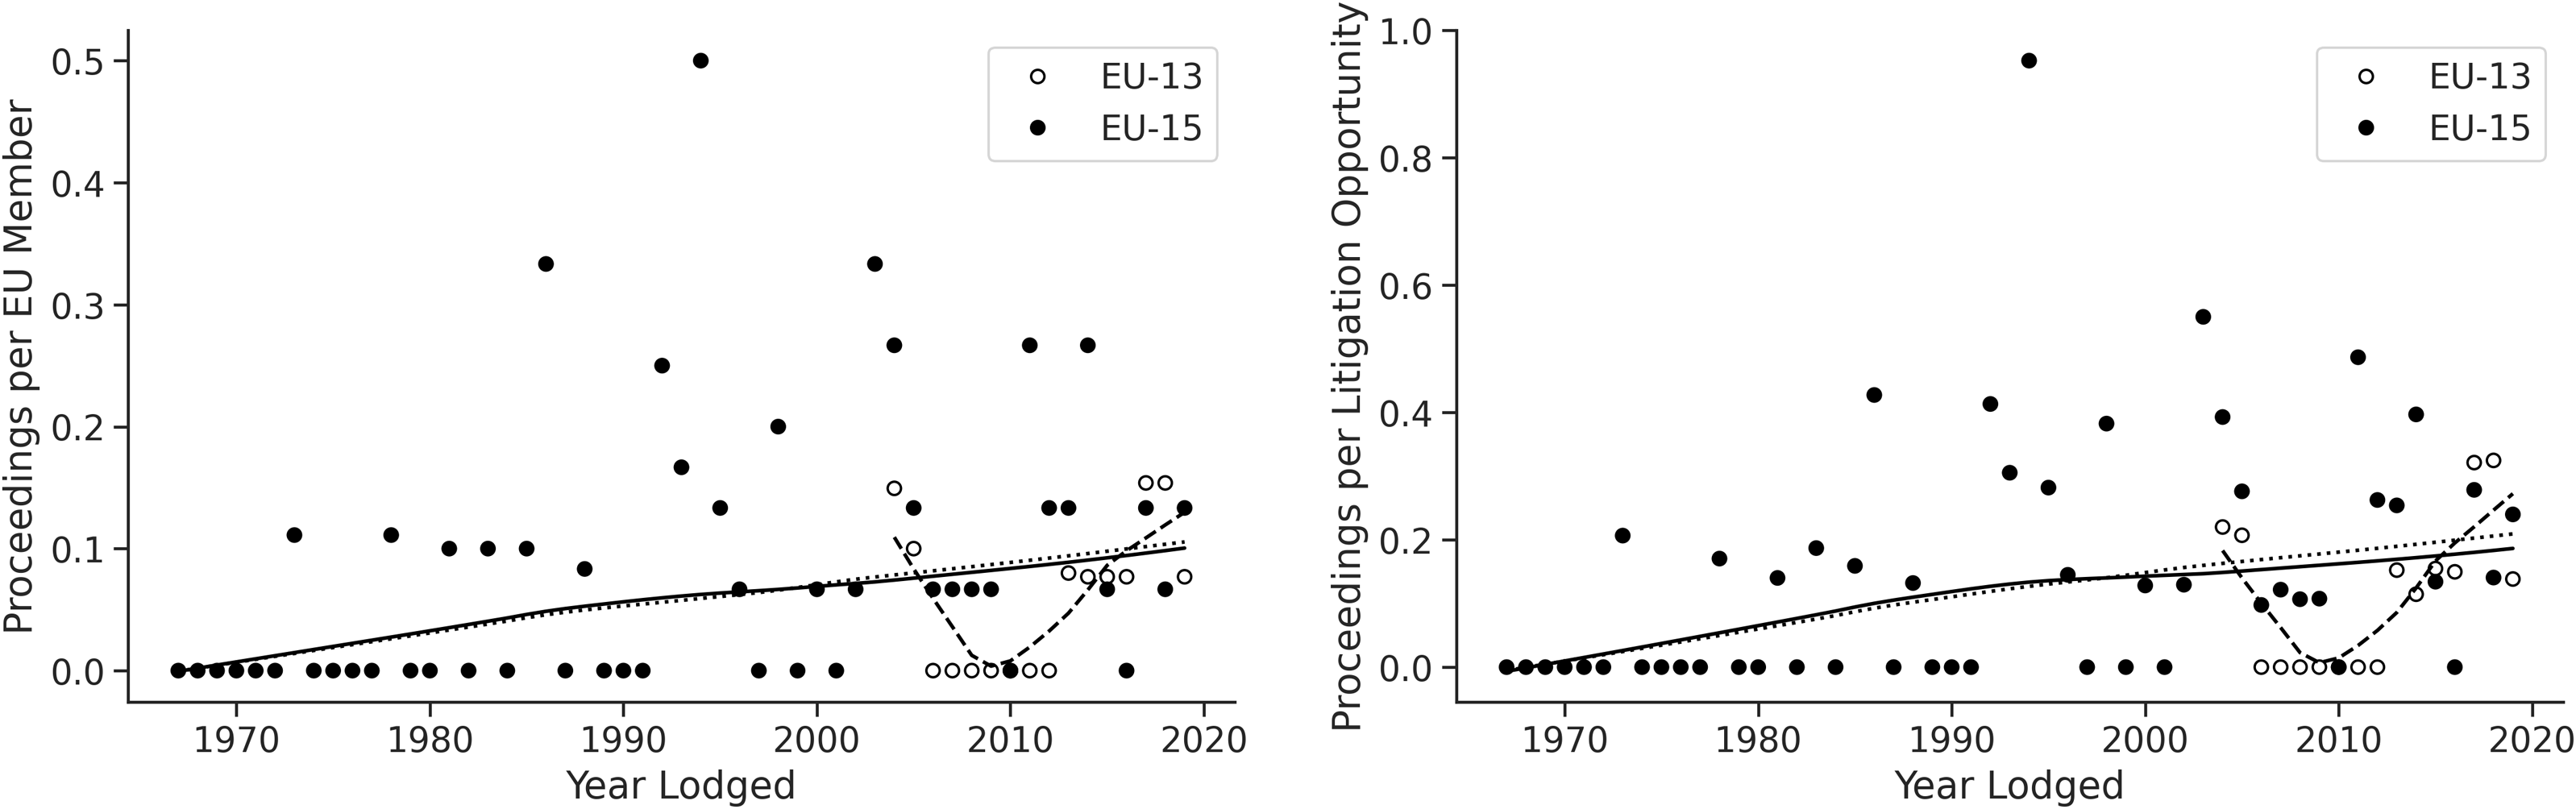
Litigation activity first spiked in 1986 after Member States had signed the SEA, and continued to grow until the Eastern enlargements in the 2000s (Figure 2). Although the Luxembourg compromise was never formally revoked, the SEA “relaxed attitudes […] on voting” (Hayes-Renshaw and Wallace, Reference Hayes-Renshaw and Wallace2006, 270), so that already before its ratification, “some ninety-three decisions are reported as having been taken in the Council by QMV” (ibid., 276). Following this change, the UK brought annulments against two agricultural directives that it had voted against (see Meng, Reference Meng1990, 822), arguing they should have been adopted under Single Market powers, which at the time required unanimity.Footnote 6 The use of QMV in new policy areas sparked litigation also in other areas, such as the adoption of a vocational training programmeFootnote 7 or, following the entry into force of the Treaty of Maastricht, the Working Time Directive.Footnote 8 In both contexts, the UK argued that legislation should have been adopted on the basis of the EU’s residual competence, nowadays Article 352 TFEU, a provision that would have required unanimity in the Council. The Court, however, rejected this argument.
Actions for Annulment against Legislative Acts.
Note: Number of annulment actions against legislative EU acts, stratified by new (EU-13, open circles) and old Member States (EU-15, filled circles), and plotted against the year in which the case was lodged, divided by the number of members in that year and group (left) or by the litigation opportunities and multiplied by one thousand (right), allowing for the exact accession date. A litigation opportunity is defined as the product of the number of members in a given year and group and the legislative acts adopted in that year. The lines represent locally estimated scatterplot regression functions for the new (dashed), old (dotted), and all (solid) Member States, calculated with regplot from Seaborn 0.13.2 for Python (Waskom, Reference Waskom2021). Source: Procedural data from Iuropa (Brekke et al., Reference Brekke, Fjelstul, Hermansen, Naurin, Lindholm, Naurin, Šadl, Ghavanini, Brekke, Fjelstul, Hermansen, Larsson, Moberg, Näsström, Ovádek, Pavone and Schroeder2023a, Reference Brekke, Fjelstul, Hermansen and Naurin2023b), accession data from EUMS (Fjelstul, Reference Fjelstul2021), number of administrative acts from EUR-Lex, collected using eurlex 0.4.8 for R (Ovádek, Reference Ovádek2021). Classification of legal acts: see “Empirical Strategy.”

Another sign that the pooling of rule-making authority drives litigation is the fact that almost no proceeding concerns secondary law adopted under the unanimity rule. Nothing legally prevents governments from pursuing the judicial annulment of an act they supported in the Council,Footnote 9 but they rarely have political incentives to do so.Footnote 10 Yet, as QMV became more widespread, the share of contested acts increased, and more legislative disputes ended up before the CJEU. Consistent with this reasoning, the alignment of litigants sharply mirrors political majorities, with the applicants and their supporting interveners voting against the legally disputed act, and the interveners on the Council’s (and if applicable the EP’s) side in its favour. The VoteWatch dataset (Hix et al., Reference Hix, Frantescu, Hagemann and Noury2022), contains information on how Member States voted on the legislative acts at issue in 15 of our 75 annulment proceedings.Footnote 11 Of the 16 applicants in these cases, twelve voted against the act, two did not participate in the vote under the enhanced cooperation procedure,Footnote 12 one abstained while submitting a critical statement to the record,Footnote 13 and only one voted in favourFootnote 14 . Voting and interventions are only slightly less congruent. Seven out of the eleven interveners on the applicants’ side in this sample voted against the act, three voted in favour, and one abstained. Conversely, all of the 96 interveners that supported the defendant and did not opt out from legislation voted in favour.
The enlargements of the EU by thirteen new Member States between 2004 and 2007 somewhat affected litigation activity too. After 2004, the yearly flow of cases from the old Member States began to plateau (Figure 2, right). The EU-13 at first showed restraint, except for two early Polish submissions on accession conditionsFootnote 15 and on the recognition of qualificationsFootnote 16 . Only recently have the EU-13 become quite litigious. In the most recent three year average, the new Member States lodged more cases than the EU-15/14, as shown by the dashed and dotted lines in Figure 2. Poland alone is responsible for eight of the 13 cases from the new Member States, followed by Hungary with three cases. With the free movement of services, climate and environmental policy, asylum, and the rule of law,Footnote 17 many of these proceedings concern issues that were prominent in the enlargement debates and reflect the growing socio-economic and political heterogeneity in the EU. Overall, the EU-13 seem to repeat the same trajectory that the EU-15 followed before them, only faster.
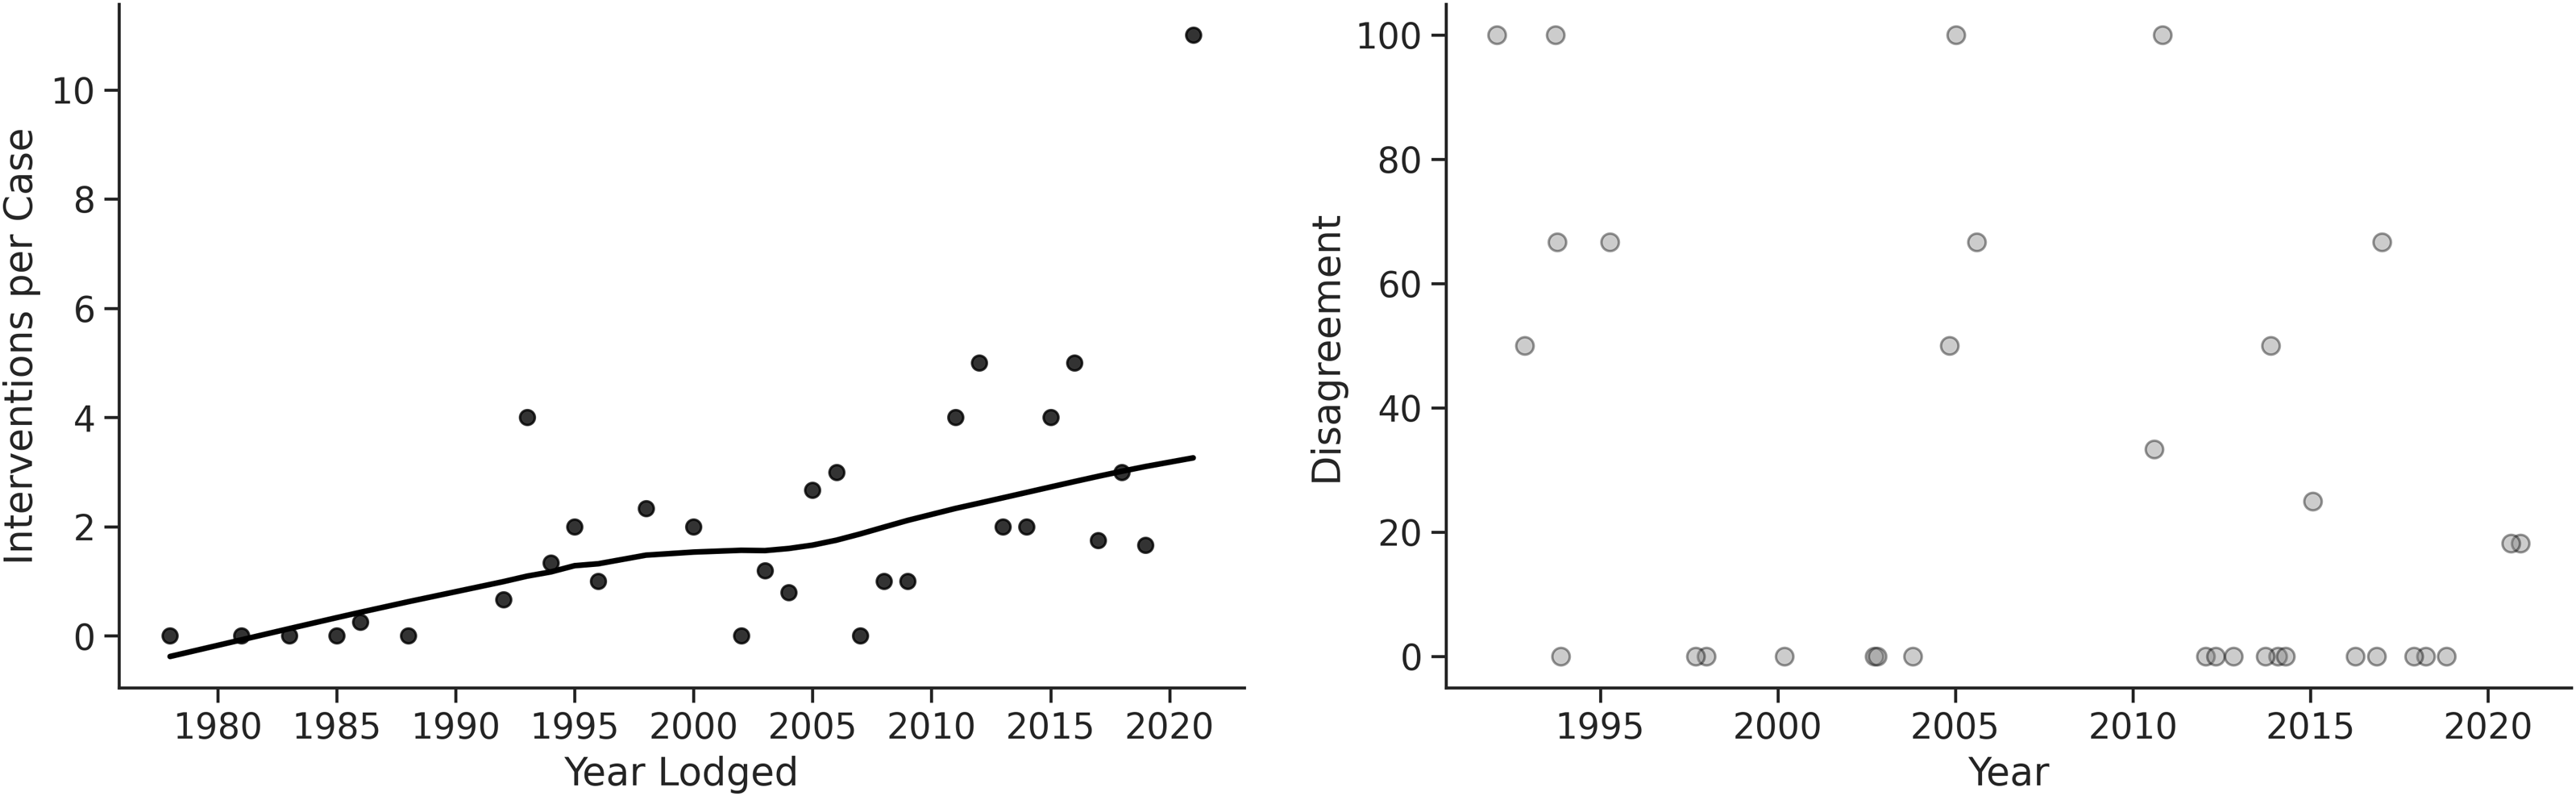
Annulment litigation about secondary law has continuously become more salient (see Figure 3, left). As more decisions were taken by QMV and as the national positions became more heterogeneous, Member States intervened in ongoing proceedings more often. Before the turn of the century, Member States made on average 1.2 submissions per case, and 52 percent of the cases had no intervention; from 2000 through 2021, they made 2.6 submissions on average, and only 23 percent of the cases lacked interventions. The earliest example of a salient case concerned the famous 1993 Banana controversy (Alter and Meunier, Reference Alter and Meunier2006, 367) with nine interventions neatly following the voting coalition.Footnote 18 The most salient disputes, however, are of recent origin and were often launched by EU-13 states, among them two actions against the Conditionality Regulation. The regulation broke new ground in the EU’s response to the rule of law crisis and saw no less than eleven government interventions. While the two applicants, Poland and Hungary, each supported the other’s application, the remaining interveners supported the defendant EU Council and EP.Footnote 19 The high number of interventions in support of the measure suggests that Member States defend politically-brokered compromises also in court.
Salience and Conflict in Actions for Annulment against Legislative Acts.
Note: Left: Number of interventions submitted per annulment action against a legislative act in each year, divided by the number of cases in that year. The line represents a locally estimated scatterplot regression function calculated with regplot from Seaborn 0.13.2 (Waskom, Reference Waskom2021). Note how the most recent outlier makes the trend appear less dramatic. Right: Level of disagreement among the interventions for each case with two or more interveners (see “Empirical Strategy” for details). Cases submitted in the same year are plotted as overlapping circles. Source: Compilation of data from Iuropa (Brekke et al., Reference Brekke, Fjelstul, Hermansen, Naurin, Lindholm, Naurin, Šadl, Ghavanini, Brekke, Fjelstul, Hermansen, Larsson, Moberg, Näsström, Ovádek, Pavone and Schroeder2023a, Reference Brekke, Fjelstul, Hermansen and Naurin2023b), Eurlex, and Curiae.

In contrast to litigation activity and salience, the level of polarization in annulments against EU rule-making did not increase much. As explained earlier, virtually all contested acts are adopted by QMV, and the distribution of interventions mirrors the political alignments in the Council when the acts were adopted. As a result, most interventions support the defendant (Table 3). In 18 of the 33 relevant proceedings with two or more government interventions, shown in the right-hand panel of Figure 3, all interveners supported the same party. The remaining 15 disputed proceedings clustered in the early 1990s after the introduction of QMV, and in the post-enlargement decades, with a period of calm between. In the most recent decade, we again see more undisputed proceedings. Yet the share of contested cases is the same before and after 2004 (45 percent), and the polarization increased only slightly from 41 to 54 percent. Given the increasing heterogeneity among Member States since the Eastern enlargements, we did expect more, but also lasting disagreement since 2004. The reason for the rather stable degree of polarization could be institutional. Since Treaty reforms and enlargements barely changed the size of the majority needed to pass legislation (van Aken, Reference van Aken2012, 21) they did not affect the average share of interventions in favour of each party.
Some policy areas are more prone to polarized litigation than others. Specifically, this holds true for recent litigation in migration law (Bornemann, Reference Bornemann2020, 551). An example of this is the Visegrád states’ opposition to supranational efforts of refugee relocation (Varju et al., Reference Varju, Czina, Cseres and Várnay2024). In the initial annulment case, Slovakia and Hungary, supported by Poland, contested the Council decisions, while a coalition of seven old Member States and the Commission intervened in favour. In the follow-up enforcement cases brought by the Commission against the Czech Republic, Hungary and Poland, all defendant governments intervened in support of each other in their respective proceedings.Footnote 20
All this supports the expectation that more EU rule-making authority leads to more legal mobilization. As for salience and polarization, the results are mixed, since we observe more salient proceedings, but no continuous increase in polarization. Of those cases that were particularly controversial, however, many were submitted by eurosceptic governments, for example in the case of Poland’s and Hungary’s opposition to asylum reform and rule of law safeguards. Finally, which side the interveners take depends largely on how they voted on the contested act during legislation, as expected.
Litigation about implementation: More frequent and polarized, but still obscure
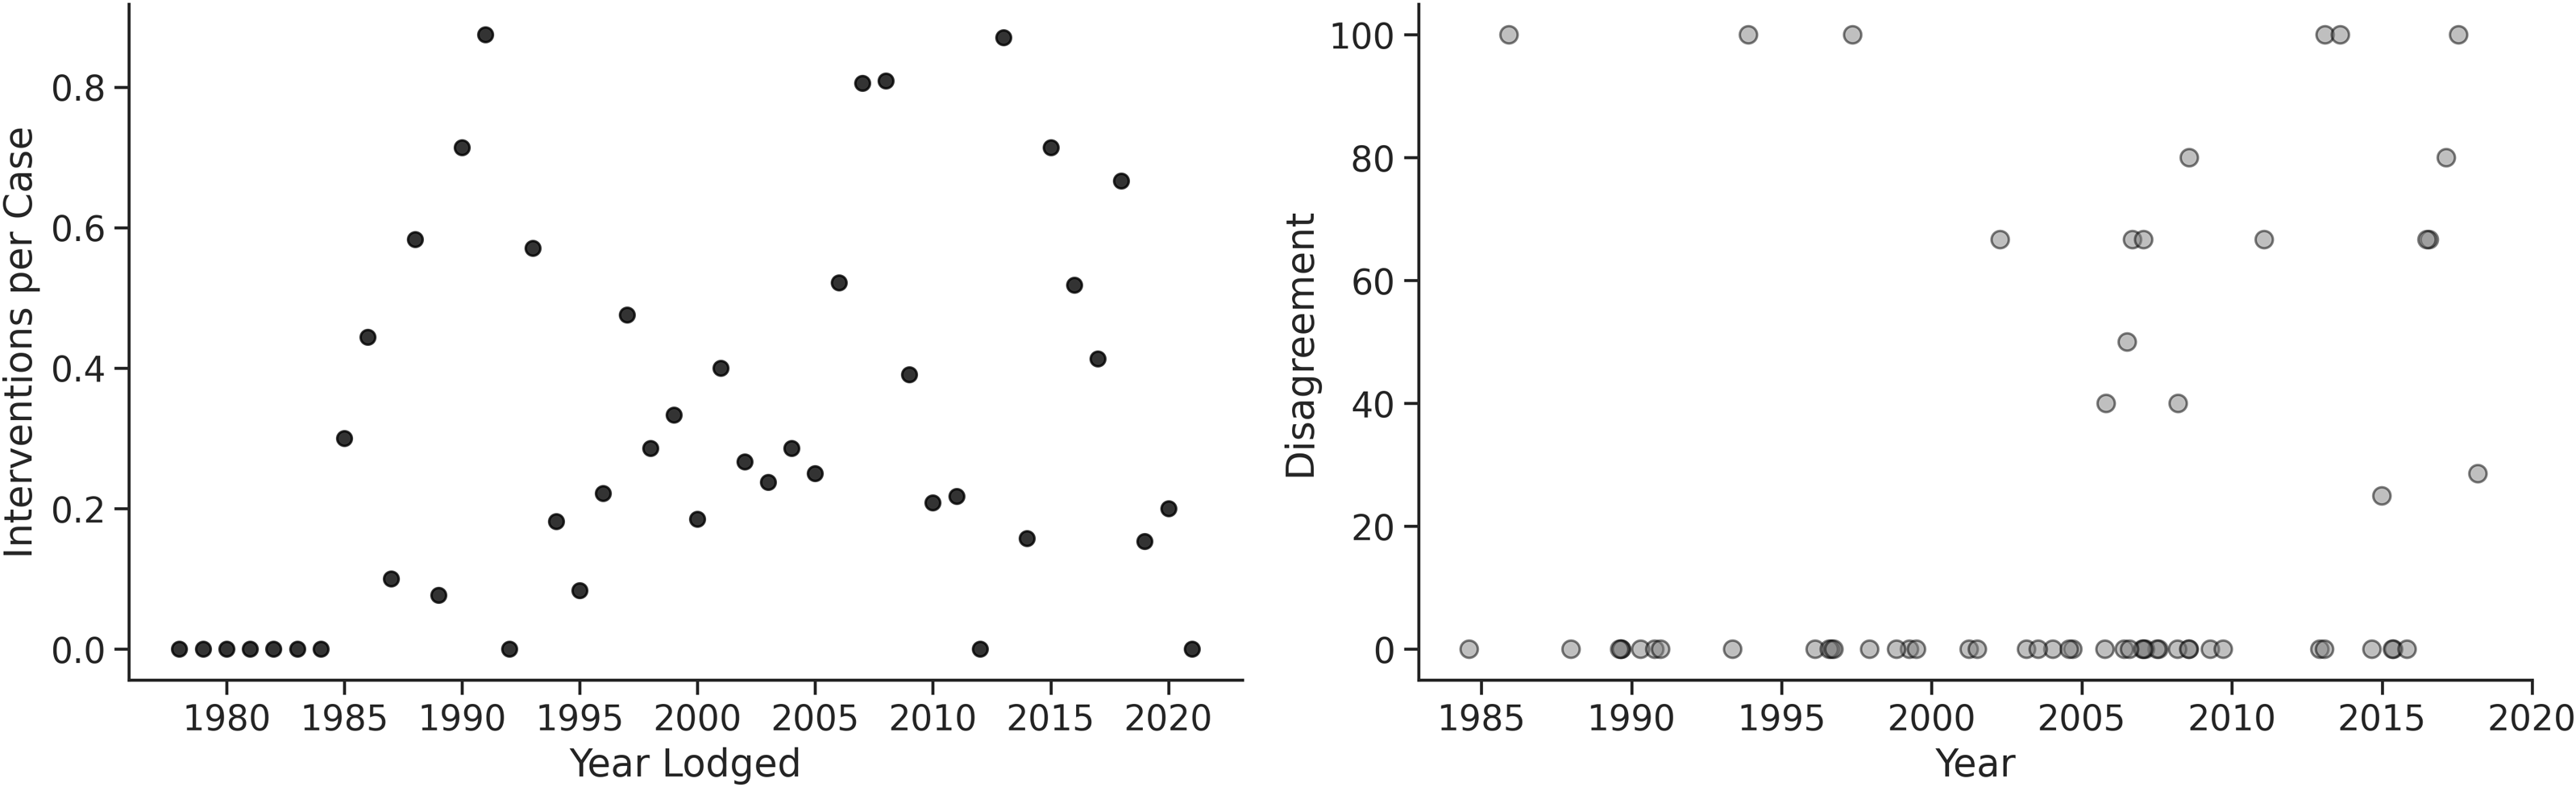
Next to the making of EU legislation, also its implementation has become more legally contested. Mobilization steadily increased until the early 2000s, followed by a slight decline in terms of cases per Member State and a plateau in cases per litigation opportunity (Figure 4). Both rise and decline coincide with enlargement as well as changes in European implementation authority concerning agriculture and state aid, which are responsible for three out of four cases. Regarding enlargement, we first note the burst of proceedings in 1985 that was largely due to a row over fishing quotas in the run-up to the Portuguese and Spanish accessions.Footnote 21 The Eastern enlargement moreover contributed to the plateau since 2004 due to the new Member States’ initial reluctance to file annulment actions, probably a short-lived effect.
Actions for Annulment against Administrative EU Acts.
Note: Number of annulment actions against administrative acts, stratified by new (EU-13, open circles) and old Member States (EU-15, filled circles), and plotted against the year in which the case was lodged, divided by the number of members in that year and group (left) or by the litigation opportunities and multiplied by one thousand (right), allowing for the exact accession date. A litigation opportunity is defined as the product of the number of members in a given year and group and the legislative acts adopted in that year. The lines represent locally estimated scatterplot regression functions for the new (dashed), old (dotted), and all (solid) Member States, calculated with regplot from Seaborn 0.13.2 for Python (Waskom, Reference Waskom2021). Source: Procedural data from Iuropa (Brekke et al., Reference Brekke, Fjelstul, Hermansen, Naurin, Lindholm, Naurin, Šadl, Ghavanini, Brekke, Fjelstul, Hermansen, Larsson, Moberg, Näsström, Ovádek, Pavone and Schroeder2023a, Reference Brekke, Fjelstul, Hermansen and Naurin2023b), accession data from EUMS (Fjelstul, Reference Fjelstul2021), number of administrative acts from EUR-Lex, collected using eurlex 0.4.8 for R (Ovádek, Reference Ovádek2021). Classification of legal acts: see “Empirical Strategy.”

Based on data similar to ours, Bauer and Hartlapp (Reference Bauer and Hartlapp2010, 208) argue that the “increase in the late 1980s and 1990s seems to reflect the power transfer related to the Common Market Programme as established by the Single European Act” as well as “the delegation of further competences under the Maastricht Treaty.” Indeed, as with secondary law annulments, we see litigation spike around major Treaty reforms, in particular the SEA, which not only brought the EU’s Single Market but also its Common Agricultural Policy (CAP) under QMV (Daugbjerg, Reference Daugbjerg1999, 421).
Agriculture and fisheries account for 53 percent of all annulment litigation against administrative acts. Although major changes to CAP only happened in 1992 with the MacSharry reform (Snyder, Reference Snyder, Jones, Weatherill and Menon2014, 486–487), the move to QMV might have freed the Commission’s hand in implementation earlier. Apart from the spike in 1985, CAP litigation increased quite steadily until the late 1990s (online Appendix B). The subsequent decline was arguably caused by decentralization. Responding to long-standing oversupply and budgetary problems, the Agenda 2000 and Fischler reforms in 1999 and 2003 decoupled agricultural aid from output by substituting direct payments for price support. With this came a devolution of implementation authority, as Member States were allowed to distribute EU subsidies between their farmers “as they saw fit” and to “modulate” payments between different CAP pillars (Bulmer et al., Reference Bulmer, Parker, Bache, George and Burns2020, 404).
The second most common subject is state aid, accounting for 21 percent of all litigation against administrative decisions. In contrast to CAP, state-aid control is driven by “negative integration” (Scharpf, Reference Scharpf, Marks, Scharpf, Schmitter and Streeck1996), the direct application of Treaty provisions to remove market barriers independently of Council assent. Art. 107 TFEU prevents Member States from disbursing subsidies that distort competition, and under Art. 108 TFEU the Commission can authorize exceptions from this rule and investigate suspect cases. These instruments have existed since 1957, so the Commission always enjoyed “substantial freedom of manoeuvre” (Cini, Reference Cini2001, 197), and the move to QMV made little difference. Although state aid became “a Commission priority” (Cini, Reference Cini2001, 196) in the 1980s, with a first rise in annulment actions, legislation was adopted only in 1998, not least because the vague Treaty clauses afforded the Commission, holding the monopoly of initiative, more flexibility (Blauberger, Reference Blauberger2009, 732). Helped along by the CJEU (Smith, Reference Smith1998, 66–69), the Commission exercised its authority with increasing resolve. The definition of state aid was broadened to encompass creative evasions, information requirements were extended, Member States were obligated to recover illegally granted aid, and a compliance constituency emerged that bolstered the Commission’s capacity (Aydin, Reference Aydin2014, 144–146; Blauberger, Reference Blauberger2009, 721; Smith, Reference Smith1998, 62–63). Investigations therefore multiplied (online Appendix C; Aydin, Reference Aydin2014, 145), and so did the actions for annulment in their wake, peaking with at leastFootnote 22 11 state-aid cases in the year 2000 (online Appendix B).
Struggling with growing work-load (Blauberger, Reference Blauberger2009, 732; Smith, Reference Smith1998), the Commission began to develop guidelines for permissible aid through soft-law and since the Enabling Regulation 994/1998 and the Procedural Regulation 659/1999, also through hard legislation (Cini, Reference Cini2001, 202). The Procedural Regulation codified the notion that Member States may not grant aid without approval and must recover illegal aid (Blauberger, Reference Blauberger2009, 721). Under the Enabling Regulation, the Commission can exempt entire aid categories from prior approval via block exemptions (Blauberger, Reference Blauberger2009, 732). Both lowered the incentives to litigate by enhancing legal certainty. By deploying block exemptions, the Commission moreover returned the authority to implement state aid for a growing number of goals to Member States. From 2001 onwards, the categories exempted rose dramatically, to the effect that, in 2022, 84 percent of all new state aid measures fell under an exemption (European Commission, 2024, 89). In addition, the Commission also granted Member States considerable autonomy to adopt state aid following the 2009 Eurozone crisis and the 2020 Covid-19 pandemic under so-called “temporary frameworks” (Di Carlo et al., Reference Di Carlo, Eisl and Zurstrassen2024). These changes are reflected in much fewer investigations and negative decisions since around the year 2000 (online Appendix C). As the Commission exercised authority with greater restraint, state-aid litigation began to decline. By contrast, the flow of annulment cases unrelated to CAP or state aid remained virtually constant (online Appendix B) – further evidence that legal contestation is related to authority transfers.
Although increasing, legal mobilization against EU-level implementation did not become more salient, unlike in the other proceeding types (Figure 5, left). This contradicts our expectation that its salience would increase due to the Commission holding greater discretion over more diverse issues. Still, on some occasions, technicalities were economically or electorally salient, as in Austria’s legal battle against Commission decisions authorizing state aid for nuclear energy. The annulment proceedings in Hinkley Point C saw strong support for the defendant, with seven “nuclear-friendly” countries intervening in support of a state-aid measure for a British nuclear power station; and in the proceedings about the Hungarian plant PAKS II, the Commission was supported by six Member States.Footnote 23
Salience and Conflict in Actions for Annulment against Administrative EU Acts.
Note: Left: Number of interventions submitted per annulment action against administrative acts in each year, divided by the number of cases in that year. Right: Level of disagreement among the interventions for each case with two or more interveners (see “Empirical Strategy” for details). Cases submitted in the same year are plotted as overlapping circles. Source: Compilation of data from Iuropa (Brekke et al., Reference Brekke, Fjelstul, Hermansen, Naurin, Lindholm, Naurin, Šadl, Ghavanini, Brekke, Fjelstul, Hermansen, Larsson, Moberg, Näsström, Ovádek, Pavone and Schroeder2023a, Reference Brekke, Fjelstul, Hermansen and Naurin2023b), Eurlex, and Curiae.

While litigation concerning EU-level implementation remained obscure, it did become more polarized, as expected. The inflection point occurred around the turn of the century (Figure 5, right). Between 1954, when the first case was lodged, and the end of 2000, only three out of the 20 cases with two or more interveners were disputed (18 percent), yet the polarization score in these three cases was extreme (see the upper-left corner in Figure 5, right), so that across the 20 cases, polarization no less stood at 45 percent. Between 2001 and 2021, 16 out of 42 cases with two or more interveners were disputed (37 percent), while the polarization score increased sharply to 86 percent. Only six of the 19 disputed cases in the entire period concerned CAP or state aid, despite these issues representing 74 percent of all implementation litigation. This suggests that the increase in polarization results from an expansion of European implementation authority in new policy areas. State aid “pits the Commission directly against the member states” (Cini, Reference Cini2001, 198),Footnote 24 and CAP is dominated by sectoral policy communities where governmental interests are likewise homogeneous (Daugbjerg, Reference Daugbjerg1999). By contrast, we find among the more polarized cases issues related to language,Footnote 25 transparency,Footnote 26 energy,Footnote 27 climate,Footnote 28 as well as environmental,Footnote 29 consumer,Footnote 30 and financial regulation,Footnote 31 where policy preferences are more diverse. Despite the growing number of polarized cases, however, they remain exceptions.
In summary, legal mobilization against EU-level implementation has intensified until the mid-2000s, followed by a gradual decline. This trend coincides with a more restrained exercise of implementation authority. While annulment proceedings against implementation decisions have not become more salient, they have grown increasingly polarized as implementation authority spread to new policy areas.
Litigation about enforcement: Less mobilization, stronger salience and opposition
In contrast to annulment litigation, where legal mobilization evolved in an almost linear fashion, mobilization around enforcement follows an inverted U-shape. Although the Commission always had authority to bring infringement cases before the CJEU (Piccirilli, Reference Piccirilli, Fasone, Dirri and Guerra2024, 39), it did not launch the first case until 1968 – ten years after the Treaty of Rome took effect. Until 1978, the number of cases filed each year remained in the single digits. Following a slow start, the yearly cases more than tripled throughout the 1980s and 1990s, but this trend abruptly reversed after the turn of the century (Figure 6, left). At its height, the Commission brought 143 cases to Court in the single year of 2003, amounting to 9.5 cases per Member State. In the ten years around “peak enforcement” – from 1997 to 2006 – it filed 54.6 cases per State (964 in total). Yet in the decade from 2010 to 2020, this number dropped dramatically to just 14.5 cases per State (400 in total). This turn toward forbearance drew attention from many researchers (Falkner, Reference Falkner2018; Hofmann, Reference Hofmann2018; Kelemen and Pavone, Reference Kelemen and Pavone2023).
Enforcement Actions.
Note: Left: Number of actions for failure to fulfil obligations by the Commission, plotted against the year the case was lodged, divided by the number of EU members in that year, allowing for the exact accession date. Middle: Number of interventions submitted per action in each year, divided by the number of cases in that year. Right: Percentage of interventions supporting the Commission, plotted against the year the cases were lodged. Note how the outliers make the trend appear less dramatic. Source: Procedural data from Iuropa (Brekke et al., Reference Brekke, Fjelstul, Hermansen, Naurin, Lindholm, Naurin, Šadl, Ghavanini, Brekke, Fjelstul, Hermansen, Larsson, Moberg, Näsström, Ovádek, Pavone and Schroeder2023a, Reference Brekke, Fjelstul, Hermansen and Naurin2023b), accession data from EUMS (Fjelstul, Reference Fjelstul2021), intervention data compiled from Eurlex and Curiae.

In line with our reasoning and empirical findings about the impact of authority transfer on annulment litigation, we expected Member States to respond to stricter enforcement with more frequent and antagonistic interventions in infringement litigation. This is only partially true. Contrary to our expectation, when enforcement actions increased, as they did until 2003, the number of interventions per case in fact dropped by more than half,Footnote 32 and when they decreased after 2003, the number of interventions per case more than doubledFootnote 33 (Figure 6, centre). However, the increase in interventions began almost a decade before “peak enforcement,” suggesting that Member States did respond to stronger legal enforcement, just not immediately. Once litigation had reached a certain level in the late 1990s, legal enforcement and salience for some time grew in lockstep, but then the latter continued to increase despite the fall in the former. The fact that interventions increased further at a time of declining legal enforcement could mean that the governments focused their resources on fewer proceedings, but this would not explain why interventions went up as early as they did. The results are also mixed regarding the intervener disposition (Figure 6, right). The share of interventions favouring the Commission declined during the period of increasing legal enforcement as expected, but, contrary to our expectation, it decreased further instead of bouncing back after 2003.
Turning to the Commission’s response to legal contestation, we expected the Commission to bring fewer enforcement actions to Court the more interventions Member States submit and the more critical their disposition becomes. This aligns with the claim by Kelemen and Pavone (Reference Kelemen and Pavone2023, 801) that the Commission adopted a deliberate strategy of forbearance, “as a Eurosceptic backlash intensified across member states.” The Barroso presidency, Kelemen and Pavone argue, centralized control over the enforcement process, weakening the politically independent legal service (ibid., 790). The Commission, by contrast, insists that its new approach is owed to efficiency. By settling minor infractions out of Court under managerial procedures like the EU Pilot, it could focus legal action on the most egregious cases of non-compliance (European Commission, 2017; see also Falkner, Reference Falkner2018, 773–774). Our data casts doubt on the Commission’s presentation and confirms the suspicion that it responded to political pressure.
Indeed, a few years after Member States had begun to shore up their interventions, we see the Commission take a U-turn in legal enforcement (compare left and centre panels in Figure 6). In the ten years around “peak enforcement” – from 1997 to 2006 – Member States on average submitted 0.18 interventions per case, and 10 percent of all cases included at least one intervention. Compared to the period from 2011 to 2020, the number of interventions per case more than tripled to 0.59, and the share of cases with interventions more than doubled to 21 percent. This suggests that the Commission started to relent because Member States were no longer indifferent to ongoing litigation. As the salience of enforcement proceedings increased further, the rate of new cases continued to decrease accordingly.
More importantly, the Commission also faced ever stronger opposition. Not only did Member States submit more interventions when the Commission became overly litigious, they also submitted more adverse interventions, signalling discontent and closing the ranks. From 1968, when the first enforcement case was litigated, through 2000, almost half (11) of all proceedings with more than one intervention (24) included submissions supporting different parties. From 2001 through 2021, just over every tenth such proceeding was contentious in this sense (10 out of 97). Between both periods, the intergovernmental polarization scores shrunk from 44 to 12 percent, indicating closer alignment between Member States.
Just before it turned to forbearance, support for the Commission went off a cliff as well (Figure 6, right). Averaging over each year, we can see exactly when government interventions crossed into opposition. Aside from 2020, when the CJEU ruled on two infringements that sparked intergovernmental conflict,Footnote 34 the last year when at least 50 percent of interventions supported the Commission was in 1997. Up to and including the year 1996, 53 percent of all interventions were submitted in favour of the Commission. In the period since 1997, its share stands at just 9 percent. Member States nowadays intervene more often – but rarely for the Commission. Save for the recent outliers, they almost always support each other against the exercise of supranational enforcement authority.
Exploring individual cases, we find governments jointly opposing the Commission across a large variety of areas, including fiscal and environmental policy, internal market law, as well as social security coordination,Footnote 35 and when the Commission combined enforcement actions to tackle similar issues in multiple Member States (see also Schmidt, Reference Schmidt2018, 100–106), such as the recognition of professional qualifications.Footnote 36 Government interventions in opposition to each other nowadays remain exceptions. They occur when Member States’ substantive policy interests diverge over issues with manifest distributive implications, like protected designations of origin for foodstuffs,Footnote 37 and welfare entitlements for foreign nationals.Footnote 38
Conclusion
In this contribution, we demonstrated how authority transfers to the EU influence legal contestation by Member States before the CJEU. As EU authority expands, legal mobilization intensifies, often leading to more salient and polarized proceedings, with policy disputes spilling over into the judicial arena. Conversely, when the Commission’s role in implementing agricultural subsidies and controlling state aid weakened, the extent of legal contestation also diminished. However, despite the Commission’s increasing restraint in enforcement, national governments have not yet backtracked from contesting infringement litigation. This suggests a more deliberate interaction between the Commission and Member States in enforcement matters compared to policy implementation – further evidence for the political nature of forbearance.
These associations hold when adjusting for the number of Member States, the size of the acquis, and the quantity of cases lodged per year, so they are not just driven by litigation opportunities. They accord with the new intergovernmentalist notion of a sovereigntist backlash against authority transfers to supranational institutions (Bickerton et al., Reference Bickerton, Hodson and Puetter2015; Kelemen and Pavone, Reference Kelemen and Pavone2023) and with the postfunctionalist idea of governments responding to the domestic politicization of European integration (Bressanelli et al., Reference Bressanelli, Koop and Reh2020; Hooghe and Marks, Reference Hooghe and Marks2009). As the EU gains authority, including over sensitive issues, and as European governance becomes contested in public spheres, Member States have more reason to mount legal challenges before the CJEU and to intervene in ongoing proceedings. On the flip side, the Commission responds to legal contestation by pursuing fewer infringement cases until litigation.
More broadly, these observations also fit institutionalist explanations of delegation and control (see Hawkins et al., Reference Hawkins, Lake, Nielson and Tierney2006). When governments pool and delegate authority at the EU level, due to incomplete contracts, information asymmetries, and shifting preferences, they are usually not fully aware of what they sign up to in the long run (Pierson, Reference Pierson1996; Pollack, Reference Pollack2003). Through annulment actions against European legislation and implementation decisions, Member States contain the agency costs of delegation (Pollack, Reference Pollack2003; Tallberg, Reference Tallberg2002). Similarly, by intervening in infringement proceedings, they signal their discontent with European enforcement, attempting to sway the CJEU in favour of national discretion and deter the Commission from becoming too litigious. The more authority Member States delegate, the more agency costs they accrue, and so the more judicial control they apply.
In contrast to our analysis of Member States and direct actions, the existing literature on European legal mobilization mostly focuses on non-state actors and preliminary rulings (see Adam et al., Reference Adam, Bauer, Hartlapp and Mathieu2020 for an exception). According to this line of work, the doctrines of direct effect and supremacy turned the preliminary ruling system from a mechanism to challenge European law into a mechanism to unsettle national law (Alter, Reference Alter1998, 122) that allowed private litigants and lower courts to advance European integration by judicial means (Alter, Reference Alter1998; Burley and Mattli, Reference Burley and Mattli1993; Schmidt, Reference Schmidt2018, 36–39; Weiler, Reference Weiler1994). Neofunctionalists moreover argue that the mutual reinforcement of private litigation and activist jurisprudence placed national governments “in an ever longer and darker ‘shadow of the law’” as interpreted by the CJEU (Stone Sweet and Brunell, Reference Stone Sweet and Brunell1998, 77; Schmidt, Reference Schmidt2012). The mobilization of European law thus seems unidirectional. Driven by actors who seek to remove domestic constraints, it relentlessly transfers authority from the national to the supranational level.
Shifting attention to direct actions could provide a sceptical complement to the narrative of Europe’s judicial self-empowerment. This dovetails with recent contributions that stress how even in preliminary references the growing involvement of high courts puts a damper on integration through law (Pavone, Reference Pavone2022; Pavone and Kelemen, Reference Pavone and Kelemen2019). Also in the case of annulment actions, authority transfer begets CJEU litigation, consistent with neofunctionalist spill-over. But in contrast to preliminary references, this litigation serves to keep the exercise of authority by EU institutions in check, as historically intended, and in line with intergovernmentalist scholarship.
Our results also speak to the compliance debate. Its protagonists agree that enforcement actions have declined dramatically but differ on the reasons why. Some submit that Member States have simply become more law-abiding (Börzel, Reference Börzel2022; Börzel and Sedelmeier, Reference Börzel and Sedelmeier2017), others that, by producing less legislation, the EU provides fewer opportunities for noncompliance (Börzel, Reference Börzel2022; European Commission, 2017, 13; König and Luetgert, Reference König and Luetgert2009, 189), or that, having shifted to a managerial approach, the Commission reserves just the most troubling cases for litigation (Cheruvu and Fjelstul, Reference Cheruvu and Fjelstul2022; European Commission, 2017, 11–12; Falkner, Reference Falkner2018; Hofmann, Reference Hofmann2018). We do not rule out that dialogue and better law-making improve compliance, but these factors cannot explain the striking increase in legal contestation against enforcement actions and its conspicuous timing. Moreover, the drop in cases remains steep after adjusting for legislative output. These observations instead support the interpretation that the Commission grants forbearance in response to political pressure (Kelemen and Pavone, Reference Kelemen and Pavone2023). Not only did Member States “increasingly lambast” the Commission in political venues like the European Council (Kelemen and Pavone, Reference Kelemen and Pavone2023, 791), they also brought opposition to the courtroom through more frequent, more critical, and more consistently unanimous interventions.
Member States have become more actively involved in shaping the development of EU law through litigation. They increasingly participate in direct actions, challenging the Commission’s enforcement and implementation powers or supporting intergovernmental compromises in disputes over legislative acts. These interventions led the Commission to adopt a softer enforcement approach, and perhaps also to a more lenient implementation of state-aid rules. Long term, this shift could have consequences for European integration and the rule of law. A general weakening of the Commission’s enforcement role risks leaving non-compliance unsanctioned, creating legal uncertainty and uneven application of EU law. Moreover, as the new Member States grow more confident to challenge the legality of secondary legislation, the “shadow of the vote” (Golub, Reference Golub1999), an important catalyst for legislative bargaining, may become increasingly rivalled by the shadow of judicial review.
Acknowledgements
The authors thank Moritz Klock for research assistance and Stein Arne Brekke, Lisa Anders, and Timm Beichelt for helpful comments on earlier drafts. The authors report no conflicts of interest. This research was funded in part by the Austrian Science Fund (FWF), grant-DOI: 10.55776/P33773.
Replication material for our paper is available online at the DOI 10.17605/OSF.IO/AWD74.
Supplementary material
To view supplementary material for this article, please visit https://doi.org/10.1017/S1755773925100118.


 Open access