


Introduction
During the winter of 2014/15, England, as in other European countries [Reference Mølbak1], saw significant increases in excess all-cause mortality predominantly in the elderly [2]. The rise coincided with influenza circulation, which raises important questions as to what contribution influenza made to the observed excess, particularly in the light of the apparent low-intensity activity seen in primary care that season [Reference Hawkes3].
Seasonal cyclical changes in mortality are seen each year in temperate countries, with a higher number of deaths in the winter compared with the summer months. Acute increases in mortality above these seasonally expected levels can occur at any time of the year and are termed ‘excess mortality’ [Reference Serfling, Sherman and Houseworth4]. In the UK and elsewhere in Europe, all-cause excess mortality is reported on a weekly basis over the entire year through the European network for mortality surveillance, EuroMOMO. Participating countries in EuroMOMO estimate excess mortality using a standard statistical model to make comparable estimates across participating countries [Reference Nielsen5, 6]. EuroMOMO became operational in 2009.
Significantly increased excess mortality in the winter months has typically been linked to factors such as cold snaps and circulation of influenza plus other respiratory viruses; whereas in the summer months, heat-waves have been identified as one of the main temporally associated factors associated with acute increases in excess mortality [Reference Berko7]. Influenza and other respiratory infections are recognised to be considerably under-reported by clinicians as a cause of death at certification, with infection not always diagnosed or recognised as infection resulting in an exacerbation of an underlying condition such as cardiac or respiratory disease. The impact of cold snaps can also result in death [Reference Berko7] as, in addition to hypothermia, low temperature can exacerbate pre-existing chronic, clinical conditions, such as cardio-respiratory disease. As cold weather and acute respiratory infections often temporally coincide, it is challenging to disentangle their respective impact [Reference Brown, Fearn and Wells8]. To determine the relative contribution of various potential explanatory factors to excess mortality, modelling methods with a range of statistical approaches have been employed [Reference Green9–Reference Nielsen14]. As an advance from the EuroMOMO initiative, a standardised European multivariable regression model, FluMOMO, has been developed to estimate the association of influenza to excess mortality while adjusting for the extreme temperature that can be applied across countries and time [Reference Espenhain15]. This paper uses this model to assess the increase in excess mortality seen in England during the 2014/15 winter and to quantify the contribution of influenza, controlling for extreme ambient temperatures, compared with recent past seasons.
Methods
Data
The weekly number of death registrations in England was available from the Office for National Statistics. The following age groupings were used: <5 years, 5–14 years, 15–64 years, 65 years or more and all ages.
To incorporate influenza activity as a variable in the FluMOMO model, a measure of influenza incidence was calculated as in previous studies [Reference Green9, Reference Goldstein16]. Weekly age-specific consultation rates for influenza-like illness (ILI) across England through the Royal College of General Practitioners (RCGP) Research and Surveillance Centre (RSC) network was used. This general practice (GP) sentinel scheme was used as a measure of clinical activity. As a large proportion of these GPs undertook respiratory swabbing of patients who presented with an ILI, virological activity was reported as the proportion of samples tested that were positive for influenza by consultation week. By multiplying clinical activity (i.e. ILI) and virological activity each week, an influenza incidence proxy was determined, hereafter termed influenza activity [Reference Goldstein16].
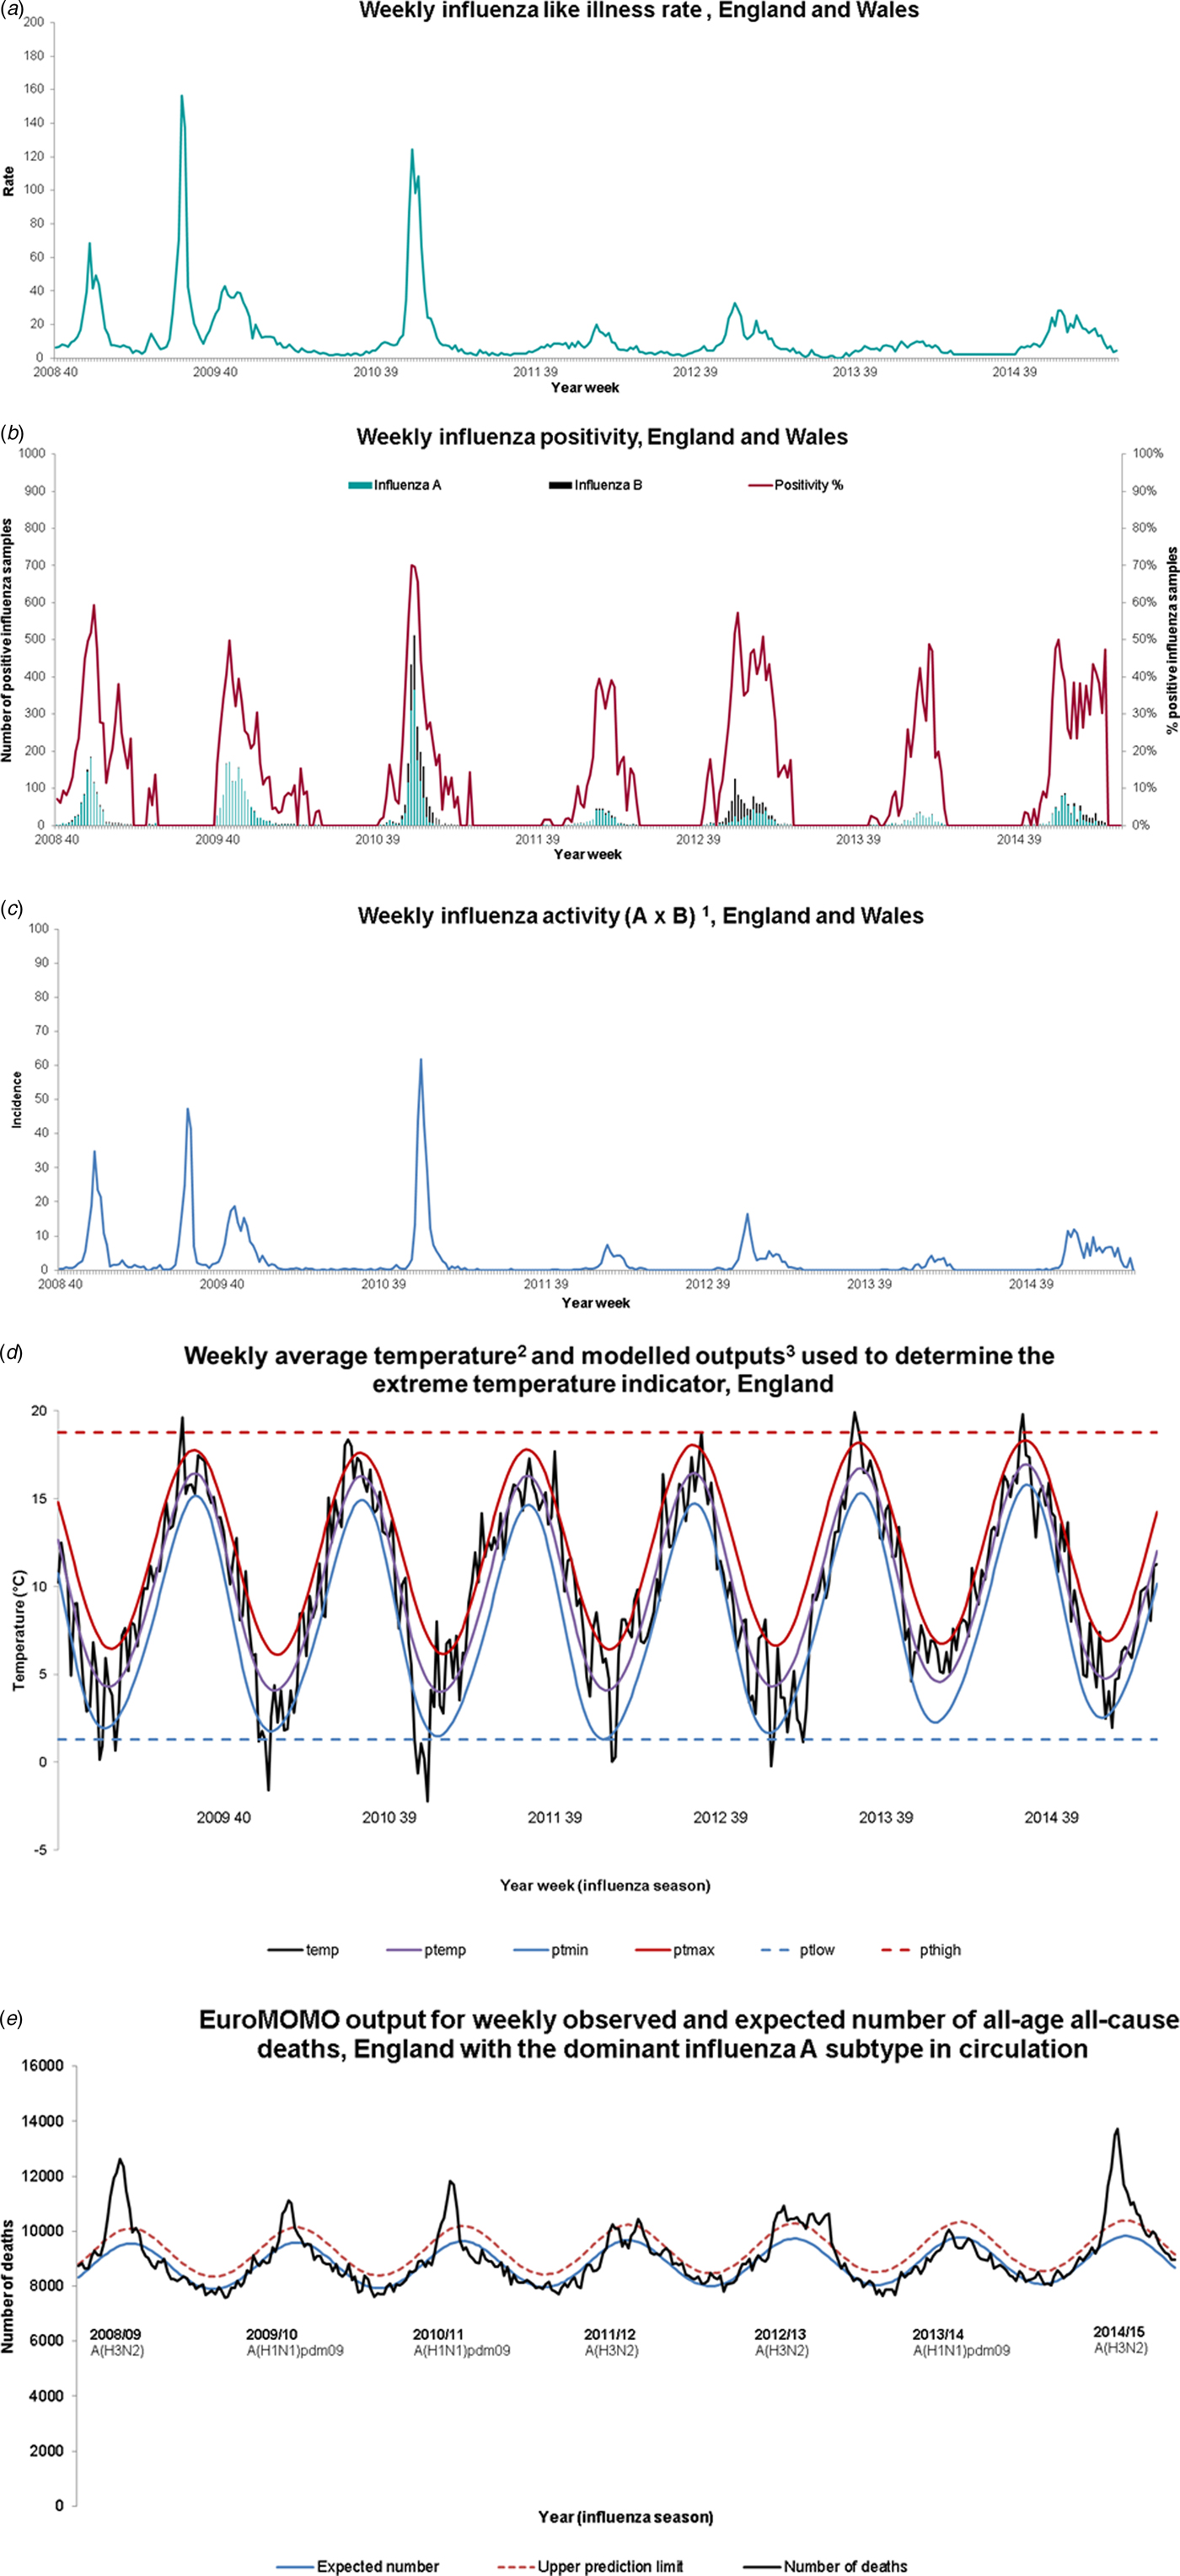
Daily maximum temperature data from a sample of weather stations in England was selected from the National Oceanic and Atmospheric Administration (NOAA) site [17]. Weekly average, minimum and maximum temperature values were calculated from this daily data and a regression model run to determine expected weekly temperature, as well as expected minimum and maximum temperatures. The extreme temperature was defined according to the following equations (Fig. 1d):
 $${\rm Extreme}\,{\rm low}\,{\rm temperature}\!:({\rm temp}\; - {\rm p}{\rm t}_{{\rm low}}) \times ({\rm temp}\; \lt {\rm p}{\rm t}_{{\rm low}})$$
 $${\rm Extreme}\,{\rm high}\,{\rm temperature}\!:({\rm temp\;} - {\rm p}{\rm t}_{{\rm high}}) \times ({\rm temp} \gt {\rm p}{\rm t}_{{\rm high}})$$
where temp, weekly mean temperature; ptlow, the minimum predicted weekly-mean temperature across the time series; pthigh, the maximum predicted weekly-mean temperature across the time series.
FluMOMO influenza (a), positivity (b), activity (c), temperature (d) and mortality (e) variables, 2008/09 week 40 to 2014/15 week 20. 1RCGP ILI consultation rate per 100 000 population multiplied by the proportion of samples positive for influenza through RCGP and PHE-SMN sentinel swabbing schemes. 2Temperature data from National Oceanic and Atmospheric Administration (http://www.noaa.gov/). 3Definitions: temp, weekly mean temperature; ptemp, predicted weekly-mean temperature; ptmin, predicted weekly-mean minimum temperature; ptmax, predicted weekly-mean maximum temperature; ptlow, the minimum predicted mean temperature across the time series; pthigh, the maximum predicted mean temperature across the time series.
Analysis
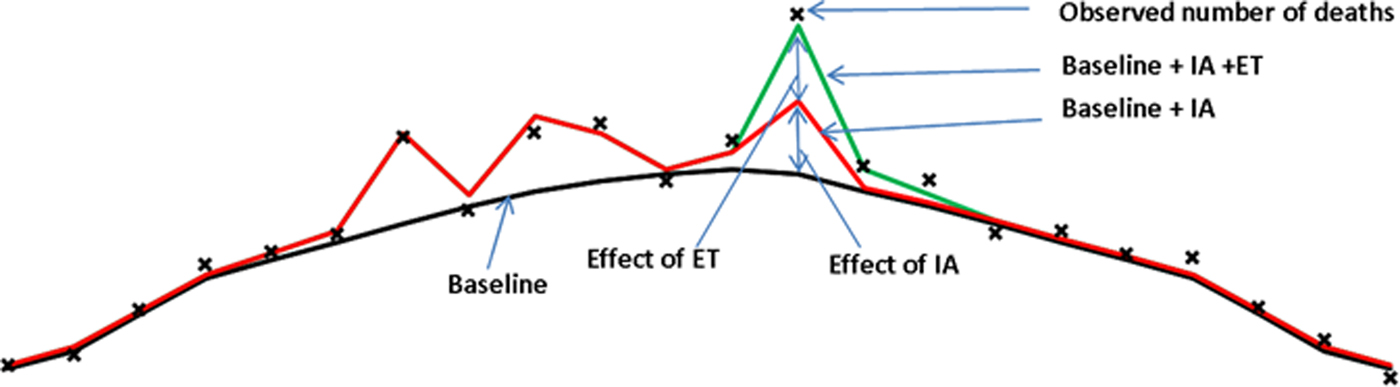
The FluMOMO model analyses the time series of all-cause deaths over calendar time (ISO-week as time unit) using a multiplicative Poisson regression model with overdispersion, and a post-estimation 2/3-power correction for skewness in the multiplicative residual variation. The baseline adjusts for seasonal variation by including a sine curve and trend. In addition, we include Influenza Activity (IA) and Extreme Temperature (ET). The model estimates both a baseline and the effect IA and ET simultaneously, controlled for one another i.e. the baseline [Reference Nielsen, Krause and Mølbak18].
The impact of influenza may vary between influenza-seasons depending on the circulating influenza strains. Therefore, we include IA separately for each influenza-season (is). While the effect of influenza is allowed to vary each season, the effect of extreme temperature is assumed constant over time and is included in the model as two variables; a summer effect and a winter effect.
 $$\eqalign{E\left[{{\rm log}\,(X_{\rm t})}\right] & = \beta_{0} + \beta_{1}^{\ast}{\rm trend}\,(t)+ \beta_{2}^{\ast}{\rm seasonality}\,(t) \cr & \quad + \Sigma \beta_{\rm is}^{\ast}{\rm IA}_{\rm t,is}+ \beta_{\rm s}^{\ast}{\rm ET}_{\rm s} + \beta_{\rm w}^{\ast}{\rm ET}_{\rm w}}$$
where β 0 + β 1*trend(t) + β 2*seasonality(t) comprise the baseline and the remainder impacts of IA and ET. This is illustrated in Figure 3.
To take into account that there often is a delay between exposure (influenza or extreme temperature) and outcome (death), we also fitted lagged impacts of 2 weeks in the model (not shown in the formula).
The EuroMOMO and FluMOMO models were run in Stata v13 (StataCorp, College Station, TX) with data from week 40, 2008 to week 20, 2015 (using death data available at week 10, 2017, to obtain accurate number of deaths from the 2014/15 season). Winter periods were defined as week 40 to week 20. The number of influenza-associated deaths was estimated and corresponding confidence intervals calculated with a 2/3-power correction for skewness in the residual variation.
Results
The ILI rate, influenza positivity and influenza incidence for the period 2008/9 until 2014/15 are shown in Figure 1a–c. Over this period, GP consultations for influenza-like illness breached the baseline threshold denoting likely community transmission, in all seasons except 2013/14. In the season 2014/15, the threshold was breached from week 50, 2014 to week 13, 2015 (Fig. 1a). Influenza A and B co-circulated in most seasons over this time (Fig. 1b), with A(H3N2) the dominant circulating strain in 2014/15. Influenza activity was highest in 2010/11, the first post-pandemic season when influenza A(H1N1)pdm09 was the dominant circulating strain (Fig. 1c).
No period of extreme cold temperature was observed in the 2014/15 season, unlike the earlier seasons in particular 2009/10 and 2010/11 (Fig. 1d).
The EuroMoMo model showed generally good fit (Fig. 1e). It demonstrated significant excess all-age all-cause mortality in 2014/15, reaching and potentially exceeding the level of excess mortality observed in 2008/09, a season also dominated by circulation of A(H3N2).
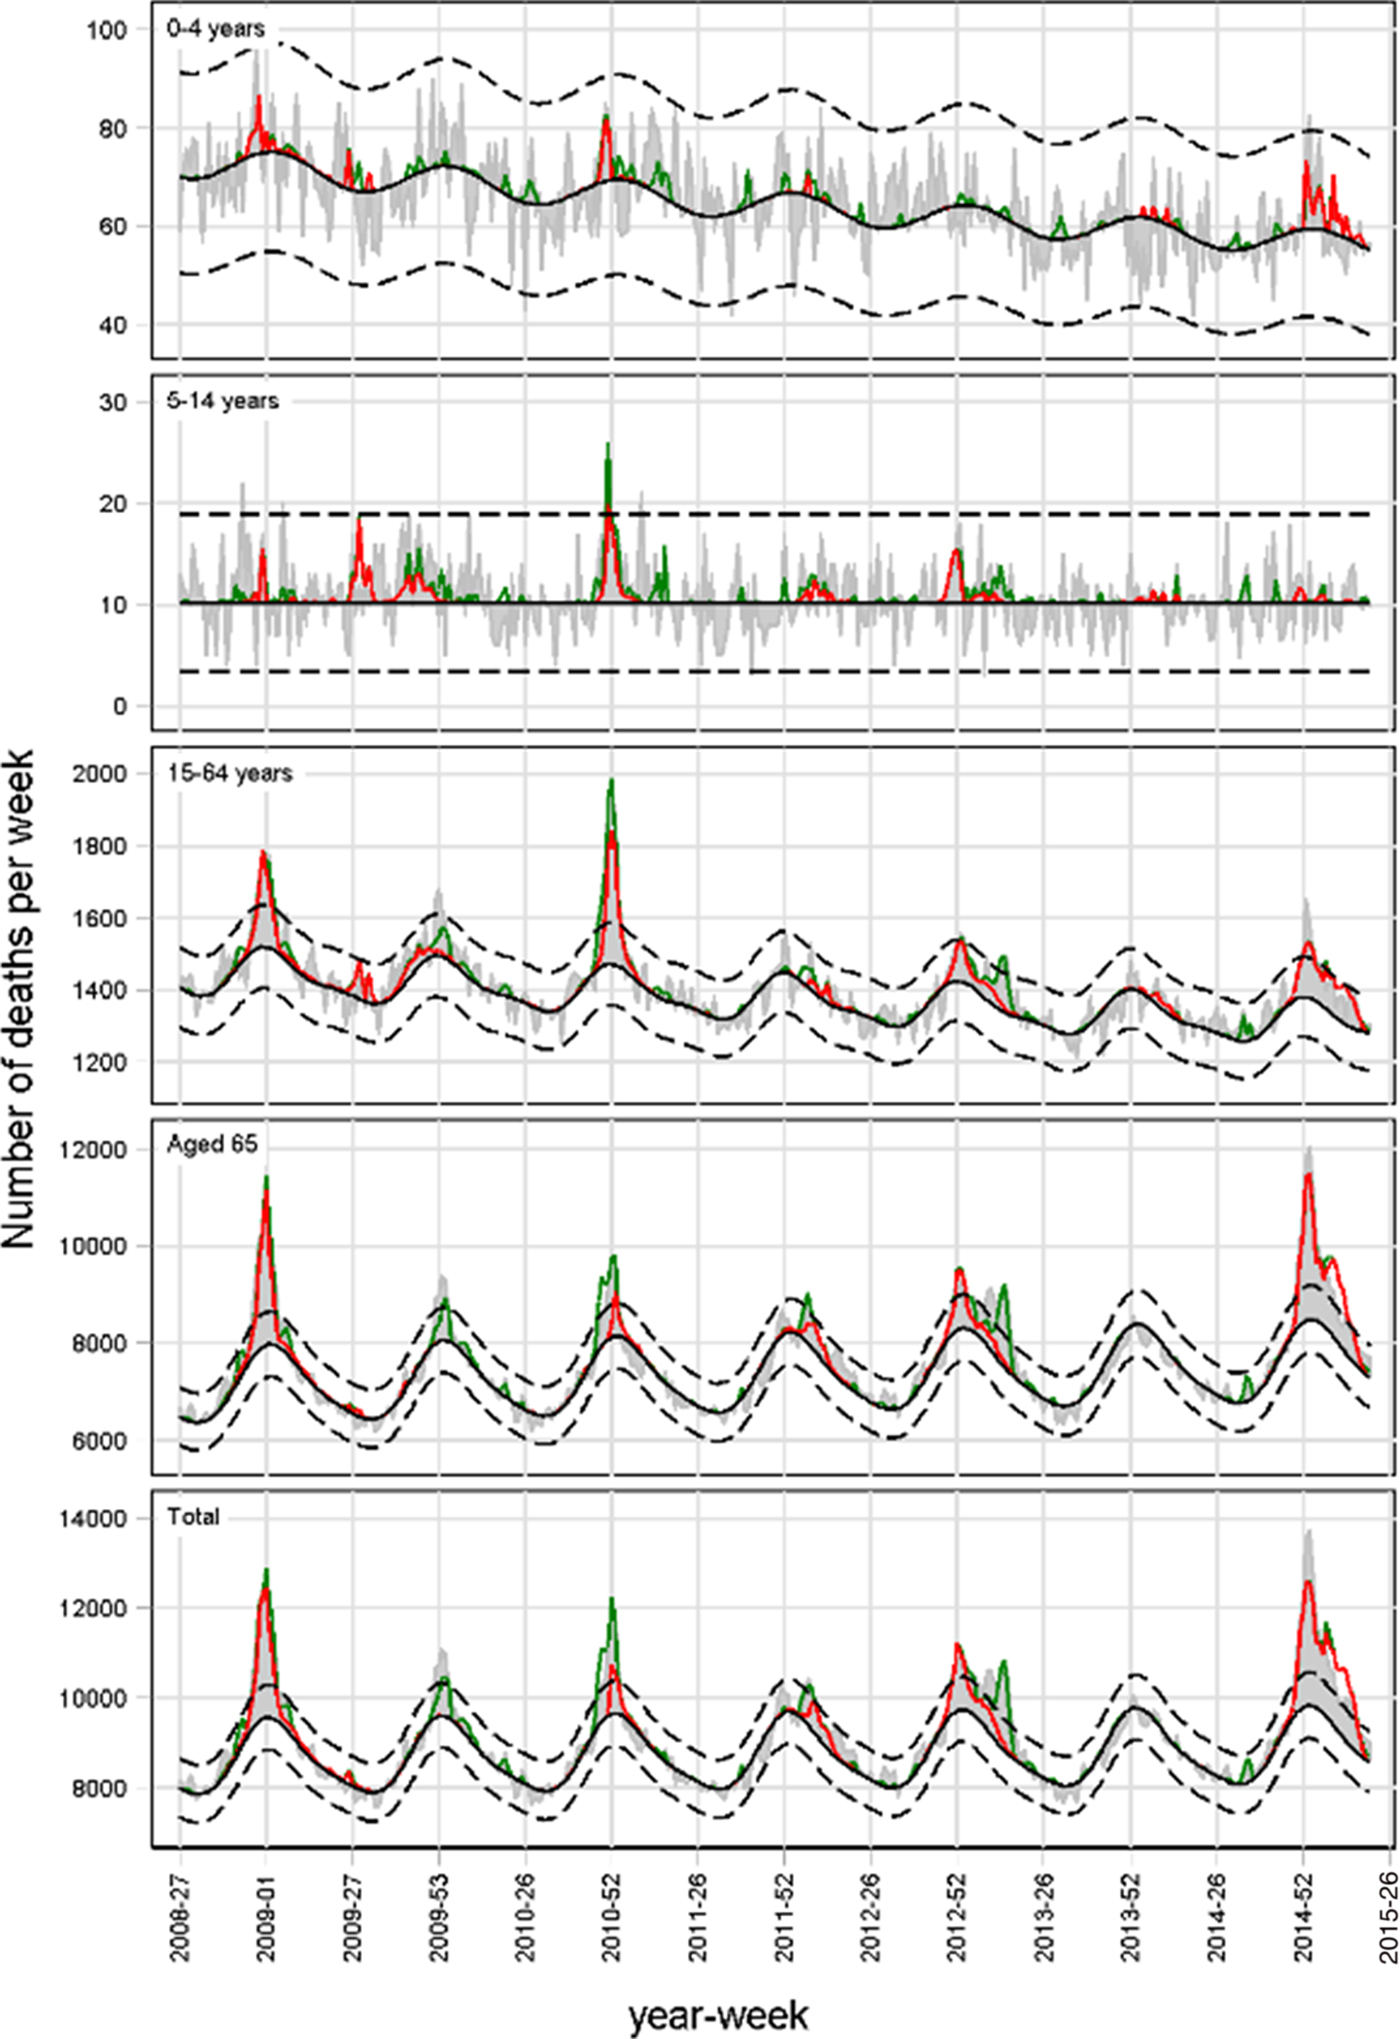
Adjusting for extreme weather, the FluMOMO model also demonstrated generally good fit to the observed data (Fig. 2). The model associated significant mortality to influenza over several seasons. This is particularly apparent in 2008/09 and 2014/15, with deaths in both seasons predominantly occurring in 65+ year-olds (Fig. 2). In total, 26 542 (95% CI 25 301–27 804) deaths in those 65+ were associated with influenza from week 40, 2014 to week 20, 2015 (Table 1). This is the highest number of influenza-associated deaths in the elderly over the six winters of the study and significantly higher than what was seen in 2008/09, the last notable influenza A(H3N2) season, where 14 261 (95% CI 13 514–15 023) deaths were attributed to influenza. These patterns remained when mortality cumulative incidence rates were assessed, with the highest mortality rate seen in 2014/15 (Fig. 2).
Weekly number of deaths and attribution to influenza (red line) and extreme temperature (green line), England, 2008/09 to 2014/15.
Schema to illustrate defined terms.
Number of influenza attributable deaths (95% CI) by age group and season during the winter period, England, 2008/09 to 2014/15 adjusting for extreme temperature
*The model could not attribute deaths for this period.
In children, statistically significant influenza-associated deaths were also seen in under 5 year-olds in 2014/15 (73 (95% CI 61–87) estimated deaths), but also 2008/09 (39 (95% CI 29–50) estimated deaths), 2010/11 (32 (95% CI 20–47) estimated deaths) and 2013/14 (9 (95% CI 1–20)) (Fig. 2 and Table 1). The highest number of influenza-associated deaths in 5–14 years was seen in 2010/11. Influenza-associated deaths in school-age children were also seen in every other season, though the smallest numbers were seen in 2013/14 and 2014/15.
Finally, statistically significant mortality associated with influenza was seen in 15–64-year-olds (1942 (95% CI 1834–2052) estimated deaths) in 2014/15 (Table 1). The number of excess deaths associated with influenza in 15–64-year-olds in 2014/15 was higher than that seen in 2010/11, when the season was dominated by A(H1N1)pdm09 circulation and also 2008/09 (Fig. 2 and Table 1).
Discussion
We demonstrate the application of a standardised regression modelling approach to estimate the number of deaths associated with influenza before, during and after the 2009 pandemic controlling for cold weather. In England during the 2014/15 winter as in other countries [Reference Mølbak1], significant excess all-cause mortality above expected levels was seen, with the majority of these deaths associated with influenza with levels higher than seen in the previous seven winters, including the A(H3N2) dominated season of 2008/09. Influenza-related deaths were also observed in younger age-groups in 2014/15, as in some earlier seasons, particularly in younger adults in 2010/11, when A(H1N1)pm09 was the dominant circulating strain. No deaths were associated with cold snaps in the 2014/15 winter, unlike some earlier winters, in particular 2010/11, when excess mortality in the elderly was associated mainly with extreme cold, rather than influenza.
The burden of influenza-related mortality described in the elderly in 2014/15 is consistent with the dominant circulating sub-type being A(H3N2), with very little circulation of influenza A(H1N1)pdm09 that season. Influenza A(H3N2) is well recognised to have a more severe impact in the elderly compared with other seasonal influenza viruses. A similar picture to that described here was seen elsewhere in Europe in 2014/15. A pooled EuroMOMO analysis across 14 European countries [Reference Mølbak1] showed significantly higher levels of excess all-cause mortality in the elderly compared with recent years, with influenza hypothesised as the main explanatory factor. Our findings are also consistent with both the timing and intensity of other UK influenza surveillance indicators in 2014/15, despite the lower GP ILI consultation rates. In particular, hospital-based influenza surveillance through the UK Severe Influenza Surveillance System (USISS) showed that the impact of severe influenza was the highest reported since the USISS surveillance system started in 2010/11 and respiratory outbreak surveillance demonstrated a large number of influenza A outbreaks reported in care home settings for the elderly over the same time period [2]. The burden of influenza-associated deaths in the elderly in 2014/15 was significantly higher than that seen in recent A(H3N2) dominated seasons, including 2008/09, the last intense A(H3N2) season. There are a number of potential explanations for large mortality impact of influenza A(H3N2) in particular seasons. These relate to the intensity of virus transmission, the level of which depends upon the dominant circulating A(H3N2) strain and the underlying population immunity, which relates to prior natural infection and recent vaccine uptake and effectiveness. The genetic and antigenic relatedness of the current circulating strain to recent strains and the vaccine virus strain is thus key. The levels of influenza-related mortality in the elderly seen in 2014/15 are of a magnitude similar to that seen in 1999/2000 and 1996/1997 [Reference Goddard19]. Both these seasons were dominated by circulation of A(H3N2) strains antigenically closely related to the vaccine strains (A/Sydney/5/97 and A/Wuhan/359/95 respectively) [Reference Goddard19]. At that time, however, the UK had a risk-group only policy for all age-groups, with uptake amongst elderly at risk only 40–50% [Reference Goddard19]. Due to the health impact of influenza in these seasons, the UK's vaccine policy from autumn 2000 onwards changed to recommend influenza vaccine for all those over 65 years of age, in addition to those of any age in a high-risk group. This led influenza vaccine uptake levels to increase rapidly to approximately 70% in all over 65-year-olds in the early years of the 21st century, a level that has been maintained more recently [2]. Why this might explain the large burden of influenza-related mortality in 2014/15 when vaccine uptake levels in the elderly were high and GP ILI consultation rates apparently low? The 2014/15 season saw the circulation of a drifted A(H3N2) strain resulting in antigenic mismatch to the 2014/15 northern hemisphere A(H3N2) vaccine strain. The end of season all-age influenza vaccine effectiveness estimate for the UK at 34% and specifically 32.6% (95% CI −44.5 to 68.6) for A(H3N2) in the elderly was lower than anticipated [Reference Pebody20], as seasonal influenza vaccines are usually expected to provide overall protection of approximately 50%, though lower VE against A(H3N2) in the elderly is being increasingly recognised, as seen in the recent 2016/17 influenza season in the UK [Reference Pebody21] and as highlighted in a recent meta-analysis from Belongia et al. [Reference Belongia22], who reported a pooled VE against a(H3N2) in >65-yearolds of 24% (95% CI −6 to 45). What contribution did the circulation of a strain with a mismatch to that in the vaccine make to the observed excess mortality? The finding of significant excess mortality in the elderly in 2008/09, when the vaccine strain was moderately well matched to the circulating strain, highlights that increased excess mortality will still occur in the population during intense A(H3N2) seasons when vaccine uptake is high, but without vaccine mismatch [Reference Hardelid23], though the population impact of influenza may be reduced by the programme. Annual influenza vaccination remains the most important intervention to protect the population from the impact of influenza each year, with the selective vaccine programme shown to be a cost-effective intervention [Reference Baguelin24], however, it is hoped that the newer generation of vaccines such as adjuvanted vaccine, which will be available in the forthcoming 2018/19 season or high dose vaccines, some of which will be available in the UK in the near future, can provide better protection to groups such as the elderly, with systematic reviews providing encouraging findings [Reference Wilkinson25, Reference Domnich26]. In addition, the full implementation of the universal paediatric influenza vaccine programme is also predicted to provide both direct, but also indirect benefits to vulnerable members of the community through reduction in influenza transmission.
Influenza is also well recognised to cause severe disease in younger adults and children, particularly those with underlying clinical risk factors. In adults (15–64-year-olds), the number of influenza-associated deaths in 2014/15 exceeded the level seen in 2010/11, a season dominated by A(H1N1)pm09. This observation is also reflected in terms of laboratory-confirmed hospital and ICU/HDU admissions which were higher than the previous three seasons but did not reach the levels seen in 2010/11. Earlier work from the 2009 pandemic and the 2010/11 season highlighted the elevated probability of severe outcome following influenza A(H1N1)pdm09 particularly in younger adults and children with underlying clinical risk factors [Reference Pebody27], but not the elderly who have cross-protective immunity from earlier exposure to A(H1N1) viruses several decades previously [Reference Miller28]. Furthermore, reassuringly the estimates in this paper for the 2009/10 influenza pandemic are in a similar range to those reported in a global burden study [Reference Dawood29]. The findings in this paper reinforce the importance of ensuring clinical at-risk groups <65 years of age receive their annual influenza immunisation. The new universal paediatric influenza vaccination programme will also play an important role in providing both direct protection to the targeted age-groups and ultimately by reducing influenza transmission in the population provide indirect protection to other groups at higher risk of severe disease [Reference Baguelin30].
Cold snaps are an important contributory factor besides influenza to excess mortality during the winter months. Although the extreme temperature was adjusted for in the FluMOMO model, cold snaps are unlikely to have made a large contribution to excess mortality in 2014/15, as mean winter temperatures were near average and climatic conditions were generally mild. No extreme low temperature was seen in either 2014/15 or 2013/14 (Fig. 2) suggesting little impact of cold weather on excess mortality, in contrast with earlier winters, in particular 2010/11, a season also of intense A(H1N1)pdm09 activity, highlighting the importance of the statistical model in disentangling the impact of influenza and extreme temperature.
There are several strengths and potential limitations to note in this paper. Due to underreporting of influenza and complications as a cause of death, statistical modelling is required to measure the mortality burden based on underlying temporal patterns, with the model generally providing a good fit to the observed data. The FluMOMO model presented was developed to provide estimates for influenza-attributable mortality adjusting for trend, seasonality and extreme temperature using a standardised approach and building on earlier work in a large number of countries in Europe [Reference Leon-Gomez10]. One major strength with this approach is the use of a number of deaths from all causes as an independent variable rather than for example respiratory and circulatory deaths. This both enhances the timeliness of the model and overcomes potential comparability issues due to differences in certification practice by time and place. The model, on the other hand, does not stratify by influenza sub-type, with further work needed to allow the relative burden of influenza A and B to be described. In addition, the model is far from exhaustive and does not explain all of the observed peaks in excess mortality across all age-groups and seasons. This highlights the role that other contributory factors might be making to acute increases in mortality such as weather, other circulating respiratory pathogens, like respiratory syncytial virus (RSV) – although RSV peaked considerably earlier than influenza in week 49 2014 [2] and is unlikely to have been an important contributor to the excess seen in the elderly that season. The lack of apparent influenza-associated deaths in some seasons does not suggest that no-one died from influenza, but rather that mortality, in general, was low that season compared with previous years. The model also does not attempt to disentangle the impact of influenza A(H3N2) and A(H1N1)pdm09 as most seasons, such as in 2014/15, one influenza subtype is dominant, with a very little circulation of A(H1N1)pdm09. Finally, the model also fails to take into account other social factors including the quality of housing and adequacy of heating which may also contribute to winter wellness [Reference Gordon31]. Earlier statistical modelling work in the UK has been undertaken to determine attributable mortality to influenza including for overlapping periods [Reference Green9, Reference Hardelid, Pebody and Andrews32]. These earlier regression models differed from the FluMoMo model presented here, in that they included an identity link, incorporated other factors such as RSV and a more general temperature effect and explored lagging. Reassuringly, the derived estimates for influenza, which is the focus of this paper, were similar to those presented. Further work is underway to explore additional refinements and improvements to the FluMoMo model.
In conclusion, determining and quantifying the contributing causes of excess mortality is challenging. We present a standardised tool that can be deployed in a range of geographical settings. Indeed similar approaches have been deployed at global levels to estimate the burden of influenza [Reference Dawood29, Reference Simonsen33]. Assessment of winter 2014/15 mortality in England confirmed the previous hypothesis that influenza was likely to have been the main contributor to the excess mortality seen, notably in the elderly. Routine use of the regression modelling methods, such as FluMoMo can assist in rapidly assessing the impact of influenza, which varies considerably by age group and season, and allow standardised assessment across Europe at country level and over time. Ongoing work is underway to further improve the model. The impact of influenza demonstrated in this paper highlights again the important role that annual influenza vaccination needs to provide in protecting the population each year.
Acknowledgements
PHE is part of the EuroMoMo network. The EuroMOMO network, hosted by the Statens Serum Institut, has received financial support from DG Sanco (Directorate-General for Health and Consumer Protection) through an operating grant 2013 31 02 SSI_FY2014. We would like to acknowledge all the EuroMOMO partners for their contributions to the development of the FluMoMo model. We would also like to thank the patients, who consented to virology swabs being taken and allow their data to be used and RCGP Research and Surveillance Centre practices for sharing pseudonymised clinical data.
Conflict of interest
None.


