


I. INTRODUCTION
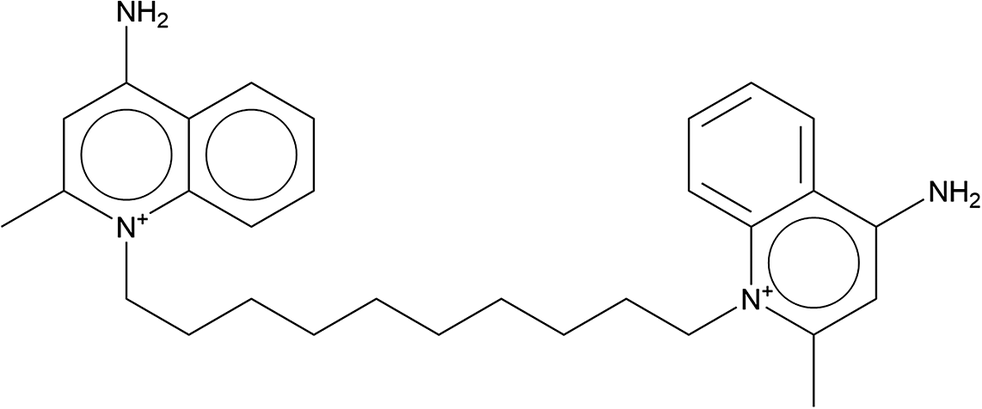
Dequalinium chloride (sold under the brand names Dekamin, Dequafungan, and Fluomizin, among others) is used as an antiseptic and disinfectant. Dequalinium chloride can be administered as a lozenge for sore throat, as a low concentration liquid for treatment of mouth and throat infections, a tablet for treatment of bacterial vaginosis, and as a topical cream for treatment of skin infections. The systematic name (CAS Registry Number 522-51-0) is 1-[10-(4-amino-2-methylquinolin-1-ium-1-yl)decyl]-2-methylquinolin-1-ium-4-amine dichloride. A two-dimensional molecular diagram of the dequalinium cation is shown in Figure 1.
The two-dimensional structure of the dequalinium cation.

Preparation of pure dequalinium chloride Form A is claimed in Chinese Patent Application CN 107827814B (Nie et al., Reference Nie, Liu, Zeng, Xu and Gu2017; Anhui Heal Star Pharmaceutical Co. Ltd.). The method yields product with purity ≥99.7%, greater than the European pharmacopeia standard of 90%. The method claims to avoid the presence of a dimer Form C. Powder diffraction data are provided in the patent. Thermogravimetric analysis shows no weight loss until 350 °C, so the product is not a hydrate/solvate.
This work was carried out as part of a project (Kaduk et al., Reference Kaduk, Crowder, Zhong, Fawcett and Suchomel2014) to determine the crystal structures of large-volume commercial pharmaceuticals, and includes high-quality powder diffraction data for them in the Powder Diffraction File (Kabekkodu et al., Reference Kabekkodu, Dosen and Blanton2024).
II. EXPERIMENTAL
The dequalinium chloride sample was a commercial reagent, purchased from TargetMol (Batch #T0979), and was used as received. The white powder was packed into a 0.5-mm-diameter Kapton capillary and rotated during the measurement at ~2 Hz. The powder pattern was measured at 298(1) K at the Wiggler Low Energy Beamline (Leontowich et al., Reference Leontowich, Gomez, Diaz Moreno, Muir, Spasyuk, King, Reid, Kim and Kycia2021) of the Brockhouse X-ray Diffraction and Scattering Sector of the Canadian Light Source using a wavelength of 0.819826(2) Å (15.1 keV) from 1.6 to 75.0° 2θ with a step size of 0.0025° and a collection time of 3 minutes. The high-resolution powder diffraction data were collected using eight Dectris Mythen2 X series 1K linear strip detectors. NIST SRM 660b LaB6 was used to calibrate the instrument and refine the monochromatic wavelength used in the experiment.
An initial attempt to index the pattern using JADE Pro (MDI, 2025) yielded a primitive orthorhombic unit cell with a = 26.36474, b = 26.23073, c = 9.08646 Å, V = 6,283.89 Å3, and Z = 8. The volume indicated two formula units in the asymmetric unit. The structure could be solved and refined in space group P212121, and the cell refined to a = 26.3363(29), b = 26.2774(9), c = 9.1173(5) Å, and V = 6,309.6(11) Å3. DICVOL14 (Louër and Boultif, Reference Louër and Boultif2014) suggested a tetragonal cell with a = 26.2945, c = 9.11676 Å, and V = 6,303.34 Å3. The relatively large uncertainties on the orthorhombic lattice parameters led us to explore the possibility that the true cell was tetragonal.
The space group was ambiguous. Different space group interpreting routines suggested P42/n, P41212, P42212, P-421c, and others. Space groups P42/n and P41212 did not yield chemically reasonable structures, but P42212 did, with only one formula in the asymmetric unit. We adopted this space group as the most economical description of the crystal structure.
The structure of the dequalinium cation was downloaded from PubChem (Kim et al., Reference Kim, Chen, Cheng, Gindulyte, He, He and Li2023) as Conformer3D_COMPOUND_CID_2993.sdf. It was converted to a *.mol2 file using Mercury (Macrae et al., Reference Macrae, Sovago, Cottrell, Galek, McCabe, Pidcock and Platings2020). The structure was solved by Monte Carlo-simulated annealing techniques as implemented in EXPO2014 (Altomare et al., Reference Altomare, Cuocci, Giacovazzo, Moliterni, Rizzi, Corriero and Falcicchio2013), using a cation and two Cl atoms as fragments, and incorporating a bump penalty and [001] preferred orientation. The torsion angles in the central chain were fixed at ∼180° to keep the cation in the expected extended conformation.
Rietveld refinement was carried out with GSAS-II (Toby and Von Dreele, Reference Toby and Von Dreele2013). Only the 2.0–45.0° portion of the pattern was included in the refinements (d min = 1.071 Å). All non-H-bond distances and angles were subjected to restraints, based on a Mercury/Mogul Geometry Check (Bruno et al., Reference Bruno, Cole, Kessler, Luo, Motherwell, Purkis and Smith2004; Sykes et al., Reference Sykes, McCabe, Allen, Battle, Bruno and Wood2011). The Mogul average and standard deviation for each quantity were used as the restraint parameters. The ring systems in the cation were restrained to be planar. The restraints contributed 6.8% to the overall χ 2. The hydrogen atoms were included in calculated positions, which were recalculated during the refinement using Materials Studio (Dassault Systèmes, 2024). One U iso was refined for each ring system, and another for the C atoms of the central chain. The U iso for the two Cl anions were refined independently. The peak profiles were described using a uniaxial microstrain model, with [001] as the unique axis. The background was modeled using a six-term shifted Chebyshev polynomial, with peaks at 3.05 and 11.65° to model the narrow and broad scattering from the Kapton capillary and any amorphous component of the sample.
The final refinement of 136 variables using 17,201 observations and 89 restraints yielded the residual R wp = 0.08500. The largest peak (1.65 Å from two Cl75) and hole (2.86 Å from two Cl76) in the difference Fourier map were 0.89(22) and − 1.02(22) eÅ−3, respectively. A search for voids (using a probe radius = 1.2 Å) indicated several potential voids. Attempts to refine O atoms (water molecules) in these led to low occupancies and/or unreasonable positions, consistent with the thermogravimetric analysis in the Nie et al. (Reference Nie, Liu, Zeng, Xu and Gu2017) patent. The final Rietveld plot is shown in Figure 2. The largest features in the normalized error plot are at the 102, 432/502, 203, 403, 504, 514, 10,10,1/14,2,1, and 215 reflections. The average direction is 522. The most likely reason for these misfits is incomplete modeling of preferred orientation and/or granularity of the specimen.
The Rietveld plot for dequalinium chloride. The blue crosses represent the observed data points, and the green line represents the calculated pattern. The cyan curve is the normalized error plot, and the red line is the background curve. The blue tick marks indicate the peak positions. The vertical scale has been multiplied by a factor of 10× for 2θ > 17.5̊.

The crystal structure of dequalinium chloride Form A was optimized (fixed experimental unit cell) with density functional theory techniques using VASP (Kresse and Furthmüller, Reference Kresse and Furthmüller1996) through the MedeA graphical interface (Materials Design, 2024). The calculation was carried out on 32 cores of a 144-core (768 GB memory) HPE Superdome Flex 280 Linux server at North Central College. The calculation used the GGA-PBE functional, a plane-wave cutoff energy of 400.0 eV, and a k-point spacing of 0.5 Å−1, leading to a 1 × 1 × 2 mesh, and took ~45 days. Single-point density functional calculations (fixed experimental cell) and population analyses were carried out using CRYSTAL23 (Erba et al., Reference Erba, Desmarais, Casassa, Civalleri, Donà, Bush and Searle2023). The basis sets for the H, C, and N atoms in the calculation were those of Gatti et al. (Reference Gatti, Saunders and Roetti1994), and that for Cl was that of Peintinger et al. (Reference Peintinger, Vilela Oliveira and Bredow2013). The calculations were run on a 3.5 GHz PC using eight k-points and the B3LYP functional, and took ∼7.0 hours.
III. RESULTS AND DISCUSSION
The synchrotron powder pattern of dequalinium chloride in this study is similar enough to that reported by Nie et al. (Reference Nie, Liu, Zeng, Xu and Gu2017) for Form A (Figure 3) to conclude that they represent the same material.
Comparison of the synchrotron pattern, from this study, of dequalinium chloride (black) to that of Form A reported by Nie et al. (Reference Nie, Liu, Zeng, Xu and Gu2017) (green). The patent pattern (measured using Cu Kα radiation) was digitized using UN-SCAN-IT (Silk Scientific, 2013) and converted to the synchrotron wavelength of 0.819563(2) Å using JADE Pro (MDI, 2025). Image generated using JADE Pro (MDI, 2025).

The central decyl chain was refined and optimized to a more kinked conformation than the all-trans that might be expected in the solid state (Figure 4). The displacement coefficients of the C atoms in this chain refined to a large value (0.25 Å2). It would not be unreasonable to expect disorder in such a chain. Since an ordered model is needed for the density functional theory (DFT) optimization, we chose to let the U iso increase and not model any disorder. In the refined structure, there is a close intramolecular contact between the methyl group C27 and C11 in the chain, but this is relieved in the optimized structure by rotation of the methyl group and conformation change in the chain.
The asymmetric unit of dequalinium chloride, with the atom numbering. The atoms are represented by 50% probability spheroids. Image generated using Mercury (Macrae et al., Reference Macrae, Sovago, Cottrell, Galek, McCabe, Pidcock and Platings2020).

Despite the conventional representation in Figure 1, the ring N atoms N1 and N2 are not positively charged (Figure 5). The positive charges are distributed on the ring carbon atoms ortho (C15, C17, C16, and C18) and para (C23 and C24) to these N atoms. The C atoms of the methyl groups (C27 and C28) bear a negative charge of about −0.4 e. The most positive H atoms are H71–H74 in the amino groups.
Atomic charges in dequalinium chloride, calculated by CRYSTAL23.

The root-mean-square (rms) Cartesian displacement of the non-H atoms in the optimized structures of the dequalinium cation, calculated using the Mercury Calculate/Molecule Overlay tool, is 0.991 Å (Figure 6). The agreement is outside the normal range for correct structures (van de Streek and Neumann, Reference van de Streek and Neumann2014), but is not unprecedented (Kaduk, Reference Kaduk2025). The probable disorder in the experimental structure makes it hard to know how good an agreement should be expected. The remaining discussion will emphasize the VASP-optimized structure.
Comparison of the refined structure of the dequalinium cation (red) to the VASP-optimized structure (blue). The comparison was generated using the Mercury Calculate/Molecule Overlay tool; the root-mean-square difference is 0.991 Å. Image generated using Mercury (Macrae et al., Reference Macrae, Sovago, Cottrell, Galek, McCabe, Pidcock and Platings2020).

All of the bond distances and most bond angles and torsion angles fall within the normal ranges indicated by a Mercury Mogul Geometry check (Macrae et al., Reference Macrae, Sovago, Cottrell, Galek, McCabe, Pidcock and Platings2020). The unusual bond angles are summarized in Table I. The uncertainties on these averages are fairly small, which inflates the Z-scores, but the unusual nature of N1 may indicate some difficulty for VASP in modeling this arrangement. The torsion angles C11–C13–N1–C15 (172.8°) and C11–C13–N1–C17 (−9.2°) are flagged as unusual, and really are unusual. The torsion angle C9–C11–C13–N1 (−82.9°) lies on the tail of a minor gauche population of a trans/gauche distribution. The chain torsion angle C10–C8–C6–C5 (−151.1°) lies on the tail of a major trans population of a trans/gauche distribution. There is only one unusual torsion angle in the decyl chain, but the region around N1 seems to be truly unusual.
Unusual bond angles (Mercury/Mogul) in the VASP-optimized structure of dequalinium chloride.

Quantum chemical geometry optimization of the isolated dequalinium cation (DFT/B3LYP/6-31G*/water) using Spartan ‘24 (Wavefunction, 2023) indicated that the observed cation conformation is 23.3 kcal/mol higher in energy than the local minimum. The rms Cartesian displacement is 1.438 Å, and large differences occur in the neighborhood of N1. All of the unusual bond and torsion angles are relieved in the local minimum, showing that intermolecular interactions are important in determining the solid-state conformation. The global minimum-energy conformation is 6.1 kcal/mol lower in energy, and has an all-trans chain conformation.
The crystal structure (Figure 7) consists of an array of dequalinium cations, with chloride anions located in regions between them (Figure 8). The mean planes of the fused ring systems are approximately (5, 2, 1) and (4, −3, 1). There are short stacks of roughly parallel rings in multiple directions. The Mercury Aromatics Analyser indicates one strong interaction (distance = 3.91 Å) between the C6 aromatic rings of adjacent cations, and weak interactions (distances >8.7 Å).
The crystal structure of dequalinium chloride Form A, viewed down the c-axis. Image generated using Diamond (Crystal Impact, 2023).

Voids in the structure of dequalinium chloride (probe radius = 1.2 Å), after the chloride anions are removed. The Cl reside in some of the cavities, whereas others are apparently empty. Image generated using Mercury (Macrae et al., Reference Macrae, Sovago, Cottrell, Galek, McCabe, Pidcock and Platings2020).

Analysis of the contributions to the total crystal energy of the structure using the Forcite module of Materials Studio (Dassault Systèmes, 2024) indicates that bond, angle, and torsion distortion terms contribute about equally to the intramolecular energy. The intermolecular energy is dominated by electrostatic attractions, which in this force field-based analysis also include hydrogen bonds. The hydrogen bonds are better discussed using the results of the DFT calculation.
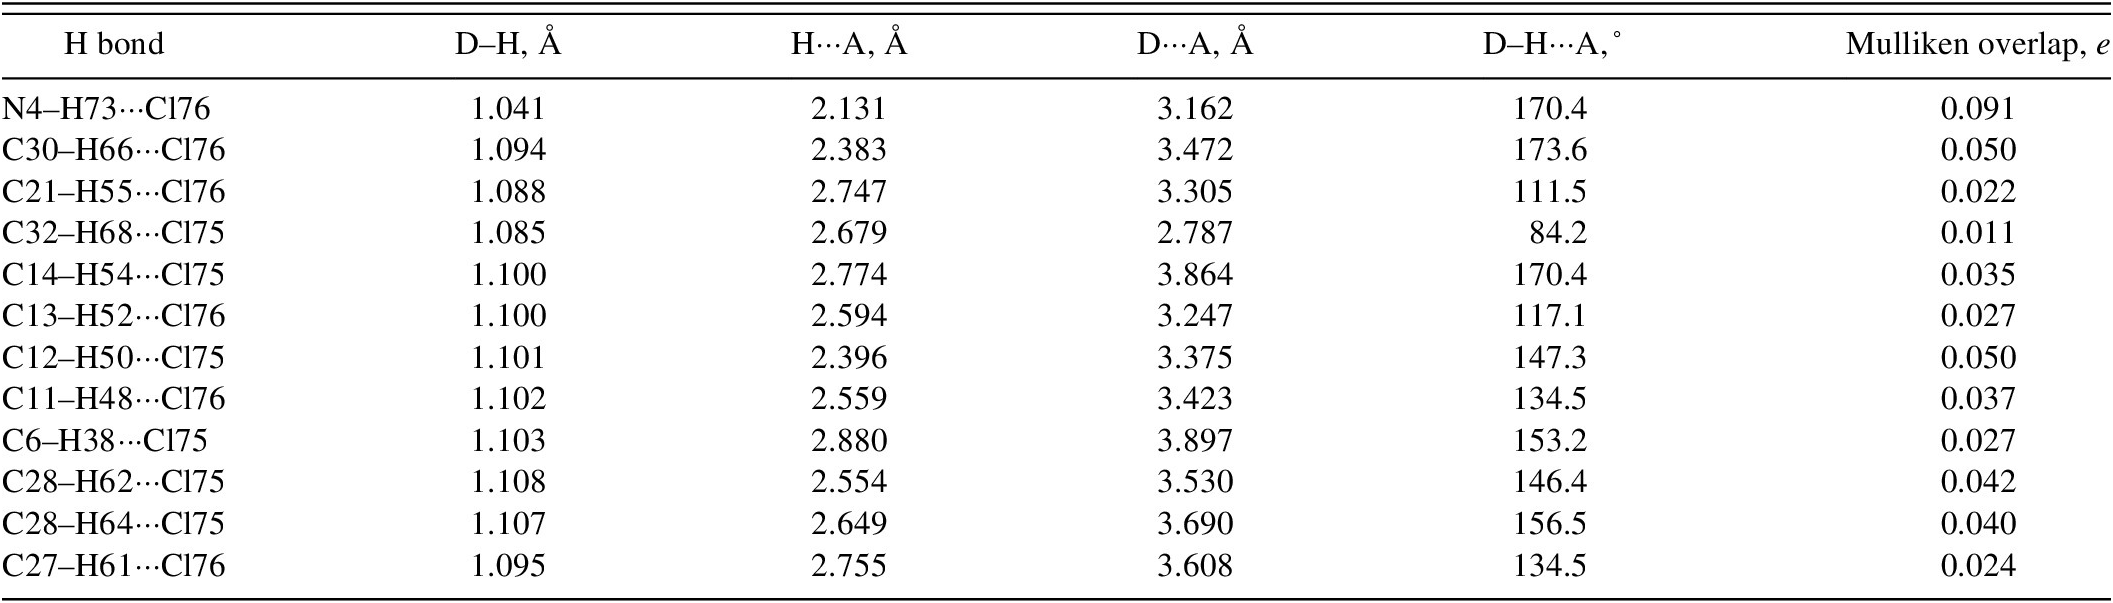
There is only one classical hydrogen bond in the structure, N4–H73···Cl76, between one of the amino groups and one of the chloride anions (Table II). The Mulliken overlap population indicates that this hydrogen bond is strong. The other amino group does not participate in hydrogen bonds. Several C–H···Cl hydrogen bonds are prominent, involving ring, chain, and methyl hydrogen atoms as donors. Particularly noteworthy are the hydrogen bonds from the first and second C atoms at each end of the decyl chain (Figure 9).
Hydrogen bonds (CRYSTAL23) in dequalinium chloride.

Hydrogen bonds in dequalinium chloride, as indicated by Mercury hydrogen bonds and close contacts. Image generated using Mercury (Macrae et al., Reference Macrae, Sovago, Cottrell, Galek, McCabe, Pidcock and Platings2020).

The volume enclosed by the Hirshfeld surface of dequalinium chloride (Figure 10; Hirshfeld, Reference Hirshfeld1977; Spackman et al., Reference Spackman, Turner, McKinnon, Wolff, Grimwood, Jayatilaka and Spackman2021) is 780.23 Å3, 99.38% of one-eighth of the unit cell volume. The packing density is thus typical. The only significant close contacts (red in Figure 10) involve the hydrogen bonds. The volume/non-hydrogen atom is larger than usual, at 21.8 Å3, reflecting both the Cl anions and the apparent empty space.
The Hirshfeld surface of dequalinium chloride Form A. Intermolecular contacts longer than the sum of the van der Waals radii are colored blue, and contacts shorter than the sum of the radii are colored red. Contacts equal to the sum of radii are white. Image generated using CrystalExplorer (Spackman et al., Reference Spackman, Turner, McKinnon, Wolff, Grimwood, Jayatilaka and Spackman2021).

The Bravais–Friedel–Donnay–Harker (Bravais, Reference Bravais1866; Friedel, Reference Friedel1907; Donnay and Harker, Reference Donnay and Harker1937) algorithm suggests that we might expect elongated morphology for dequalinium chloride Form A (Figure 11). This is in excellent agreement with the observed morphology (Figure 12). A sixth-order spherical harmonic model was included in the refinement. The texture index was 1.269(4), indicating that the preferred orientation and/or granularity was significant in this rotated capillary specimen.
The Bravais–Friedel–Donnay–Harker morphology of dequalinium chloride. Image generated using Mercury (Macrae et al., Reference Macrae, Sovago, Cottrell, Galek, McCabe, Pidcock and Platings2020).

Optical micrograph of dequalinium chloride. The lengths of several of the needles are indicated.

ACKNOWLEDGEMENTS
We thank Adam Leontowich for his assistance in the data collection. We also thank the ICDD team – Megan Rost, Steve Trimble, and Dave Bohnenberger – for their contribution to research, sample preparation, and in-house XRD data collection and verification.
FUNDING STATEMENT
Part of the research described in this paper was performed at the Canadian Light Source, a national research facility of the University of Saskatchewan, which is supported by the Canada Foundation for Innovation (CFI), the Natural Sciences and Engineering Research Council (NSERC), the Canadian Institute of Health Research (CIHR), the Government of Saskatchewan, and the University of Saskatchewan. This work was partially supported by the International Centre for Diffraction Data.
CONFLICTS OF INTEREST
The authors have no conflicts of interest to declare.
DATA AVAILABILITY STATEMENT
The powder pattern of dequalinium chloride Form A from this synchrotron dataset has been submitted to the International Centre for Diffraction Data (ICDD) for inclusion in the Powder Diffraction File. The Crystallographic Information Framework (CIF) files containing the results of the Rietveld refinement (including the raw data) and the DFT geometry optimization were deposited with the ICDD. The data can be requested at pdj@icdd.com.


 Open access