


1. Introduction
A fold-and-thrust belt generally comprises thrust-folded sedimentary sequences and can include basement and older faults (Twiss & Moores, Reference Twiss and Moores1992). The structural life cycle of a typical fold-and-thrust belt is characterized by a series of deformational phases starting with the burial of sedimentary rocks under extension, followed by the inversion of the former basin in a sequence of strike-slip and thrusting (Tavani et al. Reference Tavani, Storti, Lacombe, Corradetti, Muñoz and Mazzoli2015; Ferrill et al. Reference Ferrill, Smart, Cawood and Morris2021). Initial relaxation is represented by another strike-slip regime, followed by the final relaxation due to decreasing shortening and increasing extension (Ferrill et al. Reference Ferrill, Smart, Cawood and Morris2021). The temporal evolution of a fold-and-thrust belt, in particular the changes between the deformation phases and stress regimes, is essential to understand the associated tectonic architecture and stress development in the hinterland.
Intraplate fold-and-thrust belts result from localized shortening of sedimentary basins distal from the plate boundary, such as the Tajik basins (e.g. Stübner et al. Reference Stübner, Ratschbacher, Rutte, Stanek, Minaev, Wiesinger and Gloaguen2013) or the Sevier and Bighorn basins in the USA, and in North America (e.g. van der Pluijm et al. Reference van der Pluijm, Craddock, Graham and Harris1997; Beaudoin & Lacombe, Reference Beaudoin and Lacombe2018). A prominent example of intraplate shortening is the European Alpine Foreland (e.g. Ziegler et al. Reference Ziegler, Cloetingh and van Wees1995; Cloetingh & van Wees, Reference Cloetingh and van Wees2005). In this region, several palaeostress analyses reveal multiple alternating and overlapping phases of contractional and extensional deformation during the Mesozoic and Cenozoic times (Bergerat, Reference Bergerat1987; Blés et al. Reference Blés, Bonijoly, Castaing and Gros1989; Hibsch et al. Reference Hibsch, Jarrige, Cushing and Mercier1995; Peterek et al. Reference Peterek, Rauche and Schröder1996; Kley & Voigt, Reference Kley and Voigt2008; Sippel et al. Reference Sippel, Scheck-Wenderoth, Reicherter and Mazur2009, Reference Sippel, Saintot, Heeremans and Scheck-Wenderoth2010; Coubal et al. Reference Coubal, Málek, Adamovič and Štěpančíková2015; Navabpour et al. Reference Navabpour, Malz, Kley, Siegburg, Kasch and Ustaszewski2017). Such phases of deformation were linked to the opening of the Neotethys during the Permian to Early Mesozoic time, the onset of Atlantic rifting, and the development of an active margin between the European and African plates (Scheck-Wenderoth et al. Reference Scheck-Wenderoth, Krzywiec, Zühlke, Maystrenko, Froitzheim and McCann2008).
Previous palaeostress reconstructions from the Franconian Platform in southern Germany, based on fault-slip analysis and subordinate stylolite stress inversion, reveal regionally and temporally differing stress fields (Peterek et al. Reference Peterek, Rauche and Schröder1996, Reference Peterek, Rauche, Schröder, Franzke, Bankwitz and Bankwitz1997). Moreover, geo- and thermochronological studies indicate the existence of several intervening extensional phases during the Late Cretaceous and Cenozoic convergence between Europe and Africa (Abratis et al. Reference Abratis, Mädler, Hautmann, Leyk, Meyer, Lippolt and Viereck-Götte2007; von Eynatten et al. Reference von Eynatten, Dunkl, Brix, Hoffmann, Raab, Thomson and Kohn2019, Reference von Eynatten, Kley, Dunkl, Hoffmann and Simon2021). So far, however, the stress field evolution was not correlated with neighbouring areas nor was it placed in the context of major tectonic events affecting the area, e.g. Late Cretaceous inversion and subsequent Alpine shortening (Bergerat & Geyssant, Reference Bergerat and Geyssant1982; Peterek et al. Reference Peterek, Rauche and Schröder1996, Reference Peterek, Rauche, Schröder, Franzke, Bankwitz and Bankwitz1997).
We aim to extend the interpretation of the tectonic history of Central Europe by increasing the temporal and spatial resolution of the palaeostress evolution in the Mesozoic sequences west of the Franconian fault zone compared to previous work by using fault-slip and stylolite stress inversion.
With our work we contribute to the understanding of the stress development and the development of intra-continental areas in close vicinity to mountain chains. In addition, the high local resolution allows for identifying local stress perturbations in predicted stress fields.
2. Geological setting
The Franconian Platform is situated immediately west of the Bohemian Massif (Fig. 1c) and consists of Mesozoic and Cenozoic sedimentary rocks (Freudenberger & Schwerd, Reference Freudenberger and Schwerd1996). The rocks of the Variscides (Kossmat, Reference Kossmat1927) exposed in the Bohemian Massif are buried in the west beneath the Kraichgau Basin fill and the sediments of the Franconian Platform (Paul & Schröder, Reference Paul and Schröder2012; Sittig, Reference Sittig2012; Kämmlein et al. Reference Kämmlein, Bauer and Stollhofen2020; Fazlikhani et al. Reference Fazlikhani, Bauer and Stollhofen2022). The structural framework at the eastern basin margin is dominated by a NW–SE-striking fault network, the most prominent elements of which are the Franconian and the Eisfeld–Kulmbach fault zones.
(a) Simplified geological map of the study area (Digitale Geologische Karte von Bayern 1:25 000, 2020; available via https://www.lfu.bayern.de/geologie/geo_karten_schriften/dgk25_uab/index.htm) showing the location of Lindau 1 drill site. (b) Position of the study area (red rectangle) in the frame of the German borders. (c) Location of the study area (red rectangle), including the Franconian Platform in a Central European context (simplified after Dèzes et al. Reference Dèzes, Schmid and Ziegler2004), showing exposures of Variscan basement, major Variscan strike-slip faults, the Neogene Deformation Front, the North Alpine Foreland Basin and other important Cenozoic basins. (d) NE–SW-directed cross-section through the northern part of the study area, simplified after Fazlikhani et al. (Reference Fazlikhani, Bauer and Stollhofen2022).

The Variscan basement was affected by Late Variscan NNW–SSE shortening resulting in final folding and the activation of NE–SW- and NW–SE-striking sinistral and dextral strike-slip systems (Kroner et al. Reference Kroner, Hahn, Romer, Linnemann, Linnemann, Nance, Kraft and Zulauf2007; Büttner, Reference Büttner2012; Stephan et al. Reference Stephan, Kroner, Hahn, Hallas and Heuse2016). Beginning in the latest Carboniferous, predominant extensional tectonics associated with the incipient break-up of Pangaea (Kroner & Romer, Reference Kroner and Romer2013) led to fault reactivation and formation of structures that follow the strike of pre-existent basin structures and faults (Peterek et al. Reference Peterek, Rauche, Schröder, Franzke, Bankwitz and Bankwitz1997). These latest to post-Variscan tectonics initiated subsidence and the development of WNW- and N- to NE-striking graben systems in Central Europe (Scheck-Wenderoth et al. Reference Scheck-Wenderoth, Krzywiec, Zühlke, Maystrenko, Froitzheim and McCann2008).
Triassic deposits in the study area are fairly tabular with local lateral thickness changes and limited faulting, indicating continuous regional tectonic quiescence (Fig. 1d; Fazlikhani et al. Reference Fazlikhani, Bauer and Stollhofen2022).
During the Late Jurassic to Early Cretaceous time (75–55 Ma) the study area was dominated by regional uplift and subsidence to the west of the Bohemian Massif associated with NE–SW-directed horizontal extension (Peterek et al. Reference Peterek, Rauche and Schröder1996, Reference Peterek, Rauche, Schröder, Franzke, Bankwitz and Bankwitz1997; Scheck-Wenderoth et al. Reference Scheck-Wenderoth, Krzywiec, Zühlke, Maystrenko, Froitzheim and McCann2008; von Eynatten et al. Reference von Eynatten, Kley, Dunkl, Hoffmann and Simon2021). Late Jurassic sedimentation is controlled by the transgression of the Tethys Ocean from the south which produced a massive carbonate platform (Meyer & Schmidt-Kaler, Reference Meyer and Schmidt-Kaler1990). For most parts of Central Europe, including large parts of SE Germany, normal faults bounding NW–SE striking graben systems were active at that time, e.g. grabens of the South German Basin (Peterek et al. Reference Peterek, Rauche, Schröder, Franzke, Bankwitz and Bankwitz1997; Zulauf & Duyster, Reference Zulauf and Duyster1997; Walter, Reference Walter2007; Kley & Voigt, Reference Kley and Voigt2008; Scheck-Wenderoth et al. Reference Scheck-Wenderoth, Krzywiec, Zühlke, Maystrenko, Froitzheim and McCann2008; Sippel et al. Reference Sippel, Scheck-Wenderoth, Reicherter and Mazur2009; Navabpour et al. Reference Navabpour, Malz, Kley, Siegburg, Kasch and Ustaszewski2017). According to Navabpour et al. (Reference Navabpour, Malz, Kley, Siegburg, Kasch and Ustaszewski2017) this phase of normal faulting is also recorded in Middle Triassic rocks in the Thuringian Basin towards the north.
During Late Cretaceous time, the convergence between Iberia–Africa and Europe caused widespread uplift in Central Europe (Kley & Voigt, Reference Kley and Voigt2008; Dielforder et al. Reference Dielforder, Frasca, Brune and Ford2019). Increasing thicknesses and coarsening trends of conglomerates in Lower and Upper Cretaceous units from the (S)W towards (N)E (Hejl et al. Reference Hejl, Coyle, Lal, van den Haute and Wagner1997; Tanner et al. Reference Tanner, Behrmann, Oncken and Weber1998; Niebuhr et al. Reference Niebuhr, Wilmsen and Janetschke2014) suggest the reactivation of ten to hundreds of kilometres long NW-striking faults (e.g. Pfahl shear zone, Franconian fault zone, Danube shear zone; Schröder, Reference Schröder1987; Scheck-Wenderoth et al. Reference Scheck-Wenderoth, Krzywiec, Zühlke, Maystrenko, Froitzheim and McCann2008). This intraplate compression, together with lithospheric buckling, i.e. long wavelengths and low amplitudes, affected large parts of the South German Basin (Scheck-Wenderoth et al. Reference Scheck-Wenderoth, Krzywiec, Zühlke, Maystrenko, Froitzheim and McCann2008). It lasted until Palaeocene time (Voigt et al. Reference Voigt, Kley and Voigt2021) and was accompanied by the inversion of pre-existing grabens (Schröder, Reference Schröder1987; Scheck-Wenderoth et al. Reference Scheck-Wenderoth, Krzywiec, Zühlke, Maystrenko, Froitzheim and McCann2008) and reactivation of NW-trending fault zones (Peterek et al. Reference Peterek, Rauche, Schröder, Franzke, Bankwitz and Bankwitz1997; Tanner et al. Reference Tanner, Behrmann, Oncken and Weber1998). Comparing the timing of tectonic activity in individual regions reveals that the inferred relative-chronological order of reverse and strike-slip faulting suggested for Late Cretaceous time does not coincide, even across directly neighbouring areas (Bergerat & Geyssant, Reference Bergerat and Geyssant1982; Peterek et al. Reference Peterek, Rauche and Schröder1996; Sippel et al. Reference Sippel, Scheck-Wenderoth, Reicherter and Mazur2009; Navabpour et al. Reference Navabpour, Malz, Kley, Siegburg, Kasch and Ustaszewski2017). From the Franconian Platform, for instance, the relative order of thrusting and strike-slip faulting was not possible so far (Peterek et al. Reference Peterek, Rauche and Schröder1996) while in the Thuringian Basin farther north, strike-slip movements occurred prior to reverse faulting (Navabpour et al. Reference Navabpour, Malz, Kley, Siegburg, Kasch and Ustaszewski2017).
From Eocene to late Oligocene time there is no direct structural evidence for tectonic activity (Peterek et al. Reference Peterek, Rauche, Schröder, Franzke, Bankwitz and Bankwitz1997). In Oligocene and early Miocene time, volcanism penetrates the Franconian Platform marked by the 19–24 Ma Oberpfalz volcanics to the east (c. 50 km to the city of Bayreuth) (Todt & Lippolt, Reference Todt and Lippolt1975) and the c. 31 Ma ultramafic Oberleinleiter volcanics ESE (c. 15 km from the city of Bamberg) (Hofbauer, Reference Hofbauer2008). Since Eocene time, contemporaneously forming grabens of the European Cenozoic Rift System (ECRIS) record a variety of extensional directions with the WNW–ESE-directed opening of the NNE–SSW-striking Upper Rhine Graben providing the most prominent example (Ziegler, Reference Ziegler1992). The NE–SW-striking Eger Rift, however, initially opened NNE– SSW to N–S and then became overprinted by later NW–SE opening (Ziegler, Reference Ziegler1992; Schröder et al. Reference Schröder, Ahrendt, Peterek and Wemmer1997; Abratis et al. Reference Abratis, Mädler, Hautmann, Leyk, Meyer, Lippolt and Viereck-Götte2007; Rajchl et al. Reference Rajchl, Uličný, Grygar and Mach2009).
Collision between Europe and Adria–Africa culminated in the formation of the European Alps and triggered intraplate shortening to the north (Rosenbaum et al. Reference Rosenbaum, Lister and Duboz2002; Scheck-Wenderoth et al. Reference Scheck-Wenderoth, Krzywiec, Zühlke, Maystrenko, Froitzheim and McCann2008; Glotzbach et al. Reference Glotzbach, Reinecker, Danišík, Rahn, Frisch and Spiegel2010). Dèzes et al. (Reference Dèzes, Schmid and Ziegler2004) propose a correlation of contemporaneous volcanism, the opening of the European Cenozoic Rift System (ECRIS) and N-directed shortening induced by the Alpine Orogeny. In the North Alpine Foreland Basin, the increasing tectonic load of the northward-propagating Alpine thrusts led to subsidence and bulging of the lower plate associated with a normal faulting regime in the extensional area of the bulge (von Hartmann et al. Reference von Hartmann, Tanner and Schumacher2016). Thus the Franconian Platform was affected by the opening of the Eger Rift towards the east and the Alpine collision towards the south (Adamovič & Coubal, Reference Adamovič and Coubal1999; Reicherter et al. Reference Reicherter, Froitzheim, Jarosinski, Badura, Franzke, Hansen, Hübscher, Müller, Poprawa, Reinecker, Stackebrandt, Voigt, von Eynatten, Zuchiewicz and McCann2008; Rajchl et al. Reference Rajchl, Uličný, Grygar and Mach2009). Towards the east of our study area, historical and recent earthquakes register ongoing seismic activity (Wilde-Piórko et al. Reference Wilde-Piórko, Geissler, Plomerová, Knapmeyer-Endrun, Grad, Babuška, Brückl, Cyziene, Czuba, England, Gaczyński, Gazdova, Gregersen, Guterch, Hanka, Hegedűs, Heuer, Jedlička, Lazauskiene, Keller, Kind, Klinge, Kolinsky, Komminaho, Kozlovskaya, Krüger, Larsen, Majdański, Malek, Motuza, Novotný, Pietrasiak, Plenefisch, Růžek, Sliaupa, Środa, Świeczak, Tiira, Voss and Wiejacz2006), and mofettes and thermal springs imply deep-reaching zones of structural permeability extending from the Eger Rift across the Franconian fault zone (e.g. Heinicke et al. Reference Heinicke, Stephan, Alexandrakis, Gaupp and Buske2019). In the research borehole Lindau 1, near Bayreuth (Fig. 1a), the mean direction of the maximum present-day horizontal stress, derived from borehole breakouts and from hydraulic stimulation experiments, is 135° and 138° (NW–SE), respectively (Röckel & Wonik, Reference Röckel and Wonik2006). This differs only slightly from results of Reicherter et al. (Reference Reicherter, Froitzheim, Jarosinski, Badura, Franzke, Hansen, Hübscher, Müller, Poprawa, Reinecker, Stackebrandt, Voigt, von Eynatten, Zuchiewicz and McCann2008) and Heidbach et al. (Reference Heidbach, Rajabi, Reiter and Ziegler2016), who claim that the present-day stress field in our study area is dominated by N(N)W–S(S)E-directed compression.
3. Methods
In order to reconstruct palaeostress fields, we combine two methods, fault-slip analysis (Angelier, Reference Angelier1984) and stylolite stress inversion (Koehn et al. Reference Koehn, Ebner, Renard, Toussaint and Passchier2012; Beaudoin et al. Reference Beaudoin, Koehn, Lacombe, Lecouty, Billi, Aharonov and Parlangeau2016). In addition to faults and stylolites (e.g. Figs 2a and 3b), we use related structures such as folds (e.g. Fig. 2c), joints and veins to derive relative age relationships from field studies. We apply the term fracture for brittle deformation structures (e.g. joints) without fault planes on the metre scale in outcrops, whereas the term fault (F) is used for fault planes on metre scale as well as in outcrop scale (50 to 1000 m). We apply the term fault zone (FZ) for fault planes on map scale (1 to 100 km). A fault zone may include a set of sub-parallel faults with similar kinematics. We assume that large single faults that would fit this definition form an exception in our study area.
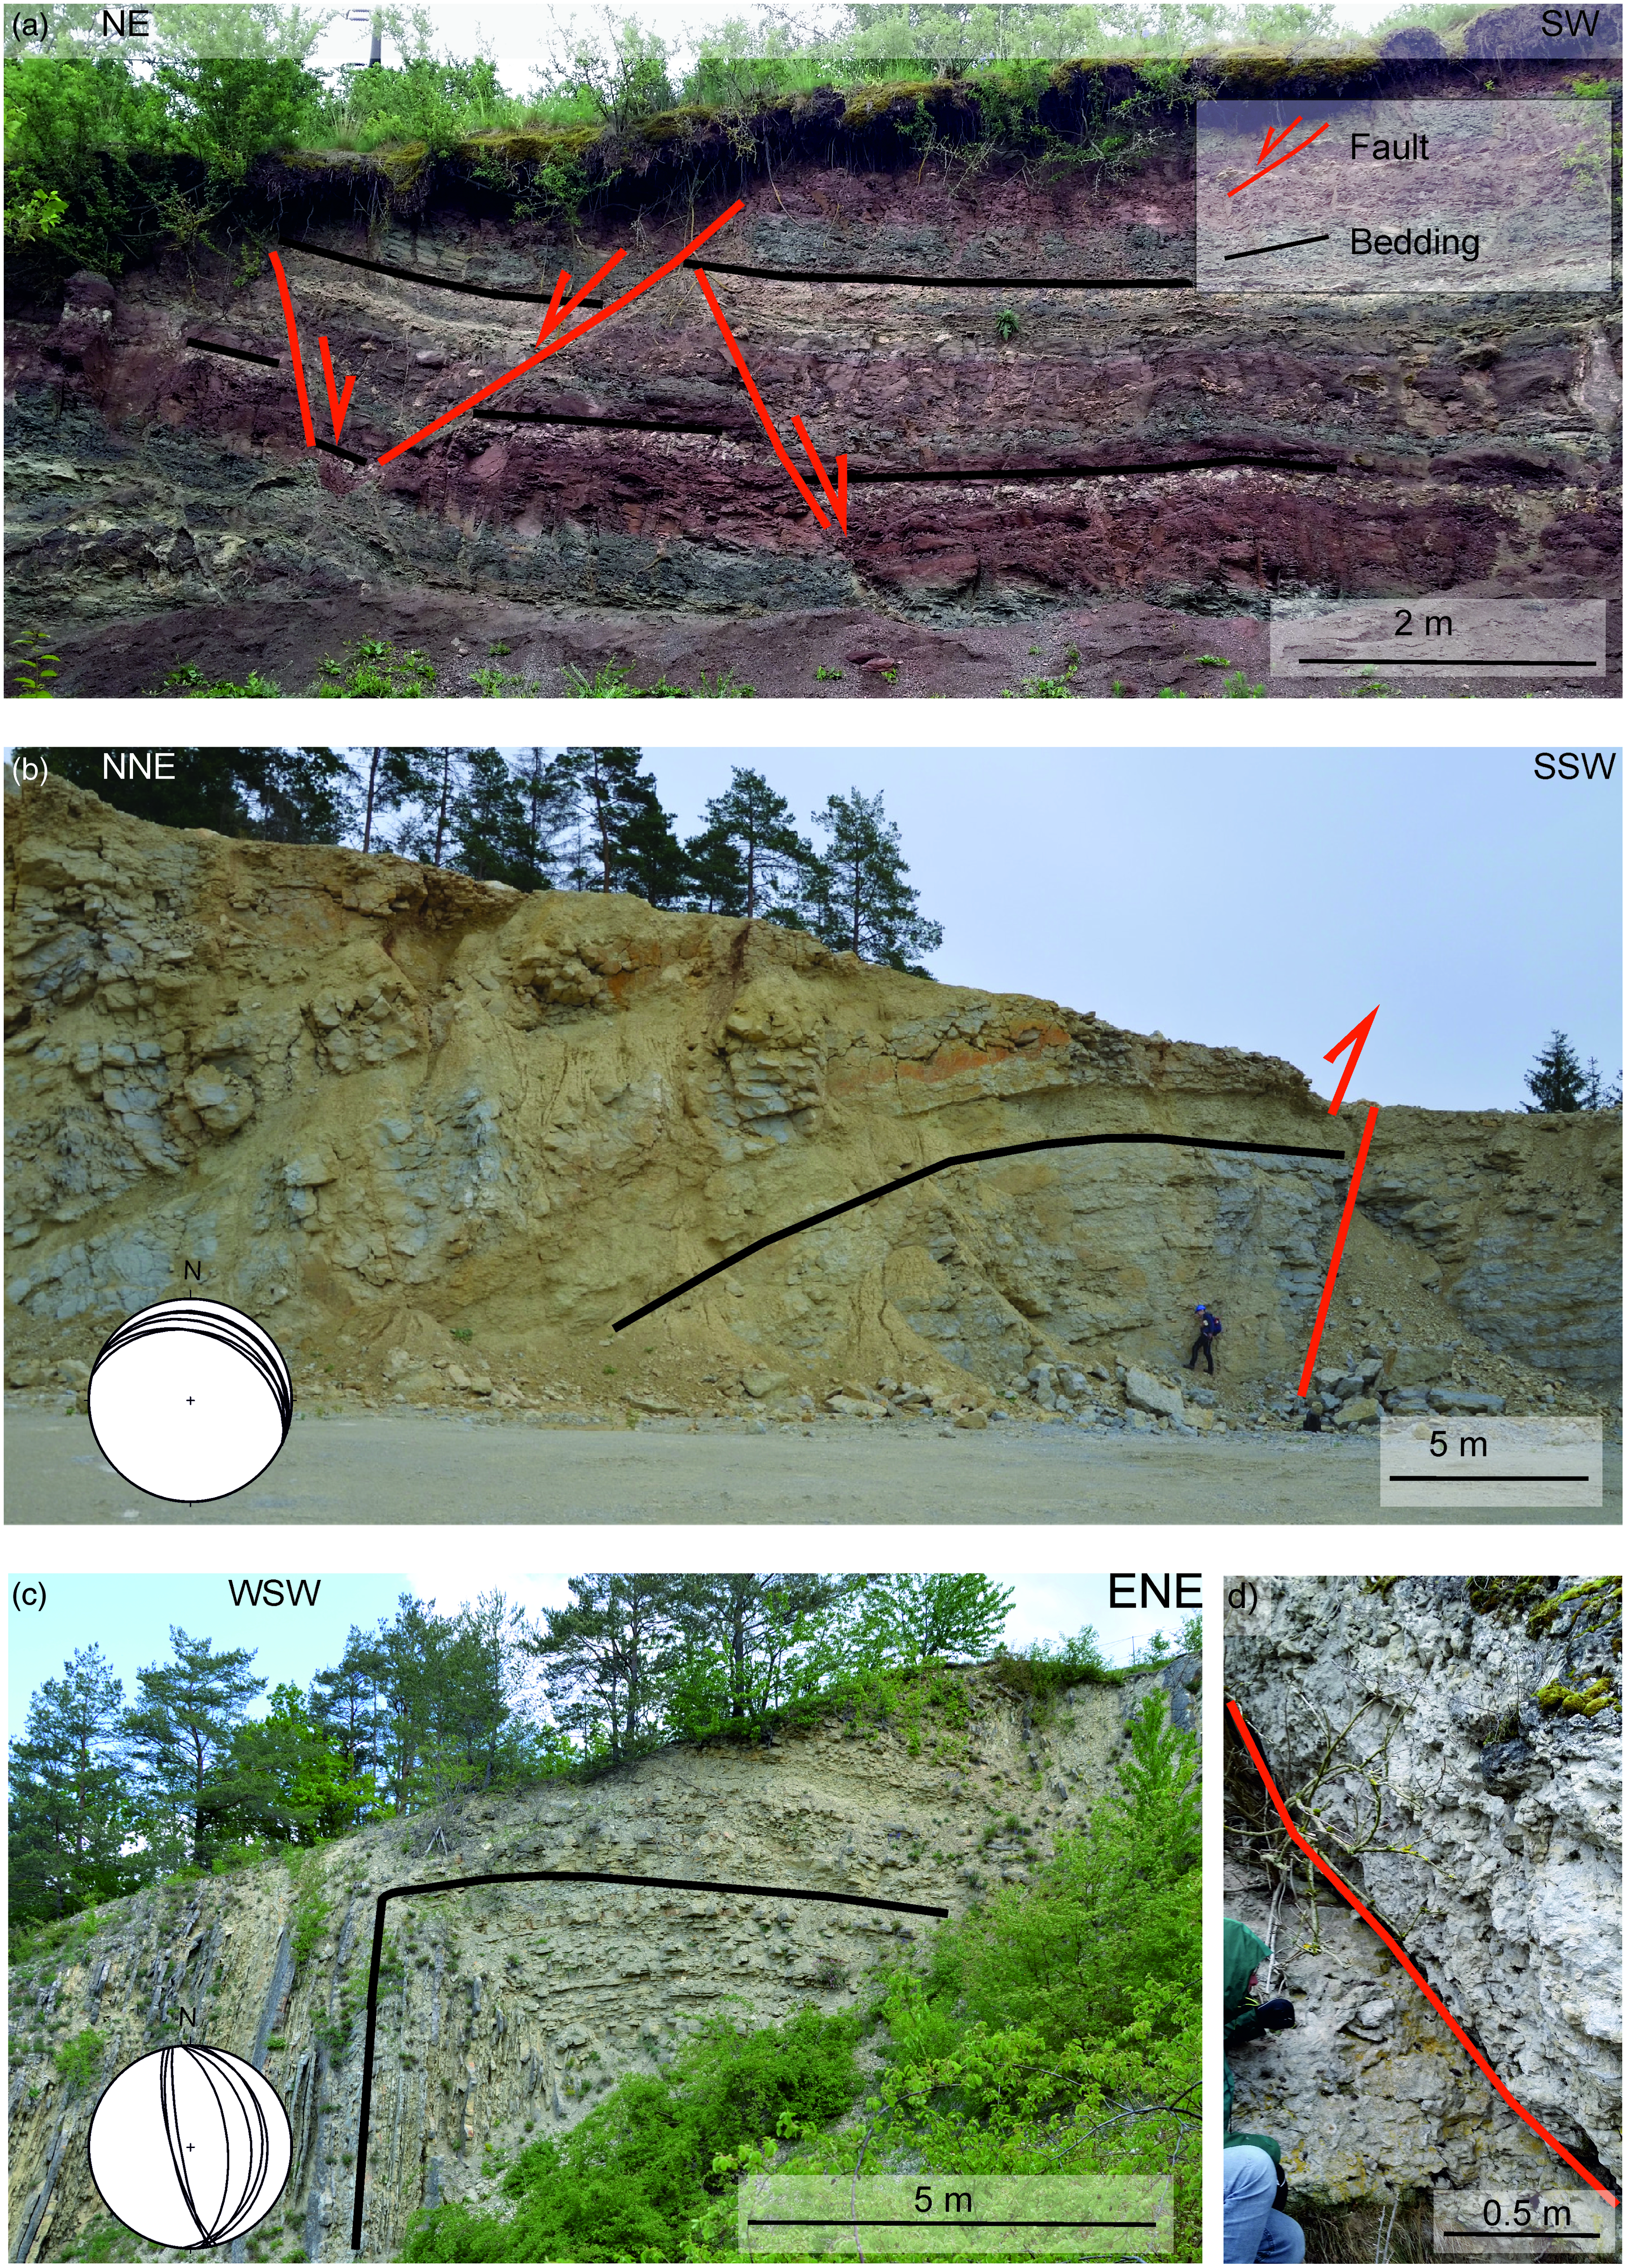
(a) NE-striking wall of Upper Triassic Keuper sandstone in outcrop 9 (locality Kleinbardorf) showing NE- and SW-dipping normal faults. (b) Fold in the active quarry of outcrop 4b (locality Serkendorf), in Upper Jurassic (Malm) limestones, resulting from SSW–NNE compression. The inset shows the orientation of bedding planes in a stereographic projection (lower hemisphere). (c) Photo from outcrop 3b (locality Herlas), showing a WSW-vergent fold in Middle Triassic (Muschelkalk) limestones. The inset shows the orientation of bedding planes in a stereographic projection (lower hemisphere). (d) Field picture from outcrop 5b (locality Königsfeld). The visible facture is interpreted as a fault plane with unknown sense of slip.
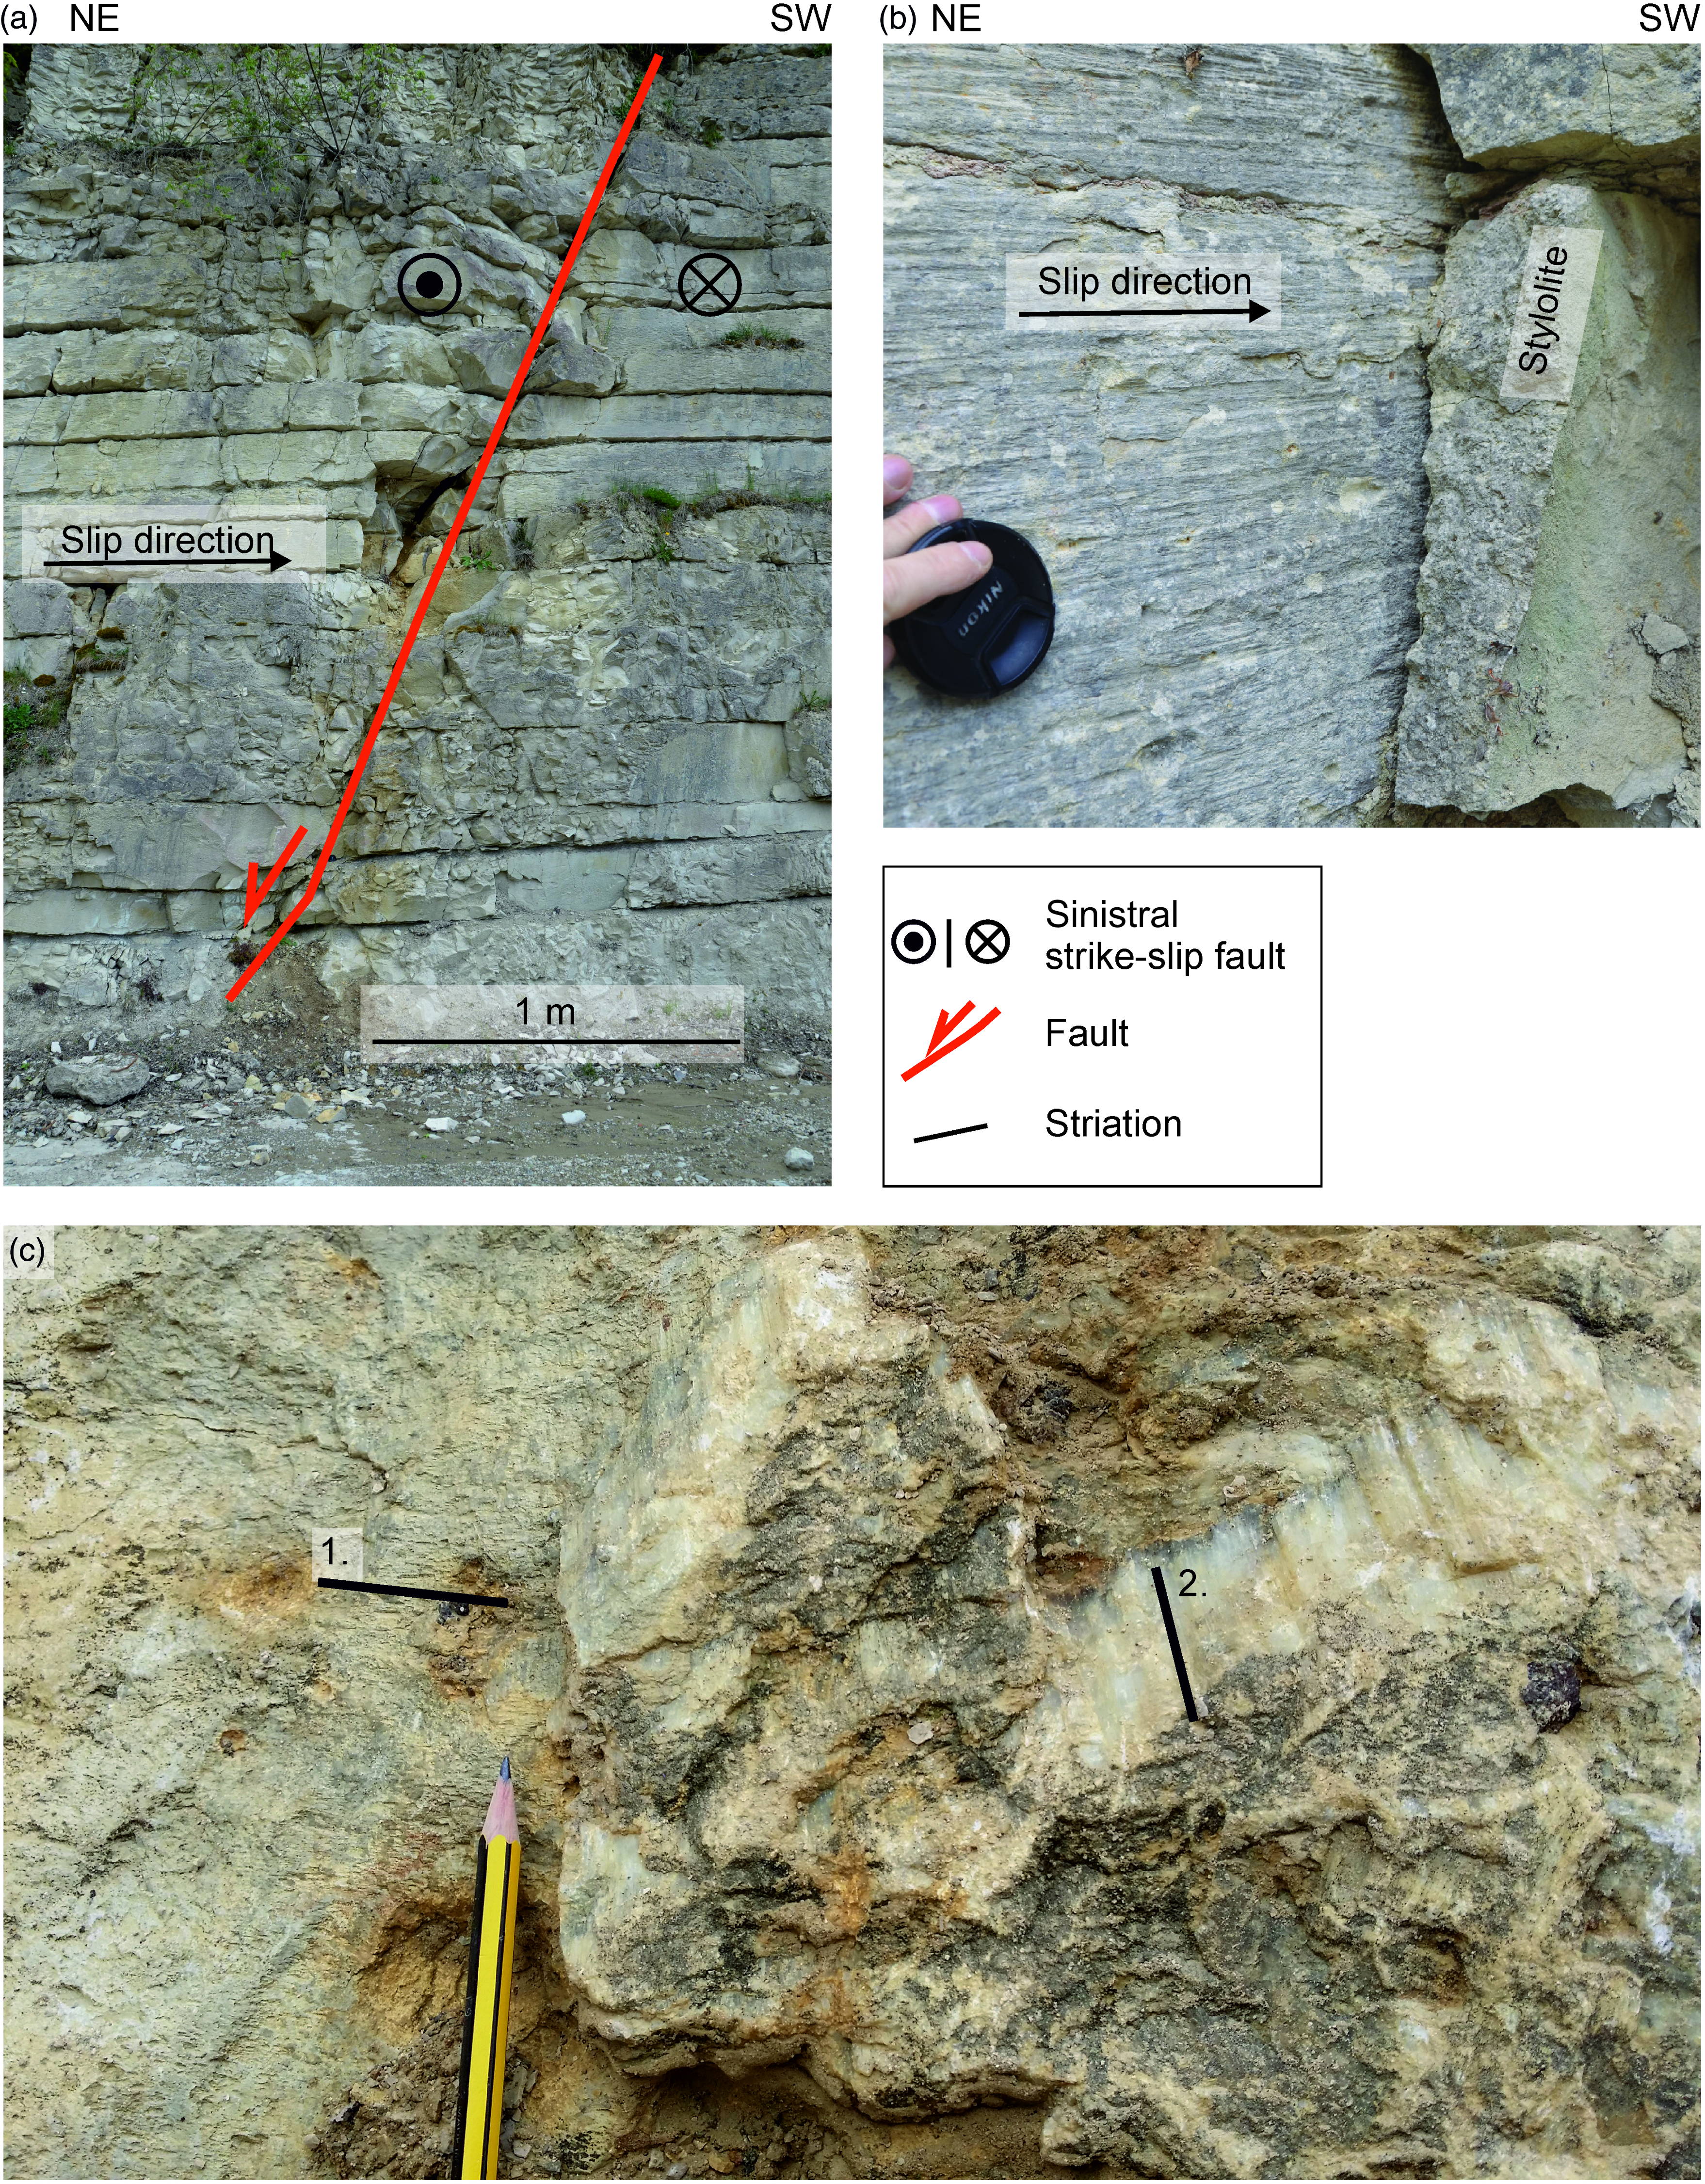
(a) Outcrop photo from group 2 (locality Kirchleus), exposing Jurassic limestones showing a NE-striking dextral fault plane, cross-cut by (i) normal and (ii) sinistral strike-slip faults. (b) Photo in close proximity to (a), showing the dextral strike-slip fault offsetting a tectonic stylolite with NE–SW-directed teeth. (c) Outcrop photo from group 10 (locality Hartmannshof), showing striations two directions. The small numbers indicate the relative chronology.
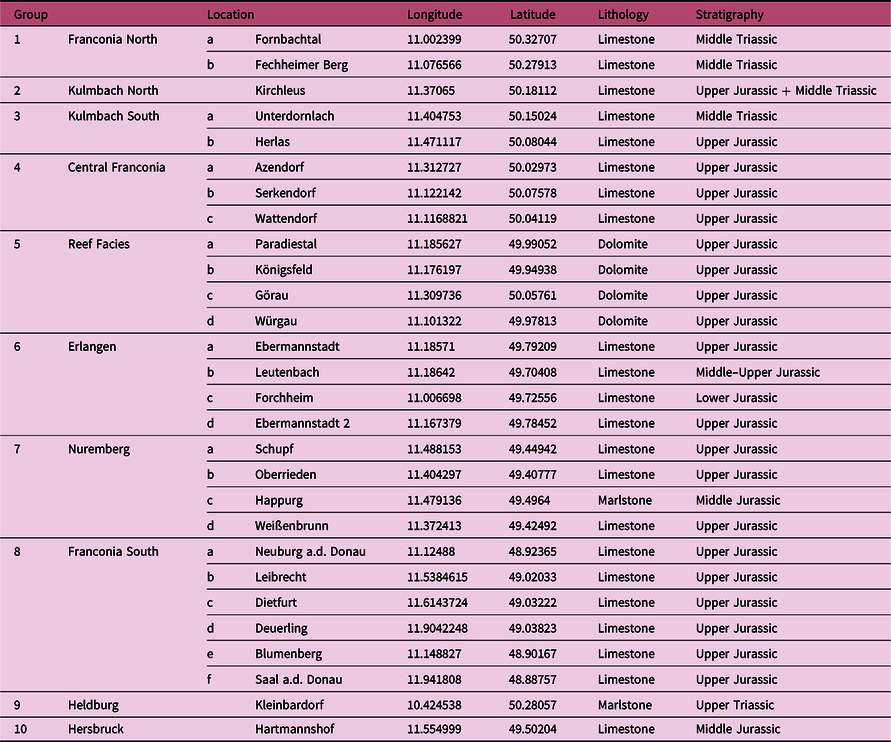
Coordinates, lithologies and stratigraphic positions of all field measurement locations are summarized in Table 1. We pooled the direction measurements into key outcrop groups according to their geographical location, their relation to large-scale faults and the sedimentary facies. Most of the outcrops are located in carbonate rocks. All locations in outcrop group 1 (Franconia North) are stratigraphically positioned in the Middle Triassic (Muschelkalk). Groups 2 and 3 (Kulmbach North and South; Figs 3a and 2c, respectively) are distinguished, based on a kink in the strike direction of the Eisfeld–Kulmbach FZ from NW–SE in its southern part towards WNW–ESE in the northern part. Groups 4 and 5 (Central Franconia and Reef Facies; Fig 2b and d, respectively) are Upper Jurassic (Malm) carbonate rocks located within the Franconian Platform, with group 4 consisting of layered limestone and group 5 consisting of massive reef dolomite. Group 7 (Nuremberg) is distinguished from the neighbouring locations of groups 6 and 10 (Erlangen and Hersbruck, respectively) due to its location south of the W–E-striking Hersbruck FZ and because it has a high amount of stylolites with a low amount of fault planes (see Section 4a below and Fig. 4). Group 8 is defined by the location of the outcrops in the south of the study area with a large extension in E-W direction. Group 9 includes outcrops of Upper Triassic (Keuper) sedimentary rocks (Fig. 2a). Tectonic stylolites are rough surfaces formed by pressure solution (Park & Schot, Reference Park and Schot1968). They are associated with layer-parallel shortening tangential to the bedding. Stylolite teeth grow parallel to the largest principal stress σ1 (Nitecki, Reference Nitecki1962; Koehn et al. Reference Koehn, Renard, Toussaint and Passchier2007). Thus, a stylolite plane with orthogonal teeth is perpendicular to the σ1 direction. However, there is a continuous transition from stylolites associated with layer-parallel shortening through stylolites with tilted planes and oblique teeth and slickolites that develop on fault planes where teeth still preserve the direction of the σ1 (Nitecki, Reference Nitecki1962; Koehn et al. Reference Koehn, Renard, Toussaint and Passchier2007, Reference Koehn, Ebner, Renard, Toussaint and Passchier2012; Toussaint et al. Reference Toussaint, Aharonov, Koehn, Gratier, Ebner, Baud, Rolland and Renard2018). The intermediate and smallest principal stresses σ2 and σ3 lay in the stylolite plane. Field observations, however, do not allow determination of their exact orientations (Schmittbuhl et al. Reference Schmittbuhl, Renard, Gratier and Toussaint2004; Ebner et al. Reference Ebner, Toussaint, Schmittbuhl, Koehn and Bons2010).
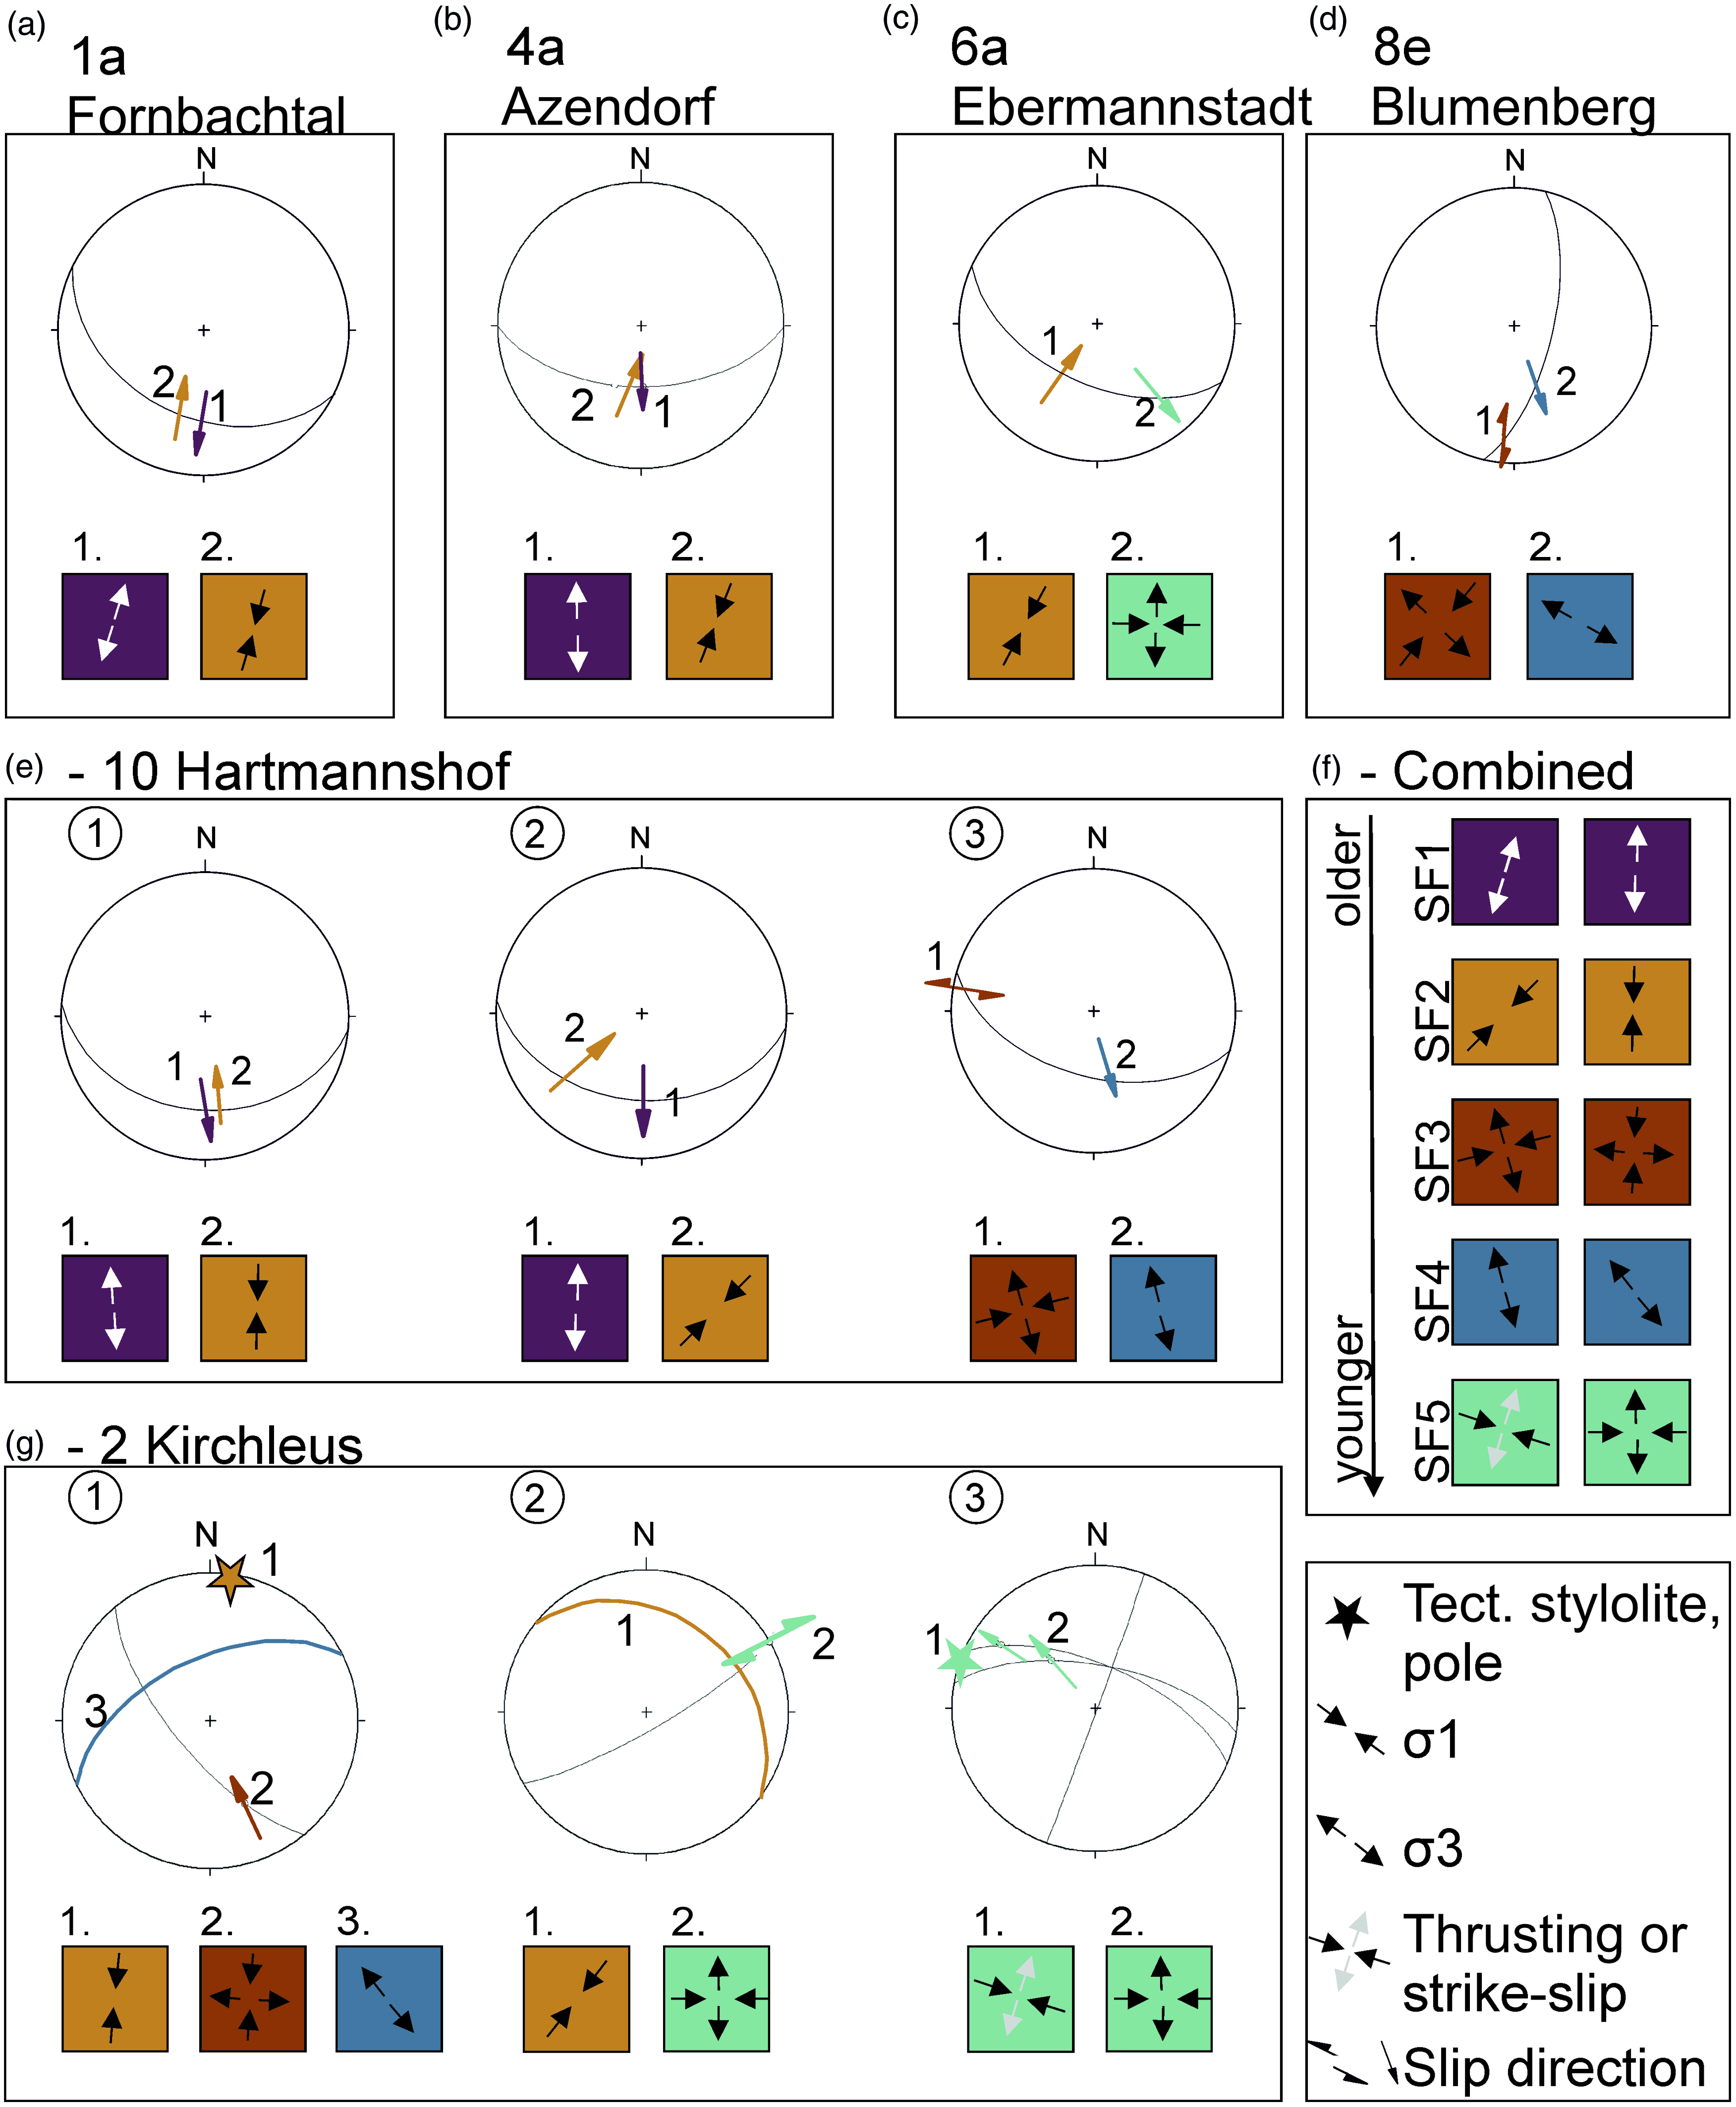
Outcrop information
Single measurements of fault planes and fault lineation (if applicable) and their relative chronology (based on cross-cuttings and multiple striations), plotted as stereographic projection, lower hemisphere. Kinematic directions of the single measurements can differ from the overall stress fields. Boxes beneath projections and on the right show the schematic direction of the highest (inward arrows) and lowest (outward arrows) horizontal stresses (map view, against north) in their relative chronological order. Colours refer to the stress field. See Table 1 for further details on outcrop groups.
Here, we recorded tectonic stylolites as planar features with dip angle and dip direction together with the azimuth of the stylolite teeth as linear features.
Measured faults are categorized into three groups according to the quality of the measurement and the reliability of their sense of movement indicators (sides of steep teeth) (Sippel et al. Reference Sippel, Scheck-Wenderoth, Reicherter and Mazur2009; Sperner & Zweigel, Reference Sperner and Zweigel2010). We measured a total of 546 faults and 432 tectonic stylolites at 28 locations (Table 1; Figs 5, 6); all data are available online via https://doi.pangaea.de/10.1594/PANGAEA.929490 (Köhler et al. Reference Köhler, Bücker, Hofmann and Koehn2021).
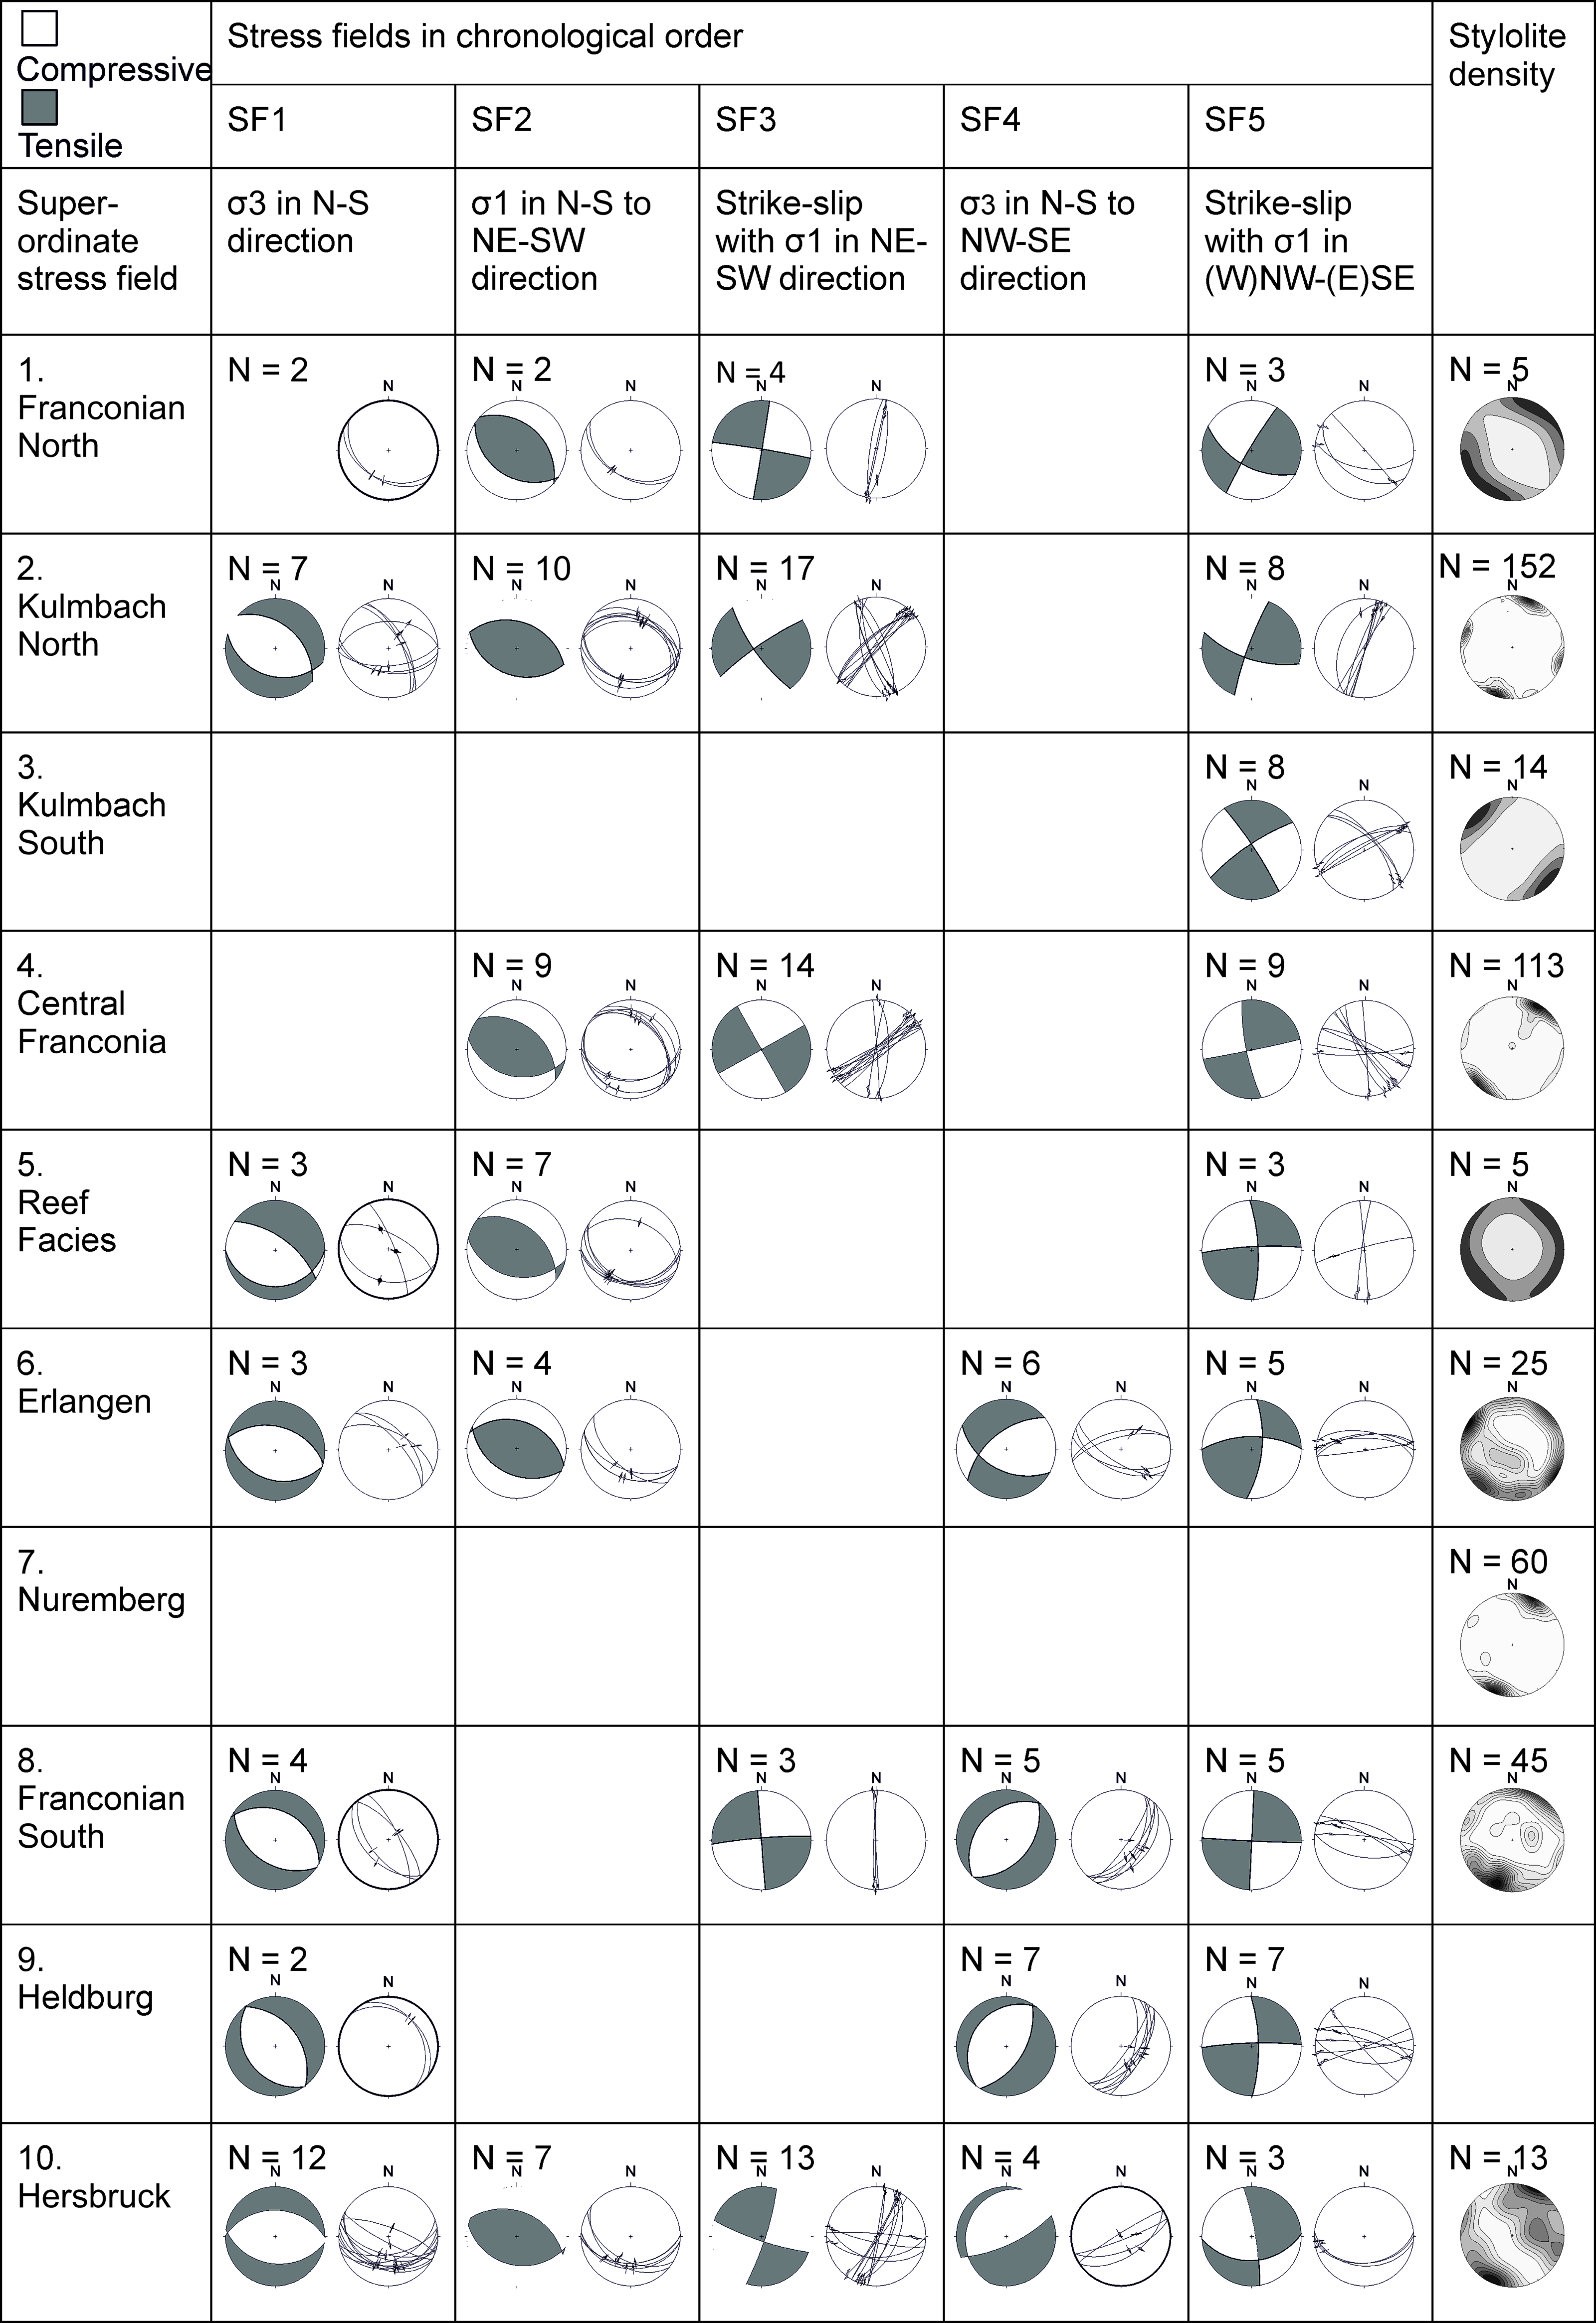
Beachball plots and stereographic projections (lower hemisphere) of all analysed faults and inferred stress fields 1–5. The rightmost column shows density plots of the measured tectonic stylolites. See Table 1 for further details on outcrop groups, individual locations and their coordinates, lithologies and stratigraphy.

The stress history based on fault-slip inversion (PBT axes method) was reconstructed using the software Tectonics FP (Reiter & Acs, Reference Reiter and Acs2020). The PBT method is based on the assumption that fault planes develop at an angle of 30° to σ1 (Anderson, Reference Anderson1972). This is in agreement with the observation that conjugate fault planes form angles of c. 60°. For each fault-slip datum the respective P- (compressional axis, σ1), B- (neutral axis, σ2) and T- (tensional axis, σ3) were constructed graphically (Turner, Reference Turner1953; Ortner et al. Reference Ortner, Reiter and Acs2002). Following Sippel et al. (Reference Sippel, Scheck-Wenderoth, Reicherter and Mazur2009), we subdivided the calculated data into distinct homogeneous clusters of PBT axes orientations. Following Wallbrecher (Reference Wallbrecher1986), Tectonics FP calculates the mean vectors and concentration parameter R% (Ortner et al. Reference Ortner, Reiter and Acs2002). We excluded faults which do not fall into a cluster with at least ten data points and with a minimum R% value of 90 %. We constructed clusters for (i) the entire working area, defining superordinate stress fields, and (ii) the aforementioned outcrop groups to analyse local variations in stress orientation, and compared these to mapped faults. To perform the palaeostress inversion at local resolution, the locations were split into ten groups as explained before (Table 1).
A stress field is defined by spatial uniformity or variability of a certain aspect of the stress tensor that persisted over a certain time in the geological past. Here, we use the following terms to describe a stress field: The magnitude of the vertical stress (σv) is the integral of the weight of the overburden. Only at the Earth’s surface is σv a principal stress axis of the stress tensor whereas σv can deviate from a principal stress orientation at greater depths. When σv is a principal stress axis, the maximum and minimum horizontal stresses (σHmax and σhmin) are the other two principal stresses. Otherwise, σHmax and σhmin are the projections of the principal stresses into the horizontal plane. The stress regime is considered as the expression of the relative magnitudes of the principal stresses. Tectonic regimes are termed ‘normal faulting’ when σv > σHmax > σhmin; ‘thrust faulting’ when σHmax > σhmin > σv; and ‘strike-slip’ when σHmax > σv > σhmin (cf. Zoback & Zoback, Reference Zoback and Zoback1989). It is worth noting that only when faults are optimally oriented in the stress field does the stress regime coincide with the tectonic regime.
After the clustering into stress fields, we calculated shifts between (i) the superordinate stress fields and (ii) the local stress fields. For simplification we assume that two principal stresses of the stress tensor are oriented in a horizontal plane according to Anderson’s theory (Anderson, Reference Anderson1972). Variation is then calculated as the azimuthal difference in degree between (i) and (ii), resulting in a clockwise or anticlockwise shift.
The use of fault-slip data for stress inversion is applicable, if the following assumptions outlined by Anderson (Reference Anderson1972) and Sperner and Zweigel (Reference Sperner and Zweigel2010) apply: (1) measurements of the slip data in small outcrops are representative of the far-field stress; (2) rotation of fault-bounded blocks (100 m to km scale) has not distorted the stress marker significantly; (3) the material is homogeneous enough to allow retrieval of the incremental strain that can then be transferred to the stress through stress inversion; (4) different stress fields can be separated by the data; and (5) the orientation of σ1 relative to the fault’s dip is 30° at close-to-surface conditions, which is the case in most situations in the field where we can observe conjugate fault sets.
To increase validation and representability (assumption 1), we use a combination of two independent methods, i.e. fault-slip and tectonic stylolites. Using fault-slip inversion alone entails the risk of measuring artefacts of pre-existing fault zones. Those can produce perturbation of the applied stresses and therefore result in a heterogeneous stress pattern in the overall study area (Lacombe, Reference Lacombe2012). We will discuss the validation of assumption 2, the negligibility of block rotation, in Section 5.c below. The Upper Jurassic carbonate rocks essentially comprise two lithofacies: (i) the dominant so-called ‘normal facies’, composed of well-bedded limestones and marls and (ii) the ‘reef facies’, build-ups formed by sponges and microbial crusts (algal-sponge reefs) and locally also by corals (Munk, Reference Munk1980). The dominant ‘normal facies’ rocks are relatively homogeneous in terms of their rheology. We assume that inhomogeneities associated with the visible layering do not have a strong effect at the outcrop or map scale especially where two principal stresses lay in the bedding plane. Thus, assumption 3 is valid, too. The dolomites of the ‘reef facies’, however, provide an exception (outcrop group 5, Reef Facies) as these are massive and strongly karstificated. Compared to the other groups, fault-slip indicators are poorly preserved in outcrops of this group and therefore the number of measurements is low. Assumption 4, the separation of multiple stress fields, is valid for most of the data that fall clearly into distinct stress fields that can be separated. Data that cannot be statistically clustered are neglected in this study. Assumption 5 is valid because locally slickolites record directly the orientation of σ1 relative to fault planes, the angle between the slickolite and the fault plane is 30° on average and conjugate fault planes form an angle of 60°. We used only faults with preserved striation and slip direction for our analysis. The risk of missing minor structures or subjective interpretation of slip direction (Sperner & Zweigel, Reference Sperner and Zweigel2010) is minimized by the contributions of four persons to the final dataset (Köhler et al. Reference Köhler, Bücker, Hofmann and Koehn2021). All contributors are aware of the importance of distinguishing between slickenfibres, slickolites, stylolites and joints (Lisle, Reference Lisle2013). No outcrop was analysed by one single person.
4. Results
4.a. Stress fields and their relative age relationships
We identified five different stress field generations, causing brittle deformation, folding and the development of tectonic stylolites in the study area. The relative age relationships of these stress fields were determined through local observations of cross-cutting relations of the respective structures and multiple striations (Figs 3, 4), yielding the following chronology (from old to young) of successive stress fields (SF):
-
1. Normal fault regime under N(NE)–S(SW) horizontal extension
-
2. Thrusting regime under N(E)–S(W) horizontal compression (cogenetic with the formation of a first set of tectonic stylolites)
-
3. Strike-slip regime under N(N)E–S(S)W horizontal compression and (W)NW-(E)SE-directed horizontal extension
-
4. Normal fault regime under N(N)W–S(S)E horizontal extension
-
5. Strike-slip regime under (N)W–(S)E horizontal compression and N(E)-S(W) horizontal extension (cogenetic with the youngest set of tectonic stylolites)
We correlate these SFs to the overall SFs (Section 4.c below). However, the observations yield very local information, and thus the orientation of the SFs can differ from the regional observations. Normal and reverse sense striations were preserved on the same W–E- to NW–SE-striking fault planes (Fig. 4a–b, e1, e2), resulting from N(NE)–S(SW) normal faulting regime (SF1) followed by NE–SW-thrusting regime (SF2), respectively. Due to the stratigraphic age of the analysed outcrops (Table 1), the maximum age of SF1 is Late Jurassic (Malm). SF2 is associated with tectonic stylolites indicating NE–SW compression that are rotated by SW-vergent folds (Fig. 2c). We observed cross-cutting relationships between those stylolites and dextral NW–SE-striking faults (Figs 3b, 4g1) that are indicative for a younger strike-slip regime with a roughly N-trending σ1 and E-trending σ3 (SF3). In addition, SF3 strike-slip faults are cutting straight through SF2-related folds. At three locations we observed overprinting of SF3 by N(N)W–S(S)E normal faults associated with SF4. While both SF2 stylolite and SF3 dextral faults are cross-cut by NW-dipping normal faults (SF4) in group 2 (outcrop 2, Kirchleus in Figs 3a, 4g1), SF3 strike-slip faults are reactivated as SF4 normal faults in outcrops 10 and 8b (Figs 3c, 4d, e3).
In addition, SF2 thrusts and reverse faults are overprinted by oblique, NW-striking normal faulting (Fig. 3a) and cross-cut by dextral NE-trending faults (Figs 3b, 4g2), both resulting from a strike-slip regime with an E-trending, horizontal compression (SF3). The younger set of tectonic stylolites show a (W)NW–(E)SE horizontal compression that is related to SF5. These stylolites are cross-cut by dextral WNW-trending fault planes (Fig. 4g3). While these youngest faults are associated with a strike-slip regime under E–W horizontal compression, the younger stylolites could be related to either thrusting (i.e. vertical σ3) or strike-slip (i.e. horizontal σ3; Ebner et al. Reference Ebner, Toussaint, Schmittbuhl, Koehn and Bons2010). The stress field related to the youngest set of stylolites resembles the one associated with the youngest set of strike-slip faults (SF5). However, there is a lack of clear evidence of age relationships between SF4 and SF5. Unambiguous cross-cutting relationship between structures correlating with SF4 and SF5 have not been observed.
4.b. Stylolites and folds
Tectonic stylolites are well developed in Upper Jurassic (Malm) limestones, while their development in dolomites or in Middle Triassic (Muschelkalk) limestones is limited (groups 5 and 1, respectively). In sandstone-dominated lithologies we observed no stylolites at all (group 9). The preferred orientations of the measured stylolites are shown as density plots in Figures 5, 6. As stylolite teeth grow parallel to σ1, a maximum in the density plot corresponds to the direction of σ1. In the Franconian North outcrop group 1, rare tectonic stylolites suggest a bimodal distribution of their orientation, i.e. the coexistence of NNE–SSW- and W–E-directed teeth (Figs 5, 6). Orientation of stylolite teeth in the Kulmbach area varies from bimodal, NNE–SSW- and NW–SE-directed teeth (Kulmbach North, group 2) to unimodal NW–SE-directed teeth (Kulmbach South, group 3) (Figs 5, 6). In the hanging wall of the NE-dipping Eisfeld–Kulmbach FZ (Figs 6 and (further below) 8, outcrop 3b) oblique tectonic stylolites are observed in Muschelkalk limestones of an overturned fold limb (Fig. 2c). Throughout the entire Kulmbach area, fold axes trend NNW–SSE ((further below) Fig. 8). In Central Franconia (group 4) tectonic stylolites show a bimodal distribution in orientation, with the most dominant maximum indicating horizontal compression in the NE–SW direction, and a minor maximum in a NW–SE direction (Fig. 5). Around Erlangen (group 6), tectonic stylolites record NW–SE- and NE–SW-directed horizontal compression (Figs 5, 6, group 6). In Nuremberg (group 7), tectonic stylolites record only a single maximum revealing NNE–SSW horizontal compression (Figs 5, 6). In Franconia South (group 8) the majority of stylolite teeth trend NE–SW and a smaller population records the WNW–ESE horizontal compression (Figs 5, 6). In Hersbruck (group 10), stylolite teeth predominantly trend NNE–SSW, with a minority trending NW–SE.
4.c. Overall stress field and local deviations
For each stress field and each outcrop group we created beachball plots, with the largest (σ1) and the lowest (σ3) principal stress axis in the centre of the white and grey quadrants respectively. The intersection of the quadrants gives the orientation of σ2. To visualize local variations in the respective stress fields we compiled the beachball plots on geological maps for each stress field (Figs 7–11). The local shift of the stress directions with respect to the regional stress orientation is collected in Tables 2–6.
Beachball plots illustrating regional variability of SF1 and prevailing N–S to NE–SW extension. Straight black lines of the map show active, dashed lines probably active faults during SF1. Top right: beachball plot and stereographic projection (lower hemisphere) of SF1-related faults with slip sense. Abbreviations: EKFZ – Eisfeld–Kulmbach fault zone; HFZ – Hersbruck fault zone. See Figure 1 for key to colours and Table 1 for further details on outcrop groups.
Beachball plots illustrating regional variability of SF2 and prevailing NE–SW compression. Straight black lines show active, dashed lines probably active faults during SF2. Top right: beachball plot and stereographic projection (lower hemisphere) of SF2-related faults with slip sense. Teeth direction of tectonic stylolites is shown as yellow dashes, anticlines as red lines. Abbreviations: EKFZ – Eisfeld–Kulmbach fault zone; HFZ – Hersbruck fault zone. See Figure 1 for key to colours and Table 1 for further details on outcrop groups.

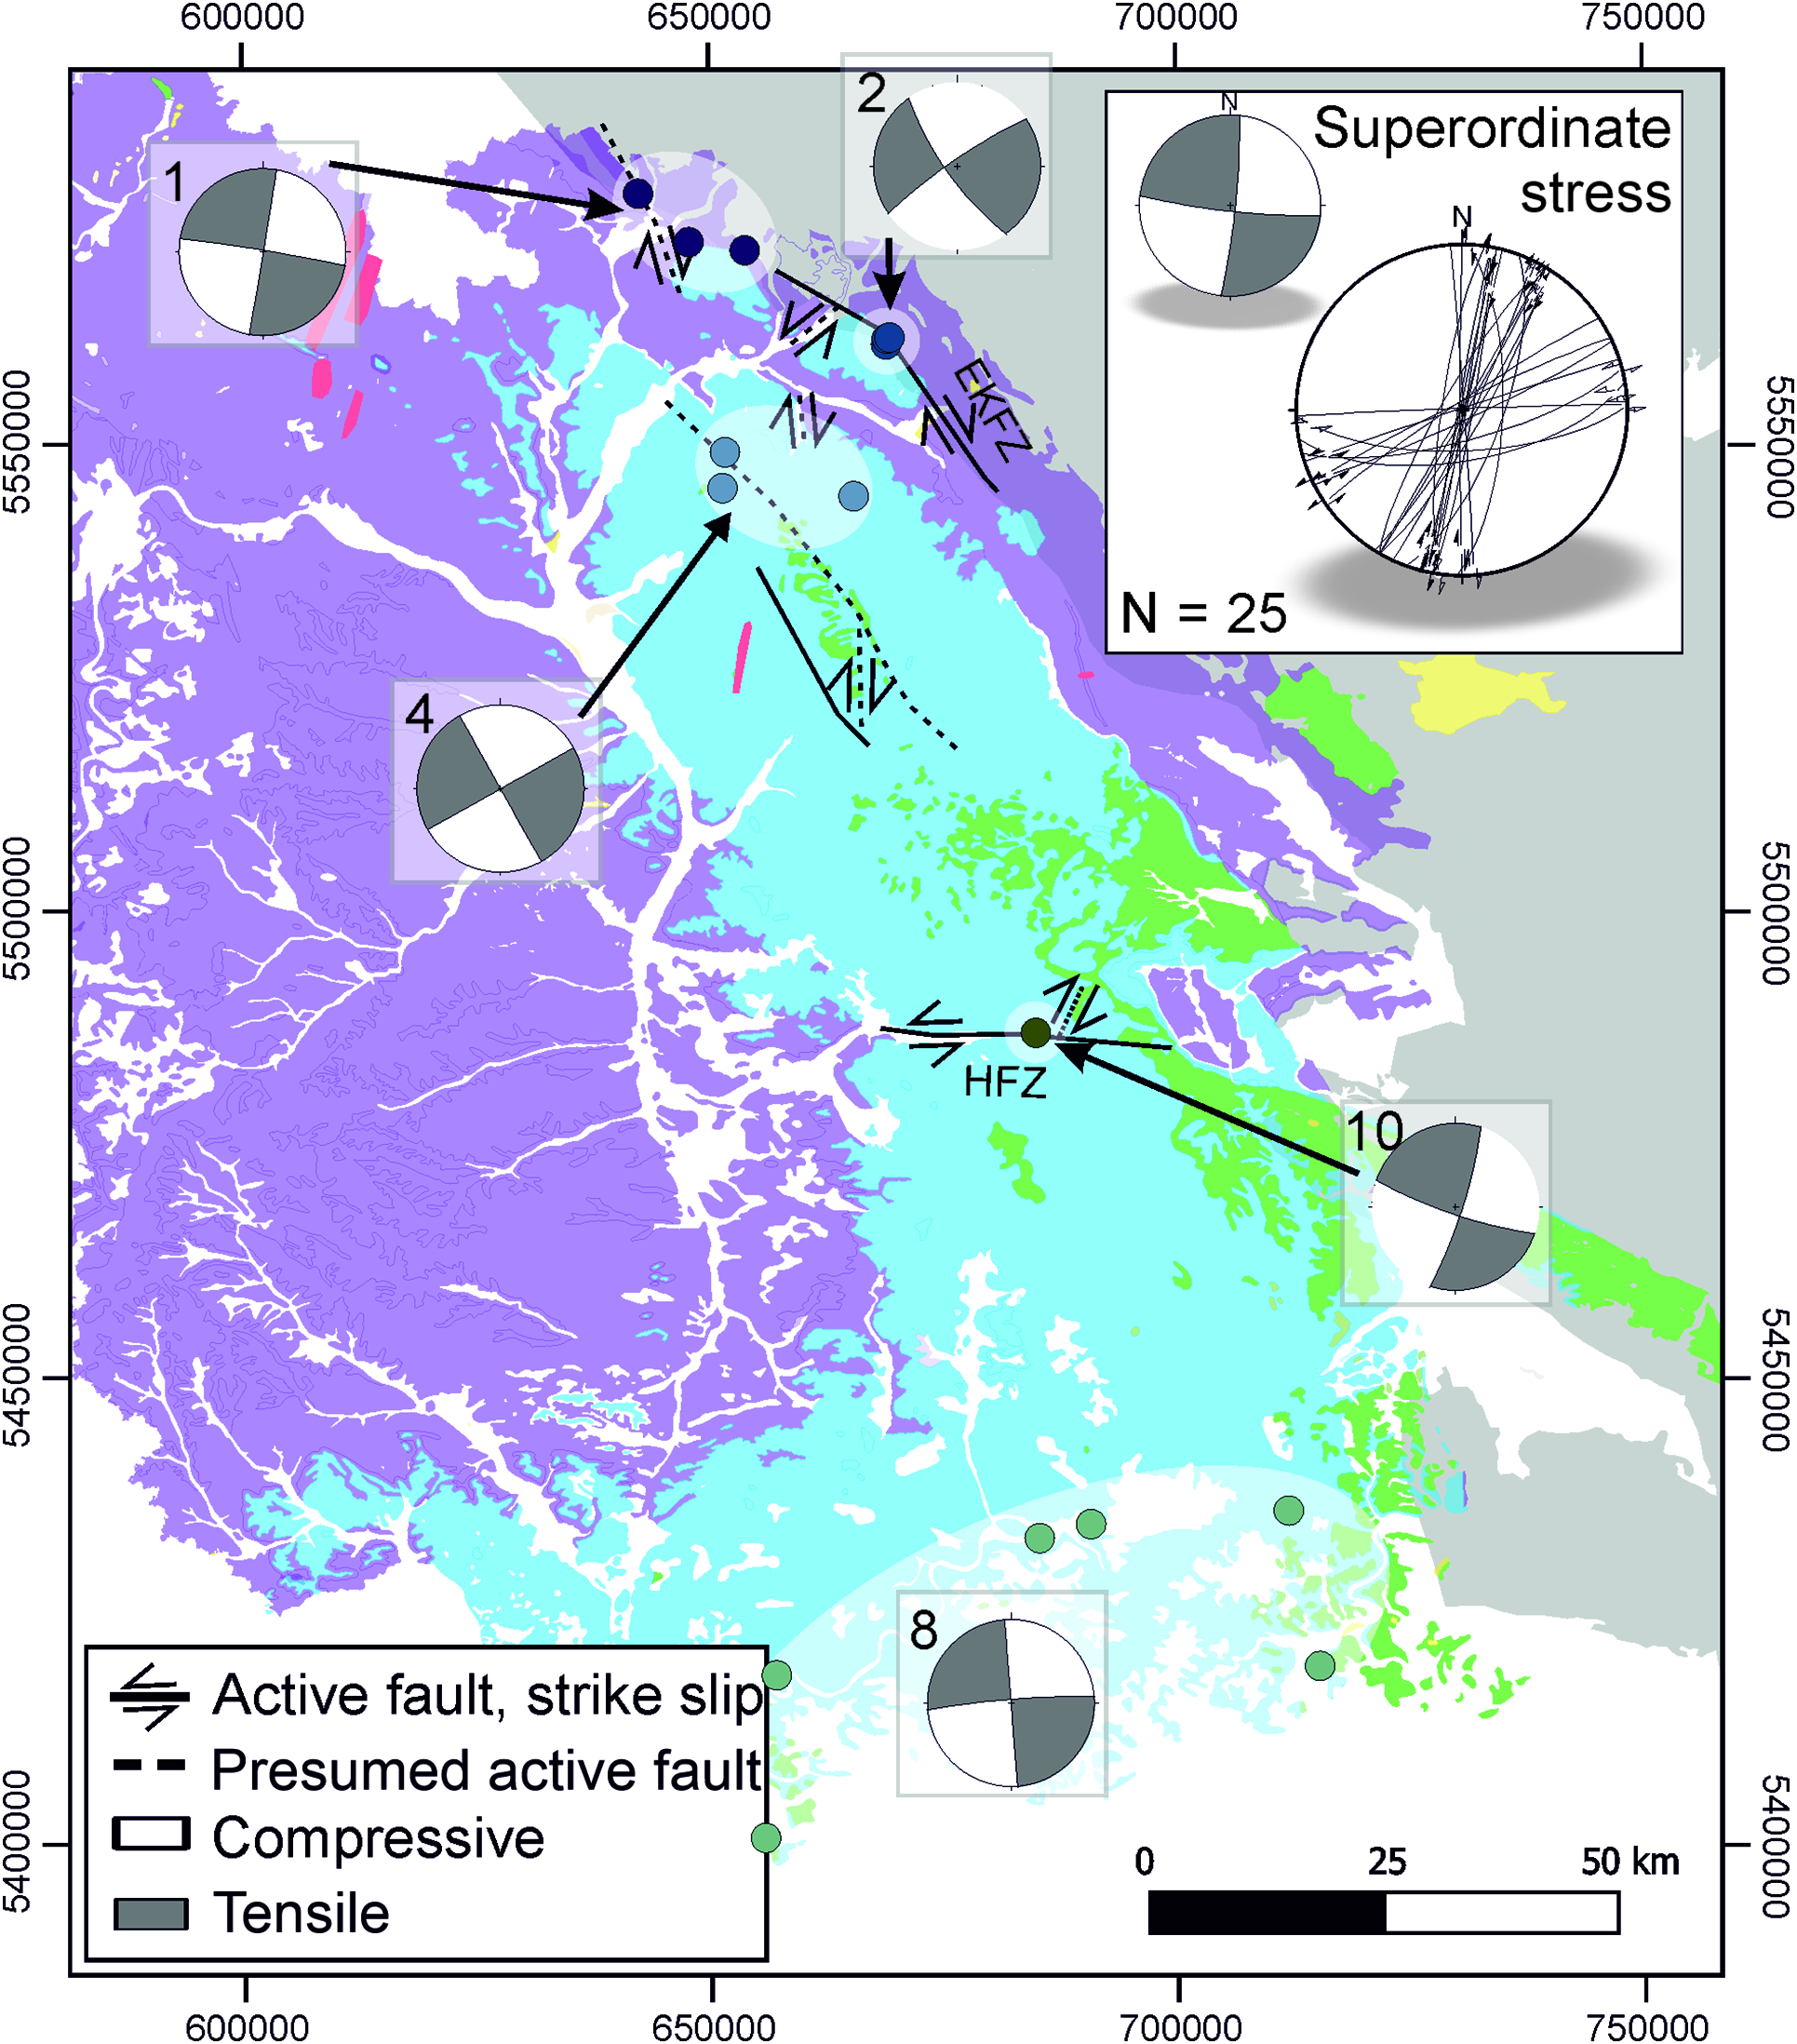
Beachball plots illustrating regional variability of SF3 and prevailing NE–SW compression with NW–SE extension. Straight black lines show active, dashed lines probably active faults during SF3. Top right: beachball plot and stereographic projection (lower hemisphere) of SF3-related faults with slip sense. Abbreviations: EKFZ – Eisfeld–Kulmbach fault zone; HFZ – Hersbruck fault zone. See Figure 1 for key to colours and Table 1 for further details on outcrop groups.
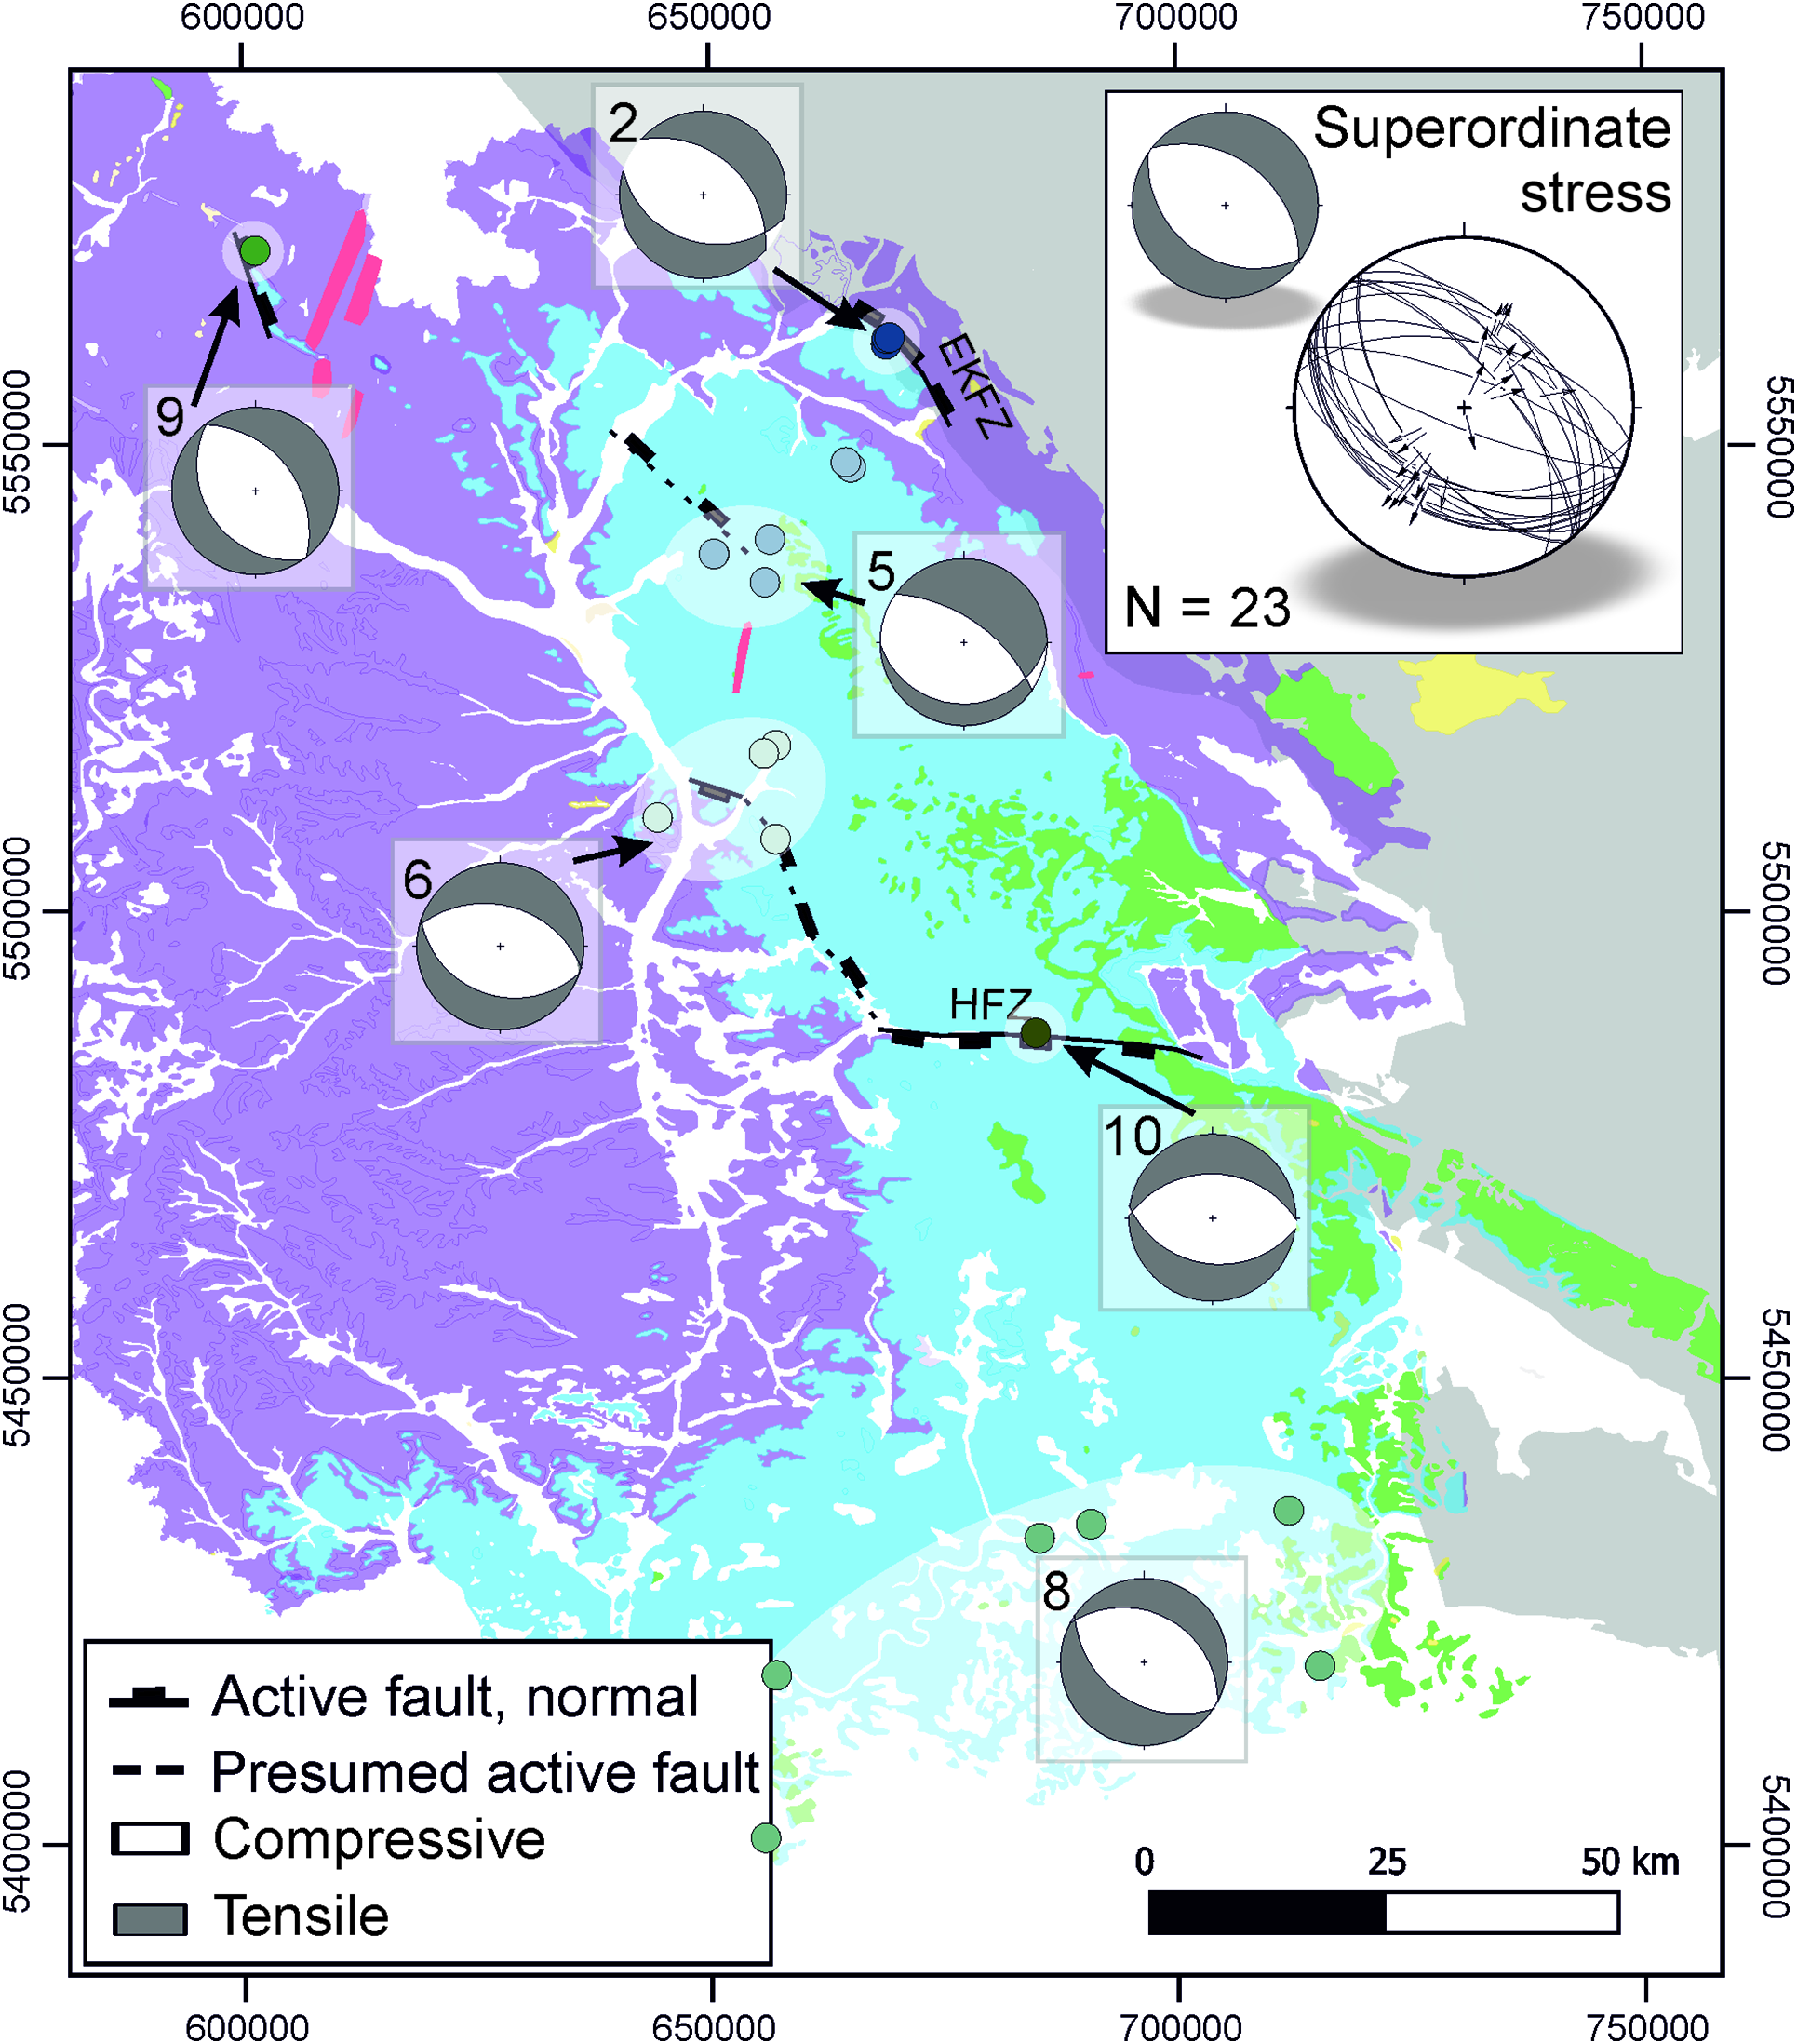
Beachball plots illustrating regional variability of SF4 and prevailing NW–SE to N–S extension. Straight black lines show active, dashed lines probably active faults during SF4. Top right: beachball plot and stereographic projection (lower hemisphere) of SF4-related faults with slip sense. See Figure 1 for key to colours and Table 1 for further details on outcrop groups.

Beachball plots illustrating regional variability of SF5 and prevailing NW–SE compression with NE–SW extension. Straight black lines show active, dashed lines probably active faults during SF5. Top right: beachball plot and stereographic projection (lower hemisphere) of SF5-related faults with slip sense. Teeth direction of tectonic stylolites is shown as yellow dashes. Abbreviations: EKFZ – Eisfeld–Kulmbach fault zone; HFZ – Hersbruck fault zone. See Figure 1 for key to colours and Table 1 for further details on outcrop groups.

Orientation of SF1 and local deviations
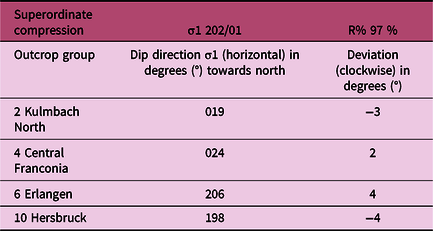
Orientation of SF2 and local deviations
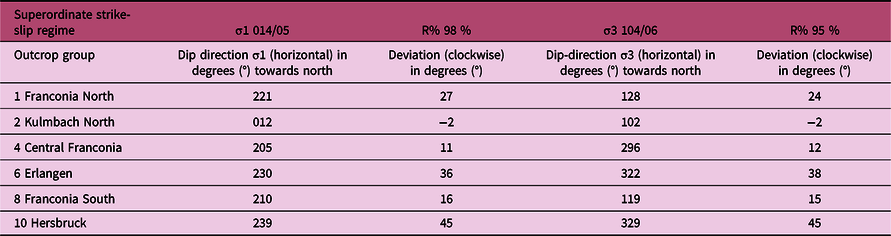
Orientation of SF3 and local deviations
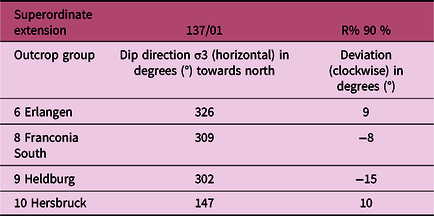
Orientation of SF4 and local deviations
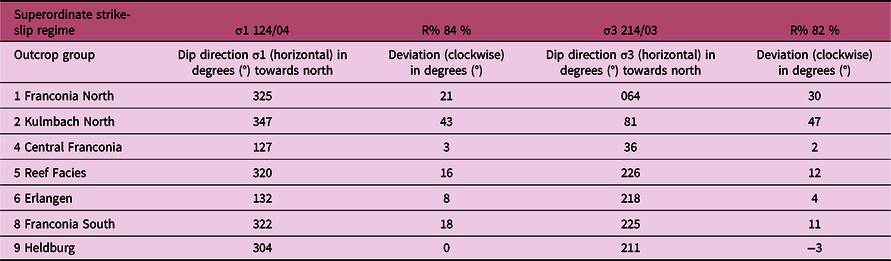
Orientation of SF5 and local deviations
4.c.1. Normal fault regime under N(NE)–S(SW) horizontal extension (SF1)
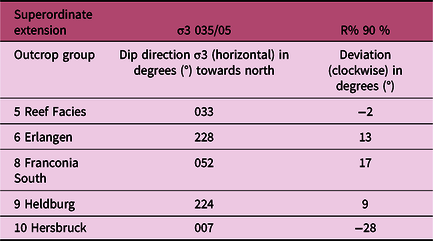
The oldest stress field (SF1) is constrained from 23 normal faults (e.g. Fig. 2a) that have a NNE–SSW-directed σhmin with an R-value of 90–92 % in the fault-slip inversion. σ1 is sub-vertical with an orientation of 215/85 (i.e. σ1 = σv) and σ3 is sub-horizontal-trending (N)NE–(S)SW (035/05, σ3 = σhmin). Along the Hersbruck FZ the regional principal stress direction deviates clockwise by 28° from the superordinate stress field towards a more N–S-trending σhmin (Table 2) whereas beachball plots from the other areas illustrate NE–SW-trending σhmin (Fig. 7).
4.c.2. Thrusting regime under NNE–SSW- to NE–SW- directed horizontal compression (SF2)
The second stress field (SF2) is compressive with a NNE–SSW σHmax trend as obtained from 20 WNW–ESE- to NW–SE-striking thrust faults. Striations show that fault planes of SF1 were reactivated as reverse faults during SF2 (Fig. 4b, e1–2), e.g. the Hersbruck FZ (Fig. 8). Our stress inversion yields a horizontal orientation of 202/01 for σ1 (i.e. σ1 = σHmax) with an R-value of 97 %, and a sub-vertical orientation of 299/85 for σ3 (= σv) with an R-value of 96 %. We also observed several SW-vergent folds in Muschelkalk units with an overturned, steep limb in the hanging wall of the Eisfeld–Kulmbach FZ (Fig. 2c). These folds rotated some tectonic stylolites, indicating that layer-parallel shortening predated SF2 thrusting and folding. Further west in the study area, several open folds developed in Central Franconia (Fig. 2b). The density distribution of their tectonic stylolite teeth (Fig. 6) shows a maximum at 205°, i.e. parallel to the orientation of σHmax derived from fault-slip analysis (Fig. 8). Locally the σHmax direction may vary slightly, especially proximal to the Eisfeld–Kulmbach FZ. At Kulmbach South (group 3) for instance, NE–SW-directed tectonic stylolites and NW–SE-striking thrusts are not observed whereas at Kulmbach North (group 2), NW–SE-striking thrusts and NE–SW-trending tectonic stylolite teeth are common (Figs 4–6). SF2 is the most consistent stress field in our study area in terms of its orientation, with a minor scatter of ±4° around the mean orientation of σHmax (Table 3).
4.c.3. Strike-slip regime under NE–SW horizontal compression and NW–SE horizontal extension (SF3)
SF3 is inferred from 25 strike-slip faults, of which 17 strike NNE–SSW to NE–SW with dextral slip sense and 8 strike E–W with a sinistral sense of slip. With an R-value of 92 %, σ1 is oriented horizontally with an azimuth of 46° (σ1 = σHmax). σ3 is horizontal with an orientation of 315/05 and an R-value of 94 % (σ3 = σhmin). Locally, reactivated faults show striations indicating successive normal faulting, reverse faulting and strike-slip. The strike-slip faults associated with this stress field are the most abundant faults (Fig. 3b) in the study area and often extend across whole quarries (100 m to km scale). Some mineralized extensional veins oriented 115/85 and 100/85 were reactivated as dextral strike-slip faults by this stress field. There are also WNW–ESE-striking fault planes with sub-horizontal striations, implying a NNE–SSW-directed horizontal σ1 and an oblique, non-vertical σ2 and σ3, e.g. in group 3 (Fig. 12b, Section 5c below).
Fault-slip measurements from locality Kirchleus (outcrop group 2), illustrating the proposed transition from (a) SF2, characterized by NNE–SSW compression with thrusting, over (b) transpression, to (c) SF3 with strike-slip faulting caused by NNE–SSW compression and WNW–ESE extension. For all stress fields the measured faults (stereographic projection, lower hemisphere), calculated PBT and the resulting beachball plot are provided. The bigger circles, squares and triangles show the mean orientation of P-, B- and T-axis, respectively. (d) shows the path of σ3 from vertical orientation (a) to horizontal orientation (c). (e) Visualization of the of the σ2–σ3 stress ellipse (in a vertical plane) with changing orientation due to increasing σv. The increase in σv changes the orientation of σ2 changes from horizontal (a, top, SF2) to vertical (c, bottom, SF3). The σ2 axis of the stress ellipse is shown as a dashed line.

The orientation of SF3-related faults and the respective σHmax and σhmin orientations vary across the region. For example, at location 10 the strike of sinistral faults is sub-parallel to the E–W-striking Hersbruck FZ (Fig. 9), whereas in outcrop 2 faults strike NE–SW (Figs 9, 12c). In Kulmbach North the horizontal principal stress axes σ1 and σ3 vary with 34° and 33° anticlockwise from the superordinate stress field recording NNE–SSW compression (i.e. σHmax) and WNW–ESE extension (σhmin). In contrast, in group 10 the stress axes σHmax and σhmin are shifted clockwise by 13° and 14°, indicating ENE–WSW-trending σHmax and NNW–SSE σhmin (Table 4).
4.c.4. Normal fault regime under NW–SE-directed horizontal extension (SF4)
NW–SE-directed extension is identified from 14 predominantly SE–dipping normal faults. The associated conjugate set of NW–dipping faults occurs less frequently and is restricted to the Erlangen outcrop group (group 6; Fig. 5). Fault-slip inversion leads to a (sub-)vertical σ1 orientation of 215/87 (σ1 = σv), within an R-value of 90 %. σ3 is oriented horizontally, with 137/01 within an R-value of 90 % (σ3 = σhmin). Due to the poor preservation of this stress field over the entire working area, we were only able to calculate local stress fields for four outcrop groups (Fig. 10). Therefore, the activity of fault zones at larger scales is only assumed. Relative to the overall mean direction, measured SF4 σhmin directions vary from 15° anticlockwise (ESE–WNW) in group 9, to 10° clockwise ((S)SE–(N)NW) in group 10 (Table 5).
4.c.5. Strike-slip regime under NW–SE horizontal compression and NE–SW horizontal extension (SF5)
Nine ENE–WSW-striking dextral strike-slip faults and 11 NNW–SSE-striking sinistral strike-slip faults are included in subset SF5. σ1 (126/03, σ1 = σHmax) and σ3 (216/00, σ3 = σhmin) are horizontal with an R-value of 93 % and 91 %, respectively. This orientation of σ1 is in agreement with the minor maximum of tectonic stylolites (Fig. 5). This configuration indicates a strike-slip regime with horizontal compression in a NW–SE direction of σHmax and NE–SW trending σhmin. As derived from measured strike-slip and oblique normal faults (Fig. 3a), SF5 is characterized by a high variability in fault orientations relative to the principal stress axes (Figs 5, 11). In addition, the direction of σHmax varies considerably across the study area. For example, at Franconia North (group 1) and Kulmbach North (group 2), σHmax deviates clockwise by 21° and 43° from its average orientation and σhmin varies with 30° and 47° clockwise (Table 5). Both deviations show a strong local shift from the dominating (E)SE–(W)NW-trending σHmax towards a more SSE–NNW-directed σHmax. Directions of associated tectonic stylolites vary as well (Figs 5, 11), with stylolites in Kulmbach South (group 3) indicating horizontal compression in a NW–SE direction, whereas fault-slip inversion shows a horizontal compression in the WNW–ESE direction. In contrast, Kulmbach North (group 2) reveals the opposite trend, with stylolites recording WNW–ESE horizontal shortening, while fault-slip inversion suggests NNW–SSE shortening. This stress field reactivated the Cretaceous strike-slip faults with a reverse slip sense, e.g. faults in the Eisfeld–Kulmbach FZ and in the Hersbruck FZ.
4.d. Oblique stress field
In addition to the main stress fields 1–5, our data indicate the existence of an oblique stress field, i.e. there is no vertical principal stress axis. Data separation for PBT analysis of group 2 (outcrop Kirchleus) led to a homogeneous cluster where σ1 is oriented horizontally along the NE–SW direction, but neither σ2 nor σ3 is vertical (Fig. 12b). Figure 12a and c illustrate clusters of SF2- and SF-3 related data for the same outcrop. Bedding is (sub-)horizontal and σ1 is parallel for all three stress fields, which differ only in the orientations of σ2 and σ3.
5. Discussion
5.a. Timing of stress fields and correlation with over-regional structures on a Central European scale
5.a.1. Late Jurassic – Late Cretaceous NE–SW extension (SF1)
The oldest recorded stress field corresponds to a normal faulting regime with NE–SW-directed horizontal extension. The maximum age of this stress field is Late Jurassic due to the Malm stratigraphy of the youngest host rocks. The existence of a normal faulting regime prior to the Late Cretaceous inversion is in agreement with palaeostress results of other authors for the same area and adjacent regions (Bergerat & Geyssant, Reference Bergerat and Geyssant1982; Bergerat et al. Reference Bergerat, Bouroz-Weil and Angelier1992; Peterek et al. Reference Peterek, Rauche and Schröder1996, Reference Peterek, Rauche, Schröder, Franzke, Bankwitz and Bankwitz1997). NE–SW-directed normal faulting is also recorded from Middle Triassic units in the adjacent Thuringian Basin (Navabpour et al. Reference Navabpour, Malz, Kley, Siegburg, Kasch and Ustaszewski2017). Because this stress field is no longer recorded in Upper Cretaceous sequences in the Elbe zone farther north (Coubal et al. Reference Coubal, Málek, Adamovič and Štěpančíková2015), its minimum age is Late Cretaceous. The timing of the stress field coincides with the tectonic evolution of the Central European Basin System (CEBS) that records sediment accumulation and subsidence from Late Permian to Late Cretaceous time (Scheck-Wenderoth et al. Reference Scheck-Wenderoth, Krzywiec, Zühlke, Maystrenko, Froitzheim and McCann2008; Stollhofen et al. Reference Stollhofen, Bachmann, Barnasch, Bayer, Beutler, Franz, Kästner, Legler, Mutterlose, Radies, Littke, Bayer, Gajewski and Nelskamp2008; von Eynatten et al. Reference von Eynatten, Kley, Dunkl, Hoffmann and Simon2021). In the southern part of the CEBS, subsidence and extension have been related to the reactivation of structures defining Permian NW–SE-striking basins (Zulauf & Duyster, Reference Zulauf and Duyster1997; Walter, Reference Walter2007; Kley et al. Reference Kley, Franzke, Jähne, Krawczyk, Lohr, Reicherter, Scheck-Wenderoth, Sippel, Tanner, van Gent, Littke, Bayer, Gajewski and Nelskamp2008; Sippel et al. Reference Sippel, Scheck-Wenderoth, Reicherter and Mazur2009; Navabpour et al. Reference Navabpour, Malz, Kley, Siegburg, Kasch and Ustaszewski2017).
5.a.2. Late Cretaceous NE–SW compressive phases (SF2 and SF3)
The folding and thrusting regime SF2 reactivated SF1-related structures. (N)NE–(S)SW-directed shortening is observed across the whole of western-central Europe (Kley & Voigt, Reference Kley and Voigt2008), and associated with lithospheric folding (e.g. Cloetingh & van Wees, Reference Cloetingh and van Wees2005), inversion of Permian–Cretaceous basins and basement exhumation (Thomson & Zeh, Reference Thomson and Zeh2000; von Eynatten et al. Reference von Eynatten, Dunkl, Brix, Hoffmann, Raab, Thomson and Kohn2019, Reference von Eynatten, Kley, Dunkl, Hoffmann and Simon2021). Based on stratigraphic and thermochronological constraints, the timing of this compressional phase is bracketed between c. 95 Ma and 75 Ma (Voigt et al. Reference Voigt, Kley and Voigt2021). Viewed in a broader geodynamic context, the thrusting regime in western-central Europe is triggered by the onset of the convergence between Africa–Iberia–Europe (Kley & Voigt, Reference Kley and Voigt2008; Dielforder et al. Reference Dielforder, Frasca, Brune and Ford2019).
In our study area strike-slip faults cross-cut stylolites, faults and folds related to SF2. Thereby, the direction of maximum horizontal compression remains constant and the horizontal extension increases as shown by the change from a thrusting to a strike-slip regime under persisting orientation of σHmax (Fig. 5). Thus, we assume that SF3 established shortly after SF2 and may represent the final stage of this compressional phase. This compressive phase started in the Franconian Platform with layer-parallel shortening and the development of tectonic stylolites, followed by folding and thrusting and eventually strike-slip faulting.
This chronological order is in agreement with palaeostress analysis from the Elbe Zone in the northeast (Coubal et al. Reference Coubal, Málek, Adamovič and Štěpančíková2015). There, volcanic dykes emplaced at 80–61 Ma (Ulrych et al. Reference Ulrych, Adamovič, Krmíček, Ackerman and Balogh2014) are related to a strike-slip regime postdating thrusting (Coubal et al. Reference Coubal, Málek, Adamovič and Štěpančíková2015). In the Thuringian Basin to the north, however, strike-slip faulting predates the thrusting regime (Navabpour et al. Reference Navabpour, Malz, Kley, Siegburg, Kasch and Ustaszewski2017), and in northern Germany the relative chronological order of the strike-slip and thrusting regime is not clearly resolved (Sippel et al. Reference Sippel, Scheck-Wenderoth, Reicherter and Mazur2009).
5.a.3. Late Palaeogene – early Neogene NW–SE extension (SF4)
Stress field generation SF4 describes a normal faulting regime with σhmin trending NW–SE. This phase of extension with varying directions of σhmin is also recorded from the Thuringian Forest (E–W-directed extension; Rauche & Franzke, Reference Rauche and Franzke1990); from the Thuringian Basin (WNW–ESE-directed extension; Navabpour et al. Reference Navabpour, Malz, Kley, Siegburg, Kasch and Ustaszewski2017); from the Bohemian Massif (WNW–ESE-directed extension; Coubal et al. Reference Coubal, Málek, Adamovič and Štěpančíková2015); from Northern Germany (radial extension, i.e. NW–SE- to NE–SW-directed; Sippel et al. Reference Sippel, Scheck-Wenderoth, Reicherter and Mazur2009); from the Upper Rhine Graben (E–W-directed extension; Bergerat, Reference Bergerat1987); and from the Lower Rhine Graben (NE–SW-directed extension; Vandycke, Reference Vandycke2002). There are several interpretations of the reason for widespread intraplate extension and associated mafic volcanism in late Palaeogene to early Neogene time, such as asthenospheric melting in response to deeply rooted large-scale upwelling mantle plumes or small-scale diapiric upwelling (e.g. Hoernle et al. Reference Hoernle, Zhang and Graham1995; Wilson & Downes, Reference Wilson and Downes2006). There is, however, a temporal and genetic link to the onset of continental collisional tectonics, slab detachment and subsequent plate tectonic reconfigurations in the Alpine realm (e.g. Dèzes et al. Reference Dèzes, Schmid and Ziegler2004; Pfänder et al. Reference Pfänder, Jung, Klügel, Münker, Romer, Sperner and Rohrmüller2018). Towards the south, normal faulting in the North Alpine Foreland Basin is interpreted to result from bulging, that is a consequence of the increasing thrust load of the Alpine Orogeny (von Hartmann et al. Reference von Hartmann, Tanner and Schumacher2016).
As illustrated in Fig. 1a, the Franconian Platform records evidence of Cenozoic intraplate volcanism. A prominent example is the NNE–SSW-striking Heldburg dike swarm system. This system comprises two generations of dikes, the late Eocene to late Oligocene phase (38.0 Ma−25.4 Ma) and the Miocene phase (Abratis et al. Reference Abratis, Mädler, Hautmann, Leyk, Meyer, Lippolt and Viereck-Götte2007; Pfänder et al. Reference Pfänder, Jung, Klügel, Münker, Romer, Sperner and Rohrmüller2018). Late Palaeogene – early Neogene intraplate volcanism is also evidenced by the 19–24 Ma Oberpfalz (Todt & Lippolt, Reference Todt and Lippolt1975) and the ∼31 Ma Oberleinleiter volcanism (Hofbauer, Reference Hofbauer2008; Fig. 1a). To the east of the Franconian fault zone even more pronounced extension-related volcanism is recorded from the NE–SW-striking Eger Graben which initially opened along a NNE–SSW to N–S direction during the late Eocene to latest Oligocene time, followed by NW–SE normal faulting during the early Miocene time (Adamovič & Coubal, Reference Adamovič and Coubal1999; Rajchl et al. Reference Rajchl, Uličný, Grygar and Mach2009). Cenozoic intraplate volcanism was widespread in central Europe to the north of the Alpine front, e.g. the Upper Rhine Graben, Rhön, Vogelsberg (European Cenozoic Rift System; Dèzes et al. Reference Dèzes, Schmid and Ziegler2004). However, the high variability of the direction of σhmin over the whole of Europe cannot be explained exclusively by one cause. The strike direction of the Heldburg dike swarm differs from the direction of extension for SF4. On the other hand, a link to bulging as observed in the North Alpine Foreland Basin (c. 100 km farther south) requires additional consideration. Thus, the source for the normal faulting regime in the Franconian Platform remains unclear.
5.a.4. NW–SE-directed compressive phase since the Miocene time (SF5)
The youngest stress field is a strike-slip regime associated with NW–SE shortening. However, as compiled in Fig. 4 and stated in Section 4.a above, the relative chronology between SF4 and SF5 is not finally solved. SF5 is recorded by a high variability in the orientation of the active fault planes and in the orientation of stylolites.
This youngest compressional phase where bedding-parallel shortening (e.g. development of stylolites) and thrusting were subsequently replaced by an intracontinental strike-slip regime is also described for the whole of Central Europe (Rosenbaum et al. Reference Rosenbaum, Lister and Duboz2002; Kley & Voigt, Reference Kley and Voigt2008; Scheck-Wenderoth et al. Reference Scheck-Wenderoth, Krzywiec, Zühlke, Maystrenko, Froitzheim and McCann2008; Coubal et al. Reference Coubal, Málek, Adamovič and Štěpančíková2015; Navabpour et al. Reference Navabpour, Malz, Kley, Siegburg, Kasch and Ustaszewski2017). Kley and Voigt (Reference Kley and Voigt2008) correlate this stress field with the Miocene to recent episode of the Alpine Orogeny and associated NW-directed shortening.
According to Heidbach et al. (Reference Heidbach, Rajabi, Reiter and Ziegler2016) seismic activity and borehole break-outs imply the persistence of SF5 since the late Miocene time, because the respective stylolites are oriented parallel to the direction of σHmax. We cannot exclude overlapping of stress fields 4 and 5. Figure 13 schematically illustrates the successive development from almost undeformed sedimentary rocks during SF1 (Fig. 13a) to a rather fractured upper crust recording the cumulative effects of SF1–5 deformations (Fig. 13e). Most probably fractures and stylolites led to mechanical anisotropies (Baud et al. Reference Baud, Rolland, Heap, Xu, Nicolé, Ferrand, Reuschlé, Toussaint and Conil2016; Pfänder et al. Reference Pfänder, Jung, Klügel, Münker, Romer, Sperner and Rohrmüller2018) and caused local deviation of plate collision induced stress.
Summary sketch (map view) illustrating the development of faults and tectonic stylolites during stress fields 1–5. (a) SF1: normal faulting regime with σhmin trending NE–SW; (b) SF2: thrusting regime with σhmax trending NNE–SSW; (c) SF3: strike-slip regime with σhmax trending NE–SW; (d) SF4: normal faulting regime with σhmin trending NW–SE; (e) SF5: strike-slip regime with σhmax trending NW–SE.

5.b. Transitional stress fields
The stress field associated with NE–SW compression observed for Kirchleus (group 2, Franconian North; Section 4d above) is an exotic feature in our study area. Since there is no vertical principal stress axis, it represents a non-Andersonian behaviour (Anderson, Reference Anderson1972). Oblique stress fields could be the result of later, local tilting of preserved, older stress fields (SF2 or SF3) due to, e.g., folding or block rotation (Arboit et al. Reference Arboit, Amrouch, Collins, King and Morley2015; Navabpour et al. Reference Navabpour, Malz, Kley, Siegburg, Kasch and Ustaszewski2017). Tilting and folding, however, can be neglected due to the observation that the sedimentary layering is still horizontal.
Oblique stress fields can occur under upper crustal conditions as shown by recent studies (Lisle et al. Reference Lisle, Orife, Arlegui, Liesa and Srivastava2006; Sippel et al. Reference Sippel, Saintot, Heeremans and Scheck-Wenderoth2010; Lacombe, Reference Lacombe2012; Beaudoin et al. Reference Beaudoin, Koehn, Lacombe, Lecouty, Billi, Aharonov and Parlangeau2016). For instance, if pre-existent structures or faults are not optimally oriented in the stress field, the reactivation leads to the partitioning of the stress tensor and/or the formation of oblique (transpressional or transtensional) fault kinematics (Sanderson & Marchini, Reference Sanderson and Marchini1984). Local perturbations are also promoted by the vicinity of fault zones (Homberg et al. Reference Homberg, Hu, Angelier, Bergerat and Lacombe1997; Sippel et al. Reference Sippel, Saintot, Heeremans and Scheck-Wenderoth2010; Lacombe, Reference Lacombe2012; Beaudoin et al. Reference Beaudoin, Koehn, Lacombe, Lecouty, Billi, Aharonov and Parlangeau2016). In this case the outcrop might be affected by local stress deflection as it is located close to the EKFZ (e.g. Fig. 8).
There are three stress orientations with approximately the same orientation of σ1 (= σHmax) and (i) a vertical σ3 (SF2, Fig. 12a), (ii) an oblique σ2 and σ3 (Fig. 12b) and (iii) a vertical σ2 (SF3, Fig. 12c) recorded in the same outcrop. We therefore argue that this stress field (ii) most likely records a transitional stage between (i) and (iii), and thus between SF2 and SF3. This suggests that the stress field transition from thrusting to strike-slip is only locally preserved in Franconia. It is worth noting that the transition of stress fields, i.e. the change of the relative magnitudes of the principal stresses, may produce faulting in uniaxial stress geometries when the magnitudes of two principal stress axes become equal (Fig. 12e). The change in the magnitude of σv is supposed to be caused by thickening due to folding and thrusting (Dalmayrac & Molnar, Reference Dalmayrac and Molnar1981; Tavani et al. Reference Tavani, Storti, Lacombe, Corradetti, Muñoz and Mazzoli2015; Ferrill et al. Reference Ferrill, Smart, Cawood and Morris2021). Thus, this observation can also represent snapshots of the oscillation between such different regimes during the transition as, e.g., shown by Beaudoin et al. (Reference Beaudoin, Koehn, Lacombe, Lecouty, Billi, Aharonov and Parlangeau2016). The traces of the principal axis are shown in Fig. 12d.
5.c. Stress field consistency and perturbations
In some areas, e.g. Hersbruck (outcrop group 10), the orientation of local stress fields derived from fault-slip inversion deviates from that of the superordinate stress fields by up to 45° (Fig. 5; Tables 2–6). In those areas, however, the orientation of the maximum horizontal stress parallels the strike of large faults. For instance, σ2 in SF1 and SF2 at locality Hersbruck (group 10) parallels the trace of the E–W-striking Hersbruck FZ, whereas at Kulmbach North (group 2) and Kulmbach South (group 3) σ2 is oriented parallel to the NW–SE-striking Eisfeld–Kulmbach FZ (Figs 7, 8). In the strike-slip regimes of SF3 and SF5 the respective large faults are reactivated. SF3 reactivates the Hersbruck FZ in a sinistral sense of movement and the Eisfeld–Kulmbach FZ in a dextral sense of movement and vice versa for SF5. Another possible explanation for the difference in the stress orientation could be that the area of outcrop group 10 is located in the region of potential interaction between the tips of the PSZ and a minor fault parallel to the NNW–SSE-striking PSZ. According to Homberg et al. (Reference Homberg, Hu, Angelier, Bergerat and Lacombe1997, Reference Homberg, Angelier, Bergerat and Lacombe2004), stress perturbation near fault tips is significantly influenced by the respective fault and the magnitude of the applied stresses. The coincidence of the orientation of σ2 and the strike of nearby faults indicates that stress deflection due to the existence of structural heterogeneities (sensu Hudson & Cooling, Reference Hudson and Cooling1988; Casas et al. Reference Casas, Simon and Seron1992; Zhang et al. Reference Zhang, Dusseault and Yassir1994; Bell, Reference Bell1996; de Joussineau et al. Reference de Joussineau, Petit and Gauthier2003; Yale, Reference Yale2003) plays a significant role in the Franconian Platform.
However, the overall stress field is relatively constant. This leads to the validation of assumption 2, made in Section 3 above, the negligibility of block rotation. If perturbations may be induced by block rotation palaeostress studies need to be conducted in the area to the south in order to obtain a larger framework.
5.d. Cyclic stress fields in compressional regimes
Our stress inversion results from the Franconian Platform can be explained in the frame of fold-and-thrust belt cycles sensu Tavani et al. (Reference Tavani, Storti, Lacombe, Corradetti, Muñoz and Mazzoli2015) and Ferrill et al. (Reference Ferrill, Smart, Cawood and Morris2021). For instance, SF1–SF3 represent a complete cycle, initiated by normal faulting due to fault-controlled subsidence, followed by the formation of tectonic stylolites and basin inversion by folding and thrusting. Due to the resulting thickness of the crust during SF2, the vertical stress increases while the orientation of σHmax persists (Fig. 12e). Assuming that the magnitude of σ1 (σHmax) also remained, the exclusive increase of the vertical stress would cause the differential stress to decrease. Since the differential stress needs to be large enough to produce faulting, this scenario would interrupt the brittle deformation (Coulomb, Reference Coulomb1776; Mohr, Reference Mohr1900). Strike-slip faulting during SF3 requires the accommodation of faulting exclusively by reactivation of pre-existing faults or fluid overpressure that reduced the mean stress. There is, however, no evidence for both the exclusive reactivation of pre-existing faults and the presence of fluids (e.g. low-T mineralization). Another scenario with fault-parallel, i.e. NW–SE directed, horizontal extension would allow maintaining the differential stress by reducing σhmin to approach σ3 during an increase of σv to approach σ2. Nevertheless, this remains an open question since there is (yet) no record for related structures nor have we obtained absolute or relative magnitudes of stresses. An increase of σ1 after the main compressional phase (SF2), however, is in disagreement with the weakened coupling between Iberia and Europe after the collision (Dielforder et al. Reference Dielforder, Frasca, Brune and Ford2019).
This final phase of the tectonic cycle is characterized by the switch of the fault regimes from thrusting to strike-slip and eventually normal faulting (Dalmayrac & Molnar, Reference Dalmayrac and Molnar1981; Molnar & Chen, Reference Molnar and Chen1983). A pause between thrusting and strike-slip faulting probably provides time for another set of tectonic stylolites to grow. A similar chronology containing normal faulting, thrusting, folding and strike-slip faulting is described for the Indochina block in Thailand (Arboit et al. Reference Arboit, Amrouch, Collins, King and Morley2015). There, deformation started with extension replaced by layer-parallel shortening in the same direction. Features produced by this compression (stylolites, pressure-solution cleavage) were rotated by folding afterwards.
The detailed analysis of the stylolites to determine the exact orientation of the in-plane principal stresses (σ2 and σ3) (Ebner et al. Reference Ebner, Toussaint, Schmittbuhl, Koehn and Bons2010) is not within the scope of this work. Thus, we cannot distinguish if the stylolites developed in SF2 or before in another strike-slip regime. Both options are in agreement with the concept of Ferrill et al. (Reference Ferrill, Smart, Cawood and Morris2021). The observation of a younger strike-slip regime (SF3) cross-cutting faults and folds of SF2 challenges the concept by Tavani et al. (Reference Tavani, Storti, Lacombe, Corradetti, Muñoz and Mazzoli2015), where no late strike-slip regime is included. In addition, this concept is simplified with respect to stylolites which are assumed to develop in strike-slip regimes, exclusively. This makes a fundamental difference in the stress evolution in the foreland area. However, the switch from thrusting to strike-slip regime is also described for the western Alpine foreland (Smeraglia et al. Reference Smeraglia, Looser, Fabbri, Choulet, Guillong and Bernasconi2021). The earlier extension is not observed there.
An incipient second stress cycle is documented by a second generation of tectonic stylolites. The apparent coexistence of strike-slip faulting, however, does not allow us to infer the relative-chronological order of the stress fields within the new stress cycle. The strike-slip faults can either result from early compression or initial relaxation, or both. The latter case would imply the existence of two generations of strike-slip faults which we cannot distinguish here. Regarding the heterogeneous directions of Late Palaeogene to Neogene normal faulting and the fact that the extension is sub-parallel to the younger compression SF5 (see Section 5.a.3 above) the tectonic cause of SF4 remains unclear. If the extension is linked to foreland bulging induced by the Alpine collision, this stress field SF4 could represent an earlier extensional episode prior to shortening.
6. Conclusion
We use fault slip analysis and tectonic stylolites to reproduce a highly resolved stress evolution of the Franconian Platform in SE Germany. The analysis allows us to reconstruct the complete tectonic cycle of an inverted basin that originated from initial Late Jurassic – Early Cretaceous extension and subsidence (SF1), followed by successive NE–SW-directed shortening through layer-parallel shortening and the growth of tectonic stylolites and later thrusting and folding (SF2), and a final Late Cretaceous relaxation (SF3). The inversion cycle becomes repeated during a second phase of extension (SF4) and shortening in NW–SE direction (SF5) with a second set of tectonic stylolites and strike-slip to oblique slip faults. During these stress cycles, the main principal stresses switch systematically from Andersonian extensional regime to thrusting, strike-slip and extensional again. The transitions are sometimes preserved in oblique stress fields, with σ1 being the only principal stress in the horizontal plane. Pre-existing faults seem to partly account for small-scale perturbations. Our study provides a crucial insight into the stress development in an intraplate compressional setting where two inversion events developed with their highest horizontal stresses in nearly perpendicular orientation to each other: the first during the Africa–Iberia–Europe convergence followed by a period of extension and then the development of the Alpine orogeny.
Acknowledgements
The authors thank for the comments by the guest editors Olivier Lacombe and Stefano Tavani, and by Jonas Kley and an anonymous reviewer that helped to improve the manuscript.
This research is funded by the project ‘Integrated geophysical–structural–kinematic analysis of the fault patterns in Northern Bavaria’ within the scope of ‘Bodenatlas Bayern’ by the Bayerisches Landesamt für Umwelt (LfU) and the European Union (ERDF program Bayern 2014–2020) which is gratefully acknowledged. Many thanks to T. Voigt for motivating discussions and precious outcrop suggestions.
Conflict of interest
None.


 Open access