
On August 6 and August 9, 1945, the Japanese cities of Hiroshima and Nagasaki, respectively, experienced the first and second use of atomic weapons in war. The devastation created in the 2 cities introduced to the world a new class of weapons of mass destruction. Reported numbers vary, but it has been estimated that by the end of 1945, 90 000 to 120 000 out of a civilian population of about 330 000 in Hiroshima, and 60 000 to 80 000 out of 280 000 in Nagasaki, would be dead as a result of exposure to the intense heat, physical force, and ionizing radiations emitted by the bombs.1
Although numerous first-hand accounts have been written to describe the damage to the people exposed to the destructive forces of the bombs,Reference Shirabe2Reference Yasuyama3 it is understandable that it would be difficult to quantify specific medical effects given the chaotic circumstances; the confounding effects of burns, infections, physical injuries and trauma, and contaminated food and water; and the overall magnitude of the damage (Figure 1). Medical facilities were destroyed, the infrastructure and resources of the 2 cities were disrupted, and a large percentage of trained medical personnel were among those killed. When early observers reported that the effects included some previously undocumented symptoms, the United States formed (October 12, 1945) the Joint Commission for the Investigation of the Effects of the Atomic Bomb in Japan to consider launching a study coordinated with Japanese scientists already in the 2 cities.Reference Beebe4
Destruction by the nuclear weapons in Hiroshima and Nagasaki

A, Hiroshima after the A-bombing. Some survivors were present near the hypocenter in buildings which survived the heat and blast. B, Nagasaki University Medical College Hospital buildings after the Nagasaki bombing. (Photographs by Dr Paul Henshaw and donated by family members to the Radiation Effects Research Foundation.)
The reports from the Joint Commission would impress influential scientists and officials in the United States, and on November 26, 1946, President Harry Truman approved a directive to the National Academy of Sciences/National Research Council “to undertake a long range, continuing study of the biological effects and medical effects of the atomic bomb on man.” This led to the establishment of the Atomic Bomb Casualty Commission (ABCC) in 1947, which was funded primarily by the United States. In 1975, the ABCC was restructured to become the Radiation Effects Research Foundation (RERF) and continued research on the health effects of atomic bomb (A-bomb) survivors and their children with financial and scientific support provided equally from both the Japanese and US governments. In this article, we describe the ABCC/RERF's study populations, the nature and results of the 63-year-long research program, and the opportunities facing RERF scientists and collaborators today.
THE EARLY YEARS OF ABCC AND THE STUDY COHORTS
The first ABCC studies focused on specific topics of interest to the medical scientists assigned to Japan. Because early observations of leukemia, birth defects in children who had been irradiated in utero, and cataracts were recorded, studies of hematology, growth and development, and cataracts were initiated. Those studies were mostly in the form of case reports or case series without a clearly defined population base. A notable exception was a study by Neel and Schull of the genetic effects of the A-bombs with a clear study design and well-defined objectives.Reference Neel and Schull5
In the 1950s, a complex of prefabricated Quonset hut buildings for offices, laboratories, and clinical examinations were constructed near the top of a hill in Hiroshima called Hijiyama. That facility, which also includes a dormitory/apartment building for visiting scientists and staff, remains in use today along with a facility in Nagasaki. The combination of a dedicated institution and facilities, continuous support by 2 governments, involvement of many dedicated visiting Western scientists (mostly American) to complement a long-term, persistent Japanese team of research scientists and staff with support from binational advisory groups has become the hallmark of the ABCC/RERF and an important reason for its success and recognition as the gold standard for radiation epidemiology and the study of radiation-induced health effects.
An important turning point in the history of studies of health effects at ABCC was the formulation of a unified study program by the Francis Committee in 1955.Reference Francis, Jablon and Moore6 The unified study program instituted continuing epidemiological follow-up for mortality and cancer incidence of a fixed sample of about 120 000 A-bomb survivors and control subjects (Life Span Study [LSS]), including a defined subset who would receive additional morbidity surveillance based on biennial health examinations (Adult Health Study [AHS]). Later, a cohort of in utero–exposed people and controls (in utero cohort) and still another cohort of children of exposed and nonexposed parents (F1 cohort) who were conceived after the bombs were added. Follow-up of those cohorts of more than 200 000 people from Hiroshima and Nagasaki continues today at RERF (Table 1), making possible a multitude of special studies ranging from epidemiological and clinical to pathological, immunological, and cell and molecular biological.
Atomic Bomb Casualty Commission/Radiation Effects Research Foundation Study Cohorts

Responders to the 1950 National Census indicated that there were about 284 000 A-bomb survivors (159 000 who were present in Hiroshima and 125 000 in Nagasaki). That group and several later censuses and similar efforts to enumerate city residents, including those who were not present during the bombings, served as the basis for selecting about 120 000 people to be enrolled into the LSS cohort,Reference Beebe and Usagawa7 including about 54 000 who were within 2.5 km of the hypocenter at the time of the bombings (relatively high radiation doses), 40 000 city-age-sex–matched survivors 2.5 to 10 km from the hypocenter (low or negligible radiation doses), and 26 000 unexposed subjects who were residents of Hiroshima or Nagasaki between 1951 and 1953 but who were not in either city at the time of the bombings. Individual dose estimates are available for about 92% of all of the survivors in the LSS cohort. Because all of the known survivors who were within 2.5 km of the hypocenter were enrolled in the cohort if they had not moved out of the city of exposure by 1950 and met other exclusion criteria, it is thought that the LSS cohort includes roughly half of all of the survivors alive 5 years after the bombing and with high radiation exposures.Reference Pierce, Shimizu, Preston, Vaeth and Mabuchi8
Several features of the LSS made it advantageous for radiation risk estimates and have been clear strengths of the studies compared with other attempts to study health effects in radiation-exposed populations. The cohort consists of all ages and both sexes with a wide range of doses, and they were not selected for health condition, occupation, or other specific reasons. The Japanese koseki family registration system permits virtually 100% mortality follow-up of this cohort. By 1959, high-quality cancer registries were established in Hiroshima and Nagasaki prefectures,Reference Mabuchi, Soda and Ron9 which provided more accurate diagnostic information than death certificates and covered less-fatal cancers, such as cancers of the breast, thyroid, and skin.Reference Thompson, Mabuchi and Ron10 Several mailed questionnaire surveys have been conducted for LSS members to obtain information on socioeconomic, lifestyle, and other factors that may confound or modify the radiation effects. An extensive autopsy program, most actively carried out during the 1950s and 1960s, provided information on the accuracy and types of misclassification of death certificate data.
The AHS is a clinical follow-up of a subset of the LSS that was selected so that about half of the subjects had received relatively high doses. The AHS subjects were invited to biennial clinical examinations at ABCC/RERF beginning in 1958, and the AHS has had a remarkably high continued participation rate of 70% to 80%. The biennial examinations included general physical examinations, history taking, a series of clinical laboratory tests, and ad hoc studies on specified conditions such as thyroid disease and ophthalmological conditions. Those longitudinal morbidity and laboratory data are an important complement for the assessment of noncancer diseases and conditions. In addition, biennial blood samples have been collected, providing stored serum, whole blood, and lymphocytes from approximately 17 000 A-bomb survivors. The biosamples are a valuable resource for biochemical and mechanistic laboratory studies.
The in utero and F1 cohorts are also followed up for mortality and cancer incidence. About 1000 of the in utero cohort have also undergone biennial health examinations as part of the AHS program. During 2002–2006, a subset of about 12 000 of the F1 cohort underwent health examinations for the first time (Table 1).
All of the cohorts benefited from continued cooperative support financially and scientifically for more than 60 years from the 2 governments (primarily the Ministry of Health, Labour and Welfare in Japan, and the US Department of Energy, the latter in part through the nongovernment National Academy of Sciences) and continued refinement of radiation dose estimates to individual survivors by RERF scientists in collaboration with experts outside RERF. The formation and subsequent management of ABCC was not totally free of administrative and political difficulties and challengesReference Lindee11Reference Schull12; however, the follow-up studies of the ABCC/RERF have been remarkably successful given various political, organizational, and funding challenges, and they continue today, conducted by about 240 employees including 45 research scientists.
DOSIMETRY
The Hiroshima A-bomb was a unique uranium gun-type device (“Little Boy”) with a 16-kiloton (kT) yield (ie, a yield equivalent to 16 kT of TNT) and the height of burst was 600 m above the ground. The hypocenter was near the city center and the time of detonation was 8:15 AM. The Nagasaki A-bomb was a plutonium implosive device (“Fat Man”) with a 21-kT yield detonated at 503 m above ground at 11:02 AM. The hypocenter was in Urakami Valley, about 1.5 km north of the city center.13 Although radiation doses were not directly measured during the bombings, various special methods have been devised to make retrospective estimates of the radiation doses and fluencies by measuring materials that were present in the city at relatively unshielded locations. Additional information useful for retrospective estimation of radiation doses has been obtained from measurements made at nuclear weapons tests and from simulations using other sources.1314Reference Cullings, Fujita, Funamoto, Grant, Kerr and Preston15
The availability of reliable and well-characterized radiation dose estimates for individual members of the cohorts is fundamental to the assessment of the health effects of radiation among the survivors and their children. ABCC, and later RERF, have undertaken continuous and extensive efforts to collect information and establish systems for estimating individual doses from the bombs. Several successively improved dosimetry systems have been developed by extramural working groups, including assistance from the National Research Council,16 and collaboratively implemented by ABCC and RERF investigators. The evolution of those systemsReference Cullings, Fujita, Funamoto, Grant, Kerr and Preston15 represents an important strength of RERF's risk estimates.
Because the direct A-bomb doses are from penetrating external radiations (gammas and neutrons) arising from a large, localized source, it is possible to calculate doses systematically as a function of distance from the hypocenter, external shielding (buildings and terrain), and body self-shielding (corrected for age, orientation, and position for organ doses). In ABCC/RERF dosimetry systems, basic information on distance and shielding (eg, whether inside or outside a building at the time of the bombing) is obtained from a number of early studies carried out at ABCC starting in 1947 and other official sources. In addition, a special large-scale field investigation conducted in the 1950s provides detailed external shielding histories for proximal survivors. Self-shielding by the human body is estimated using standardized models of the human body that were developed based on anthropometric data for the Japanese population of 1945. The current dosimetry system used by RERF is DS0213Reference Cullings, Fujita, Funamoto, Grant, Kerr and Preston15 and includes estimated organ doses for 15 organs.
The locations of individual survivors in Hiroshima who are members of the LSS are shown as dots superimposed upon a map of Hiroshima (Figure 2). One should note that there were few people who survived until 1950 within the first kilometer from the hypocenter. Those who did survive (shown in gray) sheltered in concrete or stone buildings or in underground shelters, and most of their doses are unknown because of the massive shielding that enabled them to survive the heat and forces of the blast and also shielded them from the gamma rays and neutrons. At longer distances from the hypocenter, the number of survivors in the successive enlarging areas (rings) increases, providing more survivors at lower doses, which lends analytical strength to the epidemiological risk estimates. Although some survivors received large whole-body radiation doses approaching lethality (>2 Gy), there is a much larger number of low doses represented (ie, the dose distribution is skewed toward the lower doses) such that the mean dose in the exposed LSS who received doses >0.005 Gy is about 0.2 Gy. The distribution of the LSS cohort members in dose categories is shown in Table 2. Hiroshima's survivors were distributed symmetrically about the hypocenter because the city is on a flat river delta, whereas the Nagasaki bomb was detonated north of the city center in a valley surrounded by steep mountain slopes so that survivors were located in an elongated distribution. If one were to project onto the Hiroshima map estimates of the destruction and lethality from contemporary strategic nuclear weapons (which are in the megaton range and tens to hundreds of times more powerful than the Hiroshima and Nagasaki bombs), because the maximum distance for lethal blast and thermal effects is much larger than that for lethal doses of ionizing radiation, survivors would not be expected to receive a broad distribution of radiation doses from the bomb's gamma rays and neutrons, as they did in Hiroshima and Nagasaki. For example, comparing a 20-kT burst detonated at 540 m with a 1-megaton burst detonated at 2 km, the radius of the lethal ionizing radiation dose only increases from 1.4 to 2.3 km, but the radius for conflagration increases from 2 to 10 km.Reference Eden17Reference Glasstone and Dolan18Reference Solomon and Marston19
Location of individual survivors in the LSS
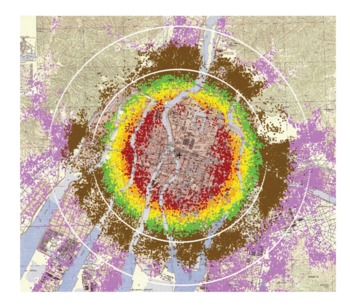
Location of individual survivors in the LSS superimposed on a map of the city with color denoting estimated radiation dose ranges (gray = unknown; red = >1000 mGy; orange = 500-1000 mGy; yellow = 200-500 mGy; brown = 5-100 mGy; pink = <5 mGy). Rings represent 2- and 3-km distances from the hypocenter (+).
Distribution of Life Span Study Subjects by Doses and Person-Years of Follow-up, 1958-1998

Uncertainties about survivor location and shielding are a major source of the random error in individual dose estimates. A statistical method assuming 35% random errors in individual dose estimates is used to adjust for the impact of those random errors on individual doses estimates.Reference Pierce, Stram and Vaeth20 RERF scientists have used the measurements of stable chromosome aberrations (translocations) in blood lymphocytesReference Kodama, Pawel and Nakamura21 and electron spin resonance signals in tooth enamelReference Nakamura, Miyazawa, Sawada, Akiyama and Awa22 from some individual A-bomb survivors to provide biodosimetric estimates of individual doses as a comparison with the physically estimated doses.
RERF RADIATION RISK ESTIMATES
Describing Radiation Risks
ABCC/RERF scientists have used primarily 2 types of risk calculations to describe the magnitude of a health effect associated with radiation exposure in epidemiological studies. The excess absolute risk or rate (EAR) refers to the difference in the rate of occurrence of disease between an exposed population and a comparable population with no exposure. The relative risk is the ratio of the occurrence rate in the exposed population to that in the nonexposed population. The excess relative risk (ERR) is the relative risk minus 1, which is essentially identical to the ratio of the EAR to the occurrence rate in the nonexposed comparison population. The ERR is a measure of the strength of the effect of exposure and may have biological significance, whereas the EAR is a measure of the absolute size of the effect, which may be of public health or clinical significance.
Both EAR and ERR can vary not only with radiation dose but also with age at exposure, time after exposure (attained age), sex, and other factors, such as with smoking. Modification of radiation risk by those factors occurs because baseline disease rates depend on those factors (eg, attained age, sex, calendar time) or because differences in sensitivity may vary with the factors (eg, age at exposure). Risk estimates are usually reported for a specific dose (eg, 1 Gy), for a specified combination of other factors, for example, for a person at attained age of 70 after exposure at age 30. The EAR is the estimated excess number of cases per 10 000 people per year per Gray, whereas the ERR per Gray refers to the estimated ERR for individuals exposed at 1 Gy. Risk estimates are typically calculated using regression models that include age at exposure, attained age, sex, city (Hiroshima or Nagasaki), and other factors as needed.Reference Mabuchi, Fujiwara and Preston23Reference Preston, Ron and Tokuoka24
Leukemia
There were suggestions of an increased risk of leukemia among the A-bomb survivors by the late 1940s, with the earliest published evidence in 1952.Reference Finch, Hrubec and Nefzger25Reference Furukawa, Cologne, Shimizu and Ross26 Excess leukemia deaths became the first major radiation-associated long-term health effect observed in the LSS, as illustrated in Figure 3; solid-cancer deaths followed soon afterward and noncancer disease deaths were suggested in the mid-1960s. Because individuals had to be alive in 1950 to be in the LSS cohort, risk assessment for the period 1945-1950 is not possible with the cohort data and the estimates are shown in the figure as a dotted line. The latest published LSS mortality data for leukemia are through 2002; there were 315 leukemia deaths in the cohort (Figure 4), and 98 (45%) of these are estimated to be excess deaths attributable to radiation exposure among the survivors exposed to >0.005 Gy.Reference Preston, Pierce and Shimizu27 The proportion increases with increasing dose and reaches about 86% among those exposed to doses >1 Gy.
LSS radiation-associated deaths per year

Solid cancer and noncancerReference Furukawa, Cologne, Shimizu and Ross26; leukemia.Reference Preston, Pierce and Shimizu27
Estimated proportion (attributable fraction) of radiation-related leukemia deaths by radiation dose (1950-2002)
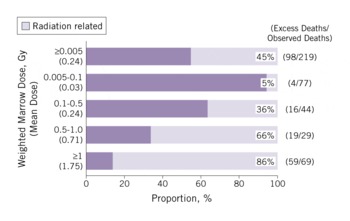
The shape of the curve for leukemias as a function of bone marrow dose is nonlinear, with an upward curvature in the range of 0 to 3 Gy.Reference Pierce, Shimizu, Preston, Vaeth and Mabuchi8Reference Preston, Pierce and Shimizu27 The nonlinear dose-response pattern is different from the linear one seen for solid cancers (Figure 5). Leukemia also demonstrates a unique temporal pattern in which the radiation-related risk is strongly modified by age and time after exposure. Figure 3 illustrates the higher excess deaths in the earlier years among those exposed at a young age, which is followed by a rapid decline with time. The majority of excess leukemia deaths from radiation among those exposed as children occurred during the follow-up period before 1975.Reference Pierce, Shimizu, Preston, Vaeth and Mabuchi8 There is, however, still evidence of a small increase in leukemia risk among the current survivorsReference Richardson, Sugiyama and Nishi28 and a significant linear radiation dose response for myelodysplastic syndromes, which are characterized by an increased risk of developing acute myeloid leukemia, in A-bomb survivors 40 to 60 years after the radiation exposure.Reference Iwanaga, Hsu and Soda29
Dose-response curve for solid-cancer incidence risk from LSS (1958-1998) and DS02 weighted colon doseReference Preston, Ron and Tokuoka24

Solid Cancers
With the continued increase in recorded cancer mortalities each year in the LSS (Figure 3), RERF's work emerged as a principal source of information for radiation risk assessment. The LSS cancer incidence data became increasingly important because of their better statistical precision, diagnostic validity, and coverage of many radiation-sensitive specific sites.Reference Mabuchi, Fujiwara and Preston23Reference Preston, Ron and Tokuoka24 There are some key features that can be generalized regarding the association between radiation exposures and solid cancers observed in the A-bomb survivors.
Temporal Patterns Include a Latency Period and Cancer Risk Continues Throughout Life
Unlike leukemia, the temporal patterns of radiation-related risks for solid cancers typically show a gradual increase starting several years after the bombings and roughly proportional to the age-related increase in baseline cancer rates (Figure 3).
Increased Radiation-Related Risks Have Been Observed for a Large Number of Organ Sites
Because the A-bomb survivors received whole-body exposures from penetrating radiation, excess cancer risks (ERR and EAR) have been estimated for a large number of organ sites. Dose responses are significant for cancers of the oral cavity, esophagus, stomach, colon, liver, lung, nonmelanocytic skin, female breast, ovary, urinary bladder, brain/central nervous system, and thyroid. The highest ERRs (>0.8, or >80%/Gy) are found for bladder, female breast, and lung cancers and relatively high (0.5-0.8, or 50%-80%/Gy) for cancers of the brain/central nervous system, ovary, thyroid, colon, and esophagus. A different ranking is obtained when one examines EARs, which have clinical or public health implications. High EARs, which reflect higher numbers of excess cancers, are seen for cancers of the female breast, stomach, colon, lung, liver, bladder, and thyroid in a descending order. For stomach and liver cancers, the ERR of about 0.3 is modestly high, but the excess in absolute risks is extremely high because of the high baseline rates for these cancers in Japan. The ERR for female breast cancer of 0.87 is among the highest of all of the solid cancer risks. Rectal cancer, prostate cancer, and malignant melanoma have not been significantly associated with radiation exposure. (Additional details regarding risks at specific cancer sites can be found in references 23 and 24.)
Pooling of All of the Solid Cancers Is Useful, Especially for Radiation Protection Purposes
Despite the fact that cancers include a variety of disease entities with varying pathogenesis and etiology, there is sufficient rationale for knowing the total radiation risk for all solid cancers. Pooling of all of the solid cancers enhances statistical precision, which is especially important in determining the shape of the dose response at low doses—a matter of special concern for radiological protection. Pooled data also help us to understand how radiation risk is modified by age, time, and sex, and it turns out that the pattern of radiation-related risk for solid cancers as a group is approximately observed for most individual cancer sites.
Less than 1000 of the Solid Cancer Cases in the LSS Are Estimated to Be Attributable to Radiation
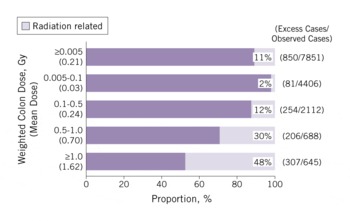
A total of 17 448 solid cancer incident cases were identified in a subcohort of more than 100 000 LSS subjects, and of those, 853 were estimated to be attributable to radiation. That represents 11% (attributable fraction) of all of the solid cancers among survivors exposed to >0.005 Gy (mean 0.21 Gy) (Figure 6). The attributable proportion increases with increasing dose and reaches 48% among those who received at least 1 Gy.
Estimated proportion (attributable fraction) of radiation-related solid-cancer incidence by radiation dose (1958-1998)
Radiation Dose-Related Increase Is Well Described by a Linear Dose-Response Relation
The linear response is illustrated in Figure 5 and is found for a number of specific cancer types. A linear-quadratic trend or a dose-threshold model does not fit the data any better than does a linear model. That linear response is largely driven by data in the dose range of 0.2 to 2 Gy, but about 75% of the survivors in the cohort were exposed at doses between 0.005 and 0.2 Gy, which is the range of doses of primary interest for low-dose risk estimation. It is therefore important to note that a statistically significant dose response is observed over the lowest dose range of only 0 to 0.15 Gy and that the trend in this range is consistent with that for the full dose range, supporting an approximately linear dose response down to the lowest dose range. The RERF ERR/Gy for solid cancer incidence is estimated to be 0.47 (or 47%) for a person aged 70 years who was exposed to the bombings at age 30, and this estimate is essentially the same as that for solid cancer mortality.Reference Preston, Shimizu, Pierce, Suyama and Mabuchi30 In the Biological Effects of Ionizing Radiation Report VII,31 the National Research Council's model was applied primarily to RERF's LSS data and yielded an ERR/Sv of 0.33 for men and 0.57 for women for solid-cancer incidence (exposure at age 30 and attained age 60). The analyses used the linearity of the dose-response curve for solid cancers and the quadratic response for leukemia to estimate that if a US population of 100 people were exposed to an acutely delivered dose of 0.1 Gy, there would be only about 1 person with cancer attributable to the radiation exposure, whereas 42 people would have been diagnosed as having cancer from other unknown sources.31 The risk estimates of the United Nations Scientific Committee on the Effects of Atomic Radiation (an ERR/Sv estimate for cancer incidence after exposure at all ages of 0.43 for men and 0.81 for women)32 and the International Commission on Radiological Protection (an ERR/Gy estimate for cancer incidence at age 70 for exposure at age 30 of 0.35 for men or 0.58 for women)33 are also based on models fit to the LSS cancer incidence data, with various adjustments such as for differing population demographics, for transporting data to populations with different background cancer rates, and for using selected dose and dose rate–reduction effectiveness factors.
Both the ERR and EAR Estimates for Solid Cancers Are About 50% Higher for Women Than for Men
The female:male sex ratio is 1.6 for ERR and 1.4 for EAR.
Excess Risks Are Highly Dependent on Age at Exposure and Attained Age
The ERR for people exposed to the bombs at a younger age is higher than those exposed at an older age. The risk is about twice as high after exposure at age 10 than at age 40. For all ages at exposure, the ERR declines over time (with increasing attained age). Contrarily, the EAR increases rapidly with age, with no apparent indication of abating, suggesting that the radiation-related excess risk may persist throughout one's lifetime, and this trend is seen for most of the cancer sites.
Clinical Data, Questionnaire Results, and Laboratory Data Using Stored Sera From the AHS Subjects Have Informed Radiation Risk Estimations
For example, radiation risk for stomach cancer was seen especially in nonsmokers and those with diffuse-type stomach cancerReference Suzuki, Cullings and Fujiwara34; dietary factors (consumption of fruit, vegetables, soy products, or green tea) had no demonstrable modifying effect on the radiation risk of gastric cancer.Reference Sauvaget, Lagarde, Nagano, Soda, Koyama and Kodama35
Noncancer Health Effects
The AHS is the principal source of morbidity information on increased risk of chronic (noninfectious) diseases other than cancer later in life. The initial selection of the approximately 20 000 AHS subjects was weighted toward individuals who had received higher doses to be maximally informative regarding radiation effects. The AHS provides longitudinal data on physiological changes and other subclinical characteristics and is a sampling frame for ad hoc studies focusing on special disease endpoints. The AHS is especially valuable for evaluating noncancer radiation effects because population-based disease incidence registries exist only for cancer. The major noncancer health effects and findings to date follow.
Lens Opacities
Cataracts were observed in survivors who received high doses within 3 to 4 years after the bombings,Reference Cogan, Martin and Kimura36 and subsequent publications identified posterior subcapsular opacities as the ocular lesion that is most characteristic of radiation exposure.Reference Miller, Fujino and Nefzger37Reference Choshi, Takaku and Mishima38 A subsequent reanalysis estimated a dose threshold at about 1.5 to 2 Gy,Reference Otake, Neriishi and Schull39 which was consistent with the judgments made for several decades by radiation protection advisory bodies indicating that excess opacities are unlikely to be found below 2 Gy and that cataracts that cause visual impairment would not be found below 5 Gy.4041 To assess vision-impairing cataracts, a more recent study assessed the prevalence cataract surgeries and found a 39% excess risk of cataract surgery at 1 Gy.Reference Neriishi, Nakashima and Minamoto42 The best estimate for a threshold dose was only 0.1 Gy with an upper confidence bound of 0.8 Gy, which is incompatible with a dose threshold of ≥2 Gy as proposed by the radiation protection bodies. It is the strongest, although not the only, evidence that is prompting radiation protection bodies to reconsider what maximum levels should be set to protect workers, such as interventional cardiologists and others who may receive substantial ocular radiation exposures. It is an example of the importance of a long-term follow-up of the A-bomb survivors as the cohorts continue to age.
Thyroid Diseases and Hyperparathyroidism
A thyroid-disease screening conducted in the A-bomb survivors some 55 years after the bombings used thyroid ultrasound with a standardized radiological review, clinical laboratory tests, and fine-needle biopsy for nodules >1 cm. A significant linear radiation dose response was found for thyroid nodules, with an excess odds ratio (or relative risk) per Gray of 2.01.Reference Imaizumi, Usa and Tominaga43 The prevalence of hyperparathyroidism has been found to increase with radiation dose, with an estimated excess relative risk of 3.1 at 1 Gy.
Cardiovascular and Other Late-Onset Diseases
Significant radiation dose-related increases for cardiovascular disease and other late-onset diseases emerged from the analyses of LSS mortality data (Figure 3) and were first reported in 1992 as a group and for several disease categories (eg, diseases of the circulatory, digestive, and respiratory systems).Reference Shimizu, Kato, Schull and Hoel44 Deaths from heart disease and stroke make up more than half (54%) of noncancer disease deaths, and the radiation dose response is significant for both categories of circulatory disease. Updated and more detailed analyses have shown that the dose-related increase in the risk of noncancer diseases cannot be explained by smoking or other confounding risk factors examined, possible bias associated with the selection of the survivors, or cancer to noncancer misclassification of causes of death.Reference Shimizu, Pierce, Preston and Mabuchi45 There are some key generalizations based upon the findings in the LSS, including: the ERR for noncancer disease is small and is estimated as 0.14 for mortality from all of the noncancer diseases, which is about one-third of that of 0.47 for all solid-cancer mortality; there is a considerable uncertainty regarding the dose response at doses below about 0.5 Gy,Reference Preston, Shimizu, Pierce, Suyama and Mabuchi30 which has suggested that there may be a threshold associated with certain types of noncancer mortality; and periodic analyses of the AHS biennial examination data have also identified radiation-related increased risks for several major noncancer disease categories,Reference Wong, Yamada and Sasaki46Reference Yamada, Wong, Fujiwara, Akahoshi and Suzuki47 such as for chronic liver disease (including fatty liver, alcoholic liver disease, and chronic hepatitis), uterine myoma, cataracts, and hypertension.
A recent publication showed an approximately linear dose response for heart disease mortality (ERR 0.14) in the LSS, although the magnitude of risk below about 0.5 Gy was not well defined.Reference Shimizu, Kodama and Nishi48 The finding is in accord with a number of clinical findings in the AHS. Radiation effects on subclinical endpoints of cardiovascular and related changes that have been reported include longitudinal elevations in systolic and diastolic blood pressureReference Sasaki, Wong, Yamada and Kodama49 and cholesterol levels.Reference Wong, Yamada, Sasaki, Kodama and Hosoda50 Dose-related differences were found in lipid profiles (increased total cholesterol and triglycerides, decreased high-density lipoprotein) which may suggest a mechanism linking radiation exposure to fatty liver and aortic arch calcification, hypertension, and ischemic heart diseases.Reference Akahoshi, Amasaki and Soda51 Finally, biological insights regarding the potential radiation effects on atherosclerosis have come from study results pointing to an association between radiation dose and increased inflammatory responsesReference Neriishi, Matuso and Ishimaru52Reference Sawada, Kodama and Shimizu53Reference Neriishi, Nakashima and Delongchamp54; for example, C-reactive protein levels and interleukin-6 levels were found to increase at 1 Gy by about 28% and 9%, respectively.Reference Hayashi, Kusunoki and Hakoda55
Psychological Effects. The extent of psychological and social effects of the bombing of Hiroshima and Nagasaki was captured by an in-depth interview study conducted in 1962Reference Lifton56 and numerous other anecdotal reports.Reference Yamada and Izumi57 A survey conducted 17 to 20 years after the bombings found that people who were in the city at the time of the bombings reported higher frequencies of anxiety and somatization symptoms (2 disorders that are frequently found in people with posttraumatic stress disorder) than those who were not in the city.Reference Yamada and Izumi57
Life Span Shortening. Median life expectancy decreased with increasing doses at a rate of about 1.3 years/Gy, but declined more rapidly at high doses.Reference Cologne and Preston58 Median loss of life was about 2 months for those with doses <1 Gy and 2.6 years for those with doses >1 Gy. It was estimated that at 1 Gy, the proportion of total life lost was roughly 60% from solid cancer, 30% from diseases other than cancer, and 10% from leukemia.
Cytogenetic Changes and Somatic Mutations. Chromosomal aberrations in lymphocytes are still observed in survivors more than 65 years after the A-bombs and a highly significant and nonlinear dose response was seen when aberration frequencies were plotted against DS86 doses.Reference Kodama, Pawel and Nakamura21
Immune Responses. Radiation-related changes in T-lymphoid cell composition include decreased proportions of CD4 helper cells and of naive CD4 and CD8 T cells. Both radiation-related impairments in T-cell function and dose-dependent increases in proportions of B cells and inflammatory cytokine levels have been observed.Reference Kusunoki, Yamaoka and Kubo59Reference Kusunoki, Hirai, Hakoda and Kyoizumi60Reference Kusunoki and Hayashi61 Mechanisms by which exposure to radiation from the A-bombs have led to the long-lasting immunological changes are under investigation at RERF, and it has been suggested that perturbed T-cell homeostasis may accelerate immunological aging (immunosenescence) and play a role in persistent inflammation involved in the development of some diseases such as atherosclerotic cardiovascular disease.
In Utero Exposure
The in utero cohort is composed of about 3300 individuals who were in their mother's womb at the time of the bombings.Reference Delongchamp, Mabuchi, Yoshimoto and Preston62Reference Preston, Cullings and Suyama63 The cohort was followed up for mortality and cancer incidence as with the LSS, and a subset is being clinically monitored with biennial clinical examinations as part of the AHS program.
Leukemia and Solid Cancers. Rather unexpectedly, during the first 15 years of life, only 1 death was recorded from leukemia or cancer in the in utero cohort.Reference Delongchamp, Mabuchi, Yoshimoto and Preston62Reference Jablon and Kato64 A recent report compared the risk estimates for those exposed in utero and during childhood as to the incidence of solid cancer at ages 12 to 55.Reference Schull, Nishitani and Hasuo67 Although there was a statistically significant dose dependence for the in utero group, the cancer risk was nominally smaller overall than in the childhood-exposure group, and the EAR did not increase with time/age as it did for those exposed in childhood. It does not appear that in utero exposure confers greater adult cancer risk than childhood exposure; however, further follow-up to older ages is needed.
Neurological Effects. An increase in frank mental retardation was found among those exposed in utero at 16 to 25 weeks and especially at 8 to 15 weeks postconception.Reference Otake and Schull65 No effects were seen for exposures before 8 weeks or after 25 weeks.Reference Otake, Schull and Lee66 The prevalence of the effect was estimated to be about 40% at 1 Gy in the group exposed at 8 to 15 weeks, but there appeared to be a dose threshold that was estimated to be >0.3 Gy. Mental retardation was often accompanied by reduced head size and magnetic resonance image examinations of several of the more pronounced cases showed an inappropriate migration of neurons to the ectopic gray matter of the cerebrum or faulty brain architecture.Reference Schull, Nishitani and Hasuo67 An IQ test administered to about 1670 school-age children who were in utero at the time of the bombings showed a general decrease in IQ of about 25 IQ points at 1 Gy for those who were 8 to 15 weeks postconception at exposure.68 Other evidence pertaining to school achievement and convulsive disorders are also consistent with dose-dependent neurological effects.68Reference Schull, Norton and Jensh69Reference Dunn, Yoshimaru, Otake, Annegers and Schull70
Genetic Effects in the Second Generation (F1)
Untoward Pregnancy Outcomes. A major concern at the time of the bombings was that the radiation exposure would result in genetic effects in the children of the survivors. Therefore, the ABCC initiated a large-scale study to assess the frequency of birth defects and other adverse pregnancy outcomes. That monumental effort was begun by Neel and Schull in 1948Reference Neel and Schull5 and included a population-based recruitment of 77 000 pregnant women in both cities, clinical follow-up of the pregnancies starting at the fifth month of gestation through birth, and administration of a questionnaire on survivor location and shielding.71 No clear evidence of the effect of parental radiation exposure was found on the frequency of untoward pregnancy outcomes as defined by congenital malformations, still births, and perinatal deaths within 1 week after birth.Reference Neel and Schull5
The frequency of F1 individuals with cytogenetic numerical or structural abnormalities based on Giemsa-staining methods was 0.5% to 0.6% in both children from exposed parent(s) (8322) and children from unexposed parents (7976).Reference Awa, Bloom, Yoshida, Meriishi and Archer72 De novo cytogenetic structural rearrangements were seen in 0.02% of children (with both parents unaffected) with no indication of a parental radiation exposure effect. Biochemical studies, designed to detect electrophoretic variants of serum proteins (30 different proteins in 13 000 offspring from exposed parents and 11 000 controls), found a small number (3 in each group) with no indication of a radiation effect.Reference Neel, Satoh and Goriki73 Beginning in the mid-1980s, systematic blood collection was initiated to establish immortalized (Epstein-Barr virus–transformed) lymphoblastoid cell lines from father-mother-child trios. Several molecular genetic studies using those cell lines are ongoing, including examination of mutation frequencies at minisatellite loci, deletion mutations using 2-dimensional gel electrophoresis techniques, and microarray-based comparative genomic hybridization methods. Thus far, no discernible effects of parental exposure have been observed.Reference Nakamura74 Although radiation is clearly known to be a mutagen and A-bomb radiation exposure to parents was expected to produce some level of mutations and heritable DNA damage in offspring, the latest estimates of that radiation risk of mutagenesis are low enough to expect that sensitive detection methods will be required if such mutations are ever to be detected in an A-bomb F1 cohort.
Cancer and Other Multifactorial Diseases. The need for long-term surveillance of the survivors' offspring was recognized and this led to the formation of the F1 cohort for mortality and cancer-incidence follow-up. The cohort includes about 77 000 offspring born between 1946 and 1984.Reference Kato, Schull and Neel75Reference Yoshimoto, Neel and Schull76Reference Izumi, Koyama, Soda and Suyama77 The most recent mortality and cancer incidence data show no evidence of either a paternal or maternal dose-related effect on cancer or noncancer mortality.Reference Izumi, Suyama and Koyama78 Analysis of cancer incidence data also provided no evidence of a radiation effect from either paternal or maternal radiation exposure.Reference Izumi, Koyama, Soda and Suyama77
The first study to examine whether parental radiation exposure leads to increased heritable risk of common adult-onset multifactorial diseases (eg, hypertension, type 2 diabetes mellitus, hypercholesterolemia, ischemic heart disease, stroke) was conducted in a clinical examination program of 12 000 offspring of A-bomb survivors who had reached a median age of about 50 years. Data indicated no evidence of an association between the prevalence of multifactorial diseases in the offspring and parental radiation exposure.Reference Fujiwara, Suyama and Cologne79 Continued follow-up to older ages is clearly needed to investigate the impact of possible genetic effects on disease morbidity and mortality as that cohort ages.
CHALLENGES, RESOURCES, AND OPPORTUNITIES FOR FUTURE WORK
Approximately 40% of the A-bomb survivors, but about 80% of those exposed before age 20 years, are alive today. The latter are just now entering their cancer-prone and “diseases of aging” years. It has been estimated that as many cancers in the LSS and AHS cohorts have yet to occur as have previously occurred and were recorded. That is a major source of uncertainty in estimating the lifetime risk of cancer and other illnesses that needs to be resolved. Therefore, continued follow-up of the LSS cohort for the next 20 years will be an important opportunity to refine our comparative risk estimates for those exposed as children compared to those exposed as adults. Furthermore, the children (the F1 generation) having 1 or both parents who were A-bomb survivors are younger than the LSS cohort members and are only beginning to enter their disease-prone years. The extensive data on radiation dose, disease experience, and ancillary disease risk factors accumulated during the course of 60 years provides a wealth of information that can be mined for years to come to address a wide range of questions regarding the health effects of ionizing radiation.
With respect to the search for radiation-induced mutations and risk to succeeding generations, the goal is that future RERF studies using powerful emerging technologies for DNA analyses will be able to detect an elevated mutation rate if one exists, or confirm the low mutation rate with a reasonably narrow upper-bound estimate for such mutations. Furthermore, the precious and extensive resource of biosamples contributed by A-bomb survivors offers hope for investigations of mechanisms for radiation-induced health effects for the benefit of the survivors and for humankind.
CONCLUSIONS
From among the ruins of two Japanese cities that experienced an event that the world hopes is never repeated emerged a uniquely historic and humanitarian research program. ABCC/RERF would become one of the world's longest continuing binational research projects producing the world's best risk estimations derived in a human population for health effects after an acute exposure to ionizing radiation. Deriving those health effects risk estimates continues to benefit the A-bomb survivors and provide international bodies such as the National Research Council and the United Nations Scientific Committee on the Effects of Atomic Radiation guidance for risk assessments and for governing groups responsible for establishing the world's radiation protection standards such as the International Commission on Radiological Protection. The lessons learned from establishing the cohorts and the pioneering analyses by ABCC and RERF scientists should serve as a legacy for future generations who experience occupational, medical, or environmental radiation exposures.
Author Disclosures: The author reports no conflicts of interest.


