


1. Introduction
The very high optical power density can be obtained in the focus region of the vacuum target chamber by focusing multibeams of high-energy pulsed lasers precisely. The smaller the focus spot, the higher the required target positioning precision. How to achieve high-precision focusing and positioning is a research focus of the optical system of the target area on the high-energy and high-power laser facility [Reference Hurricane, Callahan and Casey1–Reference Kong, Shin, Yoon and Beak6]. Direct and accurate detection and location of small-scale focal spots in short-pulse systems are key technical difficulties. The traditional focal spot detection technology can no longer meet the needs of high-power density lasers, especially fast-ignition drivers [Reference Imasaki and Li7–Reference Jarrott, McGuffey and Beg13] for high-precision beam target coupling of small-scale focal spots (less than one CCD pixel). The design and verification of the accurate detection technology of small-scale focal spots can provide technical support for the physical experiment and also provide the key technical reserve for the target system of the ultrashort pulse exawatt (EW, 1018 W) laser facility. The accurate detection method of small-scale focal spots (smaller than one CCD pixel) [Reference Lu, Liu and Wang14], by precisely moving the CCD to produce small displacement, uses the CCD pixel to “fine cut” the focal spot and thus reconstructs the centroid position and relative intensity distribution of the small-scale spot. In this paper, based on the theoretical model of the precise detection technology of the small-scale focal spot, the influence of the A/D conversion digits of the CCD on the measurement error is numerically simulated and analyzed, and the influence of the nonuniform response of a single CCD pixel on the measurement of the focal spot centroid position is studied. The research results can be used as the theoretical basis for the experimental research of small-scale focal spot detection and location.
2. Model and Method
When the response of the CCD is uniform, the response percentage of each point to the incident energy is the same within the pixel range, which is set as 100%. In this case, the response model of the CCD within each pixel range conforms to the Z = f(I) mode in [Reference Lu, Liu and Wang14].
In order to describe the nonuniformity of the CCD response in the center and edge of the pixel, a Gaussian model shown in equation (1) is used to describe the nonuniform response within a single pixel of the CCD.
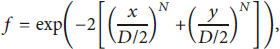
where N is the Gaussian order and D is the size of the pixel.
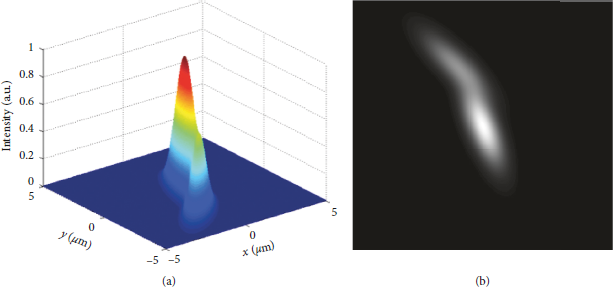
Take the Gaussian focal spot as an example to build a focal spot model. An ideal Gaussian spot model with a diameter of 2 μm is established, which is smaller than a single CCD pixel. The center of the spot is at the coordinate origin. The radius of the Gaussian spot is defined as the distance from the center of the spot to the position where the intensity drops to 1/e 2 of the peak value. The expression of the spot is as follows:
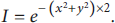
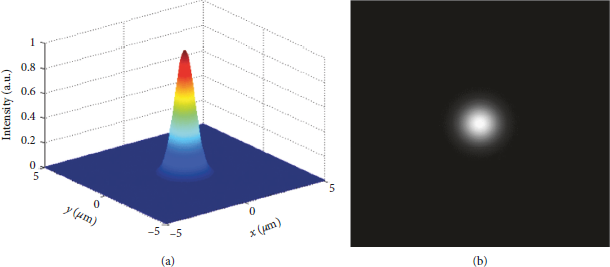
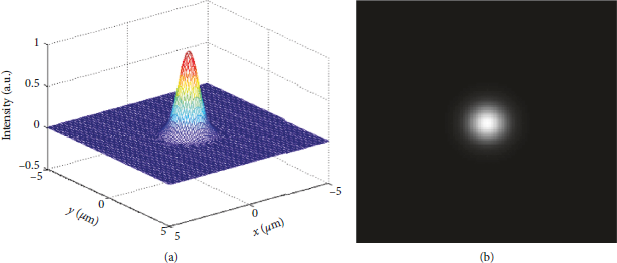
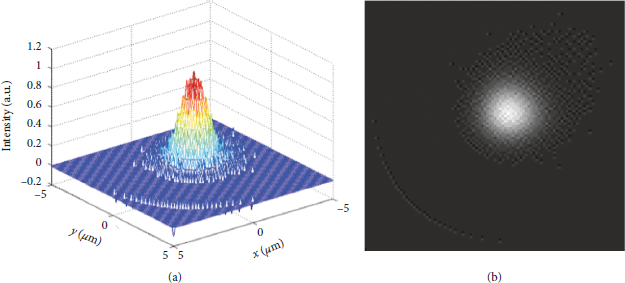
The intensity distribution and gray scale of the ideal Gaussian spot are shown in Figure 1.
(a) The intensity distribution of the ideal Gaussian focal spot. (b) The gray image of the ideal Gaussian focal spot.
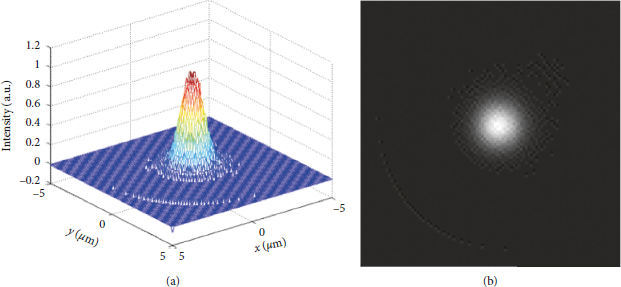
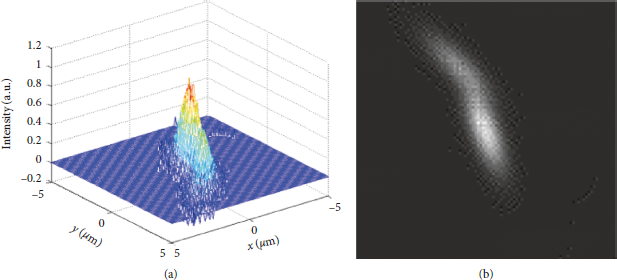
An irregular focal spot model with the size smaller than a single CCD pixel as shown in equation (3) is established, and the intensity distribution and gray scale image are shown in Figure 2. The centroid position of the spot is (−0.3 μm, −0.8 μm) calculated by the gray centroid method.
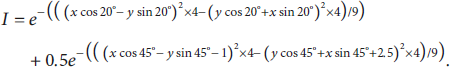
(a) The intensity distribution of the irregular focal spot. (b) The gray image of the irregular focal spot.
In the numerical simulation, only a single pixel of the CCD is considered, and the pixel gap of the CCD has no effect on the numerical simulation results. The size of the single pixel of the CCD is set to 10 μm × 10 μm. The CCD is a 12 bit scientific-grade CCD, and the measured gray value ranges from 0 to 4095.
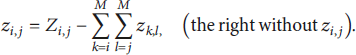
Limited by the dimension of one single pixel, general techniques for the detection of focal spots based on CCD are unable to measure spots of micrometer scale. A method of high-precision detection based on scanning imaging of CCD is proposed [Reference Lu, Liu and Wang14]. The CCD performs a two-dimensional snake scanning of the focal spot, in which a total of P 2 steps are moved. The focus spot is subdivided into P 2 subdivision blocks, and the gray value of each subdivision block is described in the matrix form, which is recorded as z i,j . The gray value collected by each step of CCD movement is recorded as Z i,j . Then, we can get the calculation formula of z i,j as shown in equation (4). The gray value z i,j of each subdivision small block can be obtained, and then the centroid position of the focal spot can be calculated by the gray centroid method.
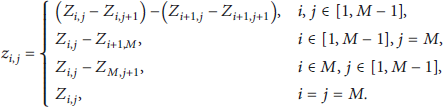
From equation (4), the inverse formula for calculating z i,j can be obtained as follows:
3. Numerical Simulation Results
Under the condition that the response model of a single pixel of the CCD is uniform and nonuniform, the centroid position and relative intensity distribution of the ideal Gaussian focal spot and the irregular focal spot are simulated, respectively. In the numerical simulation, a focal spot image with the same size and initially coinciding with a single specific pixel of the CCD is divided into 100 × 100 square blocks, and the side length of each small block is equal to each moving step of CCD with 0.1 μm. After obtaining the gray value of each subdivision block, the gray centroid method is used to calculate the centroid position of the ideal Gaussian focal spot and the irregular focal spot.
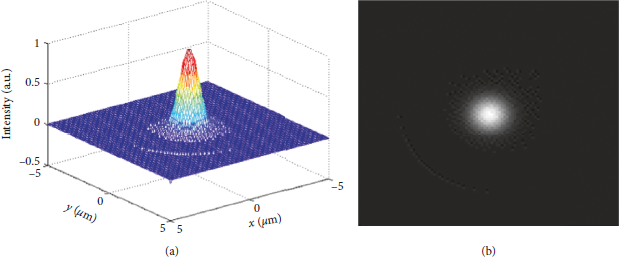
When the response mode of a single CCD pixel is uniform, the simulation results of the relative intensity distribution and gray scale distribution of the ideal Gaussian focal spot with a diameter smaller than the size of a CCD pixel as shown in equation (2) are shown in Figure 3. The centroid position of the focal spot is (0.0 μm, 0.0 μm), which is consistent with the position of the original focal spot. A burr-like phenomenon appears in Figure 3. This error is introduced by the A/D conversion of the CCD.
The ideal Gaussian focal spot with the CCD under the uniform response. (a) The intensity distribution. (b) The gray image.
Regardless of the A/D conversion process, the relative intensity distribution and gray scale distribution of small-scale ideal Gaussian focal spots are shown in Figure 4. The centroid position of the focal spot is (0.0 μm, 0.0 μm) which is consistent with the centroid position of the original focal spot.
(a) The intensity distribution of the focal spot after scanning without the A/D converter. (b) The gray image of the focal spot.
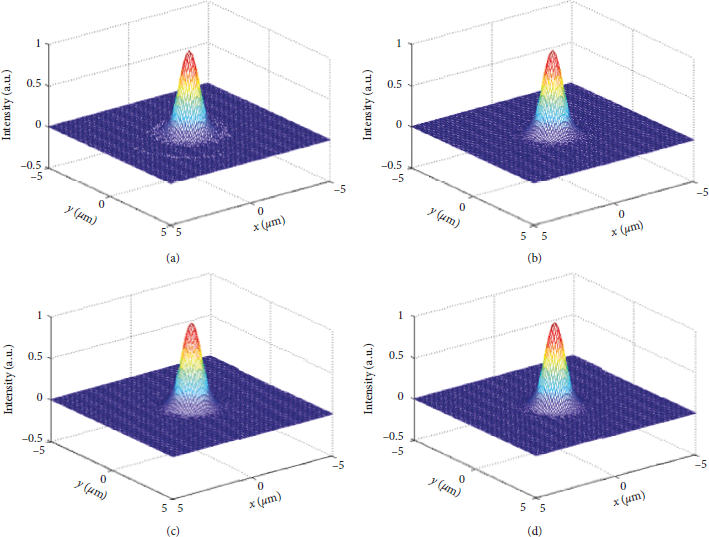
In order to study the influence of the A/D conversion resolution on the error, we studied the influence of different A/D conversion digits on the measurement results, as shown in Figures 5(a)–5(d), which are the reconstruction images of the focal spot corresponding to 14 bits, 16 bits, 18 bits, and 20 bits A/D conversion, respectively. From Figure 5, it can be seen that, with the increase of the A/D conversion digit, the burr-like phenomenon becomes less and less obvious. When the A/D conversion digit is 16 bits, the burr-like phenomenon of the reconstructed image is not obvious, and when the A/D conversion digit is 20 bits, the burr-like phenomenon has completely disappeared.
Measurement results versus A/D converter bits: (a) 14 bits; (b) 16 bits; (c) 18 bits; (d) 20 bits.
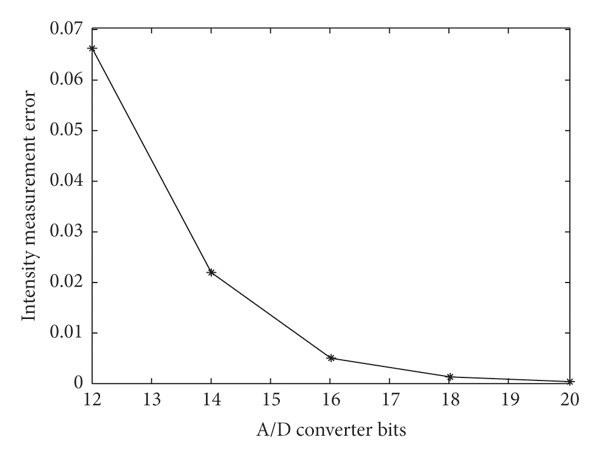
The focal spot reconstruction errors of different A/D conversion digits are analyzed, the result of which is shown in Figure 6. The ordinate in the figure is the intensity measurement error max |I 0 − I r |, where I 0 is the normalized intensity distribution of the original focal spot and I r is the normalized intensity distribution of the reconstructed focal spot. It can be seen that, with the increase of the A/D conversion digit, the measurement error becomes smaller and smaller. When the A/D conversion digit is 20, the error can be ignored.
Intensity measurement error versus A/D converter bits.
In view of the fact that the gray scale of the CCD in the experiment is 12, the following numerical research is carried out with the CCD with 12 bits of A/D conversion digit.
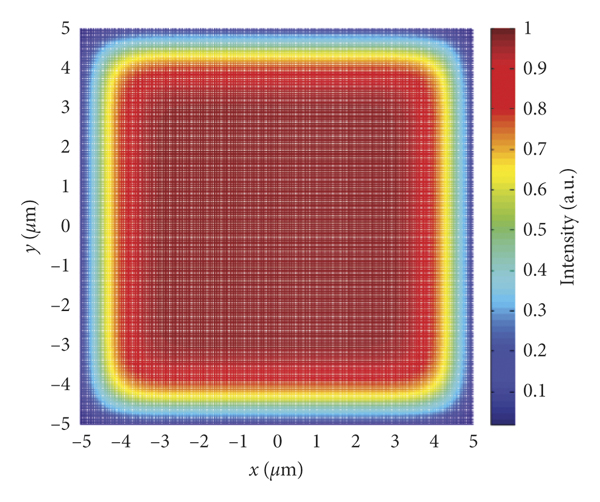
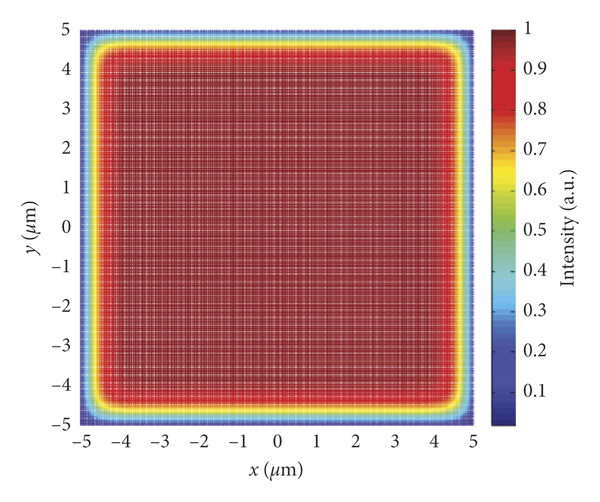
When the response model of a single CCD pixel is nonuniform, the response mode of the single CCD pixel is in the form of equation (1). The diameter of the CCD pixel D is 10 μm. When the order N of super-Gaussian in equation (1) is 10, the response mode of a single CCD pixel is shown in Figure 7.
Nonuniform response mode of the single CCD pixel, 10-order super-Gaussian.
The simulation results of the relative intensity distribution and gray scale distribution of the ideal Gaussian focal spot with a diameter smaller than the size of a CCD pixel are shown in Figure 8. The centroid position of the focal spot is (−0.5 μm, −0.5 μm).
The ideal Gaussian focal spot with the CCD under the nonuniform response of 10-order super-Gaussian. (a) The intensity distribution. (b) The gray image.
The above research shows that when the CCD nonuniform response is of the 10-order super-Gaussian response mode, there is a deviation between the obtained result of the centroid position of the focal spot and the true value of the centroid position of the focal spot.
When the super-Gaussian order N in equation (1) is 20, the response mode of a single pixel of the CCD is shown in Figure 9. The simulation results of the relative intensity distribution and gray scale distribution of the ideal Gaussian focal spot with a diameter smaller than the size of a CCD pixel are shown in Figure 10. The centroid position of the focal spot is (−0.2 μm, −0.2 μm).
Nonuniform response mode of the single CCD pixel, 20-order super-Gaussian.
The ideal Gaussian focal spot with the CCD under the nonuniform response of 20-order super-Gaussian. (a) The intensity distribution. (b) The gray image.
When the nonuniform response mode of the CCD is the 20-order super-Gaussian response mode, similar to the nonuniform response mode of CCD is the 10-order super-Gaussian response mode, there are errors in the measurement results of the centroid position of the focal spot. Due to the increase of the super-Gaussian order, the response of the CCD changes from nonuniform to uniform, and the errors of the measurement results of the centroid position of the focal spot are reduced accordingly.
The measurement errors of the centroid position of the focal spot under different Gaussian orders are shown in Figure 11. With the increase of the super-Gaussian order, the response of the CCD gradually transits to uniform response, and the measurement error of the centroid position of the focal spot gradually decreases.
Spot centroid position measurement error versus the CCD two-dimensional scanning under the nonuniform response with different super-Gaussian orders.
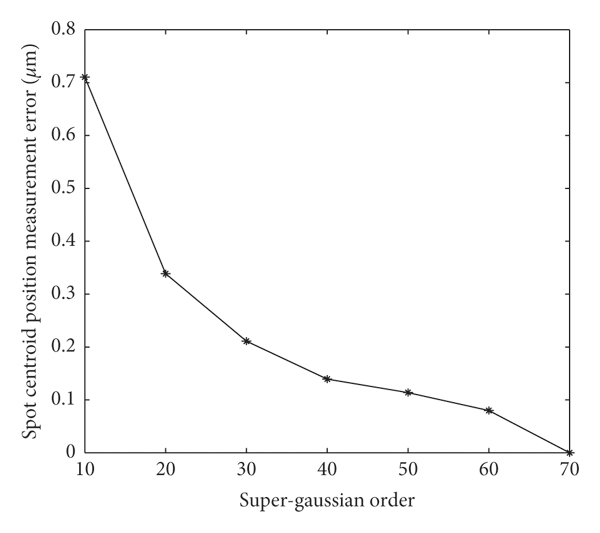
From the above numerical research results, it can be seen that when the response of a single CCD pixel is nonuniform, with the increase of the order of super-Gaussian response function, the response function becomes closer to a uniform response. When the order N of the super-Gaussian model of the CCD nonuniform response is less than 70, due to the nonuniformity of the response of a single CCD pixel, the calculated centroid position of the focal spot is different from the original centroid position of the focal spot. When the order of the super-Gaussian model of the CCD nonuniform response function is 10, the maximum error value is 0.7 μm, which is within the allowable range of the error. When the order of the super-Gaussian model of the CCD nonuniform response reaches 70 or greater, the response of a single CCD pixel becomes closer and closer to the uniform response. At this time, the calculated centroid position of the focal spot is consistent with the original focal spot.
When the response of a single CCD pixel is uniform, the simulation results of the relative intensity distribution and gray scale distribution of the irregular focal spot with a diameter smaller than the size of a CCD pixel as described in equation (3) are shown in Figure 12. The centroid position of the focal spot is (−0.3 μm, −0.8 μm), which is consistent with the position of the original focal spot.
The irregular focal spot with the CCD under the uniform response. (a) The intensity distribution. (b) The gray image.
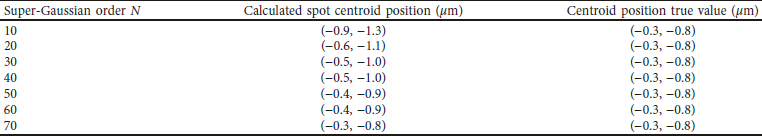
The diameter of the CCD pixel D is 10 μm. The measurement results of the centroid position of the irregular Gaussian focal spot are shown in Table 1 under different orders of the nonuniform response of the super-Gaussian model of the CCD. Similar to the above study, with the increase of the order of the super-Gaussian model of the CCD response function, the response mode of the CCD changes from nonuniform to uniform, and the measurement error of the centroid position of the focal spot also gradually decreases.
4. Conclusions
The centroid position and relative intensity distribution of the focal spot with different shapes and sizes less than the size of a CCD pixel are measured numerically by using the small-scale focal spot detection model. For the relative intensity distribution measurement, under ideal conditions, the detection error of the intensity information of the focal spot is introduced by the A/D conversion error of the CCD. The influence of the A/D conversion order of the CCD on measurement error is simulated and analyzed. Theoretical research shows that, with the increase of the A/D conversion digit, the measurement error becomes smaller and smaller. When the A/D conversion digit is 20, the error can be ignored.
The influence of the nonuniform response of a single CCD pixel on the measurement of the centroid position of the focal spot is numerically studied. When using the CCD two-dimensional snake scanning to measure the centroid position of the focal spot, due to the nonuniformity of the internal response of a single CCD pixel, there is a deviation between the calculated centroid position of the focal spot and the centroid position of the original focal spot. The maximum error value is 0.7 μm when the order of the super-Gaussian function of the CCD pixel nonuniform response is 10. When the order of the super-Gaussian function N of the CCD response function reaches 70 or more, the response of the single CCD pixel is close to the uniform response. At this time, the calculated centroid position of the focal spot is consistent with the original focal spot.
Data Availability
The data used to support the findings of this study are available from the corresponding author upon request.
Conflicts of Interest
The authors declare that they have no conflicts of interest.
Acknowledgments
This work was supported by the China Scholarship Council (Grant no. CSC201902335006) and the Education Department of Jilin Province (Grant no. JJKH20170572KJ).


 Open access