

Introduction
The activities of membrane-active peptides/proteins (MAPs) are mediated through direct interactions with lipid bilayer regions of cell membranes. Typical examples of MAPs are antimicrobial peptides (AMPs), lytic peptides, peptide toxins, pore-forming proteins such as pore-forming toxins (PFTs), lipidated peptides, and cell-penetrating peptides (CPPs). MAPs are classified into two categories (type A and B): type A MAPs induce damage to cell membranes/lipid bilayers, such as nanopore formation, whereas type B MAPs can translocate across the cell membranes/lipid bilayers without forming pores. Most MAPs belong to type A. For example, AMPs are produced by various organisms (e.g., amphibians, mammals [including humans], insects, and plants) and either inhibit the proliferation of bacteria and fungi (e.g., bacteriostatic activity) or kill these organisms (e.g., bactericidal activity) (Zasloff, Reference Zasloff2002; Hancock and Hans-Georg, Reference Hancock and Hans-Georg2006; Propheter et al., Reference Propheter2017; Matsuzaki, Reference Matsuzaki2019; University of Nebraska Medical Center, 2025). Most AMPs are classified as type A because they damage the bacterial cell membrane, resulting in rapid leakage of internal contents, and this has been directly supported by studies of the interactions between AMPs and single bacterial cells (i.e., single-cell analyses) (Sochacki et al., Reference Sochacki2011; Rangarajanm et al., Reference Rangarajanm2013; Barns and Weisshaar, Reference Barns and Weisshaar2013; Hossain et al., Reference Hossain2019; Islam et al., Reference Islam2023, Reference Islam2025). AMPs and other antimicrobial agents function within the body of various organisms (especially humans); thus, it is important that these compounds do not kill or damage the cells of these organisms. To determine whether new peptides/compounds extracted from various sources or de novo–designed peptides/compounds should be classified as AMPs/antimicrobial agents, the bacteriostatic and bactericidal activities are examined using various methods, including the single-cell analysis (Hossain et al., Reference Hossain2022). This is followed by analyses of hemolytic activity against red blood cells and cytotoxicity toward mammalian cells (i.e., cell viability assays) to confirm that the compounds do not damage mammalian cells. In contrast to AMPs, lytic peptides or peptide toxins (e.g., peptides produced by bees and wasps) induce membrane damage or kill eukaryotic cells (including human cells). On the other hand, CPPs can translocate across eukaryotic cell membranes and enter the cytosol, bringing with them a variety of biological molecules. Several routes for the entry of CPPs into eukaryotic cells have been considered, such as clathrin-mediated endocytosis, macropinocytosis, and direct permeation through the cell membrane (Magzoub and Gräslund, Reference Magzoub and Gräslund2004; Bechara and Sagan, Reference Bechara and Sagan2013; Pisa et al., Reference Pisa2015; Guidotti et al., Reference Guidotti2017; Islam et al., Reference Islam2018). Some CPPs and AMPs belong to type B (Park et al., Reference Park2000; Magzoub and Gräslund, Reference Magzoub and Gräslund2004; Krizsan et al., Reference Krizsan2014; Islam et al., Reference Islam2018; Hossain et al., Reference Hossain2021). Type B AMPs bind to DNA, proteins, and ribosomes in the bacterial cytoplasm, thereby disrupting critical cell functions (Brogden, Reference Brogden2005). The large negative membrane potential of bacterial cells and their spheroplasts enhances the rate of entry of type B AMPs into their cytosol without pore formation (Hossain et al., Reference Hossain2021).
Several methods have been utilized to detect and characterize MAP-induced membrane damage. For example, single-channel recording (SCR) (Sackmann and Neher, Reference Sakmann and Neher2009; Hill, Reference Hill1992) can be used to measure the electric current resulting from the flux of ions such as Na+ and K+ in single MAP-induced nanometer-size pores (i.e., nanopores) as a function of applied voltage in order to obtain single-channel conductance of the nanopores. Thus, SCR provides information regarding the size and number of MAP-induced nanopores that can form specific structures, such as barrel-stave pores (Kagan et al., Reference Kagan1990; Opsahl and Webb, Reference Opsahl and Webb1994; Wu et al, Reference Wu1999; Jean-François et al., Reference Jean-François2008). Atomic force microscopy (AFM) has been used to examine the structure of planar lipid bilayers supported by a solid surface (i.e., supported lipid bilayers [SLBs]) and that of SLBs interacting with MAPs. The measurement of changes in the height of SLBs provides information regarding the size and number of MAP-induced nanopores. Compared with SCR measurements, AFM can provide more information regarding larger-sized pores formed by compounds such as PFTs, bacteriocin, and AMPs (Rakowska et al., Reference Rakowska2013; Podobnik et al., Reference Podobnik2016; Hammond et al., Reference Hammond2020; Hoose et al., Reference Hoose2025). To examine the ability of MAP-induced damage in lipid bilayers, measurement of MAP-induced leakage of fluorescent probes (e.g., calcein) from large unilamellar vesicles (LUVs) in their suspension (i.e., LUV suspension method) has been performed extensively (Matsuzaki et al., Reference Matsuzaki1995; Reference Matsuzaki1996; Ladokhin et al., Reference Ladokhin1995; Yandek et al., Reference Yandek2007; Gregory et al, Reference Gregory2009; many references cited in Islam et al., Reference Islam2014b). However, many factors can cause leakage from LUVs, such as nanopore formation, burst (or rupture) of LUVs, strong association of LUVs inducing large deformation and instability, vesicle fusion inducing transformation of LUVs to oligo- or multi-lamellar vesicles, and membrane solubilization (Yamazaki, Reference Yamazaki2008; Islam et al., Reference Islam2014b). These factors cannot be identified based on the LUV leakage experiments alone. Thus, it is impossible to determine whether MAPs induce nanopore formation based solely on the results of leakage experiments using the LUV suspension method. It should be noted that, especially in regard to interactions between positively charged AMPs and LUVs containing high concentrations of negatively charged lipids, extensive LUV aggregation can occur, resulting in vesicle fusion in some cases (Bastos et al., Reference Bastos2008; Gratino et al., Reference Gratino2024), ultimately leading to leakage without nanopore formation. Another disadvantage of the LUV suspension method is that it provides only the average amount of leakage from all LUVs in a suspension, which is a measure of MAP-induced membrane damage; thus, it is difficult to separate and analyze the elementary processes resulting in membrane damage (Yamazaki, Reference Yamazaki2008; Islam et al., Reference Islam2014b).
When using giant unilamellar vesicles (GUVs), by contrast, the cause of MAP-induced leakage of fluorescent probe molecules can be readily determined because each single GUV can be observed in real time. Such GUV studies have revealed several modes of MAP-induced membrane damage, such as nanopore formation and burst or rupture of GUVs (local or complete) (Billah et al., Reference Billah2024). In some cases, MAPs induce membrane permeation of substances such as water-soluble fluorescent probes from GUVs without any significant change in the structure and size of the GUVs, which is defined as nanopore formation in the membrane. In another case, the interaction of MAPs with GUVs induces a decrease in GUV size due to the formation of a micrometer-size pore (i.e., a micropore) or the formation small aggregates of lipid membranes and inward budding (or vesicular structures) in the GUV membrane and/or the GUV lumen (in some cases, ultimately resulting in complete conversion of GUVs into large aggregates of lipid membranes), along with rapid leakage of internal contents, which is defined as GUV burst (or rupture) (Billah et al., Reference Billah2024). It was also reported that MAPs interact with lipid bilayers in a similar manner to detergent micelles (i.e., membrane solubilization) based on the results of the MAP-induced decrease in GUV surface area, which has been attributed to extraction of lipids from the GUV membrane by MAPs (Chen et al., Reference Chen2014; Khadka et al., Reference Khadka2017), although the formation of invaginated structures such as dense particles and narrow tubes in the GUV membrane and lumen can also explain the decrease in GUV area (Tamba et al., Reference Tamba2025). Studies of MAPs using GUVs have primarily utilized two methods, the single-GUV method and the GUV suspension method. In the single-GUV method, interaction between the MAP and a GUV is initiated by the addition of a MAP solution into the vicinity of a GUV using a micropipette, which enables observation of single GUVs before starting the interaction and during the interaction. Thus, time courses of change in various physical quantities or characteristics can be monitored across the total time from start to completion of the interaction, such as changes in the fluorescence intensity of the GUV lumen due to the presence of water-soluble fluorescent probes (e.g., calcein and AlexaFluor [AF] 647) and the fluorescence intensity of a GUV membrane due to binding of fluorescent probe-labeled MAPs [FL-MAPs] (Tamba and Yamazaki, Reference Tamba and Yamazaki2005; Reference Tamba and Yamazaki2009; Tamba et al., Reference Tamba2010; Lee et al., Reference Lee2013; Islam et al., Reference Islam2014a; Karal et al., Reference Karal2015a). In the GUV suspension method, many GUVs are mixed with a MAP solution (containing a fluorescent probe in most cases) and observed. This method allows for observation of the various physical quantities and characteristics of the GUVs from several minutes after initiating the interaction (Ambroggio et al., Reference Ambroggio2005; Schön et al, Reference Schön2008; Ciobanasu et al., Reference Ciobanasu2010; Bleicken et al., Reference Bleicken2013; Wheaten et al., Reference Wheaten2013). Another advantage of the single-GUV method is that MAP concentration near a single GUV can be kept constant during the interaction, whereas in the GUV suspension method, the MAP concentration near single GUVs changes with time and it depends on the GUV density in their suspension (Islam et al., Reference Islam2014b). For the studies of MAP-induced nanopore formation using the single-GUV method, the efflux (or leakage) of substances such as fluorescent probes from a GUV is measured (Figure 1a). As an example, Figure 1b shows the leakage of calcein from a GUV induced by the AMP magainin 2 (Mag) (Tamba and Yamazaki, Reference Tamba and Yamazaki2009). In most studies using the GUV suspension method, however, the influx (or entry) of substances is measured (Figure 1c). For example, Figure 1d shows the influx of AF488–labeled cytochrome c and allophycocyanin (APC, 104-kDa far-red fluorescent protein) into the GUV lumen induced by Bax (a Bcl-2 proapoptotic protein) and cBid (caspase-8–cleaved Bid) (Bleicken et al., Reference Bleicken2013).
Membrane permeation (efflux (or leakage) and influx (or entry)) of water-soluble fluorescent probes through MAP-induced nanopores in GUVs. Its schematic drawing for the efflux (or leakage) from a GUV (a) and for the influx (or entry) into GUVs (c). A circle and its black line denote a GUV and its rim (i.e., GUV membrane), respectively. The green color in a circle (GUV) denotes fluorescence intensity of GUV lumen due to fluorescent probes (I lumen). In (a), the decreasing color shows a decrease in I lumen, indicating the efflux (or leakage) of the probes through nanopores, and in (c), the increasing color shows an increase in I lumen, indicating the influx (or entry) of the probes through nanopores. (b) AMP, magainin 2-induced leakage of calcein from a PC/PG (6/4) -GUV in buffer. (1) (3) Phase-contrast images and (2) fluorescence microscopic images. The numbers above the images denote the interaction time (s). Bar, 10 μm. (d) Bax (a Bcl-2 proapoptotic protein) and cBid (caspase-8-cleaved Bid)-induced influx of AF488-labeled cytochrome c and APC (104 kDa far-red fluorescent protein) into the lumen of PC/PE/PI/PS/CL (49/27/10/10/4)-GUV lumens in buffer. Merged fluorescence images: cytochrome C (green) and allophycocyanin (red). The numbers inside images (at the bottom) denote the interaction time (min). Bar, 20 μm. (b, d) are reproduced from Tamba and Yamazaki (Reference Tamba and Yamazaki2009) and Bleicken et al. (Reference Bleicken2013) with permission from the American Chemical Society and American Society for Biochemistry and Molecular Biology, respectively.

Figure 1. Long description
Panel A at the top left is a schematic sequence of five circles, each with a black outline, progressing from fully green to white, with rightward blue arrows between them. This illustrates decreasing fluorescence intensity inside a G U V, representing efflux or leakage of fluorescent probes. Panel B below A contains a horizontal series of ten grayscale microscopy images. The first image is labeled 25, showing a bright circular G U V; subsequent images are labeled 45, 173, 180, 185, 192, 202, 226, and 255 s, showing a gradual loss of internal brightness, indicating calcein leakage over time. The first and last images are phase-contrast, while the others are fluorescence. Panel C at the middle left is a schematic with four white circles inside a green square, progressing through four stages from left to right, with blue arrows between. The circles become increasingly green, representing influx or entry of fluorescent probes into G U Vs. Panel D at the bottom is a grid of twelve color fluorescence microscopy images labeled 0 to 11, showing multiple black and green circles on a multicolored background. Over time, green fluorescence appears inside circles, indicating entry of labeled cytochrome c and allophycocyanin into G U V lumens. Scale bars are present in panels B and D.
Studies using GUVs offer several advantages over other methods for investigating MAP-induced membrane damage. AMPs are known to induce either the rapid leakage of fluorescent probes (e.g., calcein [Stokes-Einstein radius, R SE, 0.74 nm]) or entry of fluorescent probes (e.g., SYTOX green [R SE = 1 nm]) in live bacteria cells by damaging the cell membrane such as pore formation (Sochacki et al., Reference Sochacki2011; Rangarajanm et al., Reference Rangarajanm2013; Barns and Weisshaar, Reference Barns and Weisshaar2013; Hossain et al., Reference Hossain2019; Islam et al., Reference Islam2023), resulting in rapid cell death (Islam et al., Reference Islam2023). Especially in regard to investigations of AMPs, methods using GUVs and LUVs offer distinct advantages over other methods, such as SCR, because they enable direct measurement of the membrane permeation of fluorescent probes. Studies using GUVs can provide detailed information regarding the elementary processes underlying MAP-induced membrane damage and the inter-relationships between these processes. For example, MAP-induced nanopore formation and membrane permeation of fluorescent probes through the pores can be observed separately, clarifying the inter-relationships between the elementary processes of MAP-induced nanopore formation (Islam et al., Reference Islam2014b; Hasan et al., Reference Hasan2019). GUV-based studies can also provide clear information regarding the effects of membrane tension and membrane potential on MAP-induced nanopore formation (Hasan et al., Reference Hasan2019; Moghal et al., Reference Moghal2020b; Ahmed et al., Reference Ahmed2025b).
As described above, MAPs-induced nanopore formation plays a vital role in the enhancement of membrane permeation and the inducement of cell death (Fuertes et al., Reference Fuertes2011; Islam et al., Reference Islam2014b, Reference Islam2025; Guha et al., Reference Guha2019). As a different action mode of MAPs against lipid bilayers/cell membranes from the nanopore formation, MAP-induced membrane disruption and GUV burst (or rupture) are well known, which have been explained by the carpet model (e.g., Shai, Reference Shai1999; Fernandez et al., Reference Fernandez2012; Tsukamoto et al., Reference Tsukamoto2021). Recent studies using GUVs have revealed that some MAPs-induced membrane disruption originates from MAPs-induced nanopores (Billah et al., Reference Billah2024). Therefore, among several actions of MAPs, nanopore formation is the most important and fundamental, and thus, it is crucial to reveal the modes, elementary processes, and mechanisms of various MAPs-induced nanopore formation. There are various modes of MAP-induced nanopore formation (e.g., pore size and lifetime of pore), its elementary processes, and mechanisms (Fuertes et al., Reference Fuertes2011; Islam et al., Reference Islam2014b; Guha et al., Reference Guha2019). This review focuses mainly on the MAP-induced nanopores in GUVs, which cause membrane permeation of water-soluble fluorescent probes without any significant change in the structure and size of the GUVs, and summarizes current understanding regarding MAP-induced formation of these nanopores. Here, AMPs, lytic peptides, and CPPs are mainly selected as representative MAPs. Most of these MAPs form complete or partial α-helical structures in lipid bilayers or irregular structures for short MAPs (see section ‘Binding of MAPs to lipid bilayers’ for details). Thus, we do not review MAPs that form β-barrel nanopores here. MAPs that form ion channels are not described in detail here because they have been examined using SCR approaches. If readers are interested in MAP-induced membrane disruption or GUV burst (or rupture), other review articles (e.g., Billah et al., Reference Billah2024) are appropriate. It should be noted that nanopores detected in GUV studies are defined as the structure in which membrane permeation of water-soluble fluorescent probe molecules occurs, and thus, nanopores that are smaller than the fluorescent probe molecules cannot be detected. Currently, the minimum size of these probes is ~0.5 nm (e.g., R SE of AF488 = 0.48 nm), which makes it difficult to detect nanopores smaller than this size. The stability of nanopore can be judged by the time course of the membrane permeability, and the experimental results indicate that most of these nanopores are stable at least for several minutes, although some factors, such as membrane tension and lipid compositions, decrease the lifetime of stable nanopores. On the other hand, it is known that in lipid bilayers in the presence of membrane tension, a small defect with lower lipid density called a pre-pore is formed transiently due to thermal fluctuation of lipid density, which can be considered an unstable small defect containing water or a water channel with a very small lifetime (e.g., Ahmed et al., Reference Ahmed2025b). Water-soluble fluorescent probes cannot pass through pre-pores, but lipid molecules and MAPs bound to the membrane interface can diffuse through pre-pores to the opposite leaflet (e.g., flip-flop of lipids), depending on the size of pre-pores (Hasan et al., Reference Hasan2018b; Reference Hasan2019; Saha et al., Reference Saha2020). In this review, we first review studies of the initial elementary process, i.e., the binding of MAPs to the lipid bilayers. Second, we review GUV-based studies of the rate of MAP-induced nanopore formation and the rate of membrane permeation of fluorescent probes through the nanopores. GUV-based studies can reveal many aspects of elementary processes underlying MAP-induced nanopore formation and the inter-relationships between these processes. Thus, third, we review the relationship between the elementary processes underlying MAP-induced nanopore formation and the mechanism. As one of the elementary processes, the translocation of MAPs across lipid bilayers without pore formation and its mechanism (i.e., pre-pore model) are also reviewed. Fourth, we review the effects of membrane tension, membrane potential, and lipid composition on the formation and stability of MAP-induced nanopores. Finally, we discuss our perspectives on the future of GUV-based studies of MAP-induced nanopore formation.
Binding of MAPs to lipid bilayers
In most cases, proteins and peptides bind to their receptors (membrane proteins or specific lipids such as glycolipids) in the cell membrane. Most MAPs, by contrast, do not have receptors and thus bind to lipid bilayer regions of the cell membrane, although some MAPs, such as PFTs, do have specific receptors (e.g., sphingomyelin [SM] for lysenin). Two lines of experimental evidence for AMPs support this concept. The first line of evidence is that AMPs composed of only synthetic D-amino acids exhibit the same antimicrobial activity as the corresponding wild-type AMPs composed of L-amino acids (Wade et al., Reference Wade1990; Bobone and Stella, Reference Bobone, Stella and Matsuzaki2019). The second line of evidence is that AMPs bind to LUVs and GUVs of various lipid compositions and damage their membranes, resulting in leakage of the internal contents (see sections ‘Introduction’ and ‘MAP-induced nanopore formation and membrane permeation through pores’ for details). Lipid bilayers can be separated into two parts, the membrane interface (MI) and the hydrophobic core (HC). For studies of MAPs, lipid bilayers in the liquid-crystalline (Lα) phase (or liquid-disordered [l d] phase) are used because most parts of the cell membrane are in this phase. Due to the large thermal motion of lipid molecules in the Lα phase, the membrane interface is composed of hydrophilic segments, hydrocarbon chains of lipids, and water, whereas the hydrophobic core contains only the hydrocarbon chains; peptides can bind to the membrane interface due to interfacial hydrophobicity (Wiener and White, Reference Wiener and White1992; Wimley and White, Reference Wimley and White1996). The permittivity (dielectric constant) of the membrane interface is low due to the presence of hydrocarbon chains, and as a result, most peptides form a secondary structure such as an α-helix. The width of the membrane interface is sufficiently large such that the α-helix can localize there parallel to the membrane surface (White and Wimley, Reference White and Wimley1994). Most amphipathic MAPs localize only at the membrane interface before membrane damage, such as pore formation, occurs, whereas hydrophobic peptides can more readily insert into the hydrophobic core.
The binding of MAPs such as AMPs to lipid bilayers has been investigated using various experimental techniques (e.g., isothermal titration calorimetry [ITC], surface plasmon resonance [SPR] spectroscopy, and fluorescence spectroscopy) using the LUV suspension method. ITC analysis directly provides the enthalpy of peptide binding to the lipid bilayer, and theoretical analysis of the data then enables determination of the free energy of binding, the intrinsic binding constant, and the entropy of binding (Wieprecht et al., Reference Wieprecht2000; Seelig, Reference Seelig2004). SPR spectroscopy provides the rate constant for the binding of MAPs to lipid membranes (where SLBs are used) from aqueous solution and that for the unbinding of MAPs from lipid membranes to the aqueous solution (Hall et al., Reference Hall2003; Lee et al., Reference Lee2015). If an appropriate fluorescent probe (e.g., Trp residues or various synthetic fluorescent probes) is attached to the peptides, fluorescence spectroscopy can be used to obtain the intrinsic or apparent binding constant of the peptides to the lipid bilayers by measuring the fluorescence intensity (Tamba and Yamazaki, Reference Tamba and Yamazaki2009) and fluorescence lifetime (Bastos et al., Reference Bastos2008).
The secondary structure and orientation of MAPs bound to lipid bilayers have been investigated using a range of approaches (e.g., circular dichroism [CD], Fourier-transform infrared [FTIR], electron paramagnetic resonance [EPR], and solid-state nuclear magnetic resonance [NMR] spectroscopy). Many MAPs exhibit a random coil or irregular structure in aqueous solution, but after binding to the membrane interface, they form specific secondary structures such as the α-helix. For example, AMPs such as Mag and PGLa form ~100% α-helices along the membrane interface of phosphatidylcholine (PC)/phosphatidylglycerol (PG) bilayers. The tilt angle of the α-helix relative to the membrane normal (determined using solid-state NMR spectroscopy) depends on the type of MAP, for example, 90° (i.e., parallel to the membrane surface) and 125° for Mag and PGLa (at high concentrations), respectively (Bechinger et al., Reference Bechinger1993; Hirsh et al., Reference Hirsh1996; Tremouihac et al., Reference Tremouihac2006; Strandberg et al., Reference Strandberg2009). EPR measurement also supports the results of the orientation of Mag obtained using solid-state NMR (Mayo et al., Reference Mayo2018). The CPP transportan 10 (TP10) forms an α-helix in the C-terminal region (fraction of helix: 56%), with a tilt angle of 125° and a flexible structure, such as a random coil in the N-terminal region in PC/PG membranes (Fanghänel et al., Reference Fanghänel2014). These quantitative data regarding the orientation of MAPs in lipid bilayers were obtained using solid-state NMR spectroscopy and EPR, although more classical experimental techniques, such as the quenching of fluorescence due to probes and MAP Trp residues using hydrophilic quenchers (e.g., acrylamide) and hydrophobic quenchers (e.g., spin-labeled lipids) can provide qualitative information regarding the orientation of MAPs in the lipid bilayer (Gratino et al., Reference Gratino2024; Zorila et al., Reference Zorila2025). By contrast, some AMPs (e.g., lactoferricin B [LfcinB]) form a specific three-dimensional (3D) structure in aqueous solution due to the presence of disulfide bonds (Hwang et al., Reference Hwang1998), and the lytic peptide melittin form a specific 3D structure in aqueous solution that has a kink in the structure at the center connecting two α-helical regions in the tetramer (Terwilliger and Eisenberg, Reference Terwilliger and Eisenberg1982). One of the characteristics in structures of MAPs is their amphipathic structure (e.g., amphipathic α-helix and amphipathic 3D structure), which contributes greatly to their binding to the membrane interface of lipid bilayers and nanopore formation. All-atom molecular dynamics (MD) simulations enable monitoring of the structural changes in MAPs that occur upon binding to lipid bilayers from aqueous solution (VanWyk et al., Reference Van Wyk2025; Zorila et al., Reference Zorila2025). The 3D conformation of MAPs and its fluctuations during the course of MD simulations (~200 ns) can be compared with experimental results obtained using CD and FTIR spectroscopy. The number of lipids that interact with MAPs and the number of hydrogen bonds formed between MAPs and lipid headgroups (VanWyk et al., Reference Van Wyk2025; Zorila et al., Reference Zorila2025) and profiles of the potential of mean forces between MAPs and the lipid bilayer surface can also be obtained (Zorila et al., Reference Zorila2025). The binding of MAPs to a lipid bilayer per se does not induce the membrane damage such as nanopore formation (see section ‘Relationship between elementary processes of MAP-induced nanopore formation and factors inducing pore formation’ for details); thus, reliable conclusions regarding the relationship between the binding of MAPs to lipid bilayers and MAP-induced nanopore formation are difficult to make (VanWyk et al., Reference Van Wyk2025).
Several interactions play an important role in the binding of MAPs to the membrane interface of the lipid bilayer. If MAPs are cationic peptides/proteins, one important factor is the electrostatic interaction between positively charged MAPs and negatively charged lipid bilayers, or between MAPs and positively charged lipid bilayers produced by the binding of MAPs to electrically neutral lipid bilayers. The outer leaflet of the bacterial cell membrane contains high concentrations of negatively charged lipids such as PG and cardiolipin (CL), and that of the cancer cell membrane contains negatively charged phosphatidylserine (PS), and thus, these cells have a negative surface potential (ψ 0). In aqueous solution, two factors (the surface charge densities of lipid bilayers and MAPs, as well as the salt concentration in aqueous solution) determine the strength of the electrostatic interaction (McLaughlin, Reference McLaughlin1989; Israerachvili, Reference Israerachvili1992). The MAP concentration at the membrane interface of a lipid bilayer (or the surface concentration of the MAP) (X), which is expressed as the molar ratio of bound MAPs to lipids at the membrane interface, can be expressed according to the intrinsic binding constant (K int) and the MAP concentration in the bulk solution (in which the electric potential is 0) (C b) using Gouy–Chapmann theory for low MAP concentrations, as follows,


where C M represents the MAP concentration in aqueous solution at the membrane surface, k B is the Boltzmann constant, z represents the net charge of the MAP, e is the elementary charge, and K app is the apparent binding constant. The surface potential ψ 0 is determined from the surface charge density of the lipid bilayer (σ) using the Grahame equation:

where ε 0 is the permittivity of free space, ε is the relative permittivity, 1/κ represents the Debye length, which is inversely proportional to the root of the salt concentration for 1:1 electrolytes such as NaCl. The Debye length (1/κ) is a parameter representing the strength of the electrostatic interaction, which decreases with a decrease in 1/κ. For example, as salt concentration increases, 1/κ decreases, leading to the reduction of electrostatic interaction (i.e., screened Coulomb potential). As electrostatic interactions increase, the MAP concentration in aqueous solution at the membrane surface (C M) increases, resulting in an increase in X. As described in section ‘MAP-induced nanopore formation and membrane permeation through pores’, an important factor determining the rate constant of Mag-induced pore formation is this electrostatic interaction. Much lower concentrations of Mag in aqueous solution induce rapid pore formation in GUVs with a high negative surface charge density (Tamba and Yamazaki, Reference Tamba and Yamazaki2009). Conversion of the Mag concentration in the bulk solution (C b) to the surface concentration in the lipid bilayer (X) using the binding constant indicates that X increases with increasing electrostatic interactions, and the value of X determines k p, irrespective of the surface charge density of the lipid bilayer (Tamba and Yamazaki, Reference Tamba and Yamazaki2009). Negatively charged lipids reportedly play an essential role in MAP binding and MAP-induced membrane damage, such as nanopore formation, but in most cases, specific structures of negatively charged lipids are not important and only electrostatic interactions due to the negative charges play an indispensable role. In some MAP studies, the zeta potential has been used instead of the surface potential (Dos Santos Cabrera et al., Reference Dos Santos Cabrera2011), but caution is required because zeta potential is the electric potential at the slipping plane outside the membrane and thus different from the surface potential. It should also be noted that several MAP studies have used the peptide to lipid (molar) ratio (i.e., P/L, where P and L represent the total number of peptides and lipids in a suspension of vesicles [e.g., LUVs]) as the determinant of MAP-induced membrane damage, but this is not always correct. This concept is correct only if the binding constant of the MAP to the lipid bilayer is extremely large (i.e., all MAPs are localized in the membrane), because under this condition, the P/L ratio is the same as the surface concentration of MAPs (X) if MAPs bind to both leaflets. Thus, it is important to consider the binding constant of MAPs to the lipid bilayer. The effect of electrostatic interactions on the binding of other MAPs and DNA to lipid bilayers has been described quantitatively (Wieprecht et al., Reference Wieprecht2000; Svirina and Terterov, Reference Svirina and Terterov2021; Fletcher and Elani, Reference Fletcher and Elani2025). Another important interaction between MAPs and lipid bilayers is the hydrophobic interaction between hydrophobic amino acids of the peptides and lipid hydrocarbon chains. Interfacial hydrophobicity plays a particularly significant role if the MAPs bind to the membrane interface. Phe and Trp exhibit high interfacial hydrophobicity (Wimley and White, Reference Wimley and White1996). By changing the number of these amino acids in a MAP, the total interfacial hydrophobicity can be changed. Experiments using Mag mutants show that the fractional area change in the GUV membrane (δ) increases with an increase in the number of Phe in Mag mutants, indicating that the surface peptide concentration (X) increases with increasing total interfacial hydrophobicity of Mag mutants (see the details for the relationship δ and X in section ‘Relationship between elementary processes of MAP-induced nanopore formation and factors inducing pore formation’) (Hasan et al., Reference Hasan2022). The increase in binding of lipidated peptides/proteins to lipid bilayers can be explained by their elevated hydrophobicity (Menacho-Melgar et al., Reference Menacho-Melgar2019).
The binding of MAPs to lipid bilayers can also be investigated using GUV methods. As described above, the LUV suspension method enables measurement of the binding of MAPs to lipid bilayers. However, it is difficult to determine the relationship between MAP binding and MAP-induced pore formation or the translocation of MAPs across the lipid bilayer, because pore formation occurs at a different time in each LUV, and analyses provide only the average values of physical quantities of LUVs at different stages of the interaction with MAPs (Yamazaki, Reference Yamazaki2008; Islam et al., Reference Islam2014b). Moreover, it is necessary to assume that MAPs bind only to the outer monolayer of LUVs. If MAPs translocate across lipid bilayers without forming pores and then bind to the inner leaflet, or if MAPs induce pore formation and then translocate across the lipid bilayer and bind to the inner leaflet, it becomes difficult to accurately estimate the binding (or surface concentration) of MAPs quantitatively. In some cases, MAPs induce the aggregation and membrane fusion of LUVs (Gratino et al., Reference Gratino2024), which also prevents accurate quantitative estimation of binding. By contrast, studies of the binding of MAPs to lipid bilayers using GUVs can overcome the problems encountered in studies using the LUV suspension method. For this purpose, interaction of FL-MAPs with single GUVs is monitored using confocal laser scanning microscopy (CLSM) (e.g., Figure 4a, b). The fluorescence intensity of the GUV membrane (i.e., rim fluorescence intensity [I rim]) due to the bound FL-MAPs is proportional to the MAP concentration in the GUV membrane if the concentration is sufficiently low that no quenching of fluorescence occurs (Islam et al., Reference Islam2017). Thus, the relative concentration of MAPs in the GUV membrane at equilibrium can be estimated based on I rim, which provides information regarding the dependence of MAP binding to the GUV membrane on conditions such as the MAP concentration in aqueous solution, lipid composition, and salt concentration (Ciobanasu et al., Reference Ciobanasu2010; Strahl and Hamoen, Reference Strahl and Hamoen2010; Mishra et al., Reference Mishra2011; Islam et al., Reference Islam2014a; Reference Islam2017; Sharmin et al., Reference Sharmin2016; Moniruzzaman et al., Reference Moniruzzaman2017; Moghal et al., Reference Moghal2020a; Or Rashid et al., Reference Or Rashid2020; Hossain et al., Reference Hossain2021; Billah et al., Reference Billah2023; Ahmed et al., Reference Ahmed2024a; Fletcher and Elani, Reference Fletcher and Elani2025). The determination of I rim values provides information regarding the membrane potential and surface potential (or zeta potential). For example, as negative membrane potential increases, the values of I rim due to the binding of carboxyfluorescein-labeled (CF) -TP10 and CF-Mag to the GUV membranes are enhanced, indicating increases in the concentrations of these MAPs in the membrane (Moghal et al., Reference Moghal2020a; Or Rashid et al., Reference Or Rashid2020). The dependence of the surface concentration (X) of CF-Mag on membrane potential has been analyzed quantitatively (see the details in section ‘Effect of membrane tension, membrane potential, and lipid composition on MAP-induced nanopore formation’) (Or Rashid et al., Reference Or Rashid2020). The value of I rim due to the binding of fluorescent probe-labeled DNA to GUV membrane increases with an increase in the surface charge density of the membrane, and quantitative analysis of this result can be used to estimate the zeta potential of GUVs (Fletcher and Elani, Reference Fletcher and Elani2025). The relationship between I rim and the translocation of MAPs across GUV bilayers is described in section ‘Relationship between elementary processes of MAP-induced nanopore formation and factors inducing pore formation’.
Using the single-GUV method, it is possible to obtain the time course of MAP binding to GUV membranes. Quantitative analysis of binding provides the rate at which MAPs bind to the GUV membrane from aqueous solution and the rate at which MAPs transfer (or unbind) from the membrane to aqueous solution, as the single-GUV method enables measurement of the interaction between MAPs and single GUVs from the initial stage of the interaction (Islam et al., Reference Islam2014b). Thus, the single GUV method can provide similar information obtained by SPR, i.e., the rate of binding/unbinding of MAPs. If MAPs bind only to the outer leaflet of the GUV membrane, the rim intensity increases with time, eventually reaching a steady value (e.g., initial time in Figure 4c before pore formation). In this case, the time required to reach a steady value denotes the time required to reach binding equilibrium (Karal et al., Reference Karal2015a; Or Rashid et al., Reference Or Rashid2020; Billah et al., Reference Billah2023; Ahmed et al., Reference Ahmed2024b). By contrast, MAPs such as CPPs translocate across the GUV membrane and bind to the membrane interface of the outer and the inner leaflets, without forming pores (see the details in section ‘Relationship between elementary processes of MAP-induced nanopore formation and factors inducing pore formation’). In this case, after initiation of the interaction, I rim increases with time to reach a steady state, which is maintained for an extended period of time; even if the MAPs induce nanopore formation, I rim does not change after pore formation (e.g., Figure 4d for TP10 [Islam et al., Reference Islam2014a]). For some MAPs, the change in I rim over time exhibits a similar pattern, but no subsequent pore formation occurs (Sharmin et al., Reference Sharmin2016; Moniruzzaman et al., Reference Moniruzzaman2017). However, analyses of the entry of these MAPs into the GUV lumen indicate that the MAPs translocate across the GUV membrane and localize in the inner leaflet. Quantitative analysis of the change in I rim over time can provide information regarding the rate constant of peptide binding to the leaflet of a GUV membrane from aqueous solution (k ON) and the rate constant of unbinding of the peptides from the leaflet to the aqueous solution (k OFF). If the rate of translocation of MAPs across the GUV membrane is high, the MAP concentration in the GUV membrane can be approximated as the following equation (Islam et al., Reference Islam2014a).

where,

Because I rim is proportional to X, the fitting of the time course of I rim to Eq. (4) provides the value of k app. The dependence of k app on the concentration of the peptide in aqueous solution (C b) provides the values of k ON and k OFF. Thus, the apparent binding constant of CPPs to the membrane (K app [= k ON/k OFF]) is determined (Islam et al., Reference Islam2014a; Sharmin et al., Reference Sharmin2016; Moniruzzaman et al., Reference Moniruzzaman2017).
MAP-induced nanopore formation and membrane permeation through pores
Ion channel proteins (e.g., ligand-gated ion channels such as the acetylcholine receptor, voltage-gated channels such as the K+ channel, and mechanosensitive channels such as Piezo1) form oligomers that in turn form a nanopore in the center of the oligomer. The specific 3D structures of these nanopores have been determined by X-ray crystal analyses and cryo-electron microscopy studies. By contrast, 3D structures of nanopores formed by MAPs composed of an α-helix or a structure similar to an α-helix have not been determined. Two models of the nanopore structure have been proposed for these MAPs: a barrel-stave pore (or helix-bundle pore) and a toroidal pore. In barrel-stave pores, several MAPs associate to form a nanopore with a specific size and the interpeptide interaction is large, and thus, the pore wall is composed of the hydrophilic surface of the peptides (Figure 2a (i): a typical schematic drawing). Such barrel-stave pores consisting of α-helical peptides have been identified in ion channel peptides to mimic the ion channel proteins (Montal, Reference Montal1995) and its MD simulations (Saiz and Klein, Reference Saiz and Klein2005). The only experimental evidence of barrel-stave pores is that the peptides form ion channels with specific magnitudes of single-channel conductance, and MD simulations indicate the structures of barrel-stave pores. However, crystals of barrel-stave pores have not yet been produced; thus, their 3D structures have not been solved. Certain MAPs, such as the toxin peptide pardaxin and the AMP alamethicin, form barrel-stave pores, as indicated by their specific single-channel conductance in SCR analyses of these MAPs (Shai et al., Reference Shai1990; Opsahl and Webb, Reference Opsahl and Webb1994) and by MD simulations of alamethicin (Tieleman et al., Reference Tieleman1999). With regard to toroidal pores, two monolayers bend to connect with each other at the pore rim; microscopically, several lipid molecules of the bilayer appear to change their orientation at the pore rim by forming its toroidal structure, and thus, the pore wall is composed of the membrane interface of the lipid monolayer and the hydrophilic surface of amphipathic MAPs. Figure 2a (ii) shows a schematic drawing of a toroidal pore model composed of long α-helices with regular orientation. However, irregular arrangements of α-helices (e.g., their orientation and location) with different numbers of α-helices can form toroidal pores, and even short α-helices and nonhelical MAPs with irregular structure can form toroidal pores (see the details below and also in the next section). There is no strong interaction between the peptides, and thus, the size of the pores can readily change. Experimental evidence supporting toroidal pores is as follows: (1) a flip-flop (i.e., transbilayer diffusion or transbilayer movement) of lipids during MAP (e.g., Mag)-induced leakage of fluorescent probe molecules from LUVs (Matsuzaki et al., Reference Matsuzaki1996) and a rapid flip-flop of lipids at the onset time of MAP (e.g., Mag)-induced pore formation in single PC/PG-GUVs (Hasan et al., Reference Hasan2018a), although rapid flip-flop of lipids occur in the pre-pores induced by membrane tension (section 1), and thus, the flip-flop of lipids is not the proof of the existence of MAPs-induced toroidal pores, (2) bending of two monolayers to connect to each other at the rim of pores formed by Bax-α5 (α5 fragment of the proapoptotic protein Bax) in PC bilayers (exactly, diC18:0 [9,10 Br]-PC) (Figure 2b (ii)), in contrast with no such bending at the rim of barrel-stave alamethicin pores (Figure 2b (i)) (Qian et al., Reference Qian2008); (3) temporal variation in the size of MAP (e.g., Mag, Bax/Bak, Bax-α5)-induced pores in GUVs (Tamba et al., Reference Tamba2010; Fuertes et al., Reference Fuertes2010; Bleicken et al., Reference Bleicken2013); and (4) membrane tension-induced conversion of MAPs-induced nanopores in PC/PG-GUVs to the burst of these GUVs (Karal et al, Reference Karal2015a; Billah et al., Reference Billah2022). The MD simulations with umbrella sampling using a nucleation collective variable indicate that in the Mag-induced toroidal pore and the melittin-induced toroidal pore in dimyristoyl-PC (DMPC) bilayer the orientation (or tilt angle) and location of α-helices of these AMPs in the pore are random, whereas there are a few salt bridges between them (Richardson and Van Lehn, Reference Richardson and Van Lehn2024). These simulation results indicate there is no strong interaction between the α-helices. On the other hand, the MD simulations at high temperatures (90–120 °C) indicate that low concentrations of melittin induce the formation of transient toroidal pores, which are different from stable toroidal pores induced by higher concentrations of melittin concomitantly with a decrease in membrane thickness (Ulmschneider and Ulmschneider, Reference Ulmschneider and Ulmschneider2024). In this review article, the latter toroidal pores induced by higher concentrations of MAPs are focused. The stability or lifetime of toroidal pores may greatly depend on the kinds of MAPs and antibacterial polymers, as well as lipid compositions. In contrast, some toroidal pores are thought to remain stable for a long period of time under certain conditions (e.g., Mag-induced pores in di14:0 PC bilayers [Yang et al., Reference Yang2000]). On the other hand, in pure lipid bilayers, the formation of a micropore can be induced by various external forces, and the structure of these micropores is thought to be that of a toroidal pore in which the wall is composed only of the membrane interface of a lipid monolayer (Sandre et al., Reference Sandre1999; Karatekin et al., Reference Karatekin2003; Evans et al., Reference Evans2003; Shibly et al., Reference Shibly2016). The lifetime of these pure lipidic micropores is very short (e.g., < 100 ms) due to high line tension at the pore rim; thus, the pores close rapidly. This result indicates that one of the most important factors stabilizing toroidal pores is a decrease in the line tension (i.e., the free energy per unit length) at the rim of lipidic toroidal pores by the interaction of MAPs with the bended monolayer at their rim, resulting in an increase in the pore stability or the pore lifetime (see section ‘Relationship between elementary processes of MAP-induced nanopore formation and factors inducing pore formation’). By contrast, most PFTs (e.g., lysenin) form an oligomer to produce a β-barrel nanopore in the center of the oligomer (Podobnik et al., Reference Podobnik2016; Anderluh and Lakey, Reference Anderluh and Lakey2010), and de novo–designed peptides that form β-barrel nanopores have been developed (Shimizu et al., Reference Shimizu2022).
Two models of nanopore structures formed by MAPs composed of an α-helix or a structure similar to α-helix. (a) (i) A schematic drawing of a barrel-stave pore (or helix-bundle pore): side view (left) and top view (right). Several MAPs associate with each other to form a nanopore with a specific size and the interpeptide interaction in the nanopore is large, and thus, the pore wall is composed of the hydrophilic surface of the peptides. (ii) A schematic drawing of a toroidal pore composed of long α-helices with regular orientation: side view (left) and top view (right). At the pore rim, two monolayers bend to connect each other, or several lipid molecules change their orientations to form a toroidal structure. The pore wall is composed of a membrane interface of lipid monolayer and several MAPs, which do not strongly interact. Green color and grey color denote the membrane interface (MI) and hydrophobic core (HC) of lipid bilayers, respectively. A red cylinder denotes an α-helix of MAPs. (b) Structures of pores estimated by the electron density distribution of Br of lipid hydrocarbon chains of diC18:0 (9,10 Br)-PC. The color indicates the electron density based on the scales at the left of their images. (i) A barrel-stave pore formed by alamethicin. (ii) A toroidal pore formed by Bax-α5 (α5 fragment of proapoptotic protein Bax) in PC bilayers. (a and b) Reproduced from Billah et al. (Reference Billah2024) and Qian et al. (Reference Qian2008) with permission from Elsevier and the National Academy of Sciences of USA, respectively.

Figure 2. Long description
Panel A shows two schematic models of nanopore structures. In A i, the left side presents a cross-sectional view of a barrel-stave pore: five red cylinders (MAP alpha-helices) form a vertical bundle through a green and gray bilayer, with the pore wall composed of the hydrophilic peptide surface. The right side shows a top view, where the five red circles form a closed ring. In A ii, the left side shows a toroidal pore: four red cylinders are spaced apart, with the green bilayer bending inward to connect the upper and lower leaflets, forming a continuous curved pore rim. The right side shows a top view with four red circles at the corners of a blue-shaded square, indicating the pore wall is formed by both MAPs and the membrane interface. Green denotes the membrane interface, gray the hydrophobic core, and red the MAP alpha-helix. Panel B presents electron density maps. In B i, a 3D box with axes labeled 4.95 nanometers and 3.43 nanometers displays alternating bands of red, yellow, and blue, corresponding to electron density values from 0.25 to -0.05 electrons per cubic angstrom, representing a barrel-stave pore formed by alamethicin. In B ii, a similar 3D box with axes 5.13 nanometers and 3.77 nanometers shows a different pattern of electron density, representing a toroidal pore formed by Bax-alpha 5 in PC bilayers. The color bar at the right of each box indicates the electron density scale.
As described in the Introduction, in studies using GUVs, MAP-induced membrane damage such as nanopore formation is detected by monitoring the membrane permeation (efflux [or leakage] and influx [entry]) of solutes such as water-soluble fluorescent probes. The single-GUV method enables measurement of the interaction between MAPs and single GUVs from the initial stage of the interaction, which in turn enables the observation of two elementary processes of MAP-induced pore formation: pore formation and membrane permeation of internal contents through the pores (Tamba and Yamazaki, Reference Tamba and Yamazaki2005; Reference Tamba and Yamazaki2009; Tamba et al., Reference Tamba2010; Lee et al., Reference Lee2013; Islam et al., Reference Islam2014a; Parvez et al., Reference Parvez2018; Hasan et al., Reference Hasan2019). To determine the rate constant (k p) or the rate (V p) of MAP-induced initial pore formation, the time course of fluorescence intensity of a single GUV lumen (I lumen) due to water-soluble fluorescent probes (e.g., calcein, AF488, AF647) is monitored and analyzed. In the single-GUV method, leakage (or efflux) of fluorescent probes from a single GUV is measured (Figure 1a), and the onset time of the decrease in I lumen indicates the onset of leakage of fluorescent probes from the GUV lumen, corresponding to the onset time of MAP-induced pore formation (Figure 3a). The same experiment of the interaction of MAPs with a GUV is repeated using many ‘single GUVs’ under the same experimental conditions. In most cases, the onset time of leakage in each GUV differs, indicating that MAP-induced nanopore formation is a stochastic phenomenon, whereas the time course of change in I lumen after the onset time is similar. Based on this characteristic of the onset time of leakage of all single GUVs, the fraction of leaked and leaking GUVs (P leak(t)) among all examined GUVs is obtained as a function of interaction time (t) between MAPs and single GUVs after initiation of the interaction. Thus, P leak(t) increases with time, and the value of P leak at a specific interaction time (e.g., 5 min) represents a measure of the rate of MAP-induced pore formation (V p) (Tamba and Yamazaki, Reference Tamba and Yamazaki2005; Reference Tamba and Yamazaki2009; Tamba et al., Reference Tamba2010; Islam et al., Reference Islam2014a; Parvez et al., Reference Parvez2018; Hasan et al., Reference Hasan2019). P leak(t) is related to the fraction of intact undamaged GUVs (P intact(t)) among all examined GUVs, determined according to the relationship P intact(t) = 1 - P leak(t). In this theoretical framework, in a system, there are only two kinds of states of GUVs: intact GUVs with no leakage of fluorescent probes and leaked GUVs (including leaking GUVs), where fluorescent probes leak completely or are leaking, which are nonintact GUVs. Hence, the value of P leak at a specific interaction time (t) is a measure of the rate of increment of the number of GUVs with pores, and thus, it can be used as a measure of the rate of MAP-induced pore formation (V p). If MAP-induced pore formation is approximated as a two-state transition from the intact state of GUVs to the leaked (or nonintact) state of GUVs, its rate constant (corresponding to the rate constant of initial pore formation) (k p) can be determined by fitting the following theoretical equation to the experimental data for the time course of P intact(t) (Tamba and Yamazaki, Reference Tamba and Yamazaki2005; Reference Tamba and Yamazaki2009):

where t eq represents the time required for the binding of MAPs to the GUV bilayer to reach equilibrium. By contrast, in the GUV suspension method, the entry (or influx) of fluorescent probe molecules into the GUV lumen from the outside solution is measured (Figure 1c); thus, the fraction of filled GUVs or the percentage of GUVs filled by fluorescent probe molecules after a specific interaction time among all examined GUVs is obtained. The fraction of filled GUVs after a specific interaction time is a measure of the rate of MAP-induced pore formation (Schön et al., Reference Schön2008; Fuertes et al., Reference Fuertes2010; Bleicken et al., Reference Bleicken2013). Note that the rate of leakage determined using the LUV suspension method is based on the rates of two different elementary processes (i.e., MAP-induced pore formation and the membrane permeation of solute molecules through the pores). Thus, even if the rate of pore formation is low, but the rate of membrane permeation is high, the observed rate of leakage in a LUV suspension would be high. By contrast, even if the rate of MAP-induced pore formation is high but that of membrane permeation is low, the observed rate of leakage in a LUV suspension would be low. Therefore, one of the advantages of GUV studies is that they allow the separation of the two elementary processes and the estimation of the rate of each elementary process.
Time course of MAP-induced membrane permeation (efflux or leakage) of water-soluble fluorescent probe from GUV lumen. (a) Time course of fluorescence intensity of single GUV lumen (I lumen) due to water-soluble fluorescent probe during the interaction of MAPs with single GUVs. The onset time of the decrease in I lumen corresponds to the onset time of MAP-induced pore formation in a GUV. (b) Time course of I lumen for membrane permeation through a nanopore whose size and number do not change with time. I lumen is expressed on a log scale. This time course is expressed by Eq. (2). (c) Time course of I lumen for membrane permeation through nanopores whose size decreases with time to reach a steady value. (d) Time course of I lumen for membrane permeation through nanopores whose number increases with time to reach a steady value.

Several factors determine the rate constant or rate of MAP-induced initial pore formation (k p or V p). If MAPs are cationic peptides/proteins, one important factor is the electrostatic interaction between positively charged MAPs and negatively charged lipid bilayers. For example, as the fraction of negatively charged lipids in a lipid bilayer increases and/or the salt concentration in the buffer decreases (i.e., the electrostatic interaction between MAPs and the lipid bilayer increases), the rate or rate constant of MAP (e.g., AMPs such as Mag and LfcinB)-induced pore formation increases (Tamba and Yamazaki, Reference Tamba and Yamazaki2009; Moniruzzaman et al., Reference Moniruzzaman2015). It is well known that the outer leaflet of the cell membrane of both gram-negative and gram-positive bacteria contains high concentrations of negatively charged lipids such as PG and CL and electrically neutral phosphatidylethanolamine (PE) (Sohlenkamp and Geiger, Reference Sohlenkamp and Geiger2016; Krok et al., Reference Krok2023), and thus, for the interaction of cationic AMPs with these bacteria, electrostatic interactions play a vital role in the preferential interaction of AMPs with the bacterial cell membrane compared with the eukaryotic cell membrane (Zasloff, Reference Zasloff2002; Tamba and Yamazaki, Reference Tamba and Yamazaki2009). Thus, this principle has been utilized to generate AMP (or antibiotic)-resistant bacteria by leading to a decrease in negative surface charges in the bacterial cell membrane (e.g., amino-acylation of PG and CL) (Blair et al., Reference Blair2015; Joo et al., Reference Joo2016; Andersson et al., Reference Andersson2016). In this sense, many AMPs also exhibit anti-cancer activity and thus can be used as anticancer peptides (Leite et al., Reference Leite2015), because the outer leaflet of the membrane of cancer cells contains high concentrations of negatively charged PS and PE, whereas that of normal live mammalian cells does not contain such lipids (Szlasa et al., Reference Szlasa2020). Another factor is hydrophobic interactions. Generally, as the hydrophobicity of MAPs increases, k p also increases. For example, if a MAP binds to the membrane interface, the interfacial hydrophobicity plays a significant role (see section ‘Binding of MAPs to lipid bilayers’). An increase in the number of Phe (or Trp) residues with high interfacial hydrophobicity in MAPs results in an increase in k p (Hasan et al., Reference Hasan2022). Lipidation of peptides/proteins enhances their hydrophobicity, which has been exploited to increase intracellular uptake (Menacho-Melgar et al., Reference Menacho-Melgar2019). A GUV study indicated that lipidation of the therapeutic peptide calcitonin enhances the rate of pore formation in PC-GUVs (Lund et al., Reference Lund2024).
On the other hand, in GUV studies, analysis of the time course of the change in I lumen after the onset of pore formation can provide information regarding the membrane permeability of fluorescent probe molecules through the pores, which is related to the size and number of MAP-induced nanopores in the GUV membrane. In the single-GUV method (Figure 1a), analysis of the time course of I lumen(t) after the onset time (t onset) of the decrease in I lumen (i.e., the onset time of MAP-induced nanopore formation) (Figure 3a) can provide the rate constant of membrane permeation (leakage) (k mp) of the fluorescent probe (Tamba and Yamazaki, Reference Tamba and Yamazaki2005; Tamba et al., Reference Tamba2010; Alam et al., Reference Alam2012; Pavez et al., Reference Parvez2018; Ahmed et al., Reference Ahmed2025a). If only one pore is formed and its size does not change over time, the time course of I lumen(t) is expressed according to the following theoretical equation (Figure 3b):

The value of k mp increases with increasing MAP concentration and the fraction of negatively charged lipids in the lipid bilayer (Tamba et al., Reference Tamba2010; M et al., Reference Nithya2023). The k mp values for similar-size GUVs can be compared, but for GUVs of differing size, it is important to convert k mp to the membrane permeability coefficient (M P(t)) of fluorescent probes using M P(t) = rk mp(t)/3, where r represents the GUV radius (Alam et al., Reference Alam2012; Ahmed et al., Reference Ahmed2025a). Generally, M P(t) of fluorescent probes is defined as the proportionality coefficient of the relationship between the flux of the fluorescent probes in a lipid bilayer containing pores from the inside to the outside of a GUV and the difference of fluorescent probe concentration between the inside and the outside of the GUV. The values of k mp(t) and M P(t) depend on the size and number of nanopores. For some AMPs (e.g., Mag in PC/PG-GUVs), k mp(t) (or M P(t)) is initially large but decreases with time, eventually reaching a final, steady value. Large-sized fluorescent probes (e.g., proteins and dextran) can permeate only in the initial state. These results indicate that these MAPs induce the formation of large nanopores initially, but the radius of the pores decreases with time until reaching a steady value (Figure 3c) (Tamba et al., Reference Tamba2010). In the case of Mag-induced nanopores in PC/PG-GUVs at the steady state, AF-SBTI (R SE = 2.8 nm) cannot permeate, but Texas-red dextran 3 K (TRD-3 k) (R SE = 1.4 nm) can permeate through the nanopores, indicating that the pore radius at the steady state is of an intermediate size at between 1.4 nm and 2.8 nm (Tamba et al., Reference Tamba2010), which agrees with the Mag-induced pore radius in PC bilayers at equilibrium (1.9 nm) estimated using neutron scattering analysis (Ludcke et al., Reference Ludtke1996). Such a change in pore size over time is also observed with nanopores induced by pore-forming peptides/proteins (e.g., Bax/cBid and Bax-α5 [α5 fragment of Bax]) (Fuertes et al., Reference Fuertes2010; Bleicken et al., Reference Bleicken2013), supporting observations that these pores have a toroidal structure. By contrast, for some PFTs (e.g., lysenin in PC/SM/cholesterol-GUVs) and AMPs (e.g., peptidyl-glycylleucine-carboxyamide [PGLa] in PC/PG-GUVs), M P(t) (or k mp(t)) increases with time until reaching a steady value (Figure 3d) (Alam et al., Reference Alam2012; Ahmed et al., Reference Ahmed2025a). Since analyses of the 3D structure of nanopores induced by PFTs revealed that they are formed with a specific size (e.g., lysenin [Podobnik et al., Reference Podobnik2016]), the results of the M P(t) clearly indicate that the number of nanopores increases significantly with time before stabilizing (i.e., stable number density) (Alam et al., Reference Alam2012). In most studies using the GUV suspension method (Figure 1c), only qualitative analyses of I lumen have been performed (Ambroggio et al., Reference Ambroggio2005; Ciobanasu et al., Reference Ciobanasu2010; Mishra et al., Reference Mishra2011; Bleicken et al., Reference Bleicken2013; Lund et al., Reference Lund2024), but quantitative analyses of the time course of I lumen after the onset time of the increase in I lumen have provided the value of M P (Schön et al., Reference Schön2008; Fuertes et al., Reference Fuertes2010; Leite et al., Reference Leite2015). Table 1 summarizes examples of MAP-induced nanopore formation revealed by GUV studies.
MAP-induced nanopore formation revealed by GUV studies

Table 1. Long description
Beginning at the top row, the table lists antimicrobial peptides, pore-forming proteins, lytic peptides, cell-penetrating peptides, and lipidated peptides. For each, columns specify: peptide name (e.g., Magainin 2, PGLa, Nisin, Nystatin, BP100, Transportan 10, TAT, lipidated calcitonin), lipid composition (such as PC/PG, PC, PE/PG/CL, PC/PG/chol, PC/PE/PI/PS/CL), buffer and salts (including 10 mM PIPES with 150 mM NaCl, water, PBS, Tris/HCl, 10 mM HEPES with 100 mM NaCl), type of pore (toroidal pore, unstable toroidal pore, unstable nanopore, or blank), membrane permeation (efflux or influx of calcein, TR-dextran, AF-SBTI, FITC-BSA, AF488, AF647, AF555, AF633, AF-maleimide, AF-dextran, SRB, sucrose, CF, TRsc, allophycocyanin, Cyt C), and references (e.g., Tamba and Yamazaki 2005, Billah et al. 2023, Ambroggio et al. 2005, Ahmed et al. 2024b, Fuertes et al. 2010, Dos Santos Cabrera et al. 2011, Mishra et al. 2011, Lund et al. 2024). Rows with combined peptides or conditions are grouped, and some entries include additional variables such as membrane tension (sigma) or membrane potential (Delta phi). The table foot defines abbreviations: AF as AlexaFluor, Bax-alpha 5 as alpha 5 fragment of Bax, BSA as bovine serum albumin, CF as carboxyfluorescein, CL as cardiolipin, Cyt C as cytochrome C, FITC as fluorescein isothiocyanate, NK-2 as part of NK-lysin, PBS as phosphate buffer saline, PC as phosphatidylcholine, PE as phosphatidylethanolamine, PG as phosphatidylglycerol, PI as phosphatidylinositol, PS as phosphatidylserine, SRB as sulforhodamine B, TAT as trans-acting activator of transcription, TR as Texas red, TRsc as Texas red sulfonyl chloride.
σ, membrane tension; Δφ, membrane potential; AF, AlexaFluor; Bax-α5, α5 fragment of proapoptotic protein Bax; BSA, bovine serum albumin; CF, carboxyfluorescein; CL, cardiolipin; Cyt C, cytochrome C; FITC, fluorescein isothiocyanate; NK-2, a part of NK-lysin; PBS, phosphate buffer saline; PC, phosphatidylcholine; PE, phosphatidylethanolamine; PG, phosphatidylglycerol; PI, phosphatidylinositol; PS, phosphatidylserine; SRB, sulforhodamine B; TAT, trans-acting activator of transcription; TR, Texas red; TRsc, Texas red sulfonyl chloride.
Based on the proposed models for structures of nanopores (e.g., barrel-stave pores and toroidal pores) (Figure 2), it may be inferred that short MAPs and irregular polymers cannot induce nanopore formation because they cannot form a transmembrane α-helix. However, the arrangements of MAPs in toroidal pores and their relationship to the stability of pores have not been determined accurately: in some cases, regular arrangements shown in Figure 2a(ii) may be formed, whereas in other cases more irregular arrangements of α-helices (e.g., their orientation and location) with different number of α-helices may be formed at the pore rim, which is supported by MD simulation results (Richardson and Van Lehn, Reference Richardson and Van Lehn2024). As described in section 1, to determine whether short MAPs and irregular polymers induce nanopore formation, the GUV methods should be used. For example, a 14-residue lytic peptide, Polybia-MP1 (mastoparan peptide), forms a short α-helix and induces nanopore formation in PC/PE/PS-GUVs (Leite et al., Reference Leite2015). It has been reported that many short peptides composed of less than 15 amino acid residues have antimicrobial activities (i.e., they are AMPs) (Blondelle et al., Reference Blondelle1995; Vogel et al., Reference Vogel2002; Jing et al., Reference Jing2006; Moniruzzaman et al., Reference Moniruzzaman2017; Pandit et al., Reference Pandit2018; Hossain et al., Reference Hossain2021; Gratino et al., Reference Gratino2024; Zorila et al., Reference Zorila2025). The studies using the LUV suspension method indicate that some of them do not induce leakage of fluorescent probes (e.g., 15-residue AMPs in Jing et al., Reference Jing2006), but others induce leakage of them (e.g., 10-residue AMPs in Gratino et al., Reference Gratino2024). For the former AMPs, there may be several mechanisms for causing their bactericidal activity. A six-residue AMP derived from LfcinB, LfcinB (4–9), does not induce nanopore formation in single PC/PG-GUVs and E. coli-lipid-GUVs (see section ‘Effect of membrane tension, membrane potential, and lipid composition on MAP-induced nanopore formation’) but translocates across the lipid bilayers of these GUVs to enter their lumen (Moniruzzaman et al., Reference Moniruzzaman2017; Hossain et al., Reference Hossain2021). Moreover, LfcinB (4–9) enters the cytosol of single E. coli cells and also single E. coli spheroplasts without damaging their cell membranes, indicating that this AMP belongs to type B AMP, which supports the results obtained using the single GUV method (Moniruzzaman et al., Reference Moniruzzaman2017; Hossain et al., Reference Hossain2021). If the GUV studies indicate short, nonhelical MAPs-induced nanopore formation, these MAPs may induce transient nanopore formation according to the stretch-activated pore model (see section ‘Relationship between elementary processes of MAP-induced nanopore formation and factors inducing pore formation’). Therefore, there may be several modes of interactions of short (helical or irregular) MAPs with lipid bilayers.
Various methods are available for preparing GUVs, including the natural swelling method, electroformation, and oil-assisted methods such as the inverted-emulsion method (Walde et al., Reference Walde2010). One of the advantages of oil-assisted methods is the ease of GUV preparation and effective encapsulation of aqueous contents; thus, these methods are useful for generating artificial cells and GUV arrays (Walde et al., Reference Walde2010; Al Nahas et al., Reference Al Nahas2022; Cama et al., Reference Cama2022; Fletcher and Elani, Reference Fletcher and Elani2025; Agaki et al., Reference Agaki2026). However, a disadvantage of oil-assisted methods is that a significant amount of oil (which is used in the preparation of GUVs) remains in the GUV membranes. The presence of impurities such as oil in lipid bilayers can greatly alter their physical properties (Walde et al., Reference Walde2010; Gehan et al., Reference Gehan2020; Agaki et al., Reference Agaki2026). Several researchers have reported marked increases in membrane permeability of fluorescent probes (Lin et al., Reference Lin2018) and structural changes of membranes in GUVs prepared using oil-assisted methods (Al Nahas et al., Reference Al Nahas2022; Fletcher and Elani, Reference Fletcher and Elani2025). For MAP-induced nanopore formation, large differences in the rate of AMP-induced pore formation and permeability through the pores between GUVs prepared using oil-assisted methods and oil-free GUVs have been reported (Al Nahas et al., Reference Al Nahas2022). For high electric pulse-induced pore formation, the results obtained in GUVs prepared using oil-assisted methods and in oil-free GUVs differed greatly (Leomil et al., Reference Leomil2024). These results indicate that the residual oil in GUV membranes greatly affects the interaction of MAPs with the membranes by changing their physical properties, and thus, currently, GUVs prepared using the oil-assisted methods are not adequate for studies of MAPs.
Relationship between elementary processes of MAP-induced nanopore formation and factors inducing pore formation
The binding of peptides/proteins does not always induce membrane damage, such as nanopore formation. Most peptides/proteins/compounds bind to the membrane interface or insert into the hydrophobic core of the lipid bilayer without affecting the bilayer’s stability greatly. For example, some positively charged peptides/proteins induce phase separation or domain formation in negatively charged lipid bilayers (Glaser et al., Reference Glaser1996; Denisov et al., Reference Denisov1998), which does not cause membrane damage. Therefore, it should be noted that the binding of MAPs to a lipid bilayer per se is only the first step of MAP-induced membrane damage; thus, one or more other factors that introduce instability in the lipid bilayer (or membrane instability) are required for membrane damage. In the carpet model of AMP- or MAP-induced membrane damage, the binding of a large number of MAPs parallel to the membrane surface (i.e., high concentration of MAPs in the membrane interface) alone is considered the main cause of membrane destruction by formation of small pieces of the membrane, such as micelles composed of peptides and lipids (Pouny et al., Reference Pouny1992; Gazit et al., Reference Gazit1996; Shai, Reference Shai1999; Wimley, Reference Wimley2010; Lee et al., Reference Lee2010; Fernandez et al., Reference Fernandez2012; Wang et al., Reference Wang2016; Tsukamoto et al., Reference Tsukamoto2021; Billah et al., Reference Billah2024); however, other factors destabilizing the lipid bilayer must be present for membrane damage (Billah et al., Reference Billah2024). In this section, we consider the relationship between elementary processes of MAP-induced nanopore formation (e.g., the relationship between MAP binding and nanopore formation) and the factors that induce pore formation or introduce membrane instability.
To elucidate the mechanism underlying MAP-induced nanopore formation, it is important to examine the relationship between the various elementary processes. The single-GUV method enables to observe several elementary processes of MAP-induced nanopore formation in each GUV simultaneously as a function of time: after starting the interaction of MAPs with a GUV, MAPs binds to the outer leaflet gradually, then nanopore formation occurs in the GUV membrane, resulting in membrane permeation of water-soluble fluorescent probes, and the translocation of some MAPs occurs before or after nanopore formation, depending on the kinds of MAPs and lipid compositions. First, we consider the relationship between two elementary processes: (i) the binding of MAPs to the lipid bilayer, and (ii) MAP-induced nanopore formation. GUV-based methods enable the simultaneous measurement of the time course of the change in I rim of a GUV due to binding of FL-MAPs to the GUV membrane and the time course of the change in I lumen due to membrane permeation of water-soluble fluorescent probe molecules (Islam et al., Reference Islam2014a; Karal et al., Reference Karal2015a; Parvez et al., Reference Parvez2018; Ahmed et al., Reference Ahmed2024a). As discussed in section ‘Binding of MAPs to lipid bilayers’, many amphipathic MAPs bind to the membrane interface in an almost parallel manner. These MAPs form nanopores via two modes. In one mode, MAPs bind only at the membrane interface of the outer leaflet before pore formation, and then nanopore formation is induced (i.e., asymmetric binding–induced pore formation, Figure 4e), and in the other mode, MAPs bind at the membrane interface of both leaflets, which is followed by nanopore formation (i.e., symmetric binding–induced pore formation, Figure 4f). First, we explain a typical example of the asymmetric binding–induced pore formation (Figure 4a and c) (Karal et al., Reference Karal2015a). Figure 4c shows the time courses of I rim and I lumen of a GUV for the asymmetric binding–induced nanopore formation, demonstrating the relationship between these two elementary processes. After stating the interaction of Mag/CF-Mag with a single PC/PG-GUV, I rim due to CF-Mag increases with time to reach a steady value at 50 s, where the binding equilibrium is held and this state continues for 90 s (i.e., the first steady state). On the other hand, I lumen due to water-soluble fluorescent probes (AF647) remains constant initially, indicating that the GUV is intact, and at 149 s I lumen starts to decrease and finally reaches 0 at 270 s. The onset time of the decrease in I lumen means that of the leakage of AF647, corresponding to the onset time of Mag-induced pore formation in this GUV. The time course of I lumen from 149 to 270 s is determined by the rate of membrane permeation of AF647 through the Mag-induced pore. From 140 s, I rim increases rapidly to reach another steady state (second steady state). In other GUVs, similar time courses of I rim and I lumen of a GUV and their relationship are observed, but the duration of the first steady state in each GUV differs, because the onset time of pore formation in each GUV differs. In the two-step increase in I rim, the ratio of I rim at the first steady state to I rim at the second steady state is ~1:2. These results indicate the following process of the binding. After MAPs begin to interact with the GUV membrane, binding of MAPs to the outer leaflet occurs rapidly to reach equilibrium binding within a short time (e.g., less than 50 s for Mag against PC/PG-GUVs, depending on peptide concentration and lipid compositions), and this asymmetric binding state is maintained for a long period of time. When nanopore formation occurs, MAPs in the outer leaflet diffuse in the connected monolayer at the rim of the toroidal nanopore to the inner leaflet, until the concentration of MAPs in the inner leaflet equals that in the outer leaflet (i.e., the symmetric binding state). Some lag time between the onset time of translocation of Mag and that of membrane permeation of AF647 can be explained by the difference of permeability between Mag and AF647, i.e., when pore formation starts the pore radius is small, and thus, only Mag bound to the outer leaflet can diffuse in the membrane interface at the toroidal pore rim to the inner leaflet, and then, after the pore radius increases, AF647 can diffuse in the water channel of the pore. It should be noted that in the single-GUV method, the MAP concentration in the aqueous solution near the GUV remains constant during their interaction; thus, immediately after MAPs translocate from the outer leaflet to the inner leaflet, the MAPs bind to the outer leaflet from the aqueous solution to maintain equilibrium binding, and as a result, the MAP concentration in the outer leaflet remains constant.
Two modes of MAP-induced nanopore formation based on the relation between the binding of MAPs to a GUV membrane and the MAP-induced nanopore formation. (a, c, e) asymmetric binding-induced pore formation and (b, d, f) symmetric binding-induced nanopore formation. Analysis of the time course of binding of MAPs to the GUV membrane and its quantitative analysis are shown. (a) Interaction of CF-Mag/Mag with a PC/PG (6/4)-GUVs in buffer. CLSM images due to AF647 (1) and CF-Mag (2). 31 μM CF-Mag/Mag (containing 0.16 μM CF-Mag). The numbers below the images denote the interaction time (s). Bar, 30 μm. (B) Interaction of CF-TP10 with a PC/PG (8/2)-GUVs in buffer. CLSM images due to AF647 (1) and CF-TP10 (2). 1.9 μM CF-TP10. Bar, 30 μm. (c) Time course of fluorescence intensity of the GUV shown in panel A. (red line) I lumen due to AF647, (green ▲) I rim due to CF-Mag. (d) Time course of fluorescence intensity of the GUV shown in panel B. (red line) I lumen due to AF647, (green ■) I rim due to CF-TP10. A black solid line is the best-fit curve (Eq. (4)). ( e) A schematic drawing of asymmetric binding-induced pore formation and (f) symmetric binding-induced nanopore formation. An orange cylinder denotes an α-helix of MAPs, which is assumed to orient parallel to the membrane surface here for simplicity. MI denotes the membrane interface, and HC denotes the hydrophobic core of a lipid bilayer. (ac and bd) Reproduced from Karal et al. (Reference Karal2015a) and Islam et al. (Reference Islam2014a) with permission from the American Chemical Society, respectively.

Figure 4. Long description
The layout consists of two rows of panels labeled A to F. Panels A and B each contain two horizontal rows of time-lapse confocal laser scanning micrographs. In A, the top row (1) shows red fluorescence of G U Vs at time points from 0 to 315 seconds, with intensity remaining high until a sharp decrease after 150 seconds. The bottom row (2) shows green fluorescence, which increases at the rim after 140 seconds, indicating MAP binding and pore formation. In B, the top row (1) shows red fluorescence decreasing gradually from 0 to 310 seconds, while the bottom row (2) shows green fluorescence at the rim, with punctate increases over time. Panel C is a dual-axis line graph with time in seconds on the x-axis, normalized fluorescence intensity (0 to 1.2) on the left y-axis, and absolute intensity (0 to 3500) on the right y-axis. The red line (lumen) remains stable then drops sharply after 150 seconds, while the green triangles (rim) increase rapidly at the same time. Panel D is a similar graph for panel B, with the red line (lumen) decreasing gradually and the green squares (rim) increasing and then plateauing, with a black best-fit curve. Panels E and F are schematic cross-sections of a lipid bilayer. In E, orange cylinders (alpha helices) are shown parallel to the membrane surface on one leaflet, representing asymmetric binding, with a green arrow labeled PORE below. In F, orange cylinders are present on both leaflets, representing symmetric binding, also with a green arrow labeled PORE. MI and HC are labeled for membrane interface and hydrophobic core, respectively.
Next, we explain a typical example of the symmetric binding–induced pore formation (Figure 4b and 4d) (Islam et al., Reference Islam2014a). Figure 4d shows the time courses of I rim and I lumen of a GUV for the symmetric binding–induced nanopore formation. After stating the interaction of CF-TP10 with a single PC/PG-GUV, I rim, due to CF-TP10, increases gradually with time to reach a steady value at 125 s, where the binding equilibrium is held and this state does not change after pore formation. On the other hand, I lumen, due to AF647, remains constant initially and from 212 s I lumen decreases gradually. The onset time of the decrease in I lumen corresponds to the TP10-induced pore formation in this GUV. The time course of I lumen from 212 s to 360 s is determined by the rate of membrane permeation of AF647 through the TP10-induced pore. The entry of CF-TP10 into the GUV lumen occurs before pore formation, indicating that the translocation of CF-TP10 across the lipid bilayer occurs without the formation of pores in which AF647 can permeate. In other GUVs, similar time courses of I rim and I lumen of a GUV are observed (i.e., I rim increases gradually and reaches a steady value without a decrease in I lumen, and after a while I lumen starts to decrease), but the onset time of pore formation in each GUV differs. This result indicates that after MAPs bind to the outer leaflet, they gradually translocate across the lipid bilayer to the inner leaflet, without inducing membrane permeation of water-soluble fluorescent probe molecules until the MAP concentration in the inner leaflet equals that in the outer leaflet, and then, later, nanopore formation occurs. In the case of melittin, after I rim reaches ~80% of its steady-state value, I lumen begins to decrease (Lee et al., Reference Lee2013). At low concentrations of TP10, no pore formation occurs after translocation of TP10 (Islam et al., Reference Islam2014a; Moghal et al., Reference Moghal2020a). A different pattern also exists for symmetric binding–induced nanopore formation. For PGLa, the time course of the change in I rim shows a similar two-step increase to that shown in Figure 4c, without a decrease in I lumen, and after an extended time, nanopore formation begins (Parvez et al., Reference Parvez2018; Ahmed et al., Reference Ahmed2024a). There has been criticism that labeling MAPs with fluorescent probes enhances the translocation of MAPs across lipid bilayers due to the resulting increase in the hydrophobicity of the MAPs. To address this problem, a new method has been developed to detect the entry of label-free (non-labeled) MAPs into the GUV lumen and monitor their ability to translocate across the GUV bilayer without inducing pore formation (Shuma et al., Reference Shuma2020; Ali et al., Reference Ali2021). The results of studies using this method demonstrated the entry of label-free TP10 and PGLa in the lumen of PC/PG-GUVs without inducing pore formation, indicating that fluorescent probe labeling does not significantly affect MAP translocation.
As the mechanism of MAP translocation without pore formation, a pre-pore model has been proposed (Sharmin et al., Reference Sharmin2016; Islam et al., Reference Islam2017; Reference Islam2018; Hasan et al., Reference Hasan2019; Moghal et al., Reference Moghal2020a). As described in the Introduction, thermal forces cause fluctuations in the lipid density in the bilayer, resulting in the formation of a lower-density region known as a pre-pore (e.g., Ahmed et al., Reference Ahmed2025b). Several structural models of pre-pores have been proposed, including hydrophobic pre-pores and hydrophilic pre-pores, and among them, a toroidal pre-pore model, in which the outer and inner monolayers bend to connect to each other, has been extensively studied (Glaser et al., Reference Glaser1988; Evans et al., Reference Evans2003; Tolpekina et al., Reference Tolpekina2004; Wohlert et al., Reference Wohlert2006; Evans and Smith, Reference Evans and Smith2011; Fuertes et al., Reference Fuertes2011; Levadny et al., Reference Levadny2013; Hub and Awasthi, Reference Hub and Awasthi2017; Akimov et al., Reference Akimov2017; Hub, Reference Hub2021). The rim of a pre-pore is characterized by an extra free energy known as line tension (Γ), which causes the pre-pore to close rapidly; as a result, the radius of the pre-pore fluctuates. The membrane tension (σ) stabilizes the pre-pores because the stretching elastic energy of the lipid bilayer is decreased in the presence of pre-pores. Hence, the free energy of a pre-pore as a function of its radius r (U(r)) depends on Γ and σ, as follows (Karal et al., Reference Karal2016; Tazawa and Yamazaki, Reference Tazawa and Yamazaki2023):

where B represents a factor determined by the electrostatic interaction originating from the surface charges of the lipid bilayer (Karal et al., Reference Karal2015b), and U 0 is a factor without σ dependence, which can be interpreted as the nucleation free energy for the hydrophilic pre-pore formation (Karal et al., Reference Karal2016; Tolpekina et al., Reference Tolpekina2004; Wohlert et al., Reference Wohlert2006). The radius of the pre-pore (r) fluctuates over time due to thermal force, and the pre-pore closes rapidly if it does not reach the critical radius (r c) at which U(r) has the maximum value, corresponding to the energy barrier or the activation energy (U a) of nanopore formation. If r reaches r c, a stable nanopore is formed, which does not close (Figure 6a). If membrane tension continues to exist after nanopore formation, r increases with time, resulting in membrane burst (or rupture). In this sense, pre-pores can be regarded as unstable nanopores. Nanopores and pre-pores in GUVs can be experimentally distinguished by monitoring the permeation of a water-soluble fluorescent probe (i.e., membrane permeation of these probes in GUVs indicates nanopore formation). It should be noted that the terminology ‘pre-pores’ used in the GUV studies corresponds to the terminology ‘pores’ used in MD simulations on pore formation in lipid bilayers (Tolpekina et al., Reference Tolpekina2004; Hub and Awasthi, Reference Hub and Awasthi2017; Hub, Reference Hub2021), although the instability of pores cannot be detected using the current methods of MD simulations. The pre-pore theory described by Eq. (8) or similar equations reasonably explains the experimental results of tension-induced pore formation (Glaser et al., Reference Glaser1988; Evans et al., Reference Evans2003; Evans and Smith, Reference Evans and Smith2011; Levadny et al., Reference Levadny2013; Karal et al., Reference Karal2016; Tazawa and Yamazaki, Reference Tazawa and Yamazaki2023), thus supporting the theory’s validity. In the absence of membrane tension, the formation of pre-pores is greatly suppressed, but as membrane tension increases, the rate of pre-pore formation and the size (or radius) of pre-pores increase based on Eq. (8) (Sharmin et al., Reference Sharmin2016. Islam et al., Reference Islam2017; Hasan et al. Reference Hasan2019). The interaction of MAPs with the rim of a pre-pore may decrease its value of Γ, which would increase the lifetime of the pre-pore and thus enable the MAPs to diffuse through the pre-pores to translocate across the lipid bilayer (Figure 6b) (Sharmin et al., Reference Sharmin2016: Islam et al., Reference Islam2018). On the other hand, the current all-atom MD simulations cannot describe the transient formation of pre-pores in lipid bilayers (see the later description of MD simulations), and thus, they cannot support the pre-pore model for the MAP translocation without pore formation. However, MD simulations at high temperatures indicate that PGLa translocates across lipid bilayers without forming pores (Ulmschneider, Reference Ulmschneider2017).
One important effect of the binding of MAPs to the membrane interface is a change in the mechanical properties of the lipid bilayer, such as membrane stretching or compression. MAPs bind to the membrane interface through a variety of modes, which affects the area of the lipid bilayer in one of three ways, either an increase, decrease, or no change in membrane area, as theorized by Levadnyy et al. (Reference Levadnyy2019). The binding of some MAPs to the membrane interface increases the area of the lipid bilayer, either through an asymmetric binding–induced area change (e.g., Mag [Karal et al., Reference Karal2015a]) or symmetric binding–induced area change (e.g., melittin [Lee et al., Reference Lee2008] and TP10 [Islam et al., Reference Islam2017]). In the case of asymmetric binding leading to MAP-induced nanopore formation, the increase in GUV membrane area induces stretching of the inner leaflet, which is a pure lipid monolayer without peptides, resulting in positive membrane tension (Karal et al., Reference Karal2015a; Hasan et al., Reference Hasan2018a). This situation is similar to external force–induced pore formation in pure lipid bilayers, where the increasing membrane tension reduces the energy barrier of nanopore formation, resulting in an increase in the rate constant of pore formation (Levadny et al., Reference Levadny2013; Karal et al., Reference Karal2016). Experimental results indicated that the rate constant of MAP-induced pore formation (k p) increases with increasing the surface concentration of MAPs in the outer leaflet (X), irrespective of the concentration of negatively charged lipids or the surface charge density of lipid bilayers (Figure 5a). The fractional area change in the GUV membrane (δ) measured by the micropipette aspiration method is proportional to the X (Figure 5b), which was also verified by experiments showing that δ is proportional to the I rim associated with FL-MAPs (Figure 5d) (Karal et al., Reference Karal2015a), and this is also supported theoretically (Levadny et al., Reference Levadnyy2019). A theoretical model of MAPs-induced toroidal pore formation for the asymmetric binding (i.e., the stretch-activated pore formation model) has been proposed as follows (Karal et al., Reference Karal2015a; Hasan et al., Reference Hasan2018a). MAPs bind to the membrane interface of the outer leaflet of lipid bilayers solely. As the surface concentration of MAPs in the outer leaflet (X) increases, stretching of the inner leaflet as well as its membrane tension increase. At large values of X (depending on the kinds of MAPs and lipid compositions, and for the interaction of Mag with PG/PC-GUVs, X > 60 mmol/mol), corresponding to large stretching or membrane tensions, a pore is formed in the inner leaflet alone (i.e., a half-pore) because the energy barrier (U a) of nanopore formation decreases with membrane tension according to Eq. (8). This half-pore formation destabilizes the GUV membrane, and as a result, a transmembrane nanopore of the pure lipid bilayer is formed, subsequently Mag molecules in the outer leaflet diffuse into the pore rim, resulting in formation of Mag-toroidal pore (Figure 5c) (Karal et al., Reference Karal2015a; Hasan et al., Reference Hasan2018a). Since the rate constant of tension-induced pore formation in pure lipid bilayers can be obtained as a function of membrane tension (Levadny et al., Reference Levadny2013; Karal et al., Reference Karal2016), the rate constant of MAP-induced pore formation (k p) can be estimated as the rate constant of tension-induced pore formation in the inner leaflet. This kinetic theory of MAP-induced nanopore formation has been applied to determine the value of k p theoretically, which agrees with the experimental results of k p (Hasan et al., Reference Hasan2018a). The driving force of pore formation is thermal force, which explains the stochastic event of pore formation in single GUVs (see the previous section for details). In the MD simulation of Mag toroidal pore formation using umbrella sampling (Richardson and Van Lehn, Reference Richardson and Van Lehn2024), first aqueous pores are created with a nucleation collective variable (Hub and Awasthi, Reference Hub and Awasthi2017), and then, Mag molecules diffuse into the pore rim, resulting in the formation of a Mag-toroidal pore. Thus, these MD simulations support the above theoretical model of MAPs-induced toroidal pore formation. Therefore, a factor inducing membrane instability in the asymmetric binding-induced nanopore formation is membrane tension.
Effects of binding of MAPs to the membrane interface on the mechanical properties of lipid bilayers. (a) Dependence of the rate constant (k p) of Mag-induced nanopore formation in PC/PG (6/4)-GUVs in buffer on the surface concentration of Mag in the outer leaflet of lipid bilayer (X, the molar ratio of bound Mag to the lipids at the membrane interface). In panels a and b, (blue ●) PC/PG (6/4) and (red ▲) PC/PG (7/3). (b) Mag-induced area increase of lipid bilayers. Dependence of the fractional area change of the GUV membrane (δ) on X. (c) Dependence of the k p of Mag-induced nanopore formation in PC/PG (6/4)-GUVs in buffer (blue ●) and the rate constant (k R) of constant tension-induced burst of PC/PG (6/4)-GUVs in buffer (red ■) on the membrane tension in the inner leaflet of lipid bilayers (σ IM). (d) Time course of change in δ and rim intensity (I rim) due to the binding of CF-Mag/Mag to a PC/PG (6/4)-GUV. Interaction of 15 μM CF-Mag/Mag (containing 0.16 μM CF-Mag) with a GUV held at the tip of a micropipette, inducing a membrane tension of 0.50 mN/m. (Δ) δ, (green ▲) I rim, and (red line) lumen intensity due to AF647. (e) Time course of change in δ and I rim due to the binding of CF-TP10 to a PC/PG (8/2)-GUV in buffer. Interaction of 0.30 μM CF-TP10 with a GUV held at the tip of a micropipette, inducing a membrane tension of 1.0 mN/m. (□) δ, (green □) I rim, and (red line) lumen intensity due to AF647. A black solid line is the best-fit curve (Eq. (4)). (abd, c, and e) Reproduced from Karal et al. (Reference Karal2015a), Hasan et al. (Reference Hasan2019), and Islam et al (Reference Islam2017) with permission from the American Chemical Society, Springer, and American Chemical Society, respectively.

Figure 5. Long description
Panel A, at the top-left, plots k sub p (rate constant) on the y-axis versus X (molar ratio, mmol per mol) on the x-axis. Blue circles and red triangles show increasing k sub p with higher X for P C forward slash P G (6 forward slash 4) and (7 forward slash 3). Panel B, right of A, plots delta (fractional area change) on the y-axis versus X on the x-axis, with blue circles and red triangles showing a linear increase in delta as X rises. Panel C, below A, plots k sub p and k sub R (rate constants) on the y-axis versus sigma sub I M (membrane tension, m N per m) on the x-axis, with blue circles and red squares showing increasing rate constants with higher tension. Panel D, right of C, plots fluorescence intensity and delta over time (seconds), with green triangles and a red line showing rim and lumen intensity changes after C F-Mag forward slash Mag binding to a G U V. Panel E, bottom-right, plots fluorescence intensity and delta over time, with green squares and a red line showing changes after C F-T P 10 binding to a P C forward slash P G (8 forward slash 2)-G U V. A black solid line fits the data in E. All axes, symbols, and color codes are described as labeled.
A pre-pore model for translocation of MAPs across a lipid bilayer without pore formation. (a) Free energy landscape of a pre-pore in a lipid bilayer, U(r). The radius of the pre-pore (r) fluctuates due to thermal force, and the pre-pore closes rapidly if it does not reach a critical radius (r c) where U(r) has its maximum, i.e., the energy barrier or the activation energy of nanopore formation (U a). However, if it reaches r c, a stable nanopore is formed, which does not close. In this sense, pre-pores can be regarded as unstable nanopores. (b) A schematic drawing of the pre-pore model for the translocation of MAPs across a lipid bilayer. A red line represents a MAP. First, a MAP binds to a toroidal pre-pore, which decreases the line tension at its rim. Then, it diffuses through the wall of the pre-pore to reach the inner leaflet of the lipid bilayer. (c) Dependence of U(r) on line tension (Γ) at the rim of a pre-pore. The initial slope of U(r) increases with Γ, which indicates that the rate of pre-pore formation decreases with Γ. (b) Reproduced from Islam et al. (Reference Islam2018) with permission from Springer.

Figure 6. Long description
The top left panel is a line graph labeled U open parenthesis r close parenthesis on the y axis and r on the x axis. The red curve rises from U sub 0 to a peak at U sub a at r sub c, then falls. The region before r sub c is labeled pre-pores open parenthesis unstable nanopores close parenthesis, and after r sub c is labeled nanopore. A green arrow labeled Fluctuation points along the rising slope. The top right panel is a line graph with three curves of increasing height, all starting at U sub 0. A red upward arrow labeled capital gamma indicates increasing line tension, with the initial slope of U open parenthesis r close parenthesis increasing with gamma. The bottom panel is a four-step schematic showing a red line representing a MAP binding to and passing through a toroidal pre-pore in a lipid bilayer. Each step shows the MAP progressing from the outer to the inner leaflet, with black arrows indicating movement direction. The lipid bilayer is depicted as two layers of yellow spheres with black tails.
The theoretical model of stretch-activated pore formation can be applied to the nanopore formation induced by short MAPs and irregular MAPs/polymers (Billah et al., Reference Billah2024). If they bind to the membrane interface of the outer leaflet and increase its area, the inner leaflet is stretched, and membrane tension is produced (Figure 7a), resulting in the formation of a toroidal pore (Figure 7b). The stability of the pore depends greatly on the kinds of these MAPs/polymers and lipid compositions. In some cases, after they diffuse through the pore wall to the inner leaflet, a stable pore remains (Figure 7c), or the pore closes (Figure 7d), depending on the pore lifetime. In other cases, after starting pore formation, the bending of the membrane and subsequent aggregation of neighboring membranes occur, resulting in membrane disruption due to the burst (rupture) of the membrane (Figure 7e) (see also section ‘Effect of membrane tension, membrane potential, and lipid composition on MAP-induced nanopore formation’).
A schematic drawing of a model for the nanopore formation induced by short MAPs and irregular MAPs/polymers. (a) If short MAPs and irregular MAPs/polymers bind to the membrane interface of the outer leaflet and increase its area, the inner leaflet is stretched, and membrane tension is produced. (b) A toroidal lipidic nanopore is formed in the lipid bilayer, and these substances diffuse into the pore rim. (c) After they diffuse through the pore wall to the inner leaflet, a stable pore remains if the pore lifetime is long. (d) The pore closes if the pore lifetime is short. (e) After starting pore formation, the bending of the membrane and subsequent aggregation of neighboring membranes occur, resulting in the burst (rupture) of the membrane. Reproduced with some modifications from Billah et al. (Reference Billah2024) with permission from Elsevier.

Figure 7. Long description
Panel A at the top shows a horizontal lipid bilayer with purple ovals on the outer green layer and a gray inner layer. Red arrows and the Greek letter sigma point inward from both sides, indicating membrane tension. Panel B below shows the bilayer beginning to separate in the center, with the same tension arrows. Panel C at the lower left shows a stable pore with the bilayer edges separated and purple ovals lining the rim. Panel D at the bottom shows the bilayer rejoined, indicating pore closure. Panel E at the right shows the bilayer fully disrupted, labeled ‘Membrane disruption due to burst,’ representing membrane rupture. Blue arrows indicate the progression from B to either C/D or E.
By contrast, in the case of MAP-induced nanopore formation associated with symmetric binding, as the MAP concentration increases in both leaflets of the GUV membrane, the membrane area gradually increases (Lee et al., Reference Lee2008; Islam et al., Reference Islam2017). In the case of melittin, δ is proportional to the I rim associated with FL-MAPs (Lee et al., Reference Lee2013), but for TP10, the rate of increase in δ is a little lower than the rate of increase in I rim (Figure 5e) (Islam et al., Reference Islam2017). A theory explaining symmetric binding-induced nanopore formation has been proposed by Lee et al. (Reference Lee2004) and Huang (Reference Huang2009). The binding of MAPs to the membrane interface disturbs the lipid hydrocarbon chains and the thickness of lipid bilayers decreases with increasing the peptide to lipid ratio (P/L), and when the P/L reaches a threshold value, resulting in nanopore formation. This theory is specific to the equilibrium state; thus, the threshold value is determined by the equality of the chemical potential of two states: a state without pores and a state of multiple pores. It is noted that the theory of binding of AMP to the membrane interface indicates the increase in area of a lipid bilayer (or area per lipid) in the symmetric binding of AMPs is twice larger than that in the asymmetric binding of AMPs (Levadnyy et al., Reference Levadnyy2019), and thus, the decrease in thickness of lipid bilayers in the symmetric binding of AMPs is twice larger than that in the asymmetric binding of AMPs. Thus, for the theoretical model that the decrease in membrane thickness is the cause of pore formation, the symmetric binding mode has a higher efficiency of pore formation than the asymmetric binding mode. One of the possible rate-determining steps of symmetric binding-induced nanopore formation is the translocation of MAPs across lipid bilayers. In the interaction of MAPs with GUVs, first, MAPs bind to the outer leaflet of GUVs, which induces an increase in the area of the lipid bilayer, resulting in stretching of the inner leaflet. As described above, such membrane tension enhances the rate of pre-pore formation and the pre-pore radius, and as a result, MAPs can translocate across the lipid bilayer through pre-pores (Sharmin et al, Reference Sharmin2016; Islam et al., Reference Islam2017; Ahmed et al., Reference Ahmed2024a). This mechanism is supported by the experimental evidence that the interaction of MAPs such as TP10 and melittin with single GUVs increases their membrane area (Lee et al., Reference Lee2008; Islam et al., Reference Islam2017). As the surface concentration of MAPs in the outer leaflet (X) increases with an increase in the mole fraction of negatively charged lipids as well as MAP concentration in aqueous solution, membrane tension is enhanced. As a result, the rate of translocation of MAPs is increased, leading to an elevation in the rate of nanopore formation.
The differences between symmetric binding-induced nanopore formation and asymmetric binding–induced nanopore formation may originate from the ability of MAPs to translocate across the lipid bilayer without forming pores, which depends greatly on the type of MAPs and the lipid composition. In asymmetric binding–induced nanopore formation (e.g., Mag), MAPs localize only in the outer leaflet of the membrane until nanopore formation. After pore formation, the MAPs translocate across the lipid bilayer through the pore via lateral diffusion in the connected monolayers in a toroidal pore (Karal et al., Reference Karal2015a). By contrast, in symmetric binding–induced nanopore formation (e.g., melittin and TP10), MAPs initially translocate across the lipid bilayer to the inner leaflet via pre-pores, and then after this translocation, the MAPs in both leaflets induce nanopore formation. Currently, the ability of MAPs to translocate across the lipid bilayer cannot be predicted based on MAP structures. Even for MAPs composed of 20–30 amino acids that form an α-helix or a structure similar to an α-helix at the membrane interface, some MAPs (e.g., Mag) cannot translocate across the lipid bilayer via pre-pores, whereas other MAPs (e.g., TP10, PGLa, and melittin) can translocate it. The mechanism underlying this difference in behavior remains unknown, although we have the following hypothesis: if part of a MAP inserts into the hydrophobic core of the lipid bilayer or the α-helix of a MAP declines from the membrane surface to insert into the hydrophobic core, the inserted portion of the MAP may detect pre-pores effectively, and as a result, the MAP can more readily translocate across the lipid bilayer than a MAP that does not insert (or for which the helix is almost parallel to the membrane surface). This hypothesis is partly supported by the experimental evidence that the MAPs bound to the membrane interface with tilted angles (e.g., 125° for TP10 and PGLa; see section ‘Binding of MAPs to lipid bilayers’) can translocate across the lipid bilayer before pore formation, whereas the MAPs bound to the membrane interface completely parallel with the membrane surface (e.g., 90° for Mag) cannot translocate before pore formation. Therefore, the orientation of MAPs in the membrane interface may determine the mode of MAP-induced nanopore formation, i.e., the asymmetric binding-induced nanopore formation or the symmetric binding-induced nanopore formation (Figure 4). By contrast, it can be inferred that MAPs that are large in size or that have a large hydrophilic domain (e.g., PFTs and antimicrobial proteins [Propheter et al., Reference Propheter2017]) would not readily translocate across the lipid bilayer through pre-pores, and as a result, the asymmetric binding of these MAPs must induce nanopore formation. Moreover, lipid compositions can change the location of MAPs before pore formation. For example, the presence of cholesterol changes the location of MAPs from the symmetric binding to the asymmetric binding-induced pore formation because the translocation of MAPs is greatly suppressed (see the later description of TP10).
To quantitatively characterize the translocation of MAPs across lipid bilayers, it is necessary to estimate the rate of translocation (V trans). However, currently, values of V trans cannot be measured directly in most MAPs, because for MAPs involved in symmetric binding-induced nanopore formation, the I rim increases gradually from the time of initial binding of MAPs to the outer leaflet to the time when the final state of symmetric binding to both leaflets is reached (Figure 4d), and thus, it is difficult to determine the onset time of MAP translocation. Instead, the rate of entry of MAPs into the GUV lumen has been used as a measure of V trans (Islam et al., Reference Islam2014a, Reference Islam2017; Sharmin et al., Reference Sharmin2016; Moghal et al., Reference Moghal2020a), although some time lag occurs between the onset time of MAP translocation across the lipid bilayer to the inner leaflet and the time of MAP entry into the GUV lumen and this time lag depends on the rate of transfer (or unbinding) of MAP from the inner leaflet to the lumen (Figure 8b, c) (Moghal et al., Reference Moghal2018). Two approaches are generally used to detect the entry of MAPs into the GUV lumen: one uses GUVs containing smaller GUVs (Wheaten et al., Reference Wheaten2013; Islam et al., Reference Islam2014a; Sharmin et al., Reference Sharmin2016; Lund et al., Reference Lund2024) and the other uses GUVs containing LUVs within the lumen (Moghal et al., Reference Moghal2018, Reference Moghal2020a; Shuma et al., Reference Shuma2020; Ali et al., Reference Ali2021). The fluorescence (intensity) of smaller GUVs bound by FL-MAPs in the GUV lumen and the I lumen due to the LUVs bound by FL-MAPs are measured to detect the entry of FL-MAPs in the GUVs containing smaller GUVs and in the GUVs containing LUVs, respectively (Figure 8a). Both approaches have high sensitivity to detect FL-MAPs in the GUV lumen because the fluorescence intensity of FL-MAPs greatly increases due to their binding to lipid bilayers and the accumulation of FL-MAPs on the lipid bilayers, and as a result, the existence of very low concentrations of FL-MAPs in the GUV lumen can be detected. To detect the entry of label-free MAPs into the GUV lumen, the I lumen due to unquenched fluorescence of probe molecules (calcein) that leaked from the LUVs is measured (Shuma et al., Reference Shuma2020; Ali et al., Reference Ali2021). As a measure of the rate of entry of MAPs into the GUV lumen without pore formation, the fraction of GUVs containing fluorescent small GUVs among all examined GUVs or the I lumen at a specific interaction time (e.g., 6 min) is used. The method using GUVs containing LUVs has some advantages because it enables continuous, quantitative measurement of the entry of MAPs (Moghal et al., Reference Moghal2018, Reference Moghal2020a). In the case of PGLa, a two-step increase in I rim is observed, and thus, the onset time of the second increase in I rim is considered the onset time of translocation. Thus, the fraction of GUVs in which translocation of PGLa across the bilayer started or was completed at specific interaction time (t) among all examined GUVs (i.e., P trans(t)) is obtained, which can be used as a measure of V trans (Ahmed et al., Reference Ahmed2024a). Several lines of experimental data indicate that V trans of MAP increases with an increase in the rate of pre-pore formation. Line tension at the rim of pre-pores (Γ) greatly affects the rate of pre-pore formation because the free energy of a pre-pore (U(r), defined by Eq. [8]) and its initial slope increase with an increase in Γ (Figure 6c), and thus, the rate of pre-pore formation decreases with an increase in Γ (Evans et al., Reference Evans2003; Levadny et al., Reference Levadny2013; Karal et al., Reference Karal2016). For example, Γ increases with an increase in cholesterol concentration (Karatekin et al., Reference Karatekin2003). TP10 can translocate across PC/PG bilayers and PC bilayers without forming pores (Islam et al., Reference Islam2014a), but the presence of a high concentration of cholesterol (e.g., PC/PG/chol [6/2/4]) inhibits translocation (Islam et al., Reference Islam2017). Similarly, the translocation of a CPP, nona-arginine (R9), across PC/PG bilayers without nanopore formation is inhibited by high concentrations of cholesterol (Sharmin et al., Reference Sharmin2016). This phenomenon can be reasonably explained by the decrease in the rate of pre-pore formation due to high Γ. On the other hand, higher concentrations of TP10 induce pore formation in PC/PG/chol (6/2/4) bilayers, and in this case, TP10 localizes only in the outer leaflet just before pore formation (Islam et al., Reference Islam2017), indicating that asymmetric binding of TP10 induces nanopore formation, and subsequently TP10 diffuses through the pore wall to the inner leaflet and then to the GUV lumen, a mode identical to that of Mag (Karal et al., Reference Karal2015a). By contrast, Γ decreases as the length of the lipid hydrocarbon chains decreases (Evans et al., Reference Evans2003). The V trans of R9 increases as the hydrocarbon chain length decreases, which can be reasonably explained by the increase in the rate of pre-pore formation due to the decrease in Γ (Sharmin et al., Reference Sharmin2016). On the other hand, membrane tension (σ) increases the rate of pre-pore formation because the free energy of a pre-pore and its initial slope decrease with an increase in σ (Evans et al., Reference Evans2003; Levadny et al., Reference Levadny2013; Karal et al., Reference Karal2016). This σ dependence of the rate of pre-pore formation is supported by the experimental results that the rate constant of the flip–flop of lipids in the lipid bilayer without nanopore formation increases with increasing σ, because lipids can also diffuse through the pre-pores to translocate across the lipid bilayer (Hasan et al., Reference Hasan2018b; Saha et al., Reference Saha2020). As σ increases, the V trans of TP10 and PGLa across PC/PG bilayers without pore formation increases, and as a result, the symmetric binding state is rapidly generated, which is one of the causes of the enhancement of the rate of TP10 and PGLa-induced nanopore formation in the presence of σ (see section ‘Effect of membrane tension, membrane potential, and lipid composition on MAP-induced nanopore formation’ for details) (Islam et al., Reference Islam2017; Ahmed et al., Reference Ahmed2024a).
Detection method of the entry of MAPs into the GUV lumen. (a) A schematic drawing for the method using GUVs containing LUVs in their lumens (i) and GUVs containing smaller GUVs (ii). A circle and its black line denote a GUV and its rim (i.e., GUV membrane), respectively. The green color denotes fluorescence intensity of LUVs and smaller GUVs in a mother GUV lumen due to the binding of FL-MAPs. The red color in a mother GUV denotes fluorescence intensity of GUV lumen (I lumen) due to water-soluble fluorescent probes (e.g., AF647). (b, c) Time course of the change in fluorescence intensity of a GUV interacting with FL-MAPs (e.g., CF-TP10) in buffer. (b) 2.0 μM and (c) 1.0 μM CF-TP10. (black □) I lumen due to the LUVs bound with CF-TP10, (red •) I lumen due to AF647, and (green ■) I rim due to CF-TP10. Noted that at low CF-TP10 concentration (1.0 μM), the entry of CF-TP10 into a GUV lumen begins to occur after I rim reaches the maximum value, whereas at higher CF-TP10 concentration (2.0 μM), the entry of CF-TP10 begins to occur after I rim reaches ~60% of the maximum. Reproduced with some modifications from Moghal et al. (Reference Moghal2018) with permission from Elsevier.

Figure 8. Long description
The top section contains two schematic panels. On the left, G U V containing L U Vs is shown as a large circle with smaller circles inside. F L-M A P is depicted entering the G U V, binding to L U Vs, causing the lumen to turn green, while A F647 marks the lumen in red. Progression is shown by arrows, with the green color increasing as F L-M A P binds. Below, the red color (A F647) decreases as green increases. On the right, G U V containing small G U Vs is depicted similarly, with multiple inner G U Vs. F L-M A P enters and binds, turning the inner G U Vs green, while the outer lumen remains red, then fades. The bottom section has two line graphs. Panel B (left) shows fluorescence intensity (y-axis) versus time in seconds (x-axis) for 2.0 micro M C F-T P10. Green squares (I rim) rise rapidly then plateau, red dots (A F647) remain high then drop, and black squares (I lumen) increase gradually. Panel C (right) shows 1.0 micro M C F-T P10, with green squares (I rim) rising then plateauing before black squares (I lumen) increase, and red dots (A F647) remain steady then decrease. The timing of C F-T P10 entry into the lumen differs between concentrations, as described in the caption.
MD simulations have been used to analyze MAP-induced nanopore formation in various lipid bilayers (Leontiadou et al., Reference Leontiadou2006; Sun et al., Reference Sun2015; Bennett et al., Reference Bennett2016; Miyazaki et al., Reference Miyazaki2019; Talandashti et al., Reference Talandashti2021; Ulmschneider and Ulmschneider, Reference Ulmschneider and Ulmschneider2024; Richardson and Van Lehn, Reference Richardson and Van Lehn2024). All-atom MD simulations demonstrated that nanopore formation by several MAPs depends on the force field used in the simulation, because the energy barrier of MAP-induced nanopore formation is significantly affected by the force field (Bennett et al., Reference Bennett2016). The severe limitations of simulation time and the number of lipids (i.e., membrane area) in all-atom MD simulations prevent the detection of several elementary processes of MAP-induced nanopore formation as well as the production and fluctuation of pre-pores (Billah et al., Reference Billah2024). To overcome these limitations, several approaches have been proposed, such as combining coarse-grained and all-atom MD simulations (Talandashti et al., Reference Talandashti2021; Richardson and Van Lehn, Reference Richardson and Van Lehn2024), assumption of a specific initial configuration (Miyazaki et al., Reference Miyazaki2019), simulations at high temperatures (Ulmschneider, Reference Ulmschneider2017; Ulmschneider and Ulmschneider, Reference Ulmschneider and Ulmschneider2024), the use of umbrella sampling with a good reaction collective variable (Richardson and Van Lehn, Reference Richardson and Van Lehn2024), and adaptive steered molecular dynamics (Catalina-Hernandez et al., Reference Catalina-Hernandez2025). However, the simulation results obtained using these approaches are valid only under specific conditions. Moreover, due to these limitations in the all-atom MD simulations of biomembranes/lipid bilayers, the MD simulations have provided results that are significantly different from experimental results. For example, much higher membrane tensions are required for pore formation (or rupture) in lipid bilayers and activation of membrane proteins (Rajeshwar et al., Reference Rajeshwar2021; Poudel and Vanegas, Reference Poudel and Vanegas2024) in all-atom MD simulations than in real experimental systems. Its main causes are almost the same as described above; the limitations of simulation time and membrane area used in MD simulations (Yefimov et al., Reference Yefimov2008; Marsh, Reference Marsh1997). Therefore, it is essential to keep in mind that current MD simulation results of MAPs-induced nanopore formation and translocation of MAPs across lipid bilayers do not necessarily provide an accurate physical pictures.
Some researchers have proposed that AMPs induce an increase in membrane permeability without their transmembrane insertion based on the results obtained by the LUV suspension method. For example, AMPs-induced phase separation in the outer leaflet of lipid bilayers, detected using differential scanning calorimetry, may lead to an increase in membrane permeation or leakage because phase boundary defects around phase-separated domains are unstable (i.e., phase separation model) (Epand and Epand, Reference Epand and Epand2009; Epand et al., Reference Epand2009; Wadhwani et al., Reference Wadhwani2012). This phase separation model can explain the enhancement of membrane permeability induced by MAPs with different structures from amphipathic α-helix (e.g., α/β-peptides) and MAPs/polymers with irregular structures (e.g., random copolymers) (Epand and Epand, Reference Epand and Epand2009). A recent study of the interaction of some AMPs (indolicidin and LL-37) with LUVs by time-resolved small-angle X-ray scattering using the LUV suspension method indicates that the binding of these AMPs to the outer leaflet induces ion permeabilization (Koynareva et al. Reference Koynareva2025). The authors considered that this result is consistent with the interfacial activity model that transient perturbations of the lipid packing due to the binding of MAPs at the membrane interface of the outer leaflet induce leakage (Wimley, Reference Wimley2010; Guha et al., Reference Guha2019). In both models (i.e., phase separation model and interfacial activity model), even if small defects containing water molecules or narrow water channels are formed in lipid bilayers, the line tension at the rim of these water channels is large because the rim is composed of pure lipid bilayers without AMPs, resulting in their rapid closure. Hence, only transient membrane permeation may occur. Moreover, the free energy of lipid bilayers containing such small defects increases with their radius (i.e., 2πrΓ in Eq. (8)), and thus, only a small size of defects can be formed if there is no large membrane tension. Moreover, it may be easy to consider the production of transient defects in the outer leaflet alone, but another factor is required for defect formation in the inner leaflet. If the stretching of the inner leaflet occurs, membrane tension may be one of the factors (see the pre-pore model described above). To elucidate the mechanisms of the enhancement of membrane permeability, more detailed characterization of these defects or nanopores (e.g., size and lifetime) will be required. For this purpose, the GUV studies described above are useful (e.g., to check the translocation of AMPs to the inner leaflet and the membrane permeation of water-soluble fluorescent probes). To perform the characterization of ion permeabilization in detail, the analysis of electric current due to ion flux in the defects based on SCR and the single GUV method with ion-sensitive fluorescent probes to detect ion concentration in GUVs can be used. Some AMPs used in these studies also induce nanopores (or membrane disruption) that enhance the membrane permeation of water-soluble fluorescent probes under different conditions. For example, LL-37 induces membrane permeation of water-soluble fluorescent probes in LUVs and bacterial cells (Epand et al., Reference Epand2009; Sochacki et al., Reference Sochacki2011). Therefore, the above studies suggest that some AMPs may induce different types of nanopores, depending on conditions such as AMP concentration (e.g., at low concentration, only ion permeabilization, and at higher concentration, membrane permeation of water-soluble fluorescent probes and ions). To elucidate which type of nanopores plays an important role in AMP’s bactericidal activity, it is essential to investigate the AMP-induced membrane permeability of ions in live bacterial cells at the AMP concentrations that do not induce membrane permeation of water-soluble fluorescent probes (Sochacki et al., Reference Sochacki2011; Islam et al., Reference Islam2025), and examine the correlation between ion permeation and bactericidal activity at single-cell level (Islam et al., Reference Islam2023; Reference Islam2025). It is reported that a short-time (≤ 5 min) interaction of AMPs (Mag, PGLa, LfcinB) at their minimum inhibitory concentrations (MICs) with single live E. coli cells induces membrane permeation of water-soluble fluorescent probes, resulting in cell death, because the values of the fraction of dead cells after interaction time (t) determined by the single-cell analysis of bactericidal activity are similar to those of the fraction of cells with enhanced membrane permeation after the same interaction time (Islam et al., Reference Islam2023).
Effect of membrane tension, membrane potential, and lipid composition on MAP-induced nanopore formation
It is important to investigate the effects of various factors (e.g., membrane tension, membrane potential, and lipid composition) on MAP-induced nanopore formation in lipid bilayers because the resulting data can provide new insights useful in elucidating the mechanism of nanopore formation. As GUV-based studies of MAP-induced nanopore formation can reveal details of the underlying elementary processes, such studies can also be used to examine the effects of abovementioned factors on these elementary processes. First, we consider the effect of membrane tension, which plays a variety of roles in the function of cells, membrane proteins, and impacts the physical properties of cell membranes/lipid bilayers (Blount and Iscla, Reference Blount and Iscla2020; Sitarska and Diz-Muñoz, Reference Sitarska and Diz-Muñoz2020; Ahmed et al., Reference Ahmed2025b). Factors such as external forces, hydrostatic pressure, and osmotic pressure induce stretching of cell membranes, resulting in membrane tension. The micropipette aspiration method is often used to study the effect of membrane tension on the activity of membrane proteins, such as mechanosensitive channels (Sachs, Reference Sachs2010; Blount and Iscla, Reference Blount and Iscla2020; Zhang et al., Reference Zhang2021; Moller et al., Reference Moller2023). However, this method cannot provide detailed information regarding most MAPs, because GUVs are aspirated into the micropipette immediately due to GUV burst after MAP-induced pore formation (Karal et al., Reference Karal2015a; Islam et al., Reference Islam2017; Ahmed et al., Reference Ahmed2025b). A method using LUVs in suspension under osmotic pressure has been used in several studies to investigate the effect of membrane tension on MAP-induced membrane permeation (Benachir and Lafleur, Reference Benachir and Lafleur1996; Polozov et al., Reference Polozov2001). However, it is not possible with this method to accurately estimate the membrane tension in the LUVs, and the resulting data do not provide information regarding the elementary processes of MAP-induced membrane damage, thus limiting the usefulness of the method (Ahmed et al., Reference Ahmed2025b). In contrast to the above methods, a new technique based on osmotic pressure enables quantitative examinations of the effect of membrane tension on MAP activity and permits observation of the evolution of MAP-induced nanopore formation in the presence of membrane tension (Billah et al., Reference Billah2022; Ahmed et al., Reference Ahmed2025b). The quantitative measurement of membrane tension in GUVs under osmotic pressure (Shibly et al., Reference Shibly2016; Saha et al., Reference Saha2020) enables this new technique. The results obtained to date using this new method indicate that membrane tension has a significant effect on nanopore formation associated with both asymmetric binding (e.g., Mag) and symmetric binding (e.g., PGLa). The rate constant of Mag-induced nanopore formation (k p) and membrane permeability coefficient (M P) through Mag-induced nanopores increase with increasing osmotic pressure, and thus, with an increase in membrane tension (Billah et al., Reference Billah2022; Ahmed et al., Reference Ahmed2025a). Membrane tension due to osmotic pressure enhances the stretching of the inner leaflet produced by the binding of Mag to the outer leaflet, and the resulting total membrane tension in the inner leaflet increases the value of k p. At higher membrane tensions, Mag-induced nanopores are converted to micropores, the radius of which increases with time, ultimately leading to conversion of GUVs to membrane aggregates (i.e., GUV burst) (Billah et al., Reference Billah2022). These observations indicate that membrane tension increases the radius of Mag-induced nanopores and micropores, probably because interpeptide interactions are weak in toroidal pores (Qian et al., Reference Qian2008; Hasan et al., Reference Hasan2018a; Richardson and Van Lehn, Reference Richardson and Van Lehn2024). For PGLa-induced nanopores, values of P leak(300 s), a measure of the rate of PGLa-induced nanopore formation (V p), and M P increase with increasing osmotic pressure, and thus, membrane tension (Ahmed et al., Reference Ahmed2024a). One of the causes of increased Vp in response to increased membrane tension is the resulting increase in the rate of translocation of PGLa across the lipid bilayer (V trans). At higher membrane tensions (up to 4.1 mN/m), PGLa-induced nanopores are stable, which prevents micropore conversion and GUV burst, suggesting that PGLa-induced nanopores may differ from toroidal pores. In the case of CPPs, the rate of translocation of TP10 across PC/PG bilayers (V trans) increases with increasing membrane tension (Islam et al., Reference Islam2017). The membrane tension–induced increase in the V trans values of PGLa and TP10 can be reasonably explained by the increase in the rate of pre-pore formation according to Eq. (8), as described in the previous section. The effects of membrane tension on the physical properties of lipid bilayers and MAP activity are described in detail in our recent review article (Ahmed et al., Reference Ahmed2025b).
Next, we consider the effect of the membrane potential (φ m; i.e., the difference in electric potential [∆φ] between the outside and inside of cells), which plays a variety of roles in cellular functions (Hill, Reference Hill1992; Strahl and Hamoen, Reference Strahl and Hamoen2010; Zhou et al., Reference Zhou2015; Stratford et al., Reference Stratford2019). Most studies conducted to date on the effect of φ m on MAP activity have employed SCR measurements using planar lipid bilayers (Kagan et al., Reference Kagan1990; Wu et al., Reference Wu1999) or the LUV suspension method (Terrone et al., Reference Terrone2003; Zhang et al., Reference Zhang2009). However, the former method enables measurement of only the ion channel activity of MAPs, and the latter method cannot provide information regarding elementary processes of the activity (as described in the Introduction). A new method using GUVs with φ m has overcome these limitations (Hossain et al., Reference Hossain2019; Moghal et al., Reference Moghal2020a, Reference Moghal2020b). A membrane potential (φ m) can be applied to GUVs in which the membrane contains gramicidin A by creating a difference in K+ concentration between the GUV lumen and the external environment. The studies using this new method revealed that the k p of Mag-induced nanopore formation in PC/PG bilayers and the M P of fluorescent probe molecules through the Mag-induced nanopores increase with increasing negative ∆φ (up to −120 mV) (Figure 9a) (Or Rashid et al., Reference Or Rashid2020). Simultaneous measurement of the time course of the change in I rim of a GUV (due to the binding of CF-Mag) and the time course of the change in I lumen (due to fluorescent probe molecules) indicates that in GUVs with negative ∆φ, Mag localizes only in the outer leaflet before nanopore formation. Results of the ∆φ dependence of I rim indicated that the surface concentration of Mag in the outer leaflet increases with increasing negative ∆φ (Figure 9b). If we assume that the electric potential changes linearly within a lipid bilayer and that all positive charges of CF-Mag (number of net charges = n) are located at a∆φ (mV), where a represents a constant (0 ≤ a ≤ 1) (i.e., the average electric potential of all charges is a∆φ) (Figure 9c), the normalized I rim(∆φ), i.e., the ratio of I rim at ∆φ (I rim(∆φ)) to I rim(0 mV), can be described according to Eq. (9) based on the theoretical consideration of the free energy of binding (Or Rashid et al., Reference Or Rashid2020).
Effect of membrane potential (φ m or ∆φ) on the activity of MAPs. (a) Membrane potential dependence of the rate constant (k p) of Mag-induced nanopore formation in PC/PG (6/4)-GUVs in buffer. (red ●) 7.8 μM, (blue ■) 3.9 μM, (pink ▼) 1.6 μM Mag. (b) Membrane potential dependence of the rim intensity (I rim) due to the binding of CF-Mag to the GUVs. The values of I rim are expressed by the normalized I rim(∆φ), i.e., the ratio of I rim(∆φ) to I rim(0 mV). (red ●) 0.12 μM and (green ▼) 0.078 μM CF-Mag. Solid lines are the best-fit curves (Eq. (9)). (c) A schematic drawing of the electric potential (φ) landscape in a lipid bilayer in the presence of membrane potential (φ m). (d) Membrane potential dependence of the entry of CF-TP10 to the lumen of PC/PG (8/2) -GUVs without pore formation in buffer. The rate of entry of CF-TP10 into the GUV lumen is estimated by the lumen intensity (I lumen) due to the binding of CF-TP10 to the LUVs in GUV lumens, which were measured after 6 min interaction with CF-TP10. (red ■) 0.50 μM, (blue ▲) 0.40 μM, (black ●) 0.30 μM CF-TP10. (abc and d) Reproduced from Or Rashid et al. (Reference Or Rashid2020) and Moghal et al. (Reference Moghal2020a) with permission from Elsevier and Biophysical Society, respectively.

Figure 9. Long description
Panel A, top left, is a line graph with x-axis labeled Membrane potential in millivolts from negative one hundred twenty to zero and y-axis labeled k sub p in per second from zero point zero zero one to zero point one. Three datasets are shown: red circles for seven point eight micro Molar, blue squares for three point nine micro Molar, and pink downward triangles for one point six micro Molar Mag. All show decreasing k sub p as membrane potential increases toward zero. Panel B, top right, is a line graph with x-axis Membrane potential in millivolts from negative one hundred twenty to zero and y-axis I rim open parenthesis Delta phi close parenthesis all over I rim open parenthesis zero close parenthesis from zero to five. Red circles for zero point one two micro Molar and green downward triangles for zero point zero seven eight micro Molar C F dash Mag both show a decreasing trend, with solid lines as best-fit curves. Panel C, bottom left, is a schematic of a lipid bilayer with internal and external leaflets. The electric potential phi is plotted vertically, showing a step from Delta phi equals phi sub m at the inner side to zero at the outer side, with a phi sub m equals a times Delta phi marked. Panel D, bottom right, is a line graph with x-axis Membrane potential in millivolts from negative one hundred twenty to zero and y-axis I sub lumen from zero to seven hundred. Red squares for zero point five zero micro Molar, blue upward triangles for zero point four zero micro Molar, and black circles for zero point three zero micro Molar C F dash T P ten show higher I sub lumen at more negative potentials, decreasing toward zero.

The ∆φ dependence of the normalized I rim(∆φ) determined experimentally for different CF-Mag concentrations is well fitted to Eq. (9) (Figure 9b), providing that a = 0.13 (for n = 2) or 0.087 (n = 3), suggesting that Mag localizes near the membrane-water boundary (i.e., the membrane interface) in the presence of a membrane potential. Therefore, one can reasonably apply the same mechanism of Mag-induced nanopore formation described in the previous section to this case; that is, the increase in the surface concentration of Mag in the outer leaflet due to ∆φ enhances the stretching of the lipid bilayer, resulting in an increase in k p. Membrane potential also affects the interaction of CPPs with lipid bilayers. For example, the rate of entry of TP10 into the PC/PG-GUV lumen without pore formation increases with increasing negative ∆φ (Figure 9d) (Moghal et al., Reference Moghal2020a). As described in the previous section, this result indicates that the rate of translocation of TP10 across PC/PG bilayers (V trans) increases with increasing negative ∆φ. A large electric field due to ∆φ enhances the rate of TP10 diffusion through hydrophilic pre-pores during its translocation across the bilayer, which can reasonably explain this result (Moghal et al., Reference Moghal2020a). The above TP10 experiments involved only low concentrations of TP10; thus, no pore formation occurred. However, negative ∆φ-enhanced V trans of TP10 would be expected to increase the rate of TP10-induced pore formation at higher concentrations of TP10, because the symmetric binding of TP10 is required for its nanopore formation. Although SCR measurements of the interaction of some cationic AMPs with planar lipid bilayers have indicated that large negative ∆φ values induce the formation of ion channels of these AMPs (Kagan et al., Reference Kagan1990; Wu et al., Reference Wu1999), the underlying mechanism has not been clearly revealed. As described above, studies using the single-GUV method can clearly reveal the elementary processes of MAP-induced nanopore formation that are most affected by ∆φ. As a result, these GUV-based studies have elucidated the mechanism by which ∆φ affects MAP-induced nanopore formation, which depends on the mode of interaction between the MAPs and the lipid bilayer (e.g., the mechanism for Mag differs from that for TP10).
The stability of some MAP-induced nanopores depends on the lipid composition. PE/PG and E. coli polar lipids (PE/PG/CL = 67/23/10) (hereafter, E. coli–lipid) have been used to model the lipid composition of bacterial cell membranes in various types of experiments and MD simulations. As described in previous sections, PGLa forms stable nanopores in PC/PG-GUVs. By contrast, in PE/PG-GUVs, PGLa initially induces the formation of nanopores, through which membrane permeation of water-soluble fluorescent probe molecules occurs, but after an extended period of time, the GUV diameter begins to decrease, and in some cases, the GUV is then converted into an aggregate of lipid membranes (i.e., GUV burst) (Figure 10a) (Ahmed et al., Reference Ahmed2024b). Observations of GUV burst at a time resolution of 10 ms by incorporating a low concentration of fluorescent probe-labeled lipids (NBD-PE) into the membrane (Figure 10b) indicate that after nanopore formation, dense particles and inward budding (or vesicular structures) appear on the GUV membrane and in the GUV lumen, which is one of the causes of the conversion of nanopores to GUV burst. These results indicate that PGLa-induced nanopores in PE/PG bilayers are unstable. As described in previous sections, Mag forms stable nanopores in PC/PG bilayers. In E. coli–lipid GUVs, by contrast, Mag induces rapid bursting of GUVs within 1 s, resulting in sudden membrane permeation of fluorescent probe molecules, but no membrane permeation occurs before burst (Figure 10c). Observations of GUV burst at a time resolution of 5 ms (Figure 10d) indicated that Mag induces the formation of a micropore (corresponding to a darker circle in the GUV indicated by a white arrow), the diameter of which increases over time, and the GUV then converted into lipid aggregates (Billah et al., Reference Billah2023), indicating that Mag-induced nanopores are not stable in this type of lipid bilayer. The mechanism of Mag-induced nanopore formation in E. coli–lipid GUVs is similar to that in PC/PG-GUVs based on available experimental evidence, which indicates that Mag binds to only the outer leaflet of E. coli-lipid GUVs before pore formation and induces an increase in area of the membrane (i.e., asymmetric binding-induced nanopore formation). However, the responses of GUVs after pore formation differ. In E. coli-lipid GUVs, folding or aggregation of the membrane occurs near the rim of Mag-induced pores (Figure 10d), which may play an important role in micropore formation and GUV burst. These results indicate that Mag-induced pores in E. coli-lipid bilayers are unstable, but the mode of the conversion of Mag-induced nanopore to GUV burst differs from that of PGLa. However, in both cases, bending of the lipid bilayer appears to play an important role in folding of the membrane to induce membrane aggregation at the pore rim and dense particles in the GUV membrane, and also in budding of the GUV membrane toward the GUV lumen. It is noted that such MAPs-induced shape changes of the membrane (e.g., bending and budding) cannot be observed in other methods: for example, SLBs used in AFM observation are stabilized by their interaction with supporting solid substrates, inducing great suppression of shape changes of lipid bilayers, and as a result, it is difficult to observe the MAPs-induced bending and budding of lipid bilayers using AFM. Some lipids, such as PE and monoolein, tend to form nonbilayer membranes (e.g., hexagonal II phase and cubic phase membranes), given that the spontaneous curvature of these monolayers (H 0) is negative (Tazawa and Yamazaki, Reference Tazawa and Yamazaki2023). However, the presence of negatively charged lipids in these lipid membranes decreases the value of ∣H 0∣ due to electrostatic interactions (Li et al., Reference Li2001), resulting in stabilization of the lipid bilayer (or the Lα phase) in these membranes. The binding of positively charged MAPs to negatively charged PE/PG bilayers and E. coli-lipid bilayers decreases the surface charge density of the membrane, resulting in an increase in the ∣H 0∣ value, which may induce local bending of the GUV membrane (Billah et al., Reference Billah2023). However, details regarding the mechanism of the MAP (PGLa and Mag)-induced conversion of nanopores to GUV burst remain unknown, and thus, further investigation is required. It is noted that in bacterial cells membrane proteins may stabilize lipid bilayer regions in their cell membranes and thus most AMPs may induce rapid leakage of internal contents without local burst of cell membranes even if these AMPs induce burst of E. coli-lipid-GUVs, which has been indicated by the studies of the interaction of AMPs with single spheroplasts derived bacterial cells (Hossain et al., Reference Hossain2019).
Stability of MAP-induced nanopores. (a) Interaction of CF-PGLa/PGLa with a PE/PG (6/4)-GUVs in buffer. CLSM images due to AF647 (1) and CF-PGLa (2). 19 μM CF-PGLa/PGLa (containing 0.20 μM CF-PGLa). In all panels (a–d), the numbers above and/or below images denote the interaction time (s). Bar, 10 μm. Leakage of AF647 started at 70 s, and then, the GUV diameter started to decrease at 192 s, when the leakage was almost completed, and finally, the GUV was converted into an aggregate of lipid membranes (i.e., GUV burst). (b) Detailed process of PGLa-induced bursting of a PE/PG (6/4)-GUVs in buffer. Interaction of 19 μM PGLa with a single GUV whose membrane contains 1 mol% fluorescent probe-labeled lipid, NBD-PE, was observed at a time resolution of 10 ms. (1) (3) Phase-contrast images and (2) fluorescence microscopic images. Bar, 20 μm. A few small, bright spots and small vesicles appeared in the GUV, and the size of the bright spots increased with time. (c) Interaction of CF-Mag/Mag with an E. coli-lipid-GUVs in buffer. CLSM images due to AF647 (1) and CF-Mag (2). 20 μM CF-Mag/Mag (containing 0.16 μM CF-Mag). Bar, 10 μm. Leakage of AF647 did not occur until the rapid GUV burst at 53 s. (d) Detailed process of Mag-induced bursting of an E. coli-lipid-GUVs in buffer. Interaction of 31 μM Mag with a single GUV whose membrane contains 2 mol% NBD-PE was observed at a time resolution of 5 ms. (1) (3) Phase-contrast images and (2) fluorescence microscopic images. Bar, 20 μm. A small, dark spot appeared on the top of the GUV membrane at 40.115 s, corresponding to a micropore, and then, its diameter increased with time. (ab and cd) Reproduced from Ahmed et al. (Reference Ahmed2024b) and Billah et al. (Reference Billah2023) with permission from American Chemical Society and Elsevier, respectively.

Figure 10. Long description
Panel A contains two horizontal rows labeled one and two, showing confocal laser scanning microscopy of P E slash P G G U Vs exposed to C F dash P G La slash P G La. The top row displays red fluorescence (A F six four seven) and the bottom row green fluorescence (C F dash P G La), with time points from zero to two hundred eighty-nine seconds. Red signal decreases after seventy seconds, indicating leakage, and the G U V shrinks and disappears by two hundred eighty-nine seconds. Panel B shows phase-contrast (row one and three) and fluorescence (row two) images of a single G U V with N B D dash P E, exposed to P G La, at high temporal resolution from zero to two hundred seventy-six seconds. Bright spots and vesicles appear and grow, culminating in G U V bursting. Panel C, similar to A, shows E dot coli lipid G U Vs with C F dash Mag slash Mag, with red and green fluorescence in rows one and two, and time points from zero to fifty-seven seconds. No leakage is seen until a rapid burst at fifty-three seconds. Panel D shows phase-contrast (row one and three) and fluorescence (row two) images of a single E dot coli lipid G U V with N B D dash P E, exposed to Mag, at millisecond resolution from forty point one zero five to fifty seconds. A dark spot forms at forty point one one five seconds, expanding into a micropore and leading to G U V rupture. All panels include scale bars of ten or twenty micrometers as indicated.
On the other hand, for MAPs targeting to eukaryotic cells (e.g., lytic peptides, PFTs, anticancer peptides), lipid bilayers containing high concentrations of cholesterol (e.g., PC/cholesterol and PC/SM/chol) have been used as model lipid bilayers of eukaryotic cell membranes in various experiments and MD simulations. Studies using the LUV suspension method have reported that the presence of high concentrations of cholesterol in the lipid bilayer suppresses the activity of MAPs. Single-GUV studies have revealed the effect of cholesterol on the elementary processes of MAP-induced nanopore formation. As described in the previous section, higher concentrations of TP10 are required for pore formation in PC/PG/chol (6/2/4) bilayers than in PC/PG (8/2) bilayers, and the presence of cholesterol markedly decreases the rate constant of TP10-induced pore formation (Islam et al., Reference Islam2017). The rate of NK-2-induced membrane permeation of sucrose from GUVs reportedly decreases in the presence of cholesterol (Das et al., Reference Das2025). In PC/SM/chol bilayer, phase separation between the liquid-ordered (l O) phase and liquid-disordered (l d) phase occurs, and thus, if the target of MAPs is eukaryotic cell membranes, the effect of this phase separation and their phase boundary on the MAPs-induced nanopore formation is important. For example, lysenin induces nanopore formation in GUVs composed of SM/chol (6/4) bilayer in 100% l O phase effectively as well as GUVs composed of SM/PC/chol bilayer with the phase separation between the l O and l d phases, indicating that the phase boundary is not necessary for lysenin-induced nanopore formation (Alam et al., Reference Alam2012). As described in section ‘Binding of MAPs to lipid bilayers’, in most studies of MAPs-induced pore formation, lipid bilayers in the Lα phase or the l d phase are used because this phase is dominant in cell membranes. However, in some cases, the interaction of MAP with lipid bilayers in the gel phase can provide unique information from a physical point of view. For example, in DMPC-giant vesicles containing melittin (P/L = 1/10), micrometer size pores are observed in the gel phase, whereas no such pores are observed in the Lα phase (Naito et al., Reference Naito2000). Lipid compositions of cell membranes (e.g., bacteria, fungi and mammal) depend on their species and organs (e.g., Sohlenkamp and Geiger, Reference Sohlenkamp and Geiger2016), and thus, it is essential to select an appropriate lipid composition for each target of MAPs.
Conclusion and perspective
MAP-induced nanopore formation is the most important and fundamental among several actions of MAPs. This review article indicates that GUV-based studies of MAP-induced nanopore formation in lipid bilayers have revealed many aspects of the elementary processes and their correlations. For example, quantitative studies have examined the rates of pore formation and membrane permeation (or the membrane permeability coefficient) of fluorescent probes or labeled proteins and polymers through the nanopores. GUV-based studies have also elucidated details of the relationship between the binding of MAPs to the lipid bilayer and subsequent nanopore formation and the relationship between nanopore formation and the translocation of MAPs across the lipid bilayer and their entry into GUV lumen, as well as the effect of MAP binding on the mechanical properties of lipid bilayers. These results are vitally important for fully elucidating the mechanism of MAP-induced nanopore formation. Generally, the binding of peptides/proteins per se does not induce membrane damage such as nanopore formation, and thus, other factors destabilizing lipid bilayers are required to induce nanopore formation. Currently, two factors inducing instability have been proposed based on GUV-based studies (i.e., increase in membrane tension due to the asymmetric binding of MAPs and decrease in membrane thickness due to the symmetric binding of MAPs) and other factors inducing instability have been proposed based on LUV suspension method (i.e., phase separation and interfacial activity). The effects of membrane tension and membrane potential on MAP-induced nanopore formation have also been clarified using GUV-based methods because the elementary processes affected by these factors have been identified. Aspects of the stability of MAP-induced nanopores have also been examined (e.g., the process of the conversion of nanopores to GUV burst). The elementary processes of MAP-induced nanopore formation obtained through GUV studies can be compared with the results of MD simulations (e.g., Richardson and Van Lehn, Reference Richardson and Van Lehn2024). However, thermal force–induced pre-pore formation and the evolution of nanopores (e.g., conversion to micropores and bursting of vesicles) cannot currently be simulated due to limitations on simulation time and the number of lipids (or membrane area) in all-atom MD simulations. In the near future, however, detailed comparison between the results of GUV studies and MD simulations will be possible. With regard to future developments in single-GUV study design, a microfluidic method is promising, but it is very important to use GUVs consisting of oil-free lipid bilayers. To date, only a limited number of MAPs have been studied using GUV-based methods; thus, it will be necessary to examine the interactions between various MAPs and single GUVs, which could reveal novel mechanisms and elementary processes associated with MAP-induced nanopore formation. Moreover, as the mode of the interaction between MAPs and lipid bilayers depends on the lipid composition of the bilayer, it is anticipated that a wide variety of MAP/bilayer lipid composition combinations will be evaluated in the near future. Some MAPs may induce different kinds of nanopores in lipid bilayers (e.g., small-sized nanopores that induce ion permeabilization alone and larger-sized nanopores where membrane permeation of water-soluble fluorescent probes occurs) under different conditions (e.g., MAP concentration). To elucidate which kind of nanopores plays a vital role in MAP’s biological activity, such as AMP’s bactericidal activity, it is essential to investigate the MAP-induced nanopore formation in live eukaryotic cells/bacterial cells and compare the membrane permeability in the nanopores in cells with the MAP’s physiological activity, such as cell death at the single-cell level.
Funding support
This work was supported by a Grant-in-Aid for Scientific Research (B) (No. 19H03193) and a Grant-in-Aid for Challenging Research (No. 21 K19214) from the Japan Society for the Promotion of Science (JSPS) to M. Y.
Competing interests
All authors declare none.
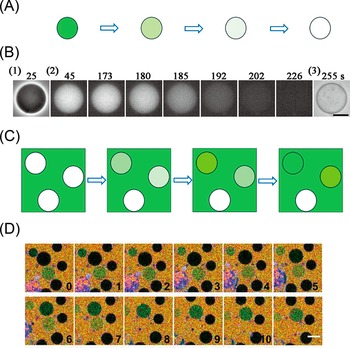
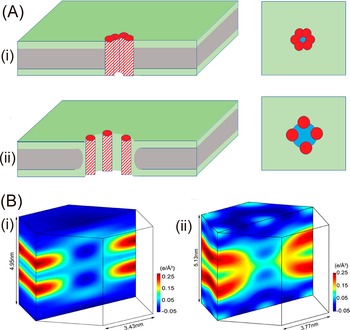

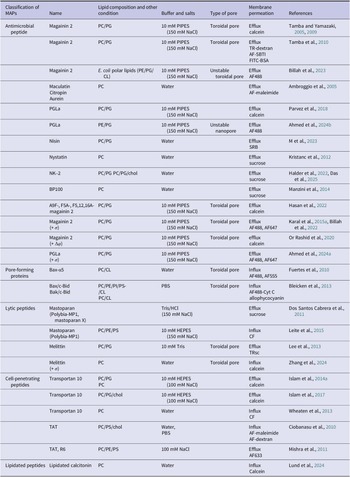
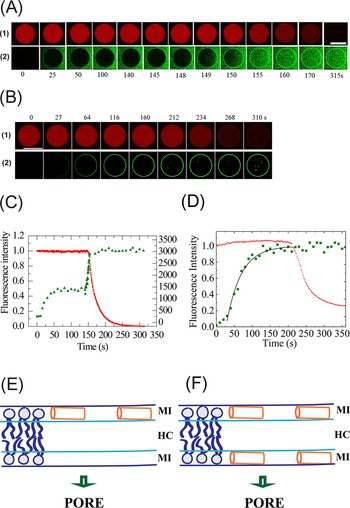
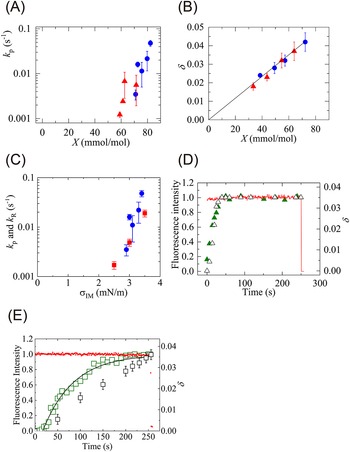
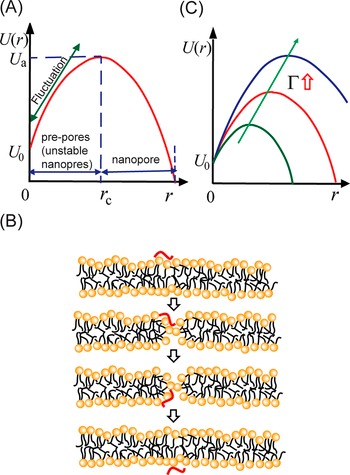
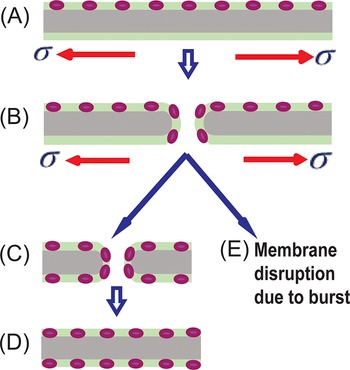
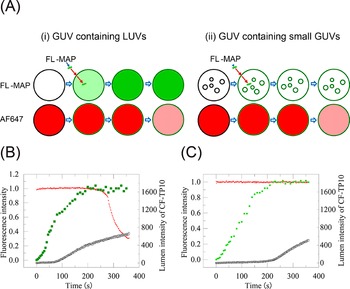
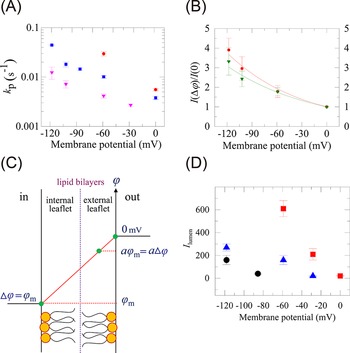
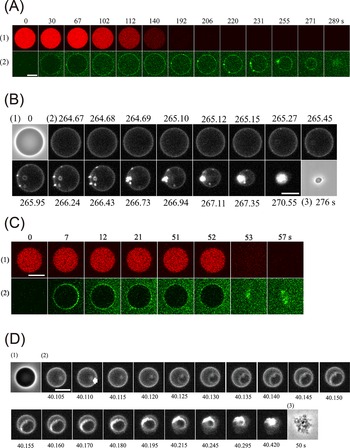

 Open access

