

A number of neuroimaging studies have suggested that patients with mood disorders have interhemispheric asymmetries in brain activity, particularly in the dorsolateral prefrontal cortex with the left hemisphere being hypoactive (Reference Baxter, Schwartz and PhelpsBaxter et al, 1989; Reference George, Lisanby and SackeimGeorge et al, 1999). However, such imaging studies do not provide specific physiological information regarding inhibitory v. facilitatory modulation in brain activity. For the motor cortex, transcranial magnetic stimulation (TMS) allows the non-invasive study of cortical excitability. Few studies have investigated cortical excitability using TMS in patients with depression. Samii et al (Reference Samii, Wassermann and Ikoma1996) and Shajahan et al (Reference Shajahan, Glabus and Gooding1999), combining TMS to the left hemisphere and an exercise paradigm, reported reduction in post-exercise cortical excitability in depression relative to normal subjects. We hypothesised, given the findings from neuroimaging studies, that there may be interhemispheric asymmetries in cortical excitability even in the absence of preactivation, and we therefore examined motor cortical excitability with TMS using measurements of motor threshold and paired-pulse excitability.
METHOD
The study was approved by the local institutional review board, and informed written consent was obtained from all participants.
Subjects
Patients
Eight patients were recruited (five males, three females; age range 19-78 years; mean age 46.8 years; seven right-handed, one left-handed) from a community-based out-patient clinic. All patients met criteria for unipolar recurrent major depressive disorder (MDD) according to the Structured Clinical Interview for DSM-III-R (SCID; Reference Spitzer, Williams and GibbonSpitzer et al, 1987) and DSM-IV (American Psychiatric Association, 1996), in which the diagnosis was established by a trained psychiatrist. All patients had been treated unsuccessfully with at least three different antidepressant medications at sufficiently high doses and for at least six weeks during the current major depressive episode. The absence of neurological disorders and contraindications to TMS (Reference WassermannWassermann, 1998) was confirmed by a trained neurologist. After patients' medications were withdrawn, there was a two-week washout period prior to participation in the study.
Normal controls
We recruited eight healthy volunteers (six males, two females; age range 21-75 years; mean age 44.9 years; all right-handed). All were naïve to TMS. Screening interviews confirmed that none had any psychiatric or medical history. None were on chronic medications. All had normal neurological examinations and none had contraindications for TMS.
TMS procedure
Subjects were seated in a comfortable reclining chair so that the whole body, including both arms, was at rest. Subjects were instructed to keep their hands still and as relaxed as possible. A tightly fitting Lycra swimming cap was placed on the head to mark the site of stimulation, which was identified as the scalp position at which TMS induced motor-evoked potentials (MEPs) of maximal peak-to-peak amplitude in the target muscle. Four disposable self-adhesive electrodes (Nicolet Biomedical, WI) were placed on the belly and the tendon of the abductor pollicis brevis (APB) muscles bilaterally. Two circular ground electrodes with a diameter of 30 mm were placed on the forearm bilaterally and linked to a common ground. MEPs were collected by a Dantec Counterpoint electromyograph with an amplification of 1.0 mV and a band pass of 20-1000 Hz (Dantec, Skovlunde, Denmark). Following preamplification, the signal was digitised by a CED 1404 interface (Cambridge Electronic Design, Cambridge, UK; sampling rate 2 kHz) and stored in a personal computer for off-line analysis.
TMS was performed with a commercially available 70 mm figure-of-eight coil using two magnetic stimulators (Magstim 200), which were linked through a Bistim module (Magstim Company, Carmarthenshire, UK). The optimal sites for evoking responses from right and left APB muscle (when stimulating the left and right hemispheres, respectively) were determined. The coil was positioned tangentially to the surface of the head, and the handle was placed along a sagittal axis pointing occipitally. In this position, the induced current in the brain predominantly activates corticospinal neurons transsynaptically (Reference Werhahn, Fong and MeyerWerhahn et al, 1994). The motor threshold was defined as the minimal intensity of stimulation capable of inducing MEPs of more than 50 μV peak-to-peak amplitude in at least six out of ten trials. The threshold determination was made during complete muscle relaxation. Muscle relaxation was documented by electromyogram and audio recording for least 200 ms prior to TMS.
The paired-pulse TMS study followed the method of Kujirai et al (Reference Kujirai, Caramia and Rothwell1993). The conditioning stimulus was applied at 80% of the subject's motor threshold and was confirmed to induce no MEPs. The test stimulus was applied at approximately 130% of the subject's motor threshold and was adjusted to evoke MEPs of approximately 0.8 mV peak-to-peak amplitude (± 0.2 mV) The interstimulus intervals (ISIs) used in this study were 1, 3, 6, 8, 10 and 12 ms for the patient group. The experiment was set up in blocks of 50 trials. In each block, the order of the trials was random. The 50 trials consisted of five trials for each different ISI and ten trials each of conditioning stimulus alone and test stimulus alone. There was an eight-second interval between each trial. The study of each patient included four blocks of trials per hemisphere. The stimuli were triggered and continuous data were collected by a CED Micro 1401 interface (Cambridge Electronic Design, Cambridge, UK).
The order in which the hemispheres were studied was randomised across subjects.
After obtaining the results of the MDD group, a similar study was conducted on the normal controls in order to test whether our findings of interhemispheric asymmetry might be related to the pathophysiology of depression. The study design was similar to that of the patient group except that the ISIs in the paired-pulse study were limited to 1, 6 and 12 ms. These ISIs were chosen to test the validity of the results for the patients who revealed a significant interhemispheric difference in intracortical excitability at 6 ms ISI but not at 1 and 12 ms ISI.
Neuropsychological measures
The patients' severity of depression was assessed with the Hamilton Rating Scale for Depression (HRSD, 28 items; Reference HamiltonHamilton, 1960) and the Beck Depression Inventory (BDI; Reference Beck, Beamcoderifer, Pichot and Oliver-MartinBeck & Beamcoderifer, 1974) by laboratory staff members who had been checked for interrater reliability.
Data analysis
The motor threshold (see above) was determined for each subject and for each hemisphere. An asymmetry index defined as percentage difference in the motor threshold between right and left hemispheres was calculated.
For the paired-pulse data, ten MEPs recorded for each subject at each ISI were averaged. These scores were then compared to the amplitude of the MEPs to the test stimulus alone. For each ISI, we computed a percentage difference from the test stimulus value for each subject. We first performed comparisons within the groups (patients with depression and controls). Following the within-group comparisons, percentage difference scores between the left and right hemispheres were computed at the 1, 6, and 12 ms levels. These scores were used to compare differences between patients and controls. All data were analysed with SPSS version 6.0/9.0 (SPSS, 1998).
RESULTS
All subjects tolerated the study well without unexpected complications. The only side-effect of TMS was a mild transient headache in one patient. The headache was resolved promptly with mild analgesia (paracetamol).
Baseline depression
The mean HRSD score was 30.5 (s.d.=4.41), and the mean BDI score was 21.5 (s.d.=11.55) for the MDD group. We found a correlation between the two ratings (r=0.80, P<0.02). Hence, HRSD scores were used for further analysis.
Motor threshold
For the MDD group, the mean motor threshold was 41.13% (s.d.=7.79%) of maximum output of the magnetic stimulator for the left hemisphere and 37.63% (s.d.=4.84%) for the right hemisphere. The average percentage difference between the hemispheres was ‒7.30% (s.d.=11.41%), indicating a higher left hemisphere motor threshold.
For the control group, the mean motor threshold was 48.29% (s.d.=13.40%) for the left hemisphere and 52.71% (s.d.=12.88%) for the right hemisphere. The average percentage difference was 11.02% (s.d.=16.0%, indicating a greater right hemisphere motor threshold). Data were not available for one of the control subjects, so these results represent the findings for seven controls.
Comparing the interhemispheric percentage differences in motor thresholds, there was a significant difference between the two groups (t(13)=-2.581, P<0.03) (Fig. 1). The strength of this effect as indexed by ϵ2 was 0.339. While this indicated that there were differences between the groups, we wished to determine whether asymmetry truly differed from zero in either group. Two corrected (α=0.025) single-group t-tests were performed. In both the MDD group (t(7)=-1.811, P<0.05) and the control group (t(6)=1.823, P<0.05), the asymmetry indices did not differ from zero.
Interhemispheric difference in motor threshold for the major depressive disorder (MDD) and normal control (NC) groups (P<0.03).

Paired-pulse curve
First, the differences across the ISIs and between the hemispheres in the MDD group (Fig. 2) were compared. A 2 × 6 repeated-measures analysis of variance (ANOVA) revealed that there was no significant interaction between hemispheres and ISI (F(5,35)=1.44, P>0.05; ϵ2=0.171) and no main effect for hemisphere (F(1,7)=3.36, P>0.05). However, there was a main effect for ISI (F(5,35)=17.18, P<0.0005; ϵ2=0.711). Bonferroni corrected post hoc comparisons (α=0.003) revealed that 1 ms ISI results were significantly different from the 10 and 12 ms ISI results. The 3 ms ISI results were significantly different from the 8, 10 and 12 ms ISI results.
Paired-pulse curves for the major depressive disorder (MDD) and normal control (NC) groups. Bars indicate standard errors.
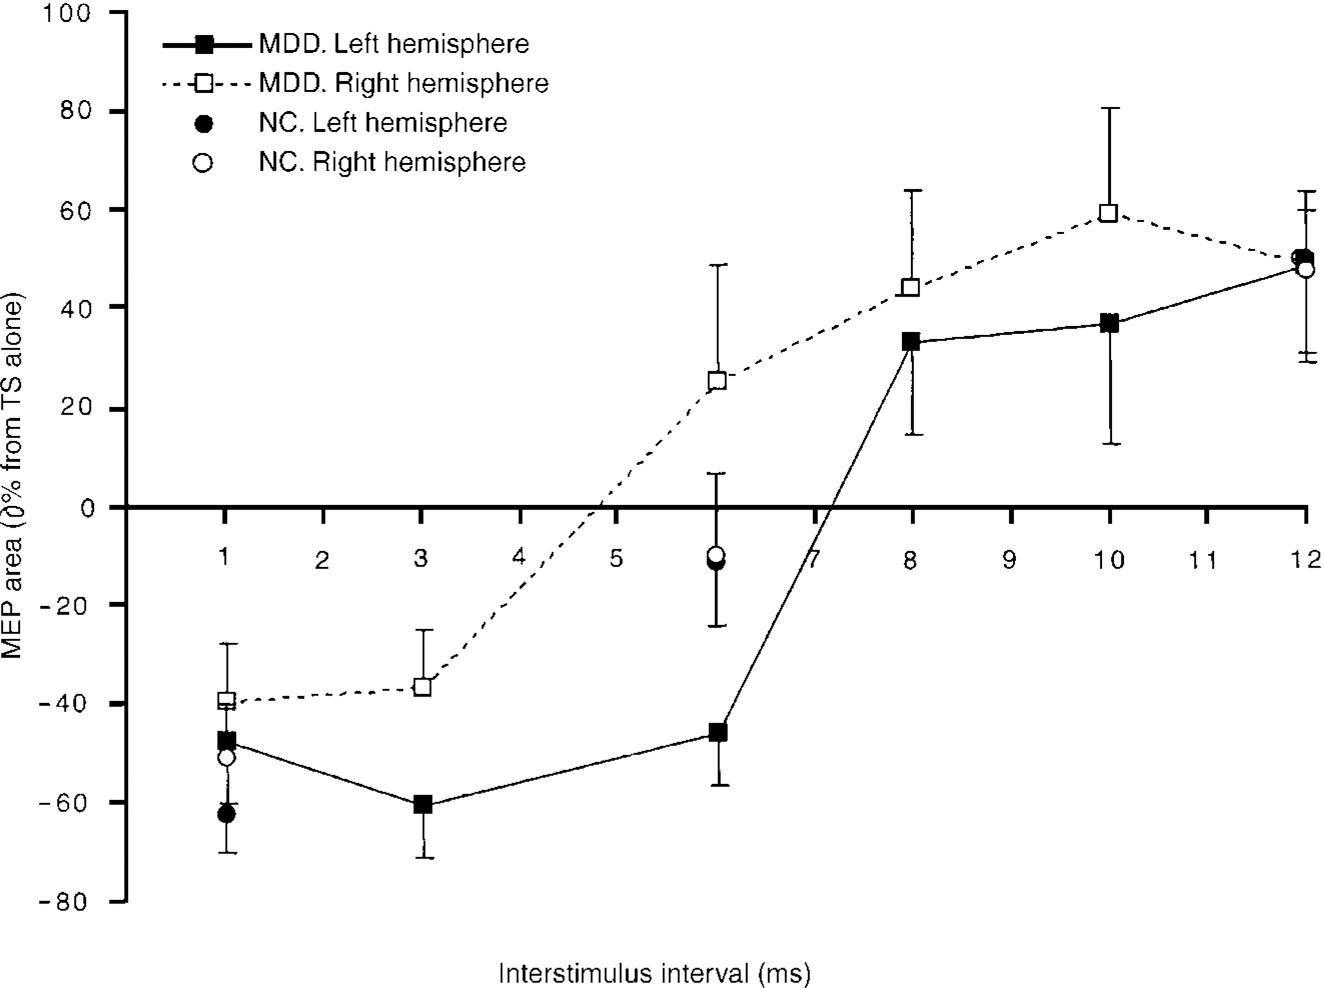
Next the control group results across the 3 ISIs (1, 6 and 12 ms) contrasting the left and the right hemispheres (Fig. 2) were compared. Employing a 2×3 (hemisphere × time) repeated-measures ANOVA, there was no significant interaction between the variables (F(2,14)=0.890, P>0.05; ϵ2=0.016). There was no main effect for hemisphere (F(1,7)=0.859, P>0.05; ϵ2=0.005). However, there was a main effect for ISI (F(2,14)=29.98, P<0.0005; ϵ2=0.811). All ISIs were significantly different from each other using Bonferroni comparisons (α=0.017).
We then compared the MDD and control groups at 1, 6 and 12 ms (Fig. 3). There was a significant interaction between the hemispheres and ISI (F(2,14)=7.66, P<0.006;ϵ2=0.523). Comparing the groups across the three ISIs using Bonferroni-corrected comparisons (α=0.017) at 6 ms ISI, there was a difference between the MDD group (M=-1.05, s.d.=62.54) and the control group (M=-0.2, s.d.=2.60; t(7)=5.23, P<0.001; ϵ2=0.796), such that the motor cortical excitability of the right hemisphere was greater than that of the left for the MDD group but not for the control group.
Comparisons between the major depressive disorder (MDD) group and the normal control (NC) group when paired pulses were applied at 1, 6 and 12 ms interstimulus intervals. Bars indicate standard errors. * P<0.001.

Correlation between severity of depression and motor cortical excitability
The influence of each hemisphere at each ISI was examined in order to determine whether there was a correlation with HRSD scores. Paired-pulse changes in the left hemisphere correlated at 10 ms ISI (r=0.773, P<0.03). This positive relationship indicated that as left hemisphere excitability increased at 10 ms, depression scores also increased. In the right hemisphere, there was no correlation with HRSD scores at any value of ISI (all P>0.05).
To determine whether asymmetry played a role, we subtracted the right from the left hemisphere percentage differences and compared them with HRSD scores. Asymmetry did not correlate with baseline HRSD scores.
Finally, the average of the inhibitory ISIs (1 and 3 ms) and the excitatory ISIs (10 and 12 ms) was calculated. Using the same asymmetry index, these scores were correlated with the HRSD scores. The average of 10 and 12 ms ISIs correlated with HRSD scores (r=0.844, P<0.008). As right hemisphere excitability increased in relation to left hemisphere activity, depression scores decreased.
DISCUSSION
Suggested mechanisms of motor threshold and paired-pulse techniques
Motor threshold studies reflect neuronal membrane excitability, which is mainly dependent on ion channel conductivity (Reference Hodgkin and HuxleyHodgkin & Huxley, 1952; Reference Ziemann, Steinhoff and TergauZiemann et al, 1998a ).
Paired-pulse TMS studies investigate intracortical excitability (Reference Pascual-Leone, Tormos and KeenanPascual-Leone et al, 1998). The effects obtained depend on the intensity of the conditioning and test stimuli and on the ISI (Reference Pascual-Leone, Tormos and KeenanPascual-Leone et al, 1998). These intensities influence the effects, because different circuits are recruited by different intensities of stimulation. The ISI influences the results because the time constants of the activated circuits may differ. At very short ISIs (<1ms), neural time constants of the stimulated elements may be studied; at ISIs of 1-4ms, interactions between I-wave inputs to the corticospinal neurons may be studied; and at ISIs of 1.5-20ms, intracortical inhibitory and facilitatory circuits may be studied. All these effects appear to be cortically mediated (Reference Kujirai, Caramia and RothwellKujirai et al, 1993; Reference Ziemann, Rothwell and RiddingZiemann et al, 1996), and intracortical inhibition (at ISIs of 1-4 ms) and facilitation (at ISIs of 8-12ms) appear to be due to activation of separate circuits (Reference Ziemann, Rothwell and RiddingZiemann et al, 1996). Inhibition seems to reflect the activity of inhibitory interneurons or inhibitory connections between cortical output cells (Reference Wassermann, Samii and MercuriWassermann et al, 1996). Facilitation seems to be partially due to facilitatory interaction between I-waves, and is thought to take place in the motor cortex at or upstream from the corticospinal neuron (Reference Ziemann, Tergau and WassermannZiemann et al, 1998b ).
The effects of different disorders and medications on the inhibitory and facilitatory phases of the paired-pulse curve suggest that γ -aminobutyric acid-(GABA)-ergic, dopaminergic and glutamatergic mechanisms are involved. Medications that enhance GABAergic activity have been shown to increase the degree of intracortical inhibition and decrease intracortical facilitation evoked by paired TMS stimuli at ISIs of approximately 8-12 ms (Reference Ziemann, Steinhoff and TergauZiemann et al, 1998a ; Reference Werhahn, Forderreuther and StraubeWerhahn et al, 1998). Conversely, in Parkinson's disease, the dopamine deficiency is associated with reduced intracortical inhibition at short ISIs (<5 ms) (Reference Berardelli, Rona and InghilleriBerardelli et al, 1996). Dopaminergic drugs have been shown to enhance intracortical inhibition in normal subjects (Reference Ziemann, Steinhoff and TergauZiemann et al, 1998a ). Furthermore, studies suggest that an early phase of relative facilitation in the paired-pulse curve at ISIs of approximately 3 ms as well as intracortical facilitation (ISIs of 8-12 ms) may be related to glutamatergic excitatory intracortical modulation (Reference Ziemann, Steinhoff and TergauZiemann et al, 1998a ).
Other disorders that show abnormalities in motor cortical excitability
In addition to the studies on Parkinson's disease, other disorders have been investigated using the paired-pulse technique. Patients with writer's cramp have shown a reduction in the inhibitory effects on the symptomatic side during muscle activation (Reference Chen, Wassermann and CanosChen et al, 1997). Patients with restless legs syndrome have shown a reduction in intracortical inhibition of both foot and hand muscles, suggesting that its origin may be subcortical (Reference Tergau, Wischer and PaulusTergau et al, 1999). Patients with cerebellar degeneration have shown a reduced intracortical facilitation, which supports the idea that the cerebellum physiologically exerts a facilitatory influence on the motor cortex (Reference Liepert, Wessel and SchwenkreisLiepert et al, 1998).
Interhemispheric asymmetry in motor cortical excitability in depression
In this study, MDD patients showed a significant interhemispheric difference in motor cortical excitability, with the left hemisphere having lesser and the right hemisphere having greater excitability than in controls. However, it is unclear what the underlying pathophysiological mechanisms are. The paired-pulse study revealed significant interhemispheric differences only at ISI of 6 ms. This is the time when the switch from intracortical inhibition to facilitation usually takes place. This switch is presumably related to a change in the balance between GABAergic and glutamatergic influences. The role played by depression is unclear. A plausible explanation for our findings might be that by comparison with the right hemisphere, the left hemisphere in MDD patients during a medication-resistant major depressive episode has relatively low glutamatergic influence or excessive GABAergic tone. Recently, Larisch et al (Reference Larisch, Hamacher and Klimke1999) have reported an abnormally low serotonin release in patients with a treatment-unresponsive major depressive episode. Such abnormalities, which may involve more than a single neurotransmitter system, may explain our findings.
The most basic parameter of motor excitability is motor threshold. In our study, we found a significant interhemispheric difference in motor thresholds between patients with MDD and controls. Recent neuropharmacological studies have indicated that the motor threshold reflects neuronal membrane excitability, which is mainly dependent on ion channel conductivity (Reference Ziemann, Steinhoff and TergauZiemann et al, 1998a ). This is different from paired-pulse studies that mainly reflect transmitter-related effects. It is interesting that both motor excitability parameters, although different in mode of action, showed interhemispheric differences.
Future studies
The relationship between depressive symptoms and interhemispheric differences in motor cortical excitability found in our study is novel, and caution is necessary in the interpretation of these results until a larger sample is studied. Nevertheless, the findings provide new insights regarding the cortical pathophysiology of MDD. It may be interesting not only to examine this effect in a larger number of patients but also to examine patients with MDD before and after remission from various anti-depressant treatments.
CLINICAL IMPLICATIONS AND LIMITATIONS
CLINICAL IMPLICATIONS
-
▪ Interhemispheric asymmetry in motor cortical excitability may be related to the pathophysiology of depression.
-
▪ Transcranial magnetic stimulation (TMS) is a useful tool for demonstrating abnormalities in inhibitory/facilitatory cortico-cortical/cortico-subcortical circuits.
-
▪ Physiological measurements with TMS provide useful supplementary findings to neuroimaging studies in neuropsychiatric disorders.
LIMITATIONS
-
▪ The relevance of motor cortex abnormalities to depression is unknown.
-
▪ A larger sample size is needed to confirm this abnormality in depression.
-
▪ Different types of depression, both medication-responsive and refractory, need to be studied.
ACKNOWLEDGEMENTS
We thank Aisling S. Warde, Zoë Stinchfield, Dawn Mechanic and Thomas Kauffman for research assistance, and Drs Bernard Vaccaro, Shirlene Sampson and Robert Birnbaum for their evaluation of the patients.


eLetters
No eLetters have been published for this article.