

Introduction: Ideology as the antithesis of technocracy?
The technocratic vision of society is purported to be antithetical to ideology. It yearns for political action guided by objective certainties, based on scientific evidence, that leave no room for disagreement. Ideology, by contrast, offers an interpretation of society and political choice based on preferences, often in competition with alternative programmes, which are legitimized through democratic support. Technocracy envisages problem solving in holistic terms by identifying the objective interest of the entire society. Ideology is partisan – in its simplest form as left versus right – promoting a course of action that arises from societal plurality in representative institutions. Yet, to say that technocracy and ideology are mutually exclusive is an illusion: no expert governance is exempt from choice, and no ideology can forgo competence. This connection creates a tension between the objective identification of the common good and the representation of plural subjective preferences.
The uneasy relationship between technocracy and ideology appears in regimes that espouse an ideology – whether Marxist or neo-liberal – and in international organizations and domestic institutions that are allegedly ‘non-majoritarian’ (Dargent, Reference Dargent2015; Sánchez Cuenca, Reference Sánchez Cuenca, Bertsou and Caramani2020). The contradiction appears in the discourse of parties and leaders who claim to be above politics with a putative ‘neither left nor right’ impartiality (Costa Pinto et al., Reference Costa Pinto, Cotta and de Almeida2017; Fischer, Reference Fischer2009). The tension is particularly subtle in citizens who admire supposedly efficient output-driven regimes, and question the willingness of fellow citizens and parties to put the general interest before the partisan one. Such views describe citizens with technocratic attitudes, who have only recently been studied (Bertsou & Caramani, Reference Bertsou and Caramani2022; Fernández-Vázquez et al., Reference Fernández‐Vázquez, Lavezzolo and Ramiro2023).
In fact, the technocratic vision sits uneasily with the representative institutions that channel the plurality of preferences and the competition between ideological programmes. For this reason, the support for a technocratic management of society has been portrayed as one of the ‘twin’ challenges to representative democracy, alongside populism (Caramani, Reference Caramani2017). Both share the rejection of politics as usual. In the case of technocracy, ideology is an obstacle to rational policy. In the case of populism, it is a betrayal of the will of the people. Both thus pose a ‘representational challenge’ that undermines the very premise on which modern democracy is based, namely the legitimate articulation of plurality, the mediation of the popular will through parties and elections, the right to disagree and oppose, and the antagonistic nature of politics regulated by procedures for peaceful competition (Dahl, Reference Dahl1956).
However, history shows that the anti-ideological claim does not hold up. Technocracy has been embodied in regimes based on different ideologies, from Marxist Soviets to neo-liberal corporatist states such as Mexico (Centeno, Reference Centeno1994). Technocratic discourse and claims about competence are used by many actors to legitimise goals that mould societies into one shape or another. Much of the literature on technocracy in the 1970s associates it with left-wing developmentalist policies (Dargent, Reference Dargent, Bertsou and Caramani2020; Hoffman & Laird, Reference Hoffman and Laird1985). The expert, independent agencies that were put in place to regulate different aspects of social and economic life exemplified the link between technocratic governance and left-wing politics practiced by a strong state. Since the 1980s, technocracy has often been synonymous with economic neo-liberalism, with technocratic institutions that follow these principles in domestic and international arenas.Footnote 1 Examples include the ‘Chicago Boys’ in Chile and ‘tecnicos’ in Peru and Colombia or supranational bodies such as the International Monetary Fund, World Bank and the European Central Bank (Clifton et al., Reference Clifton, Comín and Fuentes2006; Dargent, Reference Dargent2015; Sánchez Cuenca, Reference Sánchez Cuenca, Bertsou and Caramani2020). When technocracy moves toward politics, an ideological inclination becomes apparent.
What about technocratic citizens? This question is still understudied, and the goal of this paper is to analyse the ideological preferences of citizens with technocratic attitudes. Studies of populist attitudes show that its anti-ideological claim is an illusion, and that, in addition to a representational challenge, populism poses an ‘ideological challenge’. Populist voters’ preferences often have radical ideological positions (Mudde & Rovira Kaltwasser, Reference Mudde and Kaltwasser2012).Footnote 2 However, we do not know what technocratic citizens’ ideological position is and if it poses an ‘ideological challenge’ to mainstream parties and voters. Their putative anti-ideological stance is even stronger than that of populists, yet more deeply concealed in a blend of attitudes that includes support for elites, belief in expertise for competent problem solving, and distrust toward electoral politics as inefficient, divisive and incompetent (Bertsou & Caramani, Reference Bertsou and Caramani2020).
Are technocratic citizens a homogenous group with either left or right preferences? Or are they predominantly centrist in pursuit of the chimera of neutrality? Or is it a composite group that accommodates contrasting ideological orientations? Do technocratic citizens only exhibit a clearer ideological stance on economic issues like redistribution and regulation? Or do they also share a vision of society on issues captured by a cultural dimension (i.e. GAL-TAN), such as immigration, inclusion or environmental protection?
Using an original survey in Western Europe, Australia and the United States (US) – where party systems are similarly structured along established ideological divides – the paper explores the ideological leanings of citizens with technocratic attitudes and compares this group to the overall electorate, as well as to citizens with party-democratic and populist attitudes. It contributes to existing studies by highlighting the ideological profile of technocratic-minded citizens and mapping their place in a two-dimensional ideological space that includes economic and cultural issues. Empirical findings show that technocratic citizens’ challenge to democratic representation includes programmatic demands that are ideological. Results indicate that their ideological profile is similar to that of mainstream party-democratic voters, albeit more left leaning. This is driven by economic rather than by cultural issues. However, they have a very different profile from populist voters, who are more extreme, especially on the cultural dimension. Technocratic citizens therefore pose a mild ideological challenge to mainstream and party-democratic voters, in particular as they are not supported by specific ‘technocratic parties’ (something we discuss in the conclusion).
The next two sections address theoretically the tension between technocratic attitudes and ideological orientations with two goals: (1) to show that such attitudes are not in contradiction with holding ideological preferences and (2) to derive hypotheses about the profile of technocratic-oriented citizens in the one- and two-dimensional political space. This is followed by the research design, case selection, data from a new survey and the indicators of technocratic attitudes and left−right placement. The empirical section shows that, notwithstanding the shared anti-ideological stance of the two forms of representation, technocratic-minded citizens have an ideological profile closer to that of mainstream than to that of populist voters. The conclusion discusses normatively how this evidence demystifies fantasies about neutrality and the absence of conflict in setting societal goals, and how electoral competition may be affected by an ideological conflict between technocratic and populist forms of representation.
The tension between ideology and technocracy
Technocracy is a form of representation whereby policy action by an elite to address societal problems in a holistic and long-term perspective is legitimized through its reliance on expertise and efficiency (Meynaud, Reference Meynaud1969). As a form of representation, it entails acting on behalf and in the interest of the community. It is elitist, because it is guided by expertise rather than the will of the people. The reliance on scientific evidence and competence leaves no room for disagreement. Therefore, it is a vision of society without cleavages, divergent plural interests or opposition. The holistic character of technocratic representation and the problem-solving approach at a societal level also do not contemplate winners and losers. Policy is thus neither a matter of preference or choice, nor of aggregation of competing interests in society. The type of representation is a trusteeship, whereby a meritocratic elite is legitimized to independently identify problems and objective solutions to ensure long-term progress.Footnote 3
Technocracy manifests itself at various levels: from regimes to single institutions within democratic systems – independent from politics and autonomous from ‘majoritarian politics’ (i.e., democratic control) – and from the international level (e.g., the World Bank, International Monetary Fund and the European Union, itself often described as an unelected technocracy) to the discourse by actors like leaders and parties (Bertsou & Caramani, Reference Bertsou and Caramani2020). One crucial level where technocracy manifests itself is that of individuals: elites with a technocratic mentality (Putnam, Reference Putnam1977) and citizens, who may have attitudes more or less in favour of the technocratic management of society (Bertsou & Caramani, Reference Bertsou and Caramani2022; Lavezzolo et al., Reference Lavezzolo, Ramiro and Fernández‐Vázquez2021).Footnote 4
Studies have identified that a significant share of the electorate in Western publics holds technocratic attitudes which are distinct from populist and party-democratic citizens (Bertsou & Caramani, Reference Bertsou and Caramani2022; Chiru & Enyedi, Reference Chiru and Enyedi2021; Fernández-Vásquez et al., Reference Fernández‐Vázquez, Lavezzolo and Ramiro2023; Heyne & Costa Lobo, Reference Heyne and Lobo2021; Lavezzolo et al., Reference Lavezzolo, Ramiro and Fernández‐Vázquez2021). These findings about technocratic attitudes complement the more established study of populist attitudes (Akkerman et al., Reference Akkerman, Mudde and Zaslove2014; Castanho Silva et al., Reference Castanho Silva, Jungkunz, Helbling and Littway2019; Schulz et al., Reference Schulz, Müller, Schemer, Wirz, Wettstein and Wirth2017). Specifically, survey evidence shows that technocratic attitudes entail three dimensions.
First, elitism is at the core of technocracy as it envisions a legitimate role for an elite that, based on their expertise, intellect and merit, is distinct from ordinary people. Elites are entitled to guide society on behalf of people who do not have the required skills. Second, expertise is complementary to elitism. Technocracy is based on a belief in the possibility for knowledge to objectively identify the ‘best solution’ or ‘truth’. It is a positivist stance that emphasises the role of rational speculation and scientific procedures, facts and evidence. It prioritizes output and efficiency in identifying problems and providing solutions in complex and interdependent environments, especially in times of crisis when reform is necessary. Third, anti-politics can be defined with reference to views that politicians are incompetent and corrupt, that democratic politics binds decisions to the short-term pandering of voters, that over-responsiveness is subject to mood swings in ever shorter electoral cycles and that media attention exposes politicians to constant accountability for immediate results. Policy is thus a function of winning elections. Procedures, such as elections and parliamentary rules, as well as debating and deliberating, are time-consuming and inefficient.
This third dimension is also holistic and anti-pluralist. Party democracy is viewed as divisive, with parties articulating particularistic interests that are detrimental to the common good.Footnote 5 Yet, rational speculation and a reliance on facts point to solutions that cannot be controversial (if one disregards ignorance or ulterior motives). One cannot legitimately ‘oppose’ the objectively established best course of action. There cannot be partisan opposition to the common good. Policies identified through expertise are not subject to preferences. Pragmatism and necessity therefore discard different ideological visions and, ultimately, choice about society's course of action.
The distinction between the three dimensions is crucial for understanding the relationship between technocracy and ideology. Technocratic attitudes and ideology are antithetical when technocracy is taken as an aggregated construct that bundles together the three dimensions. However, of the three dimensions of technocratic attitudes, it is anti-politics that is in opposition to ideology. Elitism and expertise can be ideological without contradicting technocratic principles. As discussed in the introduction, different ideologies rely on elites, and expertise can serve different ideological goals. Non-ideological action does not automatically follow from expertise-based decision making by elites. These ‘representational’ features do not necessarily mean they cannot serve ideologies. They are concerned with ‘how’ (means) but in a compatible manner with ‘what’ (ends), namely choices on substance, ‘allocation of values’ and distribution of resources.
But anti-politics cannot be ideological, due to its holistic, anti-pluralist vision of society. Anti-politics is incompatible with choice. Its anti-pluralist nature does not allow for ideology, that is, alternatives and preferences. The conflation of separate technocratic dimensions into one complex construct is responsible for the view that technocratic-minded citizens cannot possess ideological orientations. Nevertheless, when technocracy moves toward politics, when technocratic actors become political and technocratic bodies prescribe policy, ideology can clearly be discerned in their vision of society.
It is on the anti-politics dimension that technocracy, similarly to populism, poses the clearest challenge to representative democracy. As theoretical work has argued (Caramani, Reference Caramani2017), and empirical work has confirmed (Bertsou & Caramani, Reference Bertsou and Caramani2022; Fernández-Vázquez et al., Reference Fernández‐Vázquez, Lavezzolo and Ramiro2023), both technocracy and populism share some features with representative democracy; elitism and popular legitimacy, respectively. This triangular relationship stresses the opposition between representative democracy and the common holistic element that technocracy and populism share, in spite of their radical differences on the role of elites and the people (Caramani, Reference Caramani2017). In fact, representative democracy bridges people's inclusion (their will) and exclusion (their lack of expertise). Where both technocracy and populism are distinct from representative democracy is on the holistic, anti-political and anti-pluralist – and therefore anti-ideological – vision of society.
Predicting the ideological profile of the technocratic citizen
We want to know how the technocratic challenge maps onto the ideological political space. Are there specific programmatic demands that are shared among citizens with technocratic attitudes? This is important, because political competition takes place not on a ‘representational’ but on an ideological spectrum in Western democracies. Furthermore, this left−right ideological divide is in flux, supplemented by new issues. There is a growing understanding that the ideological landscape of many established democracies is currently best described by two dimensions. In particular, empirical analyses have identified that an economic and a cultural dimension structures the ideological positions of both voters (Hillen & Steiner, Reference Hillen and Steiner2020; Thomassen, Reference Thomassen2012; Van der Brug & Van Spanje, Reference Van der Brug and Van Spanje2009) and parties (Binding et al., Reference Binding, Koedam and Steenbergen2023; Kitschelt, Reference Kitschelt1995; Kriesi et al., Reference Kriesi, Grande, Dolezal, Helbling, Höglinger, Hutter and Wüest2012). The former concerns inequality, redistribution and government intervention in the market economy; the latter concerns immigration, authoritarianism and traditionalism about social values (Hooghe et al., Reference Hooghe, Marks and Wilson2002).
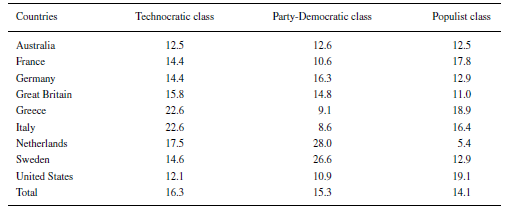
Citizens with technocratic attitudes are a sizeable group, they are interested in politics (Table 1) and show more interest in politics than other citizens (Table C1 in the Supporting Information Appendix). Yet, while extensive research exists on the ideological leanings of populist citizens, work on technocratic citizens has only recently taken off (Bertsou & Caramani, Reference Bertsou and Caramani2022; Bertsou & Pastorella, Reference Bertsou and Pastorella2017; Chiru & Enyedi, Reference Chiru and Enyedi2021; Fernández-Vásquez et al., Reference Fernández‐Vázquez, Lavezzolo and Ramiro2023; Heyne & Costa Lobo, Reference Heyne and Lobo2021; Lavezzolo et al., Reference Lavezzolo, Ramiro and Fernández‐Vázquez2021; Pilet et al., Reference Pilet, Vittori, Rojon and Paulis2023). We know little about the ideological profile of technocratic voters and their specificities, apart from theoretically driven expectations that they are moderate or economically liberal, following the ideological leanings of the more prominent technocratic institutions of our time.

What can theoretically be expected about the ideological orientations of citizens with technocratic attitudes? As mentioned before, technocratic politics has been associated historically both with the left and the right, with economic central planning and with market liberalization, with authoritarian regimes and with socially progressive institutions. It is therefore plausible to expect orientations in either ideological direction, although historical experiences should not be inferred onto the ideological leanings of individual citizens today. Rather, testable expectations about the ideological profile of technocratic citizens must be derived from the theoretical features of the three dimensions of technocratic attitudes.
Starting at the basic level of the composition of the group, technocratic citizens may be ideologically homogenous or heterogeneous. On the one hand, citizens holding technocratic attitudes may lean homogenously toward leftist or rightist ideological positions. This is a transformational argument. Economically, for example, technocratic attitudes on the left may favour the use of expertise for state intervention, redistribution and collective insurance instruments, whereas on the right, technocratic expertise is needed to develop legal frameworks to liberalize, privatise and attract investment. That technocratic citizens’ ideological positions distribute either left or right ‘centrifugally’ is therefore plausible.
On the other hand, the technocratic group of citizens need not necessarily align left or right in a homogenous way. On the contrary, precisely because technocratic attitudes are compatible with different ideological positions, there is the possibility of ideological heterogeneity, namely that citizens holding technocratic attitudes may be scattered across different ideological positions. In support of this expectation, and against some of the aforementioned literature on technocratic citizens’ right leaning, analyses of the voting behaviour of technocratic citizens do not detect any conclusive party preference, be it left or right (Heyne & Costa Lobo, Reference Heyne and Lobo2021). A first possibility is that the distribution of voters is evenly dispersed along the left−right scale. In this case the argument is about eclecticism. It is an ideologically composite group that has no unique common denominator. As a second possibility, heterogeneity can also mean that citizens holding technocratic attitudes may be divided over their ideological positions. The distribution of voters would be bipolar (two peaks) on the left−right scale. The argument is about confrontation. The left and right ideological positions coexist within this segment of the electorate and oppose one another. It is not to be expected that this confrontation is radical, as technocratic attitudes tend to be moderate, pragmatic and refractory to radical choices even if they distribute left and right. That is, one would not expect a U-shaped curve along the left−right dimension with positions on the extremes, but rather a two-peaked curve.
Against transformational, eclecticism and confrontational arguments, we hypothesize that citizens who hold technocratic attitudes are more likely than other types of voters to gravitate homogenously around centrist ideological positions. The distribution of voters would be peaked at the centre of the left−right scale. This argument is about pragmatism. In the centre, citizens are ideologically moderate. It is a vision of adjustment rather than transformation. Pragmatism, output legitimacy, problem solving and efficiency are the closest features of technocratic neutrality and objectivity, in avoidance of harsh choices. Centrism and moderation mean openness to blend ‘whatever works’ from either ideological side without principled prejudice and the availability to change direction. This third possibility, that is, that technocratic citizens place themselves ‘centripetally’ on the left−right spectrum, is therefore also theoretically plausible. This leads us to formulate the following hypothesis:
H1: Citizens with technocratic attitudes are likely to hold more centrist ideological positions compared to other types of voters.
To further unpack this hypothesis about the ideological preferences of these technocratic citizens, our study explores their attitudes beyond a single left−right dimension by extending it to ‘sub-domains’ of the policy space: economic and cultural. In addition to providing a firmer understanding of citizens’ substantive ideological preferences, there are other reasons for adopting a multidimensional lens. First, although the two dimensions are often correlated, this relationship is not fixed. Research suggests that the left-authoritarian quadrant is one of the most populated in the two-dimensional landscape (Hillen & Steiner, Reference Hillen and Steiner2020; Lefkofridi et al., Reference Lefkofridi, Wagner and Willmann2014; Van der Brug & Van Spanje, Reference Van der Brug and Van Spanje2009). Second, and more importantly for this paper, the nature of the two dimensions is arguably distinct (Tavits, Reference Tavits2007). The economic domain is associated with pragmatism, adaptability and performance (MacKuen et al., Reference MacKuen, Erikson and Stimson1992; Stevenson, Reference Stevenson2001). Economic policies are a means to an end, that is, an instrumental toolbox to achieve material outcomes. The cultural domain, on the other hand, is value-based and rooted in one's sense of identity – be it religious, national or otherwise (Domke et al., Reference Domke, Shah and Wackman1998, Goren & Chapp, Reference Goren and Chapp2017). Ideological positions in this realm tend to be rigid, categorical and principled, leaving little room for rational calculation.
From this perspective, the economic domain might be more suited for technocratic reasoning. However, as argued above, technocratic reasoning in the economic domain is not neutral and can be associated with ideological positions about the economy (for example, degree of state intervention, strength of welfare state, taxation, correction of inequality, etc.). Moralized attitudes, which debilitate compromise, can be found on economic and cultural issues alike (Ryan, Reference Ryan2017). It can therefore not be ruled out that technocratic attitudes are associated with ideological positions on both dimensions.
As far as the economic dimension is concerned, the trust that technocratic citizens hold in knowledge and expertise leads to the expectation that this type of voter prefers positions that address the complexity of markets and finance, monetary policy and supranational integration, that is, neo-liberal beliefs that dealing with such complexity is best left to the market. While market mechanisms may be perceived as instruments geared toward the common good or firms’ rationality as socially beneficial, the distrust that technocratic citizens have in the competence of politicians further reinforces the reliance on non-state mechanisms such as markets.Footnote 6 In addition, the fact that technocratic citizens value practical experience, decisiveness and effectiveness, hard work and deservedness that have parallels in the economic world, coupled with the belief that policy makers should act like business leaders, reinforces the expectation that such views align with liberal, market-economy positions. This contrasts with other segments of the electorate, in particular populist voters, that are more prone to follow policies based on state intervention, redistribution through welfare benefits, etc. This leads to the following hypothesis:
H2: Citizens with technocratic attitudes are likely to hold more liberal (right-wing) positions on the economic dimension compared to other types of voters.
With regard to the cultural dimension, Bertsou and Caramani (Reference Bertsou and Caramani2022) have shown that higher levels of education predict assignment to the class of citizens holding technocratic attitudes, because of the strong belief that science, objectivity, knowledge and expertise should guide policy. At the same time, higher levels of education are associated with culturally progressive positions. By contrast, it has been repeatedly confirmed in the literature that lower levels of education characterize voters that have a propensity for populist attitudes. Given the predictive power of education and the growing educational structuration of the cultural divide (Marks et al., Reference Marks, Attewell, Hooghe, Rovny and Steenbergen2023), one might expect a culturally progressive leaning among technocratic citizens. Technocratic citizens are also in a better position to value the advantages of open borders, supranational integration and the mobility of labour across national borders. Their positions toward immigration can therefore be expected to be positive. This leads to the last hypothesis:
H3: Citizens with technocratic attitudes are likely to hold more progressive (left-wing) positions on the cultural dimension compared to other types of voters.
Empirical strategy and data
This study relies on survey data from nine Western democracies: seven West European countries (France, Germany, Great Britain, Greece, Italy, the Netherlands and Sweden), Australia and the US. Having defined ideology in terms of left and right means that the selection of countries must include institutionalized party systems where this distinction makes sense. These countries are structured similarly along left−right economic and cultural dimensions. The left−right ideological positions of citizens have been a feature of these political systems for decades and are well understood. At the same time, this case selection allows us to cover majoritarian and consociational polities, liberal and coordinated market economies (with corporatist decision making), and some that have recent experiences with technocratic cabinets. Data were collected through an online survey administered by Dynata in December 2020. It consists of samples of approximately 1,000 respondents per country that are representative of the national population in terms of age, gender and geographical location, based on sampling quotas.
In order to assess the type and scope of the ideological challenge that technocratic attitudes pose to representative democracy, and to what extent it mirrors or differs from the challenge posed by populist attitudes, the analysis is based on survey items that capture the latent dimensions of expertise, elitism, anti-politics and populism. Using the questionnaire developed in Bertsou and Caramani (Reference Bertsou and Caramani2022), the items allow us to identify respondents with technocratic attitudes in our sample. Replicating their latent class analysis (LCA), the survey items are used to assign respondents to technocratic, party-democratic and populist ‘classes’ (henceforth we will use this methodologically-driven term to indicate groups built on attitudinal similarity).Footnote 7 Once we have identified the three classes of interest, we describe the distribution of their ideological preferences along the left−right dimension in comparison with one another and with the overall sample.Footnote 8
Technocratic-minded citizens are respondents in the survey that have been assigned to the ‘technocratic class’ as opposed to other classes. LCA clusters respondents into classes (or profiles) based on their responses to items tapping into (1) expertise in politics, (2) anti-politics, (3) elitism, and (4) populist attitudes.Footnote 9 It is designed to study heterogeneous groups among the population. Our aim is to identify substantively meaningful groups of people in line with the needs of the study. The three classes of interest exhibit different combinations of the latent dimensions: (1) in the technocratic class, respondents score high on expertise, anti-politics and elitism but low on populism; (2) in the party-democratic class, scores are low on anti-politics and populism; (3) in the populist class, we find high scores on populism and anti-politics but low scores on elitism. Counter-intuitively, we find that the populist class exhibits high preference for expertise in politics, which is in line with previous empirical research on the potential for technopopulist forces (Akkerman et al., Reference Akkerman, Mudde and Zaslove2014; Bertsou & Caramani, Reference Bertsou and Caramani2022; Bickerton & Invernizzi Accetti, Reference Bickerton and Invernizzi Accetti2021; Fernández-Vázquez et al., Reference Fernández‐Vázquez, Lavezzolo and Ramiro2023). LCA estimates the probability of class assignment for each respondent. Using the modal posterior probability of class assignment, we can assign each respondent to one class and investigate the three profiles of interest.Footnote 10
Table 1 shows the size of the classes both in the total sample and in each of the nine democracies included in the study. To best bring out the contrast between the three sets of attitudes, the analysis focuses on comparisons between the three distinct classes, as well as the total sample, leaving out the classes that display mid-range or inconsistent values (see Appendix 2 in the Supporting Information Appendix for the full 7-class model and detailed figures for all classes).
To investigate the ideological profile of respondents, the analysis focuses on the general left−right axis, as well as in a disaggregated way on the economic and cultural dimensions. The general left−right ideological position is operationalized through a single item that asks respondents to place themselves on a 10-point scale from left to right. For the economic and cultural dimensions, we employ a battery of items intended to capture both the core element of these divides and, at the same time, apply to a variety of policy issues (economic, socio-cultural and political) and cleavages (based on gender, class, ethnicity and geographical area, among others).
We create two indices using the items presented in Table 2, allowing us to unpack the analysis for an economic and a cultural ideological dimension on the basis of the theoretical considerations above. For the economic dimension, we chose items focusing on redistribution and public service provision, and for the cultural dimension items capturing traditional, authoritarian attitudes on marriage, social diversity, and law and order. The use of three items ensures that we do not rely on ideological preferences for a single policy issue, which increases the face validity of the constructs.Footnote 11 The indices are constructed as average scores and further supported by factor analysis of the six items (see Table B5, Supporting Information Appendix). The two-dimensional structure of political orientations is confirmed by the fact that the two indices (both 0–10 point scales) are only weakly correlated (Table 2). Our approach builds on existing research, which has constructed similar measures of ideological dimensions using individual items (see, e.g. Hillen & Steiner, Reference Hillen and Steiner2020; Lefkofridi et al., Reference Lefkofridi, Wagner and Willmann2014; Van der Brug & Van Spanje, Reference Van der Brug and Van Spanje2009).
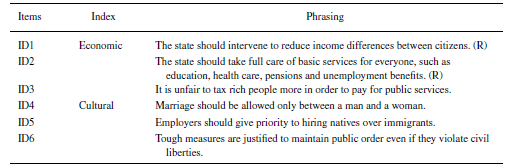
Note: The correlations (Pearson's r coefficients) between the general left−right scale and the economic and cultural dimensions are r = 0.293*** and r = 0.414***, respectively. The economic and cultural indices correlate weakly with a Pearson's correlation coefficient r = 0.159***. ID1 and ID2 have been reversed (R) so that all higher values correspond to more conservative/right-wing cultural positions and more liberal/right-wing economic positions.
Knowing that technocratic attitudes are a representational challenge to pluralist democracy, what follows addresses the question of whether they also pose an ideological challenge. This is done by comparing the distribution of the technocratic class to that of the party-democratic class of citizens. The more different they are, the stronger the ideological challenge. Such a finding would allow us to say that technocratic attitudes are not only a representational challenge, but also an ideological one.
In addition, knowing that technocratic attitudes pose a representational challenge to populism as well, the analysis addresses the question of whether this distribution constitutes an ideological challenge to populism and in what way. This is done by comparing the distribution of the technocratic class to that of the populist class of citizens. We know that populists are distributed in a U-shaped curved on the left−right dimension. Finding that the two differ would allow us to say that the two ‘challenges’ to representative democracy oppose one another ideologically. This ideological opposition would reinforce the representational oppositions between expertise and popular will, and between elitism and people-centrism.
The empirical analysis of the ideological profile of citizens with technocratic attitudes
Technocratic attitudes and the general left−right dimension
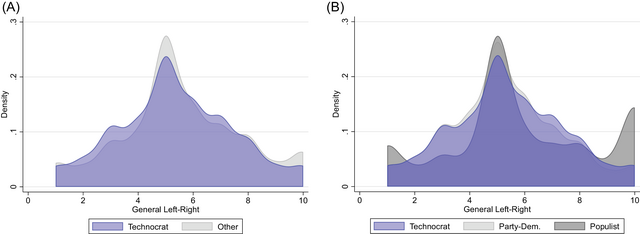
What is the ideological profile of citizens with technocratic attitudes? We first examine this question using the left−right ideological self-placement variable. Based on the density plot in Figure 1 (left panel), the technocratic class does not appear to deviate from the other respondents in its left−right ideological profile. The distribution approximates a normal distribution without any clustering at the extreme ends of the ideological scale.
Distribution of technocratic, party-democratic and populist classes across ideological spectrum [Colour figure can be viewed at wileyonlinelibrary.com]
Note: Density distribution of respondents belonging to each class by ideological left-right self-placement.

Comparing the technocratic, party-democratic and populist profiles offers a more nuanced picture of this first result. In Figure 1 (right panel), one sees that, on the one hand, the ideological profile of technocratic-minded citizens resembles that of the party-democratic class of citizens. On the other hand, it appears that the profile of the populist class is distinct, as it shows a multi-peaked distribution with respondents clustering in the middle, the extreme right and (to a lesser extent) the extreme left end of the scale. Therefore, with regard to the left−right dimension, the first descriptive evidence shows that the technocratic and the party-democratic citizens are normally distributed, as is the sample as a whole. It is the populist class that stands out, with additional peaks at the opposing ends of the left−right continuum.
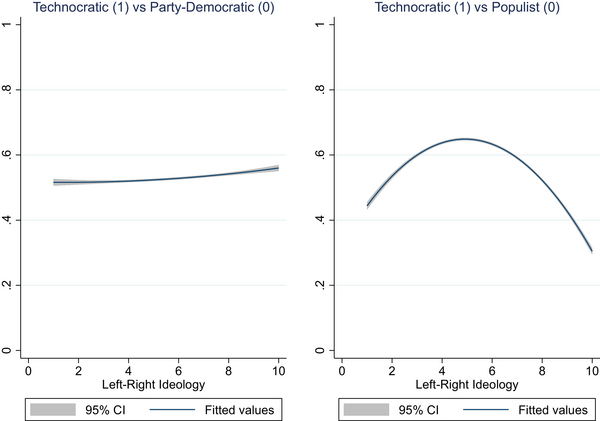
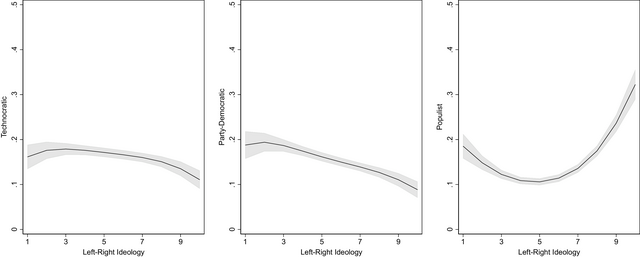
To directly compare the ideological profile of the three classes, we carry out multinomial logistic regressions using left−right ideological self-placement as an independent variable to predict class assignment, controlling for other key political characteristics that have been found to influence the propensity of holding technocratic attitudes, such as education, political trust, political interest and demographics. Figure 2 plots fitted values for the effect of left−right ideological self-placement on the probability of class assignment (for full regressions, see Table C2, Supporting Information Appendix). Figure 3 presents the predicted probabilities of assignment to the technocratic, party-democratic and populist classes, as opposed to all remaining respondents using the entire sample.Footnote 12
Effect of left−right ideological self-placement on class assignment [Colour figure can be viewed at wileyonlinelibrary.com]
Note: Plot shows the effect of ideological self-placement on the predicted probability of assignment to the technocratic class as opposed to the party-democratic (left panel) and populist class (right panel), including controls and country FE. For full multinomial regression models, see Table C2.1, Supporting Information Appendix.
Effect of left−right ideological self-placement on class assignment (1) versus all others (0) [Colour figure can be viewed at wileyonlinelibrary.com]
Note: Plot shows the effect of ideological left-right self-placement on the predicted probability of assignment to the technocratic (left panel), party-democratic (centre panel) and populist classes (right panel), as compared to all others, including controls and country FE. See Appendix 3 in the Supporting Information Appendix for more information on multinomial regression models.

These analyses confirm the above descriptive finding. The technocratic (and the party-democratic) citizen profiles are distinct from the populist profile in terms of left−right ideology. When looking at the left−right ideological self-placement of citizens with technocratic attitudes, one sees that they occupy the middle ground of the scale and avoid the extremes. Self-placement on the left−right axis does not help to differentiate the technocratic class from the party-democratic class. Neither the main nor the squared terms for ideological self-placement is statistically significant in the regression model that predicts assignment to the technocratic as opposed to the party-democratic class (see Table C2, Supporting Information Appendix). The technocratic and party-democratic class are highly similar, distinguishable not by their ideological preferences on general left−right but by their levels of political trust and education. As pointed out in previous analyses (Bertsou & Caramani, Reference Bertsou and Caramani2022), higher education is associated with the technocratic class, while political trust is lower when comparing the technocratic to the party-democratic class (but higher compared to the populist class).
Plotting the effect of ideological self-placement on the predicted probability of assignment to the technocratic as opposed to the party-democratic class produces a rather flat line (Figure 2, left panel). This is true when comparing citizens with technocratic attitudes to the general sample as well (Figure 3, left panel). This suggests that respondents’ self-placement on the left−right scale does not contain a great deal of information about their likelihood of holding technocratic attitudes, beyond the fact that they are not clustered at the ends of the left−right spectrum.
However, comparing the technocratic to the populist class presents a very different picture. Citizens with technocratic attitudes differ from those with populist attitudes on their ideological self-placement. We find that both the linear and squared left−right variables have a statistically significant effect in predicting assignment to the technocratic as opposed to the populist class (see Table C2, Supporting Information Appendix). The right panel of Figure 3 indicates that this effect is due to the large share of the populist class that clusters around the extremes of the ideological space, especially the extreme right. For this reason, the probability of belonging to the technocratic relative to the populist class shows a curvilinear effect (Figure 2, right panel). Holding all other variables at observed values, moving one's self-placement on the left−right axis from 1 to 3 increases the probability of assignment to the technocratic class from 44 to 60 per cent, while shifting from 7 to 9 lowers the probability from 59 to 43 per cent.
We therefore note that, using self-placement on the single left−right ideological spectrum, citizens with technocratic attitudes are normally distributed and cannot be distinguished from citizens with party-democratic attitudes. This seems to contradict previous findings that citizens are more likely to be assigned to the technocratic class if they are right leaning (Bertsou & Caramani, Reference Bertsou and Caramani2022; Bertsou & Pastorella, Reference Bertsou and Pastorella2017; Chiru & Enyedi, Reference Chiru and Enyedi2021). The technocratic class's normal distribution suggests a low level of heterogeneity among the class and can be taken as evidence in favour of the moderation hypothesis. Citizens with technocratic attitudes gravitate around centrist ideological positions. Nevertheless, they are not more centrist than the general sample, and the small curvilinear effect observed in Figure 3 is driven by the presence of citizens with populist attitudes clustering at the extreme ends of the scale. We therefore do not find evidence in favour of the first hypothesis that technocratic citizens are more centrist than the general sample.
A clear finding is that technocratic-minded citizens are distinct from respondents with strong (or moderate) populist attitudes. The populist class displays a multi-peaked distribution on the left−right scale, with a sizeable number of respondents placing themselves at the extremes of the ideological spectrum (albeit to a lesser degree on the left). It is important to highlight this contrast, since the technocratic and populist challenges to party-based representative democracy are often discussed in unison. The empirical evidence in this section shows that many citizens who espouse these two different visions of representation also occupy different places in the ideological space and would therefore articulate different programmatic demands. While both pose a representational challenge, it is the populist voters who also pose an ideological one, whereas this is not the case for voters with technocratic attitudes.
Technocratic attitudes in the two-dimensional ideological space
The limited predictive power of the general left−right dimension in differentiating between the technocratic and party-democratic class of citizens warrants further exploration of their ideological preferences. Moreover, the difference in the ideological profiles of technocratic and populist citizens raises the question of what specific policy demands drive this contrast. Given the increasing evidence of multidimensionality in today's politics, as discussed in the theoretical section of this paper, we are interested in better understanding what programmatic demands, if any, technocratic-minded citizens share, and how these contrast to populist and party-democratic citizens. With the emergence of an ideological divide over cultural issues, which either overlaps or cuts across existing economic divisions, mass and elite preferences have become more complex.
In this step of the analysis, we unpack the evidence for the economic and cultural dimensions. Both dimensions are measured on a 0−10 point scale, where higher values signal greater preference for economically neo-liberal and capitalist principles (less state intervention, provision of services and redistribution) and for culturally conservative and authoritarian values (more support for public order, traditional family values, preference for native over migrant citizens). Figure 4 shows the mean scores of the technocratic, populist and party-democratic profiles on the two dimensions and their deviation from the overall sample mean. This evidence clarifies how the initial differences in the results compare to the preceding analyses of respondents’ self-placement on the left−right ideological spectrum.
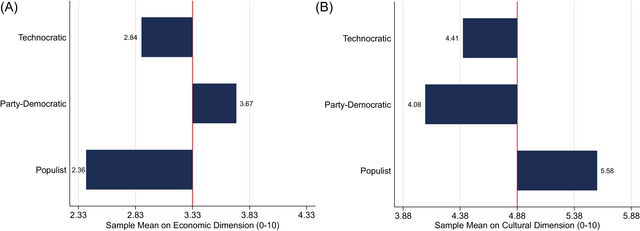
Deviation from sample mean of technocratic, party democratic and populist class on economic and cultural dimensions (0−10) [Colour figure can be viewed at wileyonlinelibrary.com]
Note: Differences in means are statistically significant between the technocratic and party-democratic class (t = −11.2, p < 0.001 for economic dimension; t = 3.8, p < 0.001 for cultural dimension), and between the technocratic and populist class (t = 5.8, p < 0.001 for economic dimension; t = −11.3, p < 0.001 for cultural dimension).

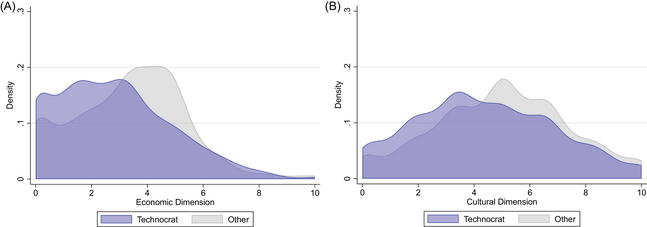
Both on the economic and on the cultural dimension, technocratic citizens are more left leaning than the general sample. Comparing the density distributions of the overall sample and the technocratic profile in Figure 5, it appears that citizens with technocratic attitudes are more left-wing on economic issues than the overall electorate. The entire sample for the nine Western democracies holds rather left-wing economic views. It is therefore surprising to see that those who fall in the technocratic class are even more left-wing than the general sample, and even more so than those who hold party-democratic attitudes (Figure 6). While in recent decades technocracy has been associated with neo-liberal right-wing economic policies and pro-market interventions, this does not seem to be reflected consistently across the electorates studied here. These differences are less pronounced on cultural issues. Again, we see that the respondents belonging to the technocratic class tend to occupy culturally liberal positions to a larger extent, and culturally conservative positions to a lesser extent, than the remaining respondents.
Distribution of technocratic class and remaining sample across economic and cultural dimensions [Colour figure can be viewed at wileyonlinelibrary.com]
Note: Density distribution of respondents belonging to each class by ideological score on economic and cultural scales.
Location of technocratic, party-democratic and populist classes in a two-dimensional space [Colour figure can be viewed at wileyonlinelibrary.com]
Note: Heat map of respondents belonging to each class by ideological location in a two-dimensional space, defined by their position on economic and cultural scales (x- and y-axis, respectively). Higher scores represent more right-wing, conservative attitudes. Darker shades correspond to more populated spaces.
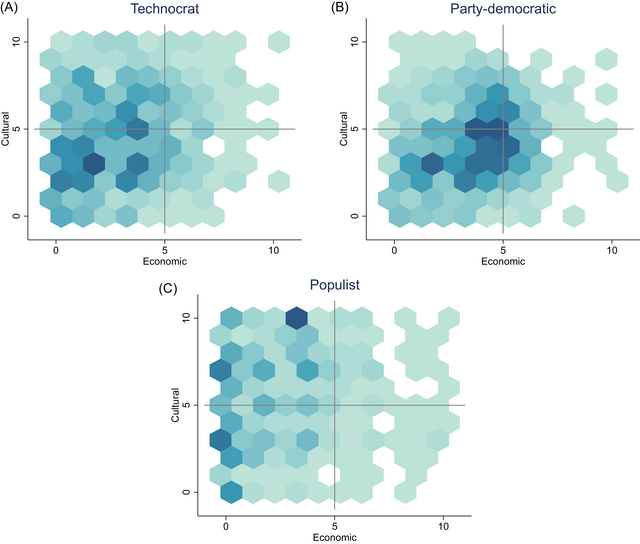
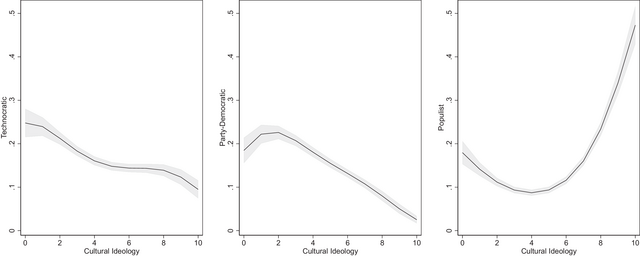
Using the economic and cultural scales, we can explore the distribution of respondents in the two-dimensional space. The heat maps in Figure 6 show how citizens in the technocratic, party-democratic and populist classes map onto this space. Darker shades correspond to more populated spaces. Technocratic citizens tend to cluster in the middle of the quadrant that represents economically left-wing and culturally liberal positions. They differ slightly from citizens in the party-democratic class, who are closer to the midpoint on both scales. Looking at the heat map of the populist class, we see that the right-wing effect on populist class assignment, found in the preceding analysis using left−right ideological self-placement, is driven by the cultural dimension, while the effect on the left-end of the spectrum is driven by the economic dimension. In our study, the populist class exhibits predominantly left-wing economic views and right-wing cultural views. This is in line with existing research on the relevance of the left-authoritarian quadrant of the multidimensional space, which is increasingly pursued by populist radical right parties (Hillen & Steiner, Reference Hillen and Steiner2020; Van der Brug & Van Spanje, Reference Van der Brug and Van Spanje2009). In addition, there is an economically left and culturally progressive cluster, which corresponds to the left-populists in Southern Europe. Heat maps for each country under study confirm this picture (see Figure D7, Supporting Information Appendix). The comparative analysis also shows that the main differences across countries are to be found in the number of technocratic citizens, rather than their position in the ideological space. The only exceptions are France and, to a lesser extent, Australia, where technocratic citizens are not as culturally liberal as in other countries (where the distribution resembles a normal distribution).
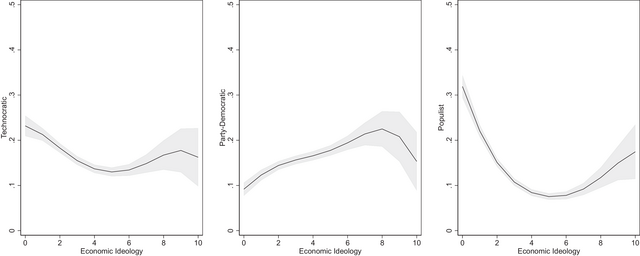
Breaking down ideological preferences to the economic and cultural dimensions helps to distinguish the technocratic class from the party-democratic class and the remaining sample in a more informative way than when solely relying on left−right placement. As before, we calculate multinomial regression models with class assignment as the predicted variable to test how individual economic ideology influences the probability of belonging to the technocratic class, as opposed to other classes, controlling for political interest, trust and key demographics (for full regression results, see Tables C3-C4, Online Appendix). Two observations stand out in this regard.
First, it is possible to better separate the technocratic from the party-democratic citizens when examining economic views. On average, the former are more leftist than the latter (see Figure 7, left two panels), which helps to explain the discrepancy of the overall result above about the left-leaning positioning of technocratic citizens compared to party democratic ones based on the aggregated left−right scale. A one-unit shift to the right on the economic scale increases the odds of belonging to the party-democratic as opposed to the technocratic class.Footnote 13 In most countries under study, we also find a significant effect for the squared term, driven by the differences in the middle part of the economic scale, where respondents of the party-democratic class tend to cluster. Indeed, when plotting the effect of economic ideology on the probability of belonging to the technocratic as opposed to the party-democratic class, we find a U-shaped curve (see Figure C3, Supporting Information Appendix).
Effect of economic dimension position on class assignment (1) versus all others (0)
Note: Plot shows the effect of position on the economic scale on the predicted probability of assignment to the technocratic (left panel), party-democratic (centre panel) and populist (right panel) classes, as compared to all others, including controls and country FE. See Appendix 3 in the Supporting Information Appendix for more information on multinomial regression models.

Second, the economic dimension also helps to distinguish the technocratic from the populist class, in line with the earlier analysis. Although populist citizens register on average more left-wing economic views than technocratic citizens, the linear effect is not significant at standard levels of statistical significance.Footnote 14 However, we do find the squared term to be significant, with more centrist scores on the economic scale increasing the likelihood of being assigned to the technocratic as opposed to the populist class (see Figure C4, Supporting Information Appendix). This effect is particularly driven by the U-shaped curve that describes the probability of belonging to the populist class, as opposed to the remaining total sample of respondents (Figure 7, see right panel).
Therefore, on the economic dimension, one detects a more left-leaning technocratic class, compared both to the general sample and to those citizens who hold party-democratic attitudes. This evidence contradicts our expectation formulated in Hypothesis 2, which postulated technocratic citizens would be more likely to hold liberal economic (right-wing) views compared to others.
In every country under study, it appears that the technocratic vision of political representation is combined with an important role for the state, the provision of public services and government intervention to correct inequality (see Figure D5, Supporting Information Appendix). In our analysis, even Greece and Italy – two countries that have had direct experience of technocratic interventions in recent years – show a significant linear effect, with more leftist economic positions leading to a higher probability of being assigned to the technocratic as opposed to the party democratic class (see Table D3.1, Supporting Information Appendix). In spite of austerity packages imposed by the technocratic institutions of the European Central Bank and European Commission, we find that technocratic attitudes among citizens are not in line with these policy programmes and that those individuals tend to occupy a more leftist position on the economic dimension of ideology than mainstream voters.
Moving on to the cultural dimension, while differences do exist between the various classes, this dimension is first and foremost the domain of the populist voters (see Figure 8). Not all respondents who belong to the populist class hold culturally conservative views, but they tend to populate the strongly conservative part of the ideological space, setting them apart from the other two classes (and the remaining sample of respondents). Indeed, on average, the technocratic class is more liberal than the populist class.Footnote 15 Figure 8 shows a strong increase in the likelihood of assignment to the populist class, and a large drop in the probability of holding technocratic or party-democratic attitudes, as one moves toward the conservative end of the cultural scale (controlling for demographics, trust and political interest). The probability of belonging to the technocratic as opposed to the populist class is above 50 per cent in the left and middle parts of the cultural scale, but decreases sharply as one moves toward the conservative end. Going from a position of 7 to 8 on the 0–10 scale reduces the probability of assignment to the technocratic as opposed to the populist class from 48 to 38 per cent. In our comparative analysis we find this pattern to hold for every country under study, with a large and statistically significant linear and squared term for the cultural dimension, confirming the findings above (see Appendix 4 in the Supporting Information Appendix). Overall, then, we find evidence in favour of H3, as more left-progressive (left-wing) positions on the cultural dimension increase the likelihood of being a member of the technocratic class as opposed to other classes.
Effect of cultural dimension position on class assignment (1) versus all others (0)
Note: Plot shows the effect of position on the cultural scale on the predicted probability of assignment to the technocratic (left panel), party-democratic (centre panel) and populist (right panel) classes, as compared to all others, including controls and country FE. See Appendix 3 in the Supporting Information Appendix for more information on multinomial regression models.
Differences between the technocratic and party-democratic classes are smaller. Multinomial logistic regressions, which compare the two classes for the pooled sample of nine countries, show a statistically significant effect of cultural positions on class assignment. This is driven mainly by differences on the right end of the scale, where respondents are more likely to belong to the technocratic as opposed to the party-democratic class (Figure 8, left panel). Nevertheless, these results are only present in France, the UK, the Netherlands and, to a lesser extent, the US. This finding goes in the direction of previous research showing that, in some cases, authoritarianism can be associated with greater support for technocratic rule (Chiru & Enyedi, Reference Chiru and Enyedi2021) and for non-political leaders (Pilet et al., Reference Pilet, Vittori, Rojon and Paulis2023). Overall, there is a limited number of observations on the right end of the cultural scale, both for the technocratic and the party-democratic class (for full comparative analyses, see Appendix 4 in the Supporting Information Appendix).
Conclusion: Technocratic voters and party competition
Both technocratic and populist visions of society pose a representational challenge to modern democracy. Both contest its core elements of pluralist competition between societal interests through electoral procedures and partisan actors. The former bases the challenge on the superior knowledge of an elite to identify the true interest of society; the latter on the will of the people. Part of this representational challenge entails an anti-ideological component. Ideology pollutes what should be the evident interest (in the case of technocracy) or sovereign will (in the case of populism) of the whole of society. Ideology implies choice where there should be none. Both are thus alternative forms of representation to party democracy.
Yet, no society is immune to ideology and no regime, institution or actor can claim pure impartiality and avoid choice. Nor can individuals, from citizens to politicians or experts, be purely neutral or objective. Ideology is a multidimensional and complex interpretation of society and a project for change. It involves a narrative of the world, the identification of problems, and a plan about how to navigate corrections – such as liberalism, nationalism and socialism, among others. In the process of democratization and the structuring of party systems, the left−right axis imposed itself as the main ideological dimension. The anti-ideological claims coming from technocratic and populist actors and citizens are therefore illusory.
There is no question of whether or not voters with technocratic attitudes have ideological preferences. Rather, the questions are, first, what are the ideological profiles of technocratic and populist groups, and, second, do these profiles pose an ‘ideological’, in addition to a ‘representational’, challenge to the electorate and party system as a whole and, specifically, to the part of the electorate that identifies with representative democracy? We know from previous research that populist leaders pose an ideological challenge through their right-wing and left-wing radicalism. Indeed, it has been argued that populism is responsible for the re-politicization of systems that, through market, welfare, and supra-national integration (in Europe), had been de-politicized. Populist attitudes, as seen above, are much more left than mainstream voters on the economic dimension and much more right on the cultural one.
How do results about the technocratic class of citizens relate to this pattern? On the one hand, by being more economically left than party-democratic citizens, technocratic-minded voters join populist ones, albeit in a more moderate fashion. This is a rather surprising result that contrasts some of the existing research. It neither supports the intuition that the economic dimension is the realm of more pragmatism, nor the alternative, currently popular, assumption that technocracy at the level of citizens is associated with free-market capitalist and neoliberal views. On the contrary, we find that in most countries in our study citizens with technocratic attitudes believe in the benefits of a stronger state with the capacity to redistribute, correct inequalities and provide social services. At the same time, by being more culturally left and moderate than populist citizens, technocratic-minded voters join party-democratic ones. In this regard, they counter the populists’ extreme ideology.
This finding points to a chance for left-wing actors to attract technocratic-minded citizens, who were long assumed to have economically right-wing positions. Overall, citizens with technocratic attitudes, which in the nine country samples range from 12 to 22 per cent of the electorate, display ideological features that make them interesting for both mainstream and populist parties of the left. There is a substantial segment of the electorate, therefore, that seems sensitive to arguments in favour of a greater role of expertise and competence, and available to such a type of mobilization. It is interesting to note that voters with populist attitudes to a large extent share these preferences and populist parties, in the absence of technocratic rivals even remotely able to challenge them (La république en marche, founded by French President Macron, being probably the closest case of a ‘technocratic party’), have understood this. As the LCA shows, there is no populism without expertise and the normative literature accordingly has developed the concepts of ‘technocratic populism’ and ‘technopopulism’ (Bickerton & Invernizzi Accetti, Reference Bickerton and Invernizzi Accetti2021; de la Torre, Reference De la Torre2013).
Our findings can be linked in two ways to the dynamics of electoral competition. First, they show that claims about de-politicization and objectivity can be used as discursive instruments in combination with different ideological stances. The ubiquity of such claims, combined with the capture of expertise and competence by populist actors, makes it unlikely that electoral competition will take place along a technocracy-populism dimension. Actors from different ideological positions will, on the contrary, all use this blend of objectivity, neutrality and competence, on the one hand, and inclusion and responsiveness to the electorate, on the other. Electoral competition may be driven by perceptions of elite competence, but these perceptions will not lead to a stable dimension that cuts across or aligns with dimensions in the ideological space. Second, stronger demands for de-politicization, neutrality and expertise can have the effect of moderating electoral competition, reducing the strong polarization between parties and voter groups. Independent from technocratic citizens’ ideological orientation, their positions are moderate, oriented toward solutions and output, and reform rather than radical change. While giving some welcome respite to the current polarized political debate, ideological moderation, convergence and centrism can also have the effect of reducing the clarity of electoral choice, reigniting preoccupations about the cartelization of party politics.
Our results, finally, also have implications for debates around the reform of representative institutions, as witnessed in recent democratic experiments with citizens’ assemblies at the local and supra-national level. Democratic experiments—such as the Irish Citizens’ Assembly, the Convention citoyenne pour le climat in France, the Ostbelgien Modell in the German-speaking Belgian Community, and supra-nationally with the Conference on the Future of Europe, the Global Citizens’ Assembly on Genome Editing and the Global Assembly for the COP26 climate conference – have given a prominent role to experts in guiding citizens’ deliberations and placed strong value on the non-ideological nature of such deliberations. This adds to the representational challenge that technocratic attitudes pose to representative democracy, especially if it is supported across a variety of ideological positions. This further undermines a representative system that is seemingly unable or unwilling to bridge demands for responsiveness with demands for long-term, expert-driven and output-oriented policies.
Acknowledgements
This study received financial support from the European Governance and Politics Programme at the Robert Schuman Centre for Advanced Studies, European University Institute. Jelle Koedam acknowledges funding from the Swiss National Science Foundation (SNF Ambizione Grant, No. 216463). We would like to thank Despina Alexiadou, Pablo Fernández-Vázquez, Silja Häusermann, Jae-Jae Spoon, Delia Zollinger, and participants at the 2022 workshops “ReThink Europe: The Rising Challenges of Populism and Technocracy,” organized by the European Studies Center at the University of Pittsburgh, and “Cleavage Formation in the 21st century,” organized at the University of Zurich.
Open access funding provided by University of St Gallen.
Online Appendix
Additional supporting information may be found in the Online Appendix section at the end of the article:


 Open access