


Introduction
Power outages, characterized by a loss of electrical power supply to end users, are not only inconvenient but can also pose risks to health and well-being. Respiratory diseases, for example, have been shown to increase during power outages. Without electricity, people lose access to electronically dependent medical equipment, including breathing assistance devices such as ventilators, nebulizers, and oxygen compressors.Reference Dominianni, Lane and Johnson1-Reference Prezant, Clair and Belyaev4 During the 2003 Northeast Blackout, hospital admissions for respiratory diagnoses were more than 3 times higher than on comparable days with electricity.Reference Lin, Fletcher and Luo2 Similarly, in New York from 2001 to 2013, the rate of hospitalizations for chronic obstructive pulmonary disease increased by 30% on the day of a power outage and 40% on the day after an outage.Reference Zhang, Sheridan and Birkhead3 In addition to exacerbating respiratory illnesses, power outages may hinder the management of chronic diseases by temporarily closing pharmacies, primary care offices, and dialysis centers.Reference Anderson and Bell5, Reference Abir, Jan and Jubelt6
Beyond chronic diseases, power outages have been linked to increased risk of unintentional injuries.Reference Anderson and Bell5, Reference Marx, Rodriguez and Greenko7 The 2003 Northeast Blackout was associated with an increase in accidental deaths.Reference Anderson and Bell5 Power outages are associated with increased carbon monoxide poisoning and deaths, often caused by improper portable generator use.Reference Anderson and Bell5, Reference Johnson-Arbor, Quental and Li8, Reference Stoppacher, Yancon and Jumbelic9 Lack of electricity may lead to a rise in other unintentional injuries, including falls and motor vehicle crashes.Reference Kile, Skowronski and Miller10, Reference Northrop, Flores and Do11
The California Public Utilities Commission (CPUC) authorizes utility companies to de-energize or turn off power to their lines to prevent wildfires in events called Public Safety Power Shutoffs (PSPS).12, 13 Interventions to prevent electric utility infrastructure from sparking wildfires are well justified, as many deadly wildfires have been ignited by power lines.14, 15 Additionally, wildfires ignited by power lines occur during more extreme fire weather conditionsReference Mitchell16, Reference Miller, Plucinski and Sullivan17 and burn a disproportionately high amount of acreage compared to other ignition sources.Reference Harding, Tarr and Ramirez18
While PSPS are a potentially powerful intervention intended to prevent wildfires by de-energizing power lines and eliminating sparks, the collateral consequences of these intentional power outages have not been established. As utility companies are required to notify customers and mitigate the effects of PSPS to the greatest extent feasible,12 it is possible that PSPS events are not associated with the adverse public health effects of other power outages. However, CPUC found that utility companies failed to notify some customers and safety partners before de-energization during the fall of 2019.19 Additionally, notifications may not be enough to prevent the public health consequences of PSPS events, particularly for vulnerable populations. The objective of this study was to assess the association between the use of PSPS and rates of emergency department visits.
Methods
Design and Setting
This study employed an ecological study design to examine the association between PSPS and the daily rate of emergency department visits in California during the fall of 2019. This time frame was chosen to encompass numerous large PSPS events that affected more than two million utility customers.19 The analysis examined the rate of emergency department encounters in counties in California on each day between September 15th and November 30th, 2019. The analysis removed 2 counties that did not have emergency departments and thus had no emergency department visits, resulting in 56 of the 58 counties in California and 4,312 county-day observations included in our analysis. County-day, the unit of analysis of this study, reflects a county on a given day.
Variables
Public Safety Power Shutoff metrics
Methods used to quantify a county’s daily exposure to PSPS events have been described previously.Reference Harding, Tarr and Berman20 Briefly, county-level PSPS exposure was quantified using 2 different metrics: customer-day, which incorporates the number of customers affected by the outage and hours in the day the outage lasted, and the percent household-day, which incorporates the percentage of households in the county affected by the outage and the hours in the day the outage lasted. These metrics were derived from the CPUC PSPS dataset,13 which records de-energized circuits during PSPS events, and circuit maps from multiple utility companies.21–23
To create the customer-day metric, we first mapped the circuits that were de-energized during PSPS events to the counties in which they were located. We then split the outage-level observation into days to determine the proportion of a day that the circuit was without power. We multiplied this proportion by the number of affected customers on the circuit to create a circuit-level customer-day metric, combining the number of customers affected and the duration of the outage into a single metric. Finally, we aggregated the data from the circuit level to the county level by summing all the circuit-level customer-day metrics within a county for each county-day. This created our final customer-day metric, which represents the number of customers in a county without power for the full 24 hours of a day. The percent household-day metric was constructed similarly to the customer-day metric, but calculated the percentage of households in the county that were without power for the full 24 hours of the day. We created quartiles of PSPS exposure based on both the customer-day metric and the percent household-day metric, and compared these quartiles to county-days with no PSPS in the analysis.
Emergency department visits
Emergency department data were obtained from the California Department of Health Care Access and Information24 for all emergency department visits in California between September 15th and November 30th, 2019. Additionally, patient discharge data for patients admitted to the hospital through an emergency room during the study time frame were also used. Emergency department and patient discharge data included the date of the emergency department encounter, county of the emergency department, patient’s age, and diagnoses. The number of emergency department visits in a county on a given day was aggregated and divided by the 2019 county population25 and multiplied by 100,000 to obtain a rate per 100,000 population.
To obtain diagnosis-specific rates, rates of emergency department visits were estimated for encounters with a principal or other diagnosis of respiratory illness (ICD-10 J00-J99), cardiovascular disease (I00-I99), injuries (S00-S99, T07, T14), and mental or behavioral disorders (F01-F99). To investigate vulnerability across age groups, a subgroup analysis was conducted for emergency department visits among children less than five years of age (“young children”) and adults aged 65 and older (“older adults”).
Statistical Methods
The rate of emergency department encounters per 100,000 county residents was modeled using linear mixed models with a random intercept for the county and the primary exposure of PSPS quartile, controlling for daily maximum temperature (°C), the daily presence or absence of precipitation (mm) within a 5 km window of each census tract centroid, wind speed (m/s), and day of the week. Weather data was acquired from GridMetReference Abatzoglou26 using the climateRReference Johnson27 package. Two models were created for each outcome: one using the exposure metric based on the quartile of customers affected (customer-day) and the other using the exposure metric based on the quartile of households affected (percent-household-day), with a baseline exposure of no PSPS county-day events. Models quantified the association between PSPS events and (1) all emergency department encounters, (2) visits among specific age groups, and (3) visits by diagnoses. In a post-hoc analysis, lagged effects were explored to examine if impacts persisted 1 day and 2 days after a PSPS exposure. Analyses were conducted in R version 4.2.328 using the lmerTest package.Reference Kuznetsova, Brockhoff and Christensen29 This study was determined to be exempt by the University of Minnesota Institutional Review Board (STUDY00015585).
Results
Public Safety Power Shutoff Impacts
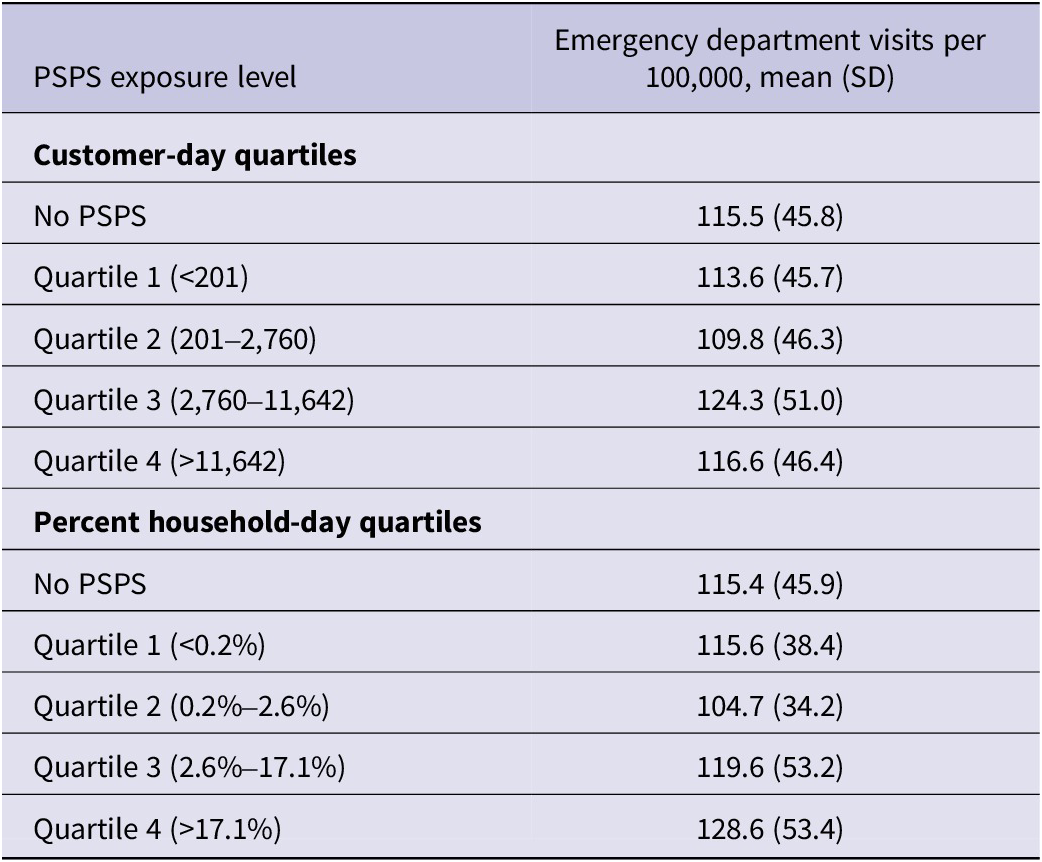
Over the 77-day study period, there were a total of 4,312 county-days across the 56 California counties that have emergency rooms. Twelve percent of county-day observations (n = 497) were affected by PSPS events. Among county-days with PSPS exposure, PSPS events affected the equivalent of 9,884 customers without power for the full day (range 0.02-119,801; median: 2,760), and the equivalent of 15.4% of households for the full day (range 0-100%, median 2.6%). For analysis, the quartile cutoff points for the customer-day and the percent household-day metrics were used to create four strata of daily county-level PSPS exposure (Table 1).
Summary of quartile splits based on customer-day and percent-household-day metrics and distribution of rates of emergency department visits per quartile

Emergency Department Visits
The average rate of emergency department visits in a county on a given day was 115.6 visits per 100,000 (range: 0-299.4, median: 106.3) for all county-days included in the analysis. Although 2 different metrics (customer-days and percent household-days) were used to quantify the level of PSPS exposure, the rates of emergency department visits per quartile follow similar patterns, decreasing in the second quartile and increasing in quartiles 3 and 4 (Table 1).
Associations between PSPS and emergency department visits
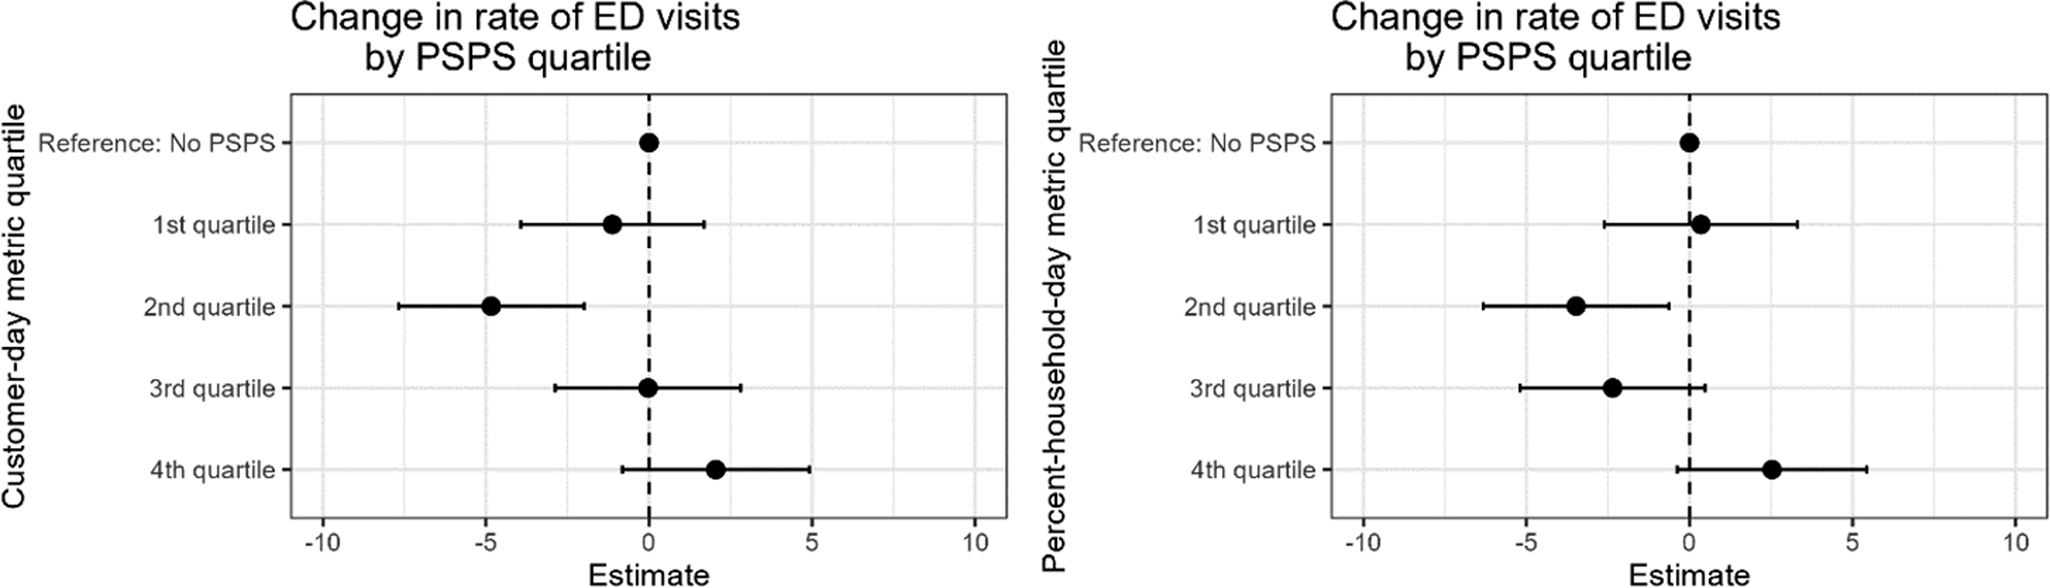
The estimated rate of emergency department visits decreased for the second quartile of PSPS impacts compared to days with no PSPS exposure in both the model based on the number of customers and the model based on the percent of households in the county affected by the outage (Figure 1, Full results in Supplemental Table S1). Both models also show an increase of 2.5 emergency department visits per 100,000 persons on days with the highest levels of PSPS exposure compared to days with no PSPS exposure, but the results were not statistically significant (P < 0.05) in either model.
Difference in rate of emergency department visits per 100,000 people for each quartile of PSPS exposure compared to days without PSPS exposure using quartiles created from the customer-day metric (left) and the percent-household-day metric (right).

Population- and diagnosis-specific emergency department visits
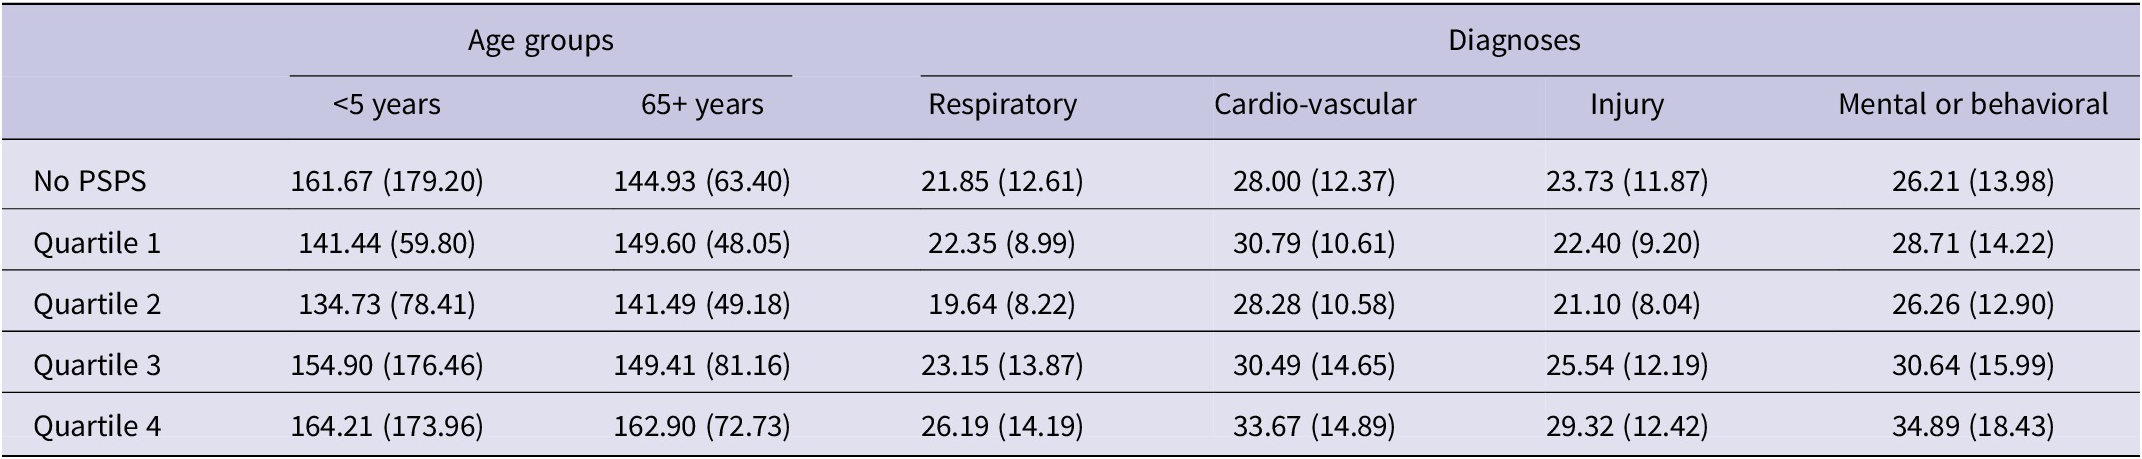
The rates of emergency department visits for specific populations and diagnoses, per PSPS quartile determined by the percent household-day metric, are presented in Table 2. The average rates of emergency department visits among young children and among older adults were both higher than the general population, at 160.24 and 145.60, respectively. The average rate of emergency department visits for specific diagnoses ranged from 21.96 for respiratory visits to 28.32 for cardiovascular visits. The rates of emergency department visits per PSPS quartile determined by the customer-day metric were similar, and are presented in Supplementary Table S2.
Distribution of population- and diagnosis-specific rates of emergency department visits (mean and SD per 100,000 people) per PSPS quartile based on the percent household-day metric

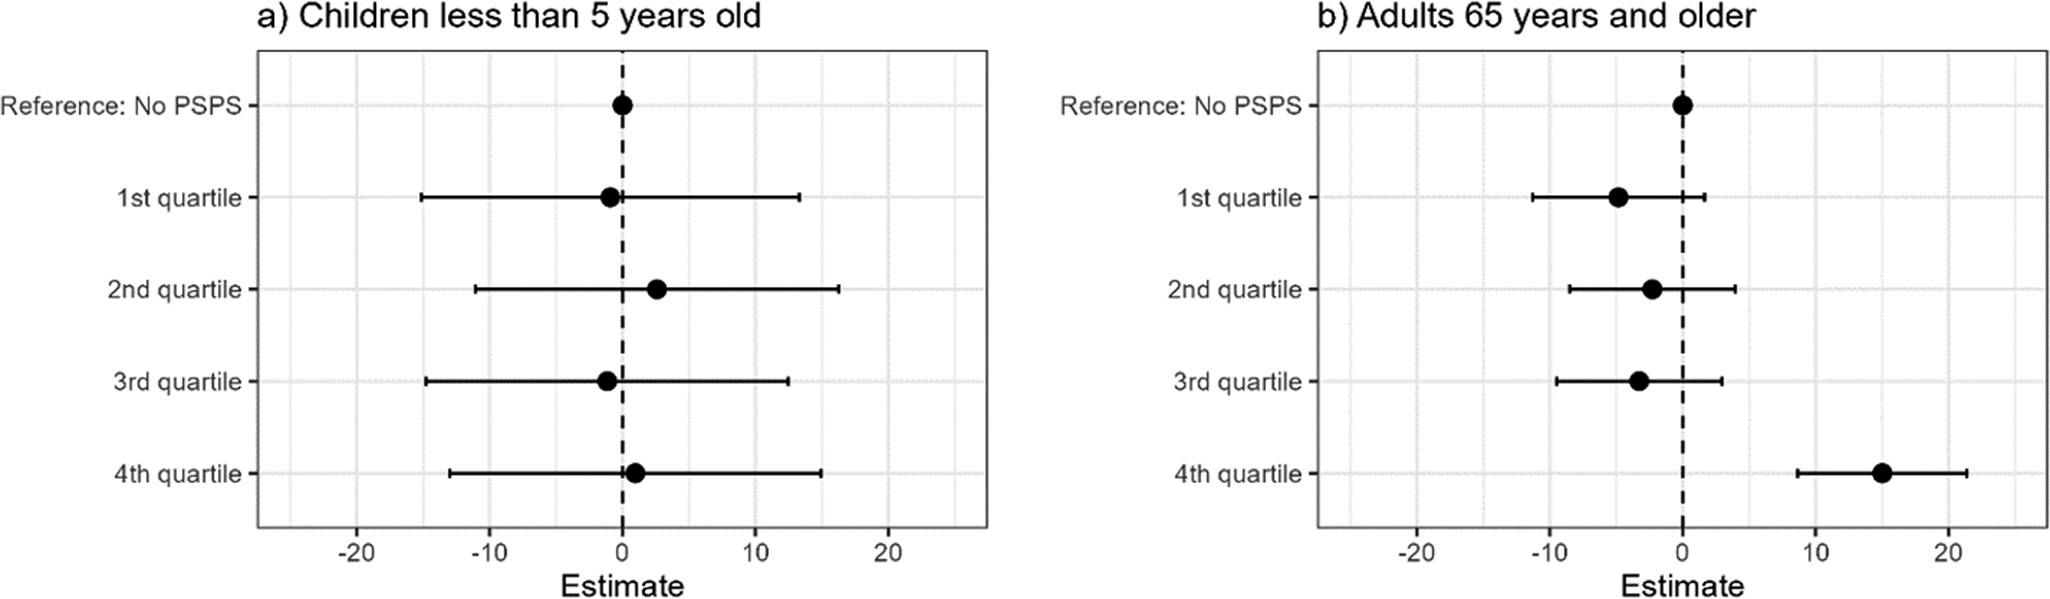
Results presented in Figures 2 and 3 reflect results using the percent household-day exposure metric PSPS quartiles. Results from models using the customer-day exposure metric were similar. While the rate of emergency department visits among young children did not change at any PSPS exposure level, the highest level of PSPS exposure was associated with an increase of 15 emergency department visits per 100,000 older adults (95% CI: 8.64, 21.39) (Figure 2).
Differences in rate of emergency department visits among (a) children under the age of 5 and (b) adults ages 65 and older for each quartile of PSPS percent household-day exposure compared to days without PSPS exposure.

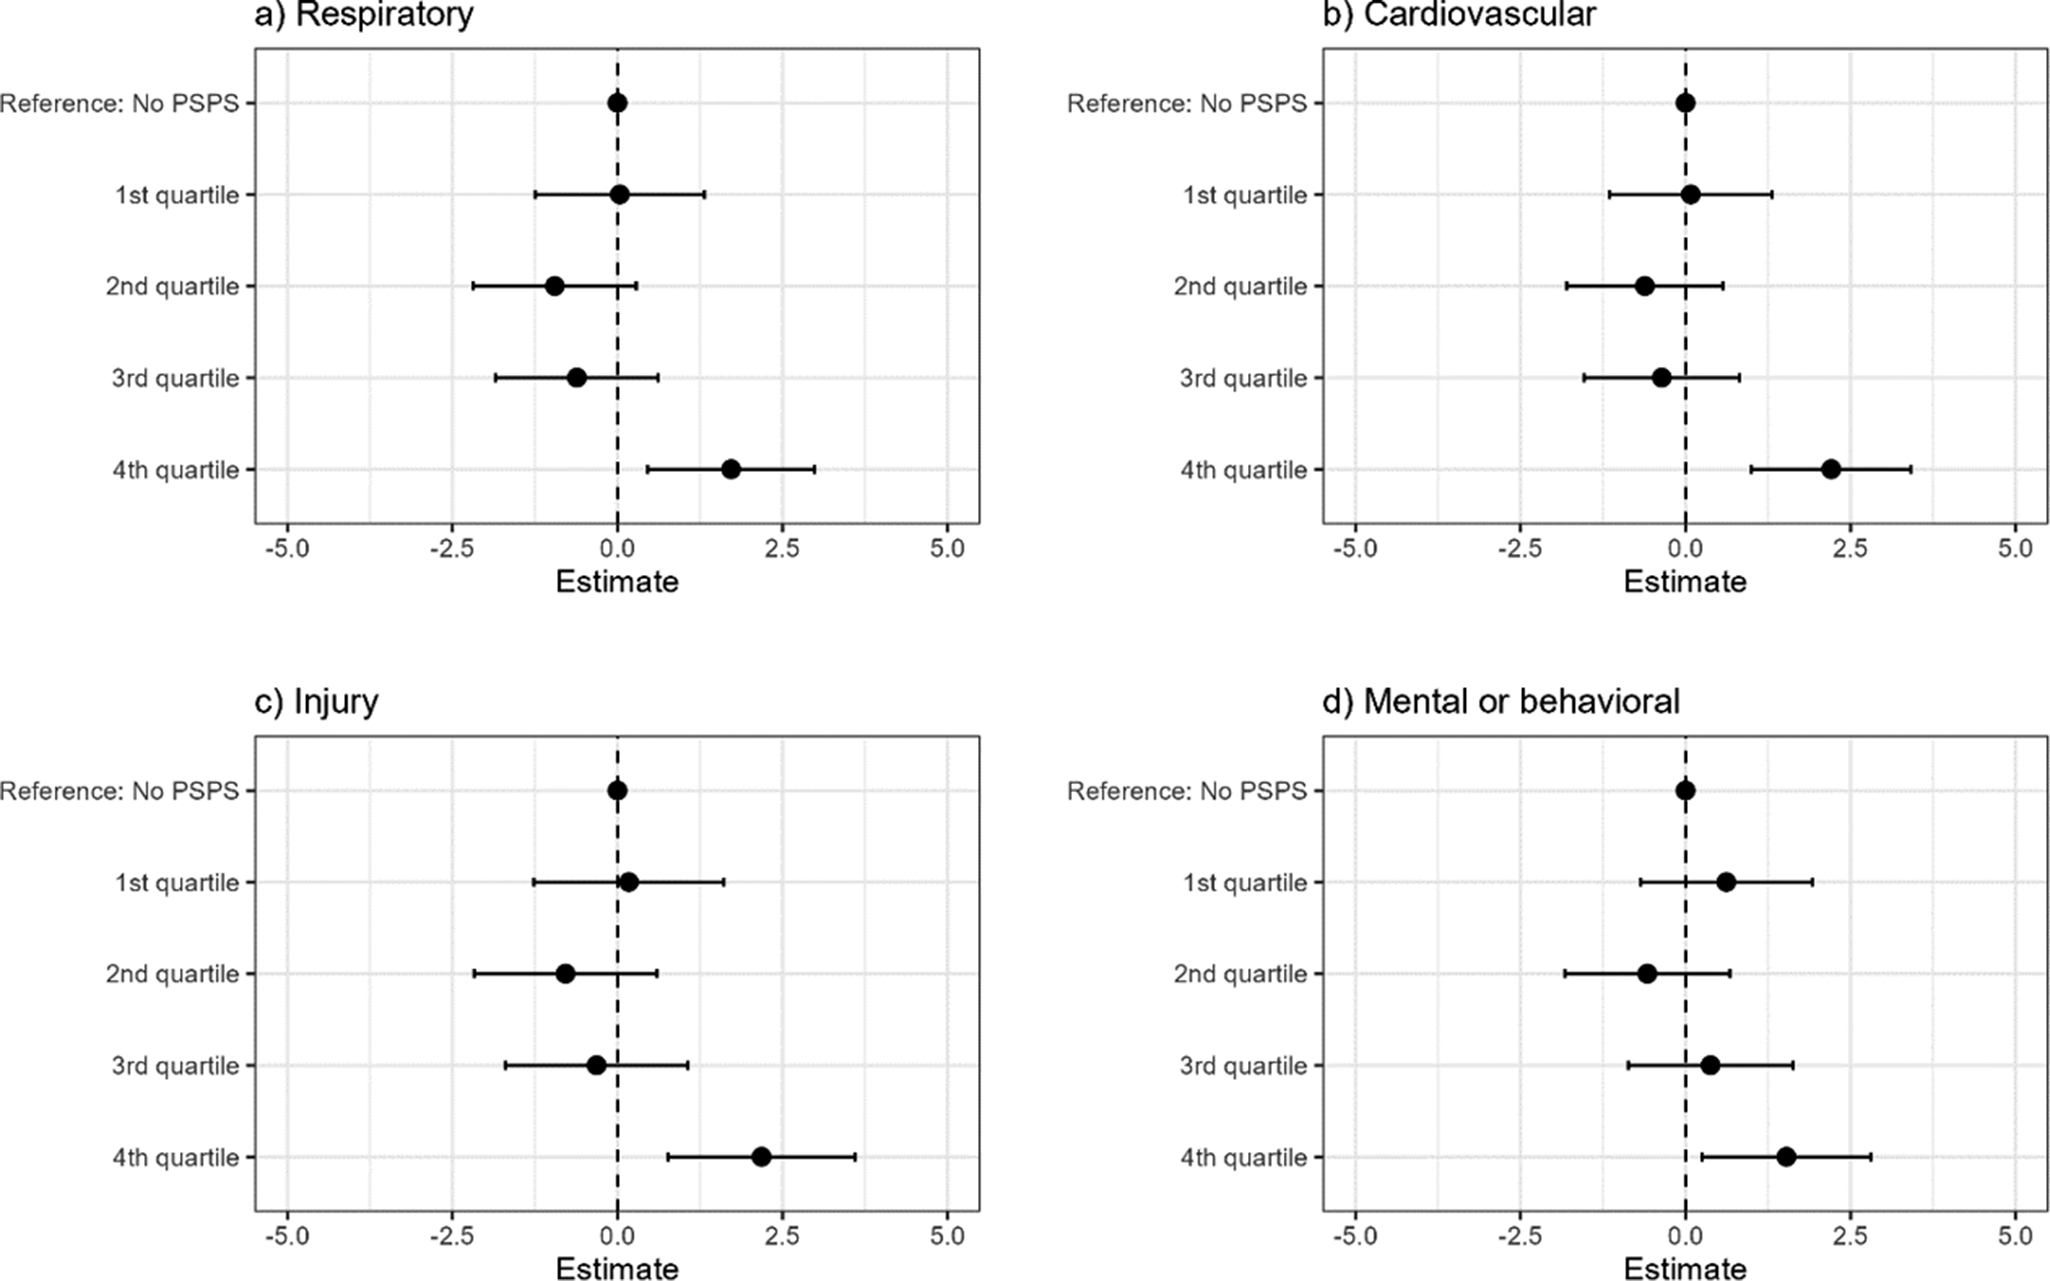
Differences in rate of emergency department visits with a (a) respiratory, (b) cardiovascular, (c) injury, and (d) mental or behavioral diagnosis for each quartile of PSPS percent household-day exposure compared to days without PSPS exposure.

Across all age groups, emergency department visits with a respiratory, cardiovascular, injury, or mental or behavioral diagnosis, the fourth quartile, or highest level of PSPS exposure, were associated with an increase of approximately 2 emergency department visits per 100,000 people (Figure 3). The first, second, and third quartiles of PSPS exposure were not associated with changes in emergency department encounters for these diagnoses.
Lagged analysis
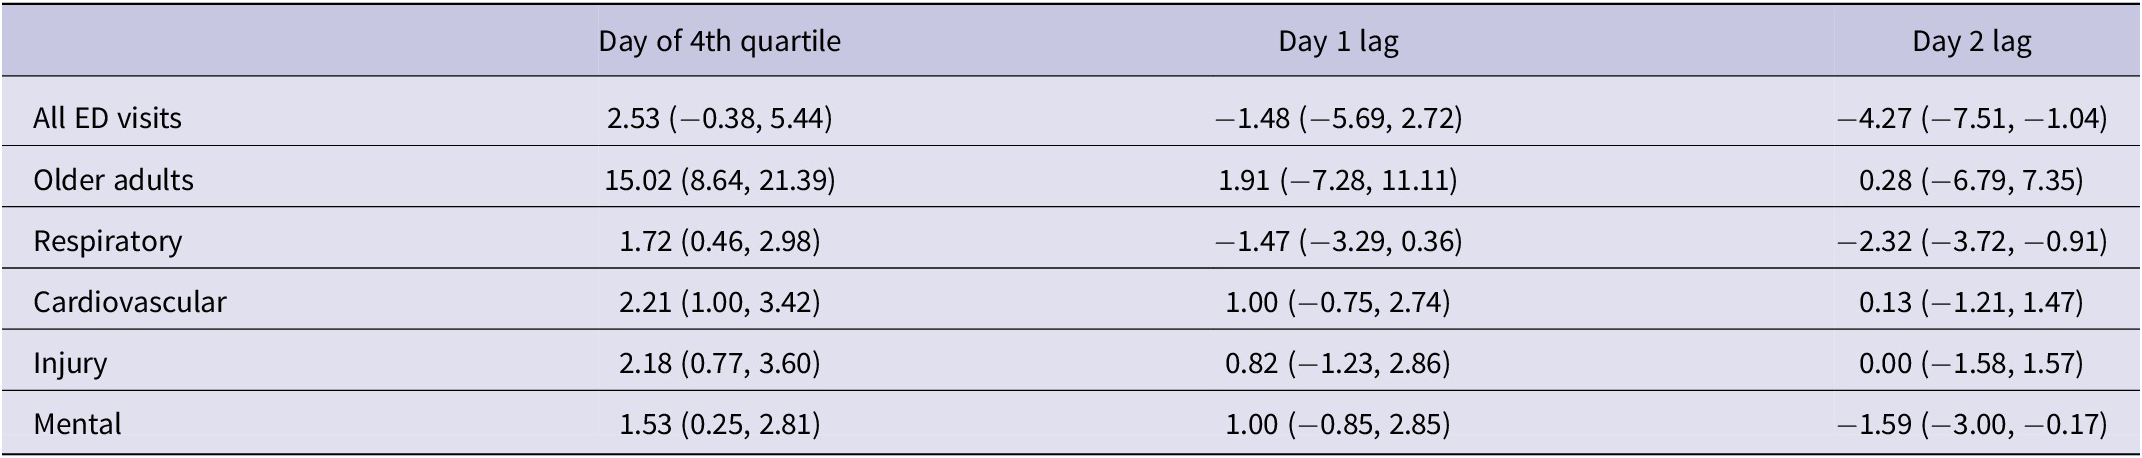
Since only the highest level of PSPS effects was associated with increases in emergency department visits across various subgroups, a lagged analysis was conducted for days following this highest, fourth quartile PSPS exposure. As 98% of days following a fourth quartile PSPS exposure were still experiencing PSPS events, PSPS exposure on the lagged day was controlled for. After controlling for PSPS exposure on a given day, a fourth quartile PSPS exposure did not affect the rate of emergency department visits 1 or 2 days later (Table 3).
Change in emergency department visits on days with a fourth quartile PSPS exposure and days following a fourth quartile PSPS exposure, compared to days following a day with no PSPS exposure, controlling for PSPS exposure on the lagged day

Limitations
This study was limited by the ecological study design, using the county-day as the unit of analysis. While ecological studies are useful for hypothesis development and when outcome data is only available at an aggregate level, results are only applicable at the unit of analysis and conclusions cannot be drawn at an individual level. Future analysis may be able to use more granular data to better classify the area impacted by the PSPS and draw conclusions specific to those individuals affected by the power outages. As this study was limited to California in the fall of 2019, results may not apply to other areas, particularly places with different health care systems. Additionally, the study did not control for active wildfires during this period, since PSPS events are intended to prevent wildfires, and therefore, are on the pathway between PSPS exposure and emergency department visits.
Discussion
While PSPS are a powerful intervention that have likely prevented wildfires,30 it is important to consider the collateral consequences and public health impacts of interventions that intentionally shut off power. Quantifying the association between PSPS events and emergency department visits supports the development of interventions and better preparation from communities, utility companies, and health care services. To the knowledge of the research team, this is the first study to examine the association between PSPS events and emergency department visits.
Emergency department visits with a respiratory, cardiovascular, injury, or mental or behavioral diagnosis all showed an increase in the fourth quartile, or highest level of PSPS exposure. There were no increases in emergency department visits for these diagnoses associated with the first, second, or third quartile PSPS impacts, suggesting that a threshold of county-level PSPS effects must be met before the county-level rates of emergency department visits related to these diagnoses increase. That is, the power shutoff must be substantial enough to affect a large portion of the county in order to affect emergency department visits. These findings were robust to exposure definition and were consistent when measuring PSPS exposure by the number of utility customers affected and by the percentage of households affected by the power outage.
Our findings are consistent with previous literature demonstrating the health effects of power outages. There is substantial evidence that power outages increase respiratory-related 911 emergency calls,Reference Prezant, Clair and Belyaev4, Reference Stoppacher, Yancon and Jumbelic9 emergency department visits,Reference Prezant, Clair and Belyaev4 and hospital admissions,Reference Zhang, Sheridan and Birkhead3, Reference Prezant, Clair and Belyaev4 primarily related to the failure of electricity-dependent durable medical equipment. Lin and colleagues found that the 2003 Northeast Blackout was associated with a two- to eightfold increase in respiratory hospital admissions in New York City, but not associated with an increase in cardiovascular admissions.Reference Lin, Fletcher and Luo2 Another study of the same power outage event found increases in respiratory and cardiac 911 calls and respiratory and trauma visits at one of the city’s largest hospitals.Reference Prezant, Clair and Belyaev4 Cardiovascular health could be affected by indoor heat and cooling failure, as extreme temperatures are associated with increased cardiovascular mortality.Reference Alahmad, Khraishah and Royé31, Reference Lee, McLean and Kuo32
Mental and behavioral health outcomes may also have been affected by cooling failures, as there is evidence of increased morbidity and mortality among persons with mental illness during hot days and heatwaves,Reference Kirby, Tetzlaff and Kidd33, Reference Meadows, Mansour and Gatto34 including increases in emergency room visits related to mental disorders.Reference Yoo, Eum and Roberts35 PSPS events themselves likely also play a role. In a survey conducted after one PSPS event, mental health was one of the most frequently raised topics in the open-ended question.Reference Brown, McGettigan and Godley36 Residents primarily reported stress due to uncertainty about the power outage, fear for safety, and concern for loved ones. While this level of stress may not rise to the level of an emergency room visit, caregivers reported individuals with dementia becoming confused and agitated, and a parent reported that the change in routine was detrimental to their child with autism.Reference Brown, McGettigan and Godley36 Power outages may exacerbate existing mental health issues by isolating individuals and eliminating important coping mechanisms. While PSPS events were not associated with a statistically significant increase in all emergency department visits, understanding what type of visits might increase due to the PSPS events is essential for preparing for future outages.
For all emergency department visits, there was evidence of a decreased rate for the second quartile of PSPS exposure in both the model based on the number of customers and the model based on the percentage of households in the county affected. This decrease may have been caused by patients avoiding the area of the PSPS event in favor of emergency departments in nearby counties unaffected by the outage. It is possible that patients may have chosen to avoid the area of the outage at these low levels of PSPS impacts, but at higher levels of PSPS with more widespread power outage coverage, patients were not able to travel to a county unaffected by the outage. Additionally, over 30% of emergency department visits are estimated to be due to non-urgent conditions.Reference Uscher-Pines, Pines and Kellermann37 Patients with non-urgent conditions may have chosen to avoid emergency departments on days of PSPS events. This decrease in non-urgent conditions may have also occurred at higher levels of PSPS exposure, but may have been offset by power outage-related emergency department visits.
While there was no change in the rate of emergency department visits among young children, older adults had 15 more emergency department encounters per 100,000 (95% CI: 8.64, 21.39) on the days a county experienced the highest level of PSPS exposure compared to days without a PSPS. The increase in emergency department visit rates among older adults during the highest county-level of PSPS exposure is consistent with previous literature demonstrating that older adults are particularly vulnerable to power outages.Reference Casey, Fukurai and Hernández38–Reference Molinari, Chen and Krishna40 Older adults are more likely to have underlying chronic conditions that may be exacerbated by power outages. Additionally, those who use electricity-dependent durable medical equipment, including oxygen and ventilators, are among the most vulnerable to power outages and tend to be older adults.Reference Molinari, Chen and Krishna40, Reference Casey, Mango and Mullendore41 In 2019, California was home to over 176,000 Medicare beneficiaries who rely on electricity-dependent durable medical and assistive equipment and devices, or essential health care services.42 Rentals of electricity-dependent durable medical equipment increased between 2008 and 2018,Reference Casey, Mango and Mullendore41 and are likely to continue to increase, as the United States population is aging. The number of Americans aged 65 or older is expected to nearly double by 2060.Reference Vespa, Medina and Armstrong43 Utility companies, health care systems, community organizations, and other stakeholders should work to mitigate the adverse health effects of PSPS events among older adults.
Conclusion
This study quantified the association between PSPS events, or intentional power outages conducted to prevent wildfires, and emergency department encounters in California during the fall of 2019. Older adults are particularly vulnerable to PSPS events, with the highest county-level impacts of PSPS associated with an additional 15 emergency department visits per 100,000 persons aged 65 and older. Although the highest level of PSPS exposure was not associated with a statistically significant increase in all emergency department encounters, visits involving a respiratory, cardiovascular, injury, or mental or behavioral diagnosis increased. While PSPS events are an important intervention for the prevention of wildfires, they must be examined comprehensively. Understanding the effect of PSPS on health and health care utilization is key to developing prevention and mitigation strategies in order to implement PSPS as safely as possible.
Supplementary material
The supplementary material for this article can be http://doi.org/10.1017/dmp.2025.10300.
Acknowledgments
This work was supported by the Midwest Center for Occupational Health and Safety Traineeship and Pilot Grant Program, funded by the National Institute for Occupational Safety and Health (NIOSH), Centers for Disease Control and Prevention, Department of Health and Human Services (T42OH008434).
Author contribution
Alyson B. Harding: Conceptualization, methodology, formal analysis, investigation, writing—original draft, writing—review and editing; Jesse D. Berman: Conceptualization, methodology, writing—review and editing; Gillian. A.M. Tarr: Conceptualization, methodology, writing—review and editing; Darin J. Erickson: Conceptualization, methodology; Marizen R. Ramirez: Conceptualization, writing—review and editing, supervision.
Funding statement
Midwest Center for Occupational Health and Safety Traineeship and Pilot Grant Program, funded by the National Institute for Occupational Safety and Health, Centers for Disease Control and Prevention, Department of Health and Human Services (T42OH008434).
Competing interests
None.


 Open access