


1. Introduction
Sakhalin is considered one of the most avalanche-prone areas of the Russian Federation, in terms of the exposure to avalanche risk of its population and infrastructure (Reference Myagkov and KanaevMyagkov and Kanaev, 1992; Reference Kazakova and LobkinaKazakova and Lobkina, 2007). A history of snow-avalanche disasters on Sakhalin and the Kuril Islands has been described in several Russian-language works (e.g. Reference Ivanov, Voitkovskii and BarabashIvanov, 1971; Reference Suchkov, Ivanov, Kato and KimSuchkov and others, 2006; Reference Kazakova and LobkinaKazakova and Lobkina, 2007). Unfortunately, they are incomplete, since each of these studies considered only Russian documents mentioning avalanches, and assumed that the period of Japanese rule (pre-1945) provided no relevant accounts or documented evidence (e.g. Reference SuchkovSuchkov, 2012). This incorrect assumption was short-sighted, in that it did not allow for a comprehensive view of a century of the islands’ avalanches, and produced a wide gap in data vital for research and hazard mitigation statistics.
After Japan’s victory in the Russo-Japanese War in 1905, the islands witnessed the establishment of Japanese rule in the southern part of Sakhalin Island (south of 50° N) and on the Kuril Islands. Since the end of the Second World War, Sakhalin and the Kuril Islands have been managed by the Soviet Union and then Russia. The complex territorial dispute continues, and falls completely outside the scope of this paper. As different countries have governed the territory, continuity of knowledge about snow-avalanche disasters is lost. To overcome this substantial deficiency, we provide here a record, as complete as possible, of snow-avalanche disasters during the past 100 years in the region, from 1910 to 2010, in order to create one continuous record. In addition to existing chronicles of avalanche disasters (e.g. Reference Schneebeli, Laternser and AmmannSchneebeli and others, 1997) and other events (e.g. Reference Laternser and SchneebeliLaternser and Schneebeli, 2002; Reference Eckert, Baya and DeschatresEckert and others, 2010a,Reference Eckert, Parent, Kies and Bayab), our case study presents unique and inadequately documented historical features, which illustrate the strong interaction between economic and social development and snow-avalanche activity. It has been suggested that newly colonized countries and territories may expose their incoming populations to a high risk from natural hazards, especially snow avalanches (e.g. Reference Irwin and OwensIrwin and Owens, 2004). However, little is known about population expansion and associated disasters, partly due to a lack of records. A reconstructed record of avalanche disasters on Sakhalin and the Kuril Islands may help to fill this gap.
Here we overcome the limitations inherent in changing government control by assimilating and analyzing information about previously unknown disasters from archival sources. Details of the incidents under the Japanese administration were found in old Japanese newspaper articles (Section 3); Russian material was collected from research publications (Reference Suchkov, Ivanov, Kato and KimSuchkov and others, 2006; Reference Kazakova and LobkinaKazakova and Lobkina, 2007; Reference Zhiruev, Okopny, Kazakov and GensiorovskiyZhiruev and others, 2010; Reference OkopnyOkopny, 2011; Reference SuchkovSuchkov, 2012), archives of the Regional Center for Avalanche Protection (RPLC, Sakhalin UGMS), personal communications and other sources. We have been unable to find any historical avalanche accounts from before 1910 in any language.
It is known that the temporal evolution of avalanche activity, risk exposure of the population and fatality rates present a complex combination of climatic, land-cover and social factors. Accordingly, since some geographical background is needed, we begin by describing the main features of the islands and the general characteristics of the avalanche regimes. Then, for a better understanding of statistical features, we provide a detailed focus on specific avalanches of the Japanese and Soviet/Russian periods. This is followed by consideration of the overall features of the statistical information assimilated from Japanese and Russian archives concerning snow avalanches, and a discussion of the main driving mechanisms of avalanche disasters in the area (e.g. colonization, deforestation and climate). Finally, we make a comparison with avalanche fatalities at Hokkaido, Japan, and make some concluding remarks.
2. General Description of the Avalanche Regime
2.1 Geography and snow-avalanche climate
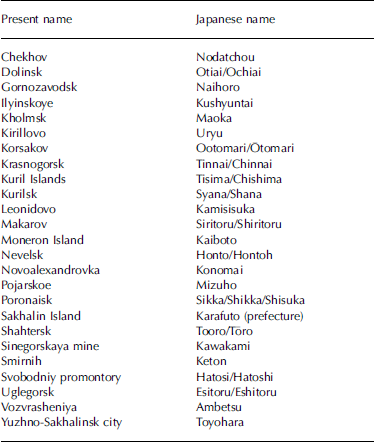
Sakhalinskaya oblast' (the administrative unit including Sakhalin and the Kuril Islands) is an isolated island territory of the Russian Federation located in the far east of Eurasia and surrounded by the Sea of Japan, the Sea of Okhotsk and the Pacific Ocean. For the sake of simplicity we will call Sakhalinskaya oblast' simply ‘Sakhalin’ and, when necessary, will distinguish between the ‘Kuril Islands’ and just ‘Sakhalin Island’ as two different geographical entities depending on the context. Additionally, it should be noted that all old Japanese names were changed and that Sakhalin Island in Japanese is called ‘Karafuto’ and the ‘Kuril Islands’ are called ‘Chishima’. These and other important equivalent geographical names are listed in Table 1.
Present Russian geographical names and their old Japanese equivalents. For some Japanese names we give more than one version, since there is some inconsistency in spelling, depending on sources
Sakhalin Island stretches north–south for ~1000 km; its width does not exceed 160 km. The volcanic islands of Kuril spread as an arc between Japan’s Hokkaido island and the Kamchatka peninsula for ~1200 km. The avalanche regime of Sakhalin Island was investigated most intensively between 1967 and 1985 (and most recently between 2005 and 2010), while the Kuril Islands are very poorly investigated and there are only episodic accounts (e.g. Reference OkopnyOkopny, 2011; Reference SuchkovSuchkov, 2012).
According to the definition of avalanche activity (based mainly on terrain and climate factors, such as the number of avalanche paths per kilometer of valley, avalanche return period and avalanche volumes; Reference Myagkov and KanaevMyagkov and Kanaev, 1992), the avalanche-prone areas of Sakhalin Island comprise up to 50 000 km2, an area that exceeds that of Switzerland. Despite the relatively low population of the island (500 000 people), low population density (7 people km–2) and modest mountain elevations (the highest peak is only 1609 m a.s.l.), Sakhalin has a disproportionately large number of avalanche disasters.
The region has a moderate maritime monsoon climate with intensive cyclonic activity and very high amounts of precipitation (up to 1000 mm a-1). Up to 35% and 50% of the precipitation for Sakhalin and the Kuril Islands, respectively, falls during the cold period (November–April). The typical features of the variation in snow and avalanche characteristics with altitude are shown in Figure 1. The duration of snow cover is >5 months. The highest snow accumulation rates are usually observed between November and January, giving on average 70 cm of snowpack by mid-December. The maximum snow depth is reached by mid-March and corresponds to a mean depth of 150 cm. The stratigraphy of the snowpack in the region is complex and highly variable in time and space. For example, due to wind deposition or erosion, some sites may have 5–15 m or 0.2–0.5 m of snow, respectively. In general, avalanches of new-fallen or wind-deposited snow occur during the first half of winter over non-persistent weak layers, and later larger avalanches are possible over persistent depth-hoar horizons, while full-depth wet avalanches of melting spring snow start to be observed in March–April (Reference Myagkov and KanaevMyagkov and Kanaev, 1992; Reference OkopnyOkopny, 2011). We note that a detailed quantitative analysis of the snow-avalanche climate of Sakhalin Island (e.g. as carried out for North America; Reference Mock and BirkelandMock and Birkeland, 2000; Reference Haegeli and McClungHaegeli and McClung, 2007) remains to be conducted.
Snowpack and avalanche indicators as a function of altitude for Sakhalin (data adapted from Reference Myagkov and KanaevMyagkov and Kanaev, 1992). (a) Annual number of days with snow cover (solid line) and annual number of days with snowfall intensity 10 mm d–1 (dashed line). (b) Number of days with snow-avalanche activity. (c) Maximal decadal water content.

The dominant type of avalanche in the region is caused by winter storms with strong winds (or blowing snow events). The mean number of days with snowdrift is >60 a-1; the mean duration of blizzards is 10 hours. As a result, more than two-thirds of all avalanches release during or after blizzards (Reference Myagkov and KanaevMyagkov and Kanaev, 1992; Reference Kazakova and LobkinaKazakova and Lobkina, 2007; Reference SuchkovSuchkov, 2012), and 10 m thick cornices are common. To our knowledge, no detailed systematic study of crown depth statistical distributions has been conducted in the region, so precise evaluation of snowpack properties in release zones, including slab depth or type of weak layer, is extremely rare (except for a few small case studies; Reference GensiorovskiyGensiorovskiy, 2008; Reference Suchkov and PodolskiySuchkov and Podolskiy, 2010; Reference SuchkovSuchkov, 2012). According to the personal experience of one of the authors, avalanches releasing after blizzards usually have 1–1.5 m slab thickness; while some large slab avalanches over persistent weak layers have crowns up to 2–6 m high.
2.2 Deforestation and avalanches
Since the forest cover may be considered a specific local realm of Sakhalin avalanche terrain, we provide some relevant key facts below. It is important to note that >70 years of forest cutting by Japanese and Soviet workers has produced a significant reduction in forested areas of the island (Reference VysokovVysokov, 2004). It is known that deforestation has had a large impact on local ecology, and fisheries in particular (an intense research area in the past and at present; e.g. Amur–Okhotsk Project of 2005–09), but quantitatively it is unknown how much deforestation has contributed to the overall avalanche risk.
Reference Myagkov and KanaevMyagkov and Kanaev (1992) mention that the activation of some avalanche processes was a direct consequence of deforestation of Sakhalin Island, especially on the southern slopes of the Western Sakhalin Mountains. Natural dense conifer forests (spruce and fir) reach altitudes of 600– 700 m a.s.l. and act as anchors to keep snowpack on the slopes. Vegetation located above this elevation is mainly represented by sparsely spaced Stone Birch trees (Betula ermanii), bushes of Creeping Pine (Pinus pumila) and Kuril bamboo; even though some bushes are 3–5 m high, they are totally covered by snow in winter. Accordingly, they have a much lower stabilizing effect than trees. Starting zones of natural avalanches are above this treeline, and avalanches that start below it are likely to have mostly anthropogenic origins, due to destroyed forests. Nevertheless, we should note that the impact of forest cover on avalanche release susceptibility and flow remains heavily debated (e.g. Reference FeistlFeistl and others, 2014). For example, Kazakov (2007) demonstrated that the Sakhalin conifer forest does not eliminate the risk of avalanches; this is especially true for slopes steeper than 35° during warming periods. Avalanches starting in the forest were also reported during cold conditions in Japan (Reference YamaguchiYamaguchi and others, 2004).
Another important avalanche factor is Kuril bamboo, which provides numerous voids at the base of the snowpack and thus contributes to the development of loose snow horizons of depth hoar, and which may have low static friction with overlaying snow (0.13–0.25) (Reference Myagkov and KanaevMyagkov and Kanaev, 1992). Moreover, Kuril bamboo inhibits the recovery of natural forests after cutting or fires, and thus indirectly intensifies the release of avalanches. To estimate the average velocity of avalanches over bamboo-covered slopes in the region, Reference BobrovaBobrova (2010) suggested using a coefficient of turbulent friction of 750 m s-2. However, we could not find a single case study validating this parameter. Snow glide and its relation to avalanche formation over bamboo bushes were investigated in detail through observations and experiments by Reference EndoEndo (1984) on neighboring Hokkaido island.
2.3 Physical parameters of local avalanches
Some basic features of avalanches that have involved fatalities (avalanches that produce casualties we term ‘catastrophic’ or ‘disastrous’) can be drawn from an analysis of recorded cases that have occurred during the Soviet/Russian period. We extracted available records of physical properties for 1928–2009 from Reference Suchkov, Ivanov, Kato and KimSuchkov and others (2006), Reference KazakovKazakova and Lobkina (2007), Reference KazakovaKazakova (2010), Reference Suchkov and PodolskiySuchkov and Podolskiy (2010) and Reference SuchkovSuchkov (2012). For this analysis, we plot cumulative distributions of available parameters: avalanche volume (Fig. 2); release angle (Fig. 3); the fraction of avalanches by month (Fig. 4a); starting zone aspect (Fig. 4b); total vertical drop, Δh (Fig. 5a); estimated and observed runout distances (Fig. 5b); and angle, (defined as the arctangent of the ratio between the total vertical drop and the runout) (Fig. 5c). Additionally, we include available physical parameters for natural avalanches causing no casualties or damage (‘natural, non-damaging’), the majority of which were observed in the Eastern Sakhalin Mountains (Reference BobrovaBobrova, 2009; Reference KazakovaKazakova, 2009). We do so in order to give a wider view of the existing records, and also because this territory is becoming increasingly crucial for transportation, due to oil developments in the coastal area (e.g. Reference Zhiruev, Okopny, Kazakov and GensiorovskiyZhiruev and others, 2010; Reference SuchkovSuchkov, 2012). However, we are mindful that natural, non-damaging avalanche activity observations may be biased towards larger events and that, because of the limited monitoring area, they do not necessarily represent all the islands. Additionally, we include results of recent avalanche mapping (Reference KazakovaKazakova, 2010), that estimated total vertical drops and runout distances for potential avalanche tracks over all Sakhalin settlements.
(a) Cumulative distribution of avalanche volumes for 44 fatal avalanches (blue) and 44 natural (without casualties or damage) avalanches (red). Dashed curves are log-normal fits. Number of avalanches (%) is shown in different volume categories for (b) fatal and (c) natural avalanches.

(a) Cumulative distribution of starting zone slope angles for 60 fatal avalanches (blue) and 22 natural (without casualties or damage) avalanches (red). Dashed curves are normal fits. Numbers of avalanches (%) are shown in different release angle categories for (b) fatal and (c) natural avalanches.

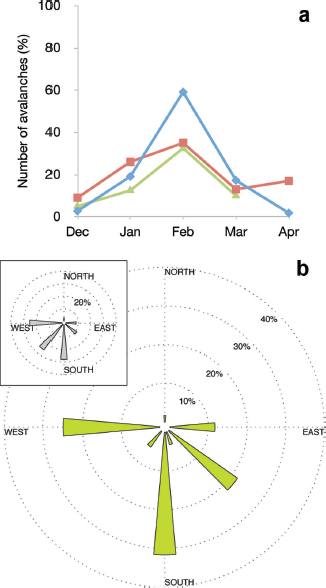
(a) Distribution of avalanches by month from two previous Russian studies (red squares: Reference Myagkov and KanaevMyagkov and Kanaev (1992), for all observed avalanches in the period 1967–77; green triangles: Reference Kazakova and LobkinaKazakova and Lobkina (2007), for only catastrophic avalanches, with 40% of the data missing). Blue diamonds indicate percent of catastrophic avalanches estimated through analysis of Japanese archives (1910–45). (b) Distribution of release zone aspects of catastrophic avalanches from two studies (main plot: this study for 60 avalanches; inset: Kazakova and Lobkina (2007) for 36 avalanches). One unit of each axis corresponds to 10%.
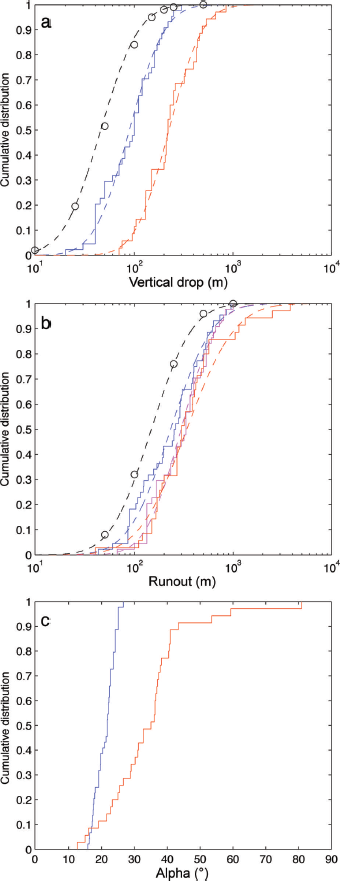
(a) Cumulative distribution of total vertical drop, h (blue indicates data for 44 fatal avalanches; gray circles show data for 3668 potential avalanche tracks over settlements, after Reference KazakovaKazakova (2010); red indicates factorial total vertical drop values for 35 natural avalanches). (b) Cumulative distribution of estimated avalanche runout distances, L (blue and pink indicate data for 44 fatal avalanches calculated following Reference BlagoveshchenskiyBlagoveshchenskiy (1974) and Reference KozikKozik (1962), respectively; gray circles show data for 3668 potential avalanche tracks over settlements calculated following Reference KozikKozik (1962) by Reference KazakovaKazakova (2010); red indicates factorial runouts for 35 natural avalanches). (c) Angle,, averaged over the run of the avalanche (sighted from an extreme estimated reach of 44 avalanches to their starting zones, i.e. α = arctan ∆h=L Blag)). Red shows for 35 natural avalanches.
Avalanches typically release between November and May, and most occur in January and February (Fig. 4a). This is typical for most Northern Hemisphere countries, including Japan, where avalanches occur most frequently during these two months because of the larger amounts of new snowfall and the deep accumulated snowpack. A slight increase in natural activity in April (Fig. 4a) corresponds with intensified spring snowmelting. The most common aspects of catastrophic avalanches were western, southwestern, southern and southeastern slopes (Fig. 4b). This is a direct result of the terrain orientation with respect to dominant winds, mainly from the north and northwest (Reference Myagkov and KanaevMyagkov and Kanaev, 1992), and the concentration of infrastructure on the west coast.
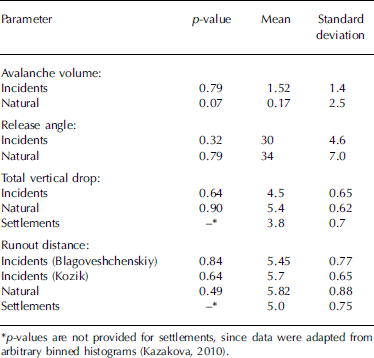
Figures 2a and 5a and b suggest that values of avalanche volume, total vertical drop and runout follow log-normal cumulative distribution functions (CDF) relatively well; release angles may be approximated with a normal CDF (Fig. 3a). We performed a Kolmogorov–Smirnov test to compare empirical values to standard distributions. Table 2 summarizes quality of fit p –values for all fits, as well as their means and standard deviations.
Lower-elevation avalanches with debris volumes of ~20 m3 may be hazardous due to marine terraces (Fig. 2), while there are records of avalanches with higher-elevation releases with deposits up to 1.4 × 10⁶ m3 (3 January 1991; no victims; Reference Kazakov, Okopny, Zhiruev, Gensiorovsky and AnikinKazakov and others, 1999). (For comparison, information for the largest observed avalanches in Japan and at Hokkaido is as follows. Japan: 27 March 2000 (Gifu prefecture), dry snow slab avalanche, runout distance 4.2 km, deposition volume 1.07 × 10⁶ m3, α = 21° two fatalities (Reference SeppyoSeppyo, 2001; Reference Ueishi and IzumiUeishi and Izumi, 2002). Hokkaido: 25 April 1981 (Niseko ski resort), wet snow full-depth avalanche, runout distance 1.3 km, deposition volume 17 500 m3, α = 22.5° (Reference Akitaya, Endo, Onodera and SakataniAkitaya and others, 1981).) Observations from the Eastern Sakhalin Mountains documented some avalanche deposits that reached heights of 10–12 m over roads (Reference Myagkov and KanaevMyagkov and Kanaev, 1992), and >15 m on rare occasions (Reference Zhiruev, Okopny, Kazakov and GensiorovskiyZhiruev and others, 2010). About 80% of the catastrophic avalanches of Sakhalin had volumes less than 10 000 m3, and only two avalanches had volumes between 150 000 and 170 000 m3 (Fig. 2a). The most frequent catastrophic avalanche volumes were between 1000 and 10 000 m3 (Fig. 2b).
The largest number of catastrophic avalanches released from starting zones with inclinations between 258 and 308 (Fig. 3b). The majority of natural non-damaging avalanches, reported mainly for the Eastern Sakhalin Mountains, released from 35–408 slopes (Fig. 3c). The prevalence of relatively shallow avalanche release angles of catastrophic avalanches (Fig. 3a) in comparison to natural activity (or in comparison with other studies; e.g. Reference McClung and SchaererMcClung and Schaerer, 2006) may be caused by some of the following factors or their interaction: (1) unknown systematic biases in reported angles of avalanche starting zones, due to using maps with particular scales (1: 25 000 and 1: 10 000; Reference SuchkovSuchkov, 2012); (2) some effect due to the low-friction Kuril bamboo; (3) morphological properties of avalanche tracks and their differences between mountain chains; and (4) climatic factors, such as high snow accumulation during cold periods.
Two important features of avalanches in the region are the relatively short slopes and low elevations of their starting zones. Mostly this is represented by marine terraces only 100–200 m high. Much of the infrastructure, including roads and residential buildings, is concentrated along the coasts beneath such terraces. As a result of this topography and its relationship with the infrastructure, we see a very small difference between altitudes of avalanche initiation and runout zones (i.e. total vertical drop), which is <200 m for 90% of catastrophic avalanches and <300 m for 70% of natural non-damaging avalanches (Fig. 5a). This distribution also echoes previous comments about the role of forests. Clearly, this feature is very different from the European Alps, the Caucasus and other high mountains, where avalanches may start thousands of meters above the runout zones. Reference RybalchenkoRybalchenko (2010) pointed out that even river terraces (<25 m high) on Sakhalin Island are considered a particular type of avalanche starting zone. Interestingly, in Japan 10 m high slopes with inclination >15º are considered to be avalanche-prone (ASNCLRC, 2010). We also note that a decade ago short slopes were identified as requiring more study, and that most avalanche models were tested only for higher vertical drops (Reference Stethem, Jamieson, Schaerer, Liverman, Germain and WalkerStethem and others, 2003).
The low vertical drop is echoed by the relatively short estimated and observed runout distances: 90% of avalanches stop within 600 m (Fig. 5b). Note that we provide here empirically estimated runouts, since these are the core of all modern hazard-mapping procedures used on the islands; even if they are uncertain, they show the scale of the phenomenon in the region. They were calculated by the two most commonly used empirical methods in Russia: (1) using the morphological properties of avalanche tracks (L max ∆h= tan α, where tan is taken from empirical relationships of Reference BlagoveshchenskiyBlagoveshchenskiy (1974), mainly depending on an area of avalanche starting zone and its angle) or (2) following the geometrical method of Reference KozikKozik (1962), which finds the extreme reach of an avalanche by simply taking α= 16: 7º (a similar method exists in Japan, with a slightly higher α = 18º; Reference TakahashiTakahashi, 1960; ASNCLRC, 2010). Comparisons of these two approaches for five large avalanches (with observed runouts up to 5 km) in different regions of Russia (Reference BobrovaBobrova, 2011) and for Sakhalin avalanches (26 with recorded runouts up to 3.8 km; Reference KazakovaKazakova, 2009) produce similar results.
Values of for the majority of the estimated runouts vary between 16º and 27º (Fig. 5c). Values of recorded for 90% of natural avalanches vary between 12º and 40º. About 9% of observed natural avalanches had α = < 18º. The lowest recorded was observed for the avalanche in the Eastern Sakhalin Mountains (Reference Kazakov, Okopny, Zhiruev, Gensiorovsky and AnikinKazakov and others, 1999). The total vertical drop was 800–850 m and the runout was 3800 m (α = 12º) (Fig. 5). This value is close to the reference slope angle of 108 known from analysis of large avalanches with low return period worldwide (Reference McClung and SchaererMcClung and Schaerer, 2006). Possibly the occurrence of avalanches with α < 18º at Sakhalin is related to lower temperatures than those occurring in Japan. For example, Reference Naaim, Durand, Eckert and ChambonNaaim and others (2013) showed that temperature plays a crucial role in avalanche dynamics. Similarly, Reference Eckert, Keylock, Castebrunet, Lavigne and NaaimEckert and others (2013) concluded that high return period runouts were mainly encountered during cold winters in the French Alps.
Some avalanches in Sakhalin and the Kuril Islands flow down directly into the sea, in rare cases together with houses or victims that were in their path. It was noted that this factor makes observations and detection of some active avalanche tracks harder, since any deposits may be washed away by the sea (Reference Myagkov and KanaevMyagkov and Kanaev, 1992).
To the best of our knowledge no records or measurements of avalanche velocities or impact pressures exist for the islands (except velocity measurements using an unspecified method for six avalanches (Reference KazakovaKazakova, 2009); and a few more given by Reference GensiorovskiyGensiorovskiy, 2008).
2.4 Typical avalanches of the region
We note that most Sakhalin fatal avalanches have magnitudes less than ‘3+’ according to the Canadian Snow Avalanche Size Classification (Reference McClung and SchaererMcClung and Schaerer, 1993). Based on the data provided above (Figs 2–5) and published descriptions, if we were to describe a typical catastrophic Sakhalin avalanche, it would have the following characteristics: (1) It occurs somewhere on the islands in 70% of years (only 30% of the years 1910–2010 had no fatal avalanches). (2) It releases after a new snowfall (e.g. multi-year mean maximum daily precipitation for a cold period is ~12 mm w.e.) with strong winds (i.e. winter storm or blowing snow event) in February from a 30–35º south- or west-oriented slope of a marine terrace. (3) The altitude difference between the starting zone and the runout zone is <125 m. (4) The avalanche has a volume of ~1–10 103 m3, accelerates up to a speed of 20 m s-1, reaches a potential impact pressure up to 50 kPa (Reference Salm, Burkard and GublerSalm and others, 1990; Reference McClung and SchaererMcClung and Schaerer, 2006; Reference Sovilla, Schaer, Kern and BarteltSovilla and others, 2008), stops within a runout distance of 250 m and kills at least one person in a settlement, on a road or in a train (according to Reference Kazakova and LobkinaKazakova and Lobkina (2007), 82% of Russian avalanche fatalities occurred in settlements).
Another important feature of the islands is that avalanches and blizzards may block off many settlements, cutting their connection with other regions. During periods of crisis, this may place all avalanche disaster management onto local authorities, which usually lack sufficient resources to deal with such situations. Moreover, each winter carries the risk of fatalities from severe weather and blocked roads (Reference Zhiruev, Okopny, Kazakov and GensiorovskiyZhiruev and others, 2010; Reference SuchkovSuchkov, 2012). In his classic work about Sakhalin, when it was the largest location for penal servitude in Russia, Reference ChekhovChekhov (1895) noted that blizzards often killed soldiers and were the main ‘friend’ of the convicted. In Sakhalin it is not possible to conclude that avalanches are the primary cause of winter natural hazard fatalities (in the way that Reference Stethem, Jamieson, Schaerer, Liverman, Germain and WalkerStethem and others (2003) did for Canada), due to the lack of any statistics for such a category.
3. Description of the Main Avalanche Disasters
3.1 Japanese era
We note that the statistics provided here for the recorded number of disasters during the Japanese era may be episodic in nature, covering some time periods unevenly. (In seismology, for instance, it is well known that the volume of documented evidence may be due to better recording, rather than to increased incidences of some phenomenon; e.g. Reference Engedahl, Villaseñor, Kanamori, Jennings and KisslingerEngedahl and Villaseñor, 2002.) Thus, although we have included as much as possible of the information available to us, we hope that future studies will be able to fill any remaining gaps and help eliminate possible biases (we are not aware of any reasons for the latter to exist). Information about the Japanese incidents was mainly found in articles in old Japanese newspapers (for Southern Sakhalin: Karafutonichinichi-shinbun; for the Kuril islands: Otaru-shinbun and the Hokkaido-Times; published 1910–45), and one case was found in a self-published memoir by Reference NakamachiNakamachi (1991).
Note also that we found strong evidence of a relationship between avalanche activity and deforestation of southern Sakhalin while it was under Japanese rule. The following description is found in travel notes by the Japanese writer Reference HayashiHayashi (2003) about her trip to southern Sakhalin in June 1935: ‘Between Ootomari and Toyohara, and along railway line from Toyohara, to Kita-Toyohara, Kusano, Konuma, Tomioka, Miyuki, Ootani, Kotani, and Otiai at mountain fields … I could not notice any large trees. Literally there were only burned fields, and recently cut forest’. In the words of the writer, all the mountains and fields of Sakhalin ‘had only stumps, so that one felt as if passing through an empty graveyard’. Illustrations of this are given in Figure 6, showing views of totally deforested steep slopes near railways and settlements.
Views of deforested steep slopes (1930s–40s). (a) Railway section between Toyohara and Maoka (75 km from Toyohara). (b) Railway bridge near the Daiei coal mine. (Photographs courtesy of Kokusho Kanko-kai, Inc., Tokyo, Japan; NKCEC, 1979.) (c) Logging village with Korean workers at Sakhalin, 1940s. (Photograph courtesy of National Archives of Korea, South Korea).

Given the relationship between avalanche activity and deforestation, and further descriptions of Reference HayashiHayashi (2003), the following facts are of note:
Most of southern Sakhalin was dominated by the Oji paper factory (now known as the Oji Paper Company), which was cutting down trees and not replanting; Sakhalin was known at that time as ‘Oji-Island’ (Fig. 6c).
Between 1919 and 1923 there was an outbreak of pine wilt at Sakhalin, and elimination of infected trees became a large-scale national policy between 1922 and 1926.
There was widespread illegal logging, and evidence of this activity was hidden by many forest fires.
It is very likely that because of the factors listed above, mountains in the vicinity of roads, railways and settlements became bald (Fig. 6), and since there was no support for snow slopes, there were many avalanche incidents following deforestation in winters with sufficient snow in the 1930s and 1940s (Section 4.3).
The known locations of fatal avalanches during the Japanese era at Sakhalin and the Kuril Islands are shown in Figure 7. Since, in the majority of cases, locations were identified only from text descriptions in old newspaper articles, precise identification of slopes or avalanche tracks remains very difficult. Consequently, it is hard to determine whether some avalanches that followed in the Russian period (Section 3.2) occurred at exactly the same locations.
(a) Map of northern Eurasia showing the location of Sakhalin and the Kuril Islands. (b) Map with approximate locations of all known avalanche incidents occurring between 1910 and 1945 in the Japanese parts of Sakhalin and the Kuril Islands. Color bar for elevations is shown in kilometers; one degree of the grid corresponds to 111 km. Pink empty circles indicate locations of old Japanese meteorological stations. Red solid and dashed segments indicate maximum extent of Japanese borders.

Most of the Sakhalin incidents under the Japanese administration occurred on the west coast of the island (between 46.5 and 48º N), and the rest were scattered over southern Sakhalin, mainly near Yuzhno-Sakhalinsk, Dolinsk and Korsakov (Fig. 7b). Two fatal avalanches also occurred on Moneron Island, off the southwestern coast of Sakhalin. Most of the Kuril avalanches took place at Kunashir, Iturup and Shumshu islands, including the deadliest avalanche that occurred in the island chain (described below).
Precise physical parameters of avalanches or corresponding avalanche tracks (e.g. volumes, slope expositions, etc.) remain unknown and could not be found in archive materials. We can only suggest that they should be similar to the properties of known avalanches of the Soviet/Russian period, since they occurred in a similar geographic environment. We note that the maximum number of avalanche disasters was observed in February, as was also shown by Russian data (Fig. 4a).
The deadliest avalanches in Sakhalin were released near the town of Tomari on the Sea of Japan coast (36 fatalities at a miners' settlement of the Akigawa coal mine), and near Leonidovo in central Sakhalin close to Poronaisk (41 fatalities; workers' dormitory).
Overall, the main impacted social groups were railway, construction and logging workers, miners, people in settlements, people on roads and, in one case, soldiers. The latter case, the only catastrophic event for which we could find reasonable details, is described below.
The largest avalanche disaster with Japanese victims in the Kuril Islands remains virtually unknown in Japan. It occurred on Shumshu, the northeasternmost island of the Kuril island chain (Fig. 7b), on 1 March 1945. The avalanche collapsed from a 10 m high cliff slope behind a barracks belonging to the Japanese Army (91st Division, 1st Artillery, 1st Squadron), which was located on the Murakami peninsula (Murakamizaki) on the northwest coast of the island. Twenty-three soldiers of the 40 there were killed by this relatively small avalanche (magnitude ~1).
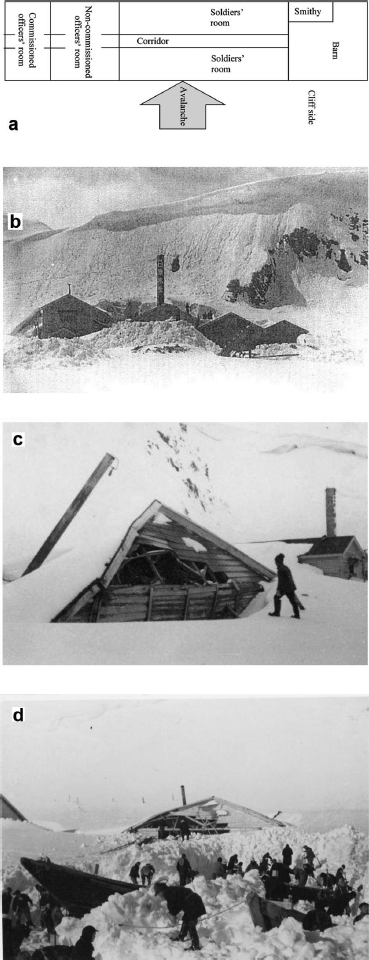
The highest elevation of Shumshu island is 189 m a.s.l.; its hillsides have almost no trees, and most of the coast is bordered by cliffs. At the end of February 1945, a very strong north wind lasting for a about week produced a large snow cornice hanging off the cliff behind the barracks. On 1 March the personnel noticed that the cornice looked dangerously unstable and decided to deal with this the next morning. However, that night the cornice collapsed, causing an avalanche which directly hit the barracks with people inside. This disaster was classified information until surviving witnesses collected and published their memoirs (Reference NakamachiNakamachi, 1991). This booklet included a schema of the disaster, which is reproduced in Figure 8a. To our knowledge no photographs remain from this event; however, we were able to find other archival photographs that may show conditions similar to this disaster. In the 1930s there was a codfish-processing factory on Paramushir island. Winter photographs of this factory (Fig. 8b–d) show coastal buildings located under a cliff with a large snow cornice overhanging the top of the cliff, similar to conditions at the army barracks. These photographs provide a general idea of the nature of typical Kuril Islands marine terraces, and illustrate the possible heavy snow conditions. Such cornice collapses from small slopes are common in the Kuril Islands and have been reported elsewhere (Reference OkopnyOkopny, 2011; Reference SuchkovSuchkov, 2012).
(a) Layout of the Japanese Army barracks hit by the avalanche on Shumshu island on 1 March 1945 (after Reference NakamachiNakamachi, 1991). (b) Snow cornice hanging over the top of a coastal cliff behind the Igarshi fish factory, Paramushir island. (c) Collapsed warehouse due to a heavy snow load (possibly from a snow avalanche from the cliff at the back), Paramushir island. (d) Return of workers to the Igarshi fish factory after a winter season: snow has to be removed from a small port in front of the factory, Paramushir island. (Photographs courtesy of Igarashi Reizo Company, Tokyo, Japan.)
3.2 Soviet and Russian eras
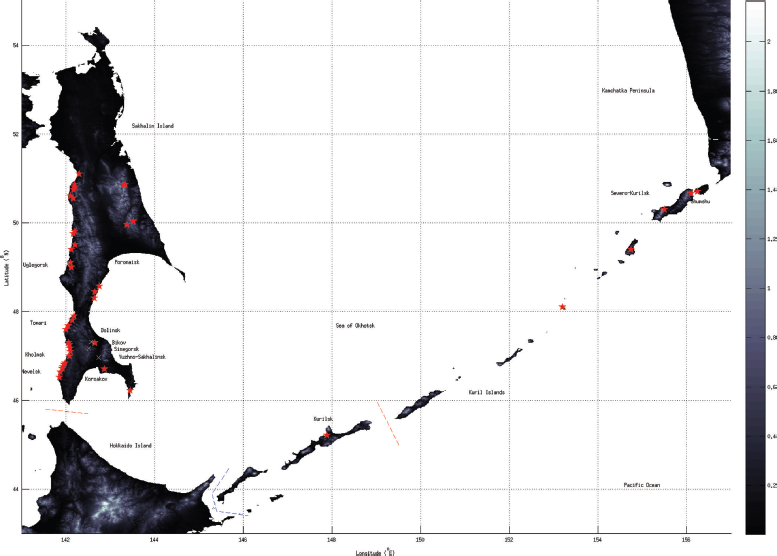
All known locations of avalanches in our study area that caused fatalities among the Russian population are shown in Figure 9. The map of Sakhalin Island shows that the majority of incidents have occurred in a very narrow strip along the western coast of the island facing the Sea of Japan. Fatal avalanches have occurred on several of the Kuril Islands (Fig. 9). Compared to Japanese disasters (Fig. 7b) it is evident that the Russian period has had more events further north, due to population expansion. Overall, it is clear that the main cluster of avalanche catastrophes is on the west coast of southern Sakhalin; we attribute this to the concentration of industry and its associated infrastructure.
Map with locations of all known avalanche fatalities occurring between 1928 and 2010 in the Soviet/Russian parts of Sakhalin and the Kuril Islands. Color bar for elevations is in kilometers; one degree of the grid corresponds to 111 km. Blue dashed segments indicate the sea border between Russia and Japan according to Russia; red segments further northeast are the border according to Japan.
Some key dates for snow-avalanche research in the USSR and Russia are provided in Table 3. Here we briefly describe the most significant or symbolic catastrophes during the Soviet/Russian administration of Sakhalin and the Kuril Islands. Before we do so, we note that official fatality tolls from natural disasters during the USSR administration were marked down from the true total (Reference SuchkovSuchkov, 2012). Moreover, the death counts of many fatal incidents were underreported until the true totals were finally certified in 1990 (Reference Zhiruev, Okopny, Kazakov and GensiorovskiyZhiruev and others, 2010).
Key events in snow and avalanche research during the Soviet and Russian history of the islands

Development of Soviet society on southern Sakhalin Island and on the Kuril Islands mainly unfolded through the previous Japanese infrastructure. The new population moving in from the Soviet mainland, including administrators and workforce, was unaware of the avalanche issues of the Sakhalin and Kuril Islands environment, and had no records of the previous experience of the Japanese. Much infrastructure, including residential buildings, was created without considering avalanche risks, which caused a significant number of casualties in settlements, on roads (Fig. 10) and on railways (Fig. 11).
An avalanche over a road (logging road access), Eastern Sakhalin Mountains, 28 December 1990. (Photograph courtesy of V.I. Okopniy.)

Trains derailed by avalanches. (a) A section of railway between Yuzhno-Sakhalinsk and Kholmsk, Kamysheviy pass, 31 March 1982. (Photograph from the archives of Sakhalin UGMS.) (b, c) A railway on the eastern coast of Sakhalin, between Yuzhno-Sakhalinsk and Poronaisk, 31 December 2009. (Photograph by V.E. Suchkov; reproduced with permission of Seppyo.)

The most catastrophic Sakhalin Island avalanche (9 February 1945) became the deadliest avalanche in USSR history (Reference SuchkovSuchkov, 2012). For a long time the disaster was classified information which only witnesses, high administrators and specialists of the Sakhalin UGMS knew about. Only after perestroika did it start to be mentioned in print (Reference DudnikovDudnikov, 1994; Reference KuzinKuzin, 1996). This tragedy occurred just before midnight (about 23:25) when an avalanche collapsed onto the living sections of a miners’ settlement (Srednyaya Medvejka) from Mayak mountain (Fig. 12). Some sources say that previously the mountain had lost its forest due to fires (Reference Shmigel’skiyShmigel’skiy, 2008).
Avalanche site of Srednyaya Medvejka (50.738 N, 142.128 E). (a) Topographical map of the avalanche path. (b) Corresponding avalanche profiles along talwegs of the avalanche track. (c) View of the avalanche starting zone. (d) View of the avalanche deposit zone. (Photographs taken in 1969; from the archives of Sakhalin UGMS.)

Avalanche deposits reached 10–20 m and were estimated to have a volume of ~170 103 m3 (Reference Shmigel’skiyShmigel’skiy, 2008; Reference SuchkovSuchkov, 2012). More than nine structures were destroyed, including a kindergarten, a secondary school and several two- and three-story buildings. Officially 131 people were killed; some sources indicate the number of fatalities was 149 (Reference SuchkovSuchkov, 2012). The weather conditions are not known with certainty; some literature refers to strong winds with a preceding period of warming (Reference GaponenkoGaponenko, 2010), while other accounts mention snowfall and blizzard conditions (Reference Shmigel’skiyShmigel’skiy, 2008; Reference SuchkovSuchkov, 2012). Before and after this event, avalanches occurred that killed people and horses and caused damage in the settlement (Reference SuchkovSuchkov, 2012). Eventually, the settlement was completely abandoned.
The largest known disaster in the Soviet/Russian history of the Kuril Islands was on 25 December 1959 at SeveroKurilsk city (Paramushir island). A huge slab collapsed during a blizzard (heavy snow with northwest winds up to 30 m s–1 and gusts up to 40 m s–1) around 19:45. The avalanche released from the southeast slope of a plateau called Aerodromonoe. This name, corresponding to ‘air-port’, originates from the plateau having been used by the Japanese for landing aircraft. This highlights the fact that conditions were perfect for avalanche formation, with wind-blown snow from a large area being deposited on leeward slopes (Fig. 13a and b). According to some documents, the fracture crown had a width of 1–1.5 km and the slab had a thickness between 6–7 and 15 m (Reference Suchkov, Ivanov, Kato and KimSuchkov and others, 2006; Reference SelinaSelina, 2009a; Reference SuchkovSuchkov, 2012). In comparison with existing studies of crowns, this width is quite remarkable (e.g. Reference Faillettaz, Louchet and GrassoFaillettaz and others, 2004, Reference Faillettaz, Louchet and Grasso2006; Reference McClung and SchaererMcClung and Schaerer, 2006). The avalanche stopped at a very low - angle of 168 (Reference SuchkovSuchkov, 2012). Between 36 and 48 people were killed (official/unofficial numbers) and 72 were injured. Three buildings were destroyed. Some accounts indicate that the Japanese had previously avoided building in this area (Reference SuchkovSuchkov, 2012). Avalanches repeated in this same zone in subsequent years, and one is illustrated in Figure 13c (unfortunately, the figure is of poor quality, but as it is the only avalanche disaster photograph from the Kuril Islands we know of, we include it here). Some witness accounts of survivors can be found in local publications (Reference SelinaSelina, 2009a,Reference Selinab).
(a) Location of catastrophic avalanches over the town of Severo-Kurilsk, Paramushir island. (Photograph by V.E. Suchkov.) Numbers 1 and 2 indicate catastrophes of 1959 and 1977, respectively. (b) Memorial at the mass grave of people killed on Paramushir in 1959. The large marine terrace slope, from which a huge snow slab collapsed, can be seen in the background. (Photograph by V.E. Suchkov.) A snow cornice is seen at the top of the slope; the location of the 1959 tragedy is shown by the number 1. (c) Debris of destroyed houses mixed with avalanche deposits, Severo-Kurilsk (Sopochnaya Street, December 1977). (Photograph courtesy of P. Marshuk.)

The government began to actively protect against the snow and avalanche risks in the islands in 1965. (Avalanche research in Japan was undertaken slightly earlier, in Niigata (1959) by M. Shoda (Railway Technical Research Institute), and was continued mainly by the Institute of Low Temperature Science (ILTS, Hokkaido University, Sapporo) and the Snow and Ice Research Center (NIED, Nagaoka and Shinjo).) After an avalanche struck the newly built Sakhalin sanatorium on 12 January 1965 (Fig. 14; no one was killed) some relevant organizations become involved and/or were established (Table 3). This was followed by several monograph publications (Avalanches of Sakhalin and the Kuril Islands, 1971; Snow and avalanches of Sakhalin, 1975), mapping and some avalanche defense structure design and construction. Nevertheless, many of the structures initiated at that time were never completed or are so dilapidated today, due to lack of upkeep, as to be obsolete. The town of Nevelsk, for example, falls into this category, while also being one of the most avalanche-prone towns in Russia (Reference Samoylyuk, Samoylyuk and SuchkovSamoylyuk and others, 1993; Reference SuchkovSuchkov, 2012). It has 250 houses, two schools and one kindergarten in avalanche risk zones (Reference KazakovaKazakova, 2010). In total, there are about 43–63 settlements located in risk zones on Sakhalin and the Kuril Islands (Reference Suchkov, Ivanov, Kato and KimSuchkov and others, 2006; Reference KazakovaKazakova, 2010). Among them are Nevelsk, Tomari, Sinegorsk, Bikov, Uglegorsk and Severo-Kurilsk (Reference Suchkov, Ivanov, Kato and KimSuchkov and others, 2006; Reference SuchkovSuchkov, 2012).
Avalanche deposits in front of Sakhalin sanatorium; the ground floor is completely under snow (12 January 1965; photograph from archives of Sakhalin UGMS).

Concerning recent history, we note that the latest avalanche fatalities we know of involved a train derailment on 31 December 2009 on the eastern coast of Sakhalin Island between Dolinsk and Makarov (Fig. 11b and c; Reference Suchkov and PodolskiySuchkov and Podolskiy, 2010).
In general it may be said that the islands, despite their violent and tragic history of snow avalanches, are very poorly protected from avalanche danger and have hundreds of installations with thousands of inhabitants in high-risk zones (Reference SuchkovSuchkov, 2012). For example, Reference Zhiruev, Okopny, Kazakov and GensiorovskiyZhiruev and others (2010), using previously observed snow-avalanche deposits, estimated that ~180 and ~200 km of railways and roads, respectively, in Sakhalin Island are at risk from avalanches. Reference KazakovaKazakova (2010) and Reference BobrovaBobrova (2010) concluded that today ~35% of the population (~180 000 people) live in avalanche-prone locations (where exposed areas were evaluated, as in any previous study from this region, using empirical relationships for maximum avalanche runout as a function of documented avalanche track properties).
4. Statistical Features of Avalanche Burials
4.1 Overview
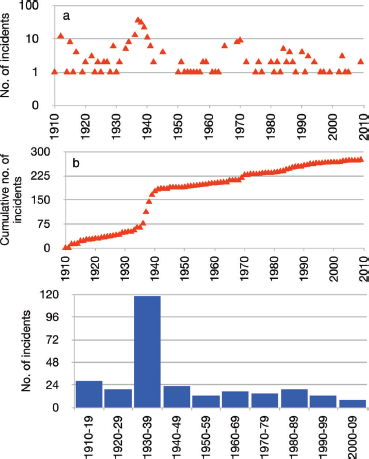
Fatalities under the Japanese and Soviet/Russian administrations during the last 100 years are shown in Figure 15. In the same manner, we plot the number of injured people (Fig. 16; for the sake of simplicity we count any survival after burial as ‘injury’) and the number of incidents (one incident refers to any known population or infrastructure loss; so it may involve no injuries or deaths, or may include fatalities, injuries and destruction; Fig. 17).
(a) Annual number of fatalities on Sakhalin and the Kuril Islands between 1910 and 2010; inset shows the frequency of years with different magnitudes of losses. (b) Cumulative number of fatalities. (c) Number of fatalities by decade.

(a) Annual number of injuries (survivals after burial) on Sakhalin and the Kuril Islands between 1910 and 2010. (b) Cumulative number of injuries. (c) Number of injuries by decade.

(a) Annual number of avalanche incidents on Sakhalin and the Kuril Islands between 1910 and 2010. (b) Cumulative number of avalanche incidents. (c) Number of incidents by decade.
The total number of people killed by snow avalanches between 1910 and 2010 was 756. We are not aware of any other territory of comparably small area in the world (except, perhaps, the Tyrolean Alps, and some regions of Afghanistan, Tajikistan, Pakistan, India and Turkey; e.g. Reference Podolskiy, Sato and KomoriPodolskiy and others, 2009) that has had such significant non-skier fatality tolls from snow-avalanche disasters. Considering the relatively low elevations, low population density and the fact that the northern part of Sakhalin Island is mostly flat, this number is even more disturbing.
Overall, 54% (411) of the deaths occurred under the Japanese administration (Fig. 18a). (At that time ~30% of the population in the most avalanche-prone areas were Korean (SVI, 2002; Reference ParkPark, 2007), so it is probable that ~123 of these people were Korean, likely involved in mining, forestry and construction activities.) Forty-six percent (345) of the fatalities occurred under the Soviet/Russian administration (Fig. 18a). Of those injured, 61% (146 people) were injured under the Soviet/Russian administration and >92 people under the Japanese administration (Fig. 18b). The total number of known incidents was 275, 66% of them under the Japanese administration (Fig. 18c). By territory, 86% of fatalities occurred on Sakhalin Island, and the remaining 14% on the Kuril Islands (Fig. 18d). The total number of people who were buried by avalanches but survived (referred to here as the ‘injured’) was >238 (a survival rate of 24%) (Fig. 18e). However, the annual survival rate varied greatly; in 54% of years with avalanche incidents there were no survivors (Fig. 19a). Note that the high percentage of survivals in the past decade (Fig. 19b) is not necessarily due to better avalanche rescue but is probably a random manifestation, due to the high sensitivity of this value to the small decadal number of fatalities and high number of injures. Also, it is probable that many injury accounts during the Japanese era remain unknown. For example, Figure 18b shows fewer injuries during the Japanese administration than in the Soviet/Russian one, which is in contrast to the higher number of fatalities (Fig. 18a). This also suggests that there has been better reporting of injuries in recent years.
Various ratios over the 100 year record of avalanche burials. (a) Number of fatalities by administration. (b) Number of injured people by administration. (c) Number of incidents by administration. (d) Fractions of fatalities by territory. (e) Overall ratio between survivals and fatalities.

(a) Annual ratio of survivals (fraction of buried). (b) The ratio of survivals estimated by decade.

The deadliest period was 1935–45, when avalanches took the lives of 455 people (Fig. 15b). A sharp rise in the number of incidents between 1935 and 1940 is clearly seen in Figure 17b.
The histograms of Figures 15c, 16c and 17c (decadal sums of fatalities, injuries and incidents) clearly highlight the outstanding nature of three high-loss decades between 1930 and 1960. Before and after this period, the cumulative numbers of fatalities, injuries and incidents grew steadily at almost the same rate. In Section 4.3 we discuss possible reasons for this trend and for high incident rates in the 1930s.
4.2 Features and frequencies of some properties
The basic statistical features of the annual fatality numbers (Fig. 15a) are centurial arithmetic mean 7.6 people per year; mode 1; median 3. During the 1990s and 2000s the average number of people killed was 0.85 a–1. However, during the 1930s it was 23.4 a–1.
The frequencies of years with low (10 persons), medium (>10 and 100) and high (>100) numbers of deaths are illustrated in the inset of Figure 15a. Figure 15a shows exponential decay of the reoccurrence of years with similar fatality tolls from high repetition of ‘low’ magnitude years (47) to rarer occurrences of ‘medium’ and ‘high’ years (12 and 2, respectively).
A diagram with the cumulative fraction of avalanches (having at least one fatality) that cause a given number of fatalities per avalanche is provided in Figure 20a. This figure illustrates that in 90% of avalanches there were fewer than ten fatalities.
Cumulative plots summarizing a century of avalanche catastrophe data from Sakhalin and the Kuril Islands, 1910–2010. (a) Cumulative fraction of avalanches causing a given number of fatalities. (b) Cumulative fraction of avalanches having a given number of injuries per avalanche. (c) Cumulative fraction of years with a given number of incidents per year.

Figure 20b shows cumulative fractions of avalanches (having at least one injury) with a given number of injuries per avalanche. About 80% of avalanches had fewer than ten injured people.
Finally, a cumulative distribution of years (having at least one incident) with a given annual number of incidents is shown in Figure 20c. The figure indicates that 90% of years with avalanche disasters had fewer than ten incidents. This, once again, highlights the period 1935–40 as having an exceptionally high number of incidents (Fig. 17c).
We note that almost all high-magnitude, rare values belong to the 1930s–60s. In general, high numbers of fatalities and injuries correspond to disasters hitting settlements, with destruction of buildings, such as those previously illustrated (Section 3). Lower numbers correspond more to road and railway incidents.
4.3 Population variation and avalanche disasters
In an attempt to indicate some clear historical reasons for significant losses during the period 1930s–60s, we can refer to the population changes of Sakhalin and the Kuril Islands during this period. Population records collected for both Japanese and Soviet/Russian administrations are provided in Figure 21a (from Wikipedia/jp; Reference VysokovVysokov, 2004).
(a) Population variation in Sakhalin and the Kuril Islands during 1910–2010 (with a septic polynomial fit). (b) Cumulative avalanche disaster index evolution during the past 100 years with a septic polynomial fit. The index is defined so that it includes fatalities, injuries and other incidents. It corresponds to stacked and normalized cumulative values of each of the three variables. (c, d) Rates of change for population and index evolutions (i.e. df/ dt). (e) Normalized rates for population and index changes without edge effects (1920–2000).

Figure 21a shows that the main phase of population growth in the islands was complete by 1957. The cumulative number of avalanche fatalities by this time corresponds to 81% (616) of the total number of people killed by snow avalanches during the 100 years. It is also interesting to note that the main ‘wave’ of disasters (including fatalities, injuries and other incidents) was over before the 1960s.
Intuitively, it is possible to expect that rapid growth of the population during the first half of the century and the required adaptation to and development of a new and unfamiliar natural environment may be the main driver of a rise in avalanche disasters.
In order to be able to extract such a dependency, as a measure of avalanche disaster impact faced by the colonizers, we define an overall ‘disaster index’, which corresponds to normalized fatalities, injuries and number of incidents, which were stacked together (i.e. so that the index grows from 0 to 100% by 2010). Such a composite construction allows us to include all elements of avalanche disasters in one variable, and thus to understand their aggregate impact on the islands on the century scale (Fig. 21b). Next, we approximate the population variation and disaster index by septic polynomials and take their first derivatives with respect to time to get their rates of change with time. Then, after normalizing these (i.e. each annual rate value was represented as a fraction of the rate’s maximum value) we show them on the same plot. If we ignore edge artifacts of polynomial fits and other small artifacts (e.g. clearly the disaster index rate cannot be negative), the striking similarity between the two variables suggests that they may be interrelated (Fig. 21e). Population growth at accelerating rates is followed by growth in the number of avalanche disasters with a small lag (~2.5 years), and as the intensity of population growth reduces so does the index (Fig. 21d). After the end of the part of the Soviet period with the most intensive population growth in the history of the islands (1945–57; about +25 000 persons per year), the number of disasters started to decline. This trend has contined for the past half-century and corresponds to the overall decrease in population (Fig. 21a) and decline of the economy.
Even with our rough assumptions, this interesting tendency may suggest that the period of intense population growth (from <30 000 to 663 000 people, an increase by a factor of >20) corresponds to the most frequent and largest losses from snow avalanches.
However, clearly this perspective may be oversimplified, since population distribution was always highly heterogeneous and other case-specific factors have played some role. For instance, avalanche cycles due to particularly severe winters or storms may make a substantial contribution.
For example, if we increase the temporal resolution, focusing on the heavy losses of 1935–40 in particular, it is hard to attribute the fatalities solely to population growth. Seemingly, some specific territorial factors, other than overall population growth (e.g. large-scale weather patterns, historical events or intense deforestation), may have contributed to the high number of fatalities between 1935 and 1940 (Fig. 15b). The strikingly large peak in the number of incidents observed from 1935 to 1940 (Fig. 17b and c) could be due to some of these factors; this remains to be clarified. To search for possible causes, we recovered old Japanese meteorological records from Sakhalin and the Kuril Islands (CMO, 2013), which seem to remain unprocessed by Russian or Japanese scholars, to see if any peculiar weather conditions could be easily discerned for the region at that time. Because of the substantial amount of work required in digitizing scanned meteorological bulletins, we only extracted the monthly means of air temperature, wind speed, monthly total precipitation and maximum 24 hour precipitation from January and February for all available stations (six in total; 1913–40).
To evaluate possible influences of these meteorological factors, we performed a multivariate regression analysis (see Appendix). It showed that a regression model with two variables (population and maximum 24 hour precipitation, or monthly mean precipitation) explains >62% of variability in the number of incidents between 1935 and 1940. Among meteorological variables the monthly mean or the maximum 24 hour precipitation have the highest marginal correlations with the number of incidents (0.66–0.71), showing the predominant role of snowfalls in causing avalanches. A model with all four meteorological covariates produced improved but similar results (R 2 = 0: 75). Accordingly, available meteorological and population records, although they definitely play a role, do not fully explain the high avalanche incident rates during that period. In our opinion, the peak in incidents in 1935–40 is probably due to the interaction of several factors: deforestation, higher population, higher winter precipitation and the historical background. During this time there was intense coal mining, construction and forestry, probably leading to overexposure to avalanche hazards.
4.4 Probability of avalanche burial for the population of Sakhalin and the Kuril Islands
The number of buried people (i.e. injured or killed) per 100 000 inhabitants of the islands per year was strongly variable in the past, between ~0.1 and ~70 (Fig. 22a). Even so, it shows an overall decreasing trend. This trend is even more evident if we consider the number of buried people per 100 000 per decade. As Figure 22b shows, this decreased steadily, except during the 1920s, from 90 to 3. Consequently, the hypothetical probability of any Sakhalin or Kuril Islands inhabitant being buried in an avalanche has decreased throughout the past century (for the past decade it was 3: 6×10⁻⁶).
(a) Annual number of victims (i.e. people buried by avalanches, both survivors and fatalities) per 100 000 population (with a simple 3 year moving average). (b) Number of victims per 100 000 population by decade. (c) Annual number of fatalities per 100 000 population (with simple 3 year moving average). (d) Number of fatalities per 100 000 population by decade.

The number of fatalities per 100 000 inhabitants per year was also very variable (Fig. 22c and d) and also shows a decreasing trend. Today the chances of being killed in an avalanche, 0.113 in 100 000 per year (the average for the last decade, 2000–09), are much smaller than the chances of being killed in a traffic accident or dying from tuberculosis (the average rates of these in Russia are 18 and 16 per 100 000 people, respectively). This is roughly equal to the annual probability of death by avalanche on an open road in British Columbia, Canada (3 × 10⁻⁶; Reference Jamieson and StethemJamieson and Stethem, 2002).
The trends shown in Figure 22 indicate that the over-exposure of the islands’ population to avalanche hazards, which existed before the 1960s, is no longer the case. Several factors could be responsible for this: the population has ‘learned’, and thus abandoned the most dangerous places; penetration into new territories has slowed, which is correlated with decreasing land use, weaker economic activity and population decline. Accordingly, the overall per capita fatality rate was extremely high in the past, but has decreased during recent decades.
Reference Irwin and OwensIrwin and Owens (2004) compared per capita avalanche fatalities between countries. They noted: ‘The total population is a very crude measure of numbers of people in avalanche terrain, but unfortunately there are very few other data available to give a better indication’. For Sakhalin, with its isolated island population living mainly in avalanche terrain (i.e. a closed system), this measure seems more relevant. In this light, if we express the number shown above in the same manner as the per capita fatalities given by Reference Irwin and OwensIrwin and Owens (2004), it is clear that today Sakhalin (1.13 fatalities per million per year during the last decade) belongs in the highest category, along with Norway, Austria and Switzerland (1.12, 3.26 and 3.17 fatalities per million per year, respectively). For Iceland, which seems more comparable to Sakhalin, the number is even higher, with ~7.0 fatalities per million per year (we base this estimate on the 1976–2000 fatality average published by Reference Jóhannesson and ArnaldsJóhannesson and Arnalds (2001) and the 2011 population).
5. Discussion
It is generally accepted that avalanche damage and losses increase with time due to deeper penetration of people into mountainous areas (Reference LosevLosev, 1983; Reference Myagkov and KanaevMyagkov and Kanaev, 1992). In the USA and Europe this is correlated with the growing number of people participating in winter sports. For comparison, there were 948 fatalities in the USA between 1950 and 2010 (CAIC, 2013). Most of these (>60%) were snowmobilers, skiers and climbers, and because of this recreational aspect the annual number of fatalities continues to grow year by year. Clearly, such a trend does not exist in the Sakhalin oblast’; in fact, it is the opposite. In Sakhalin during this period (1950–2010) the number of losses was 200. However, it is important to note that none of the cases presented in this paper were winter-sport victims (except for one skier fatality at Paramushir island in 1981). Most of the Soviet/Russian fatalities between 1928 and 2006 were adult people in settlements, workers and drivers (Reference Kazakova and LobkinaKazakova and Lobkina, 2007). Even if there is an incipient interest in outdoor winter sports in the region, it has not yet made any impact on avalanche statistics.
Some economic studies consider the development of Sakhalin as the development of an island colony of Russia (Reference VysokovVysokov, 2004). From this angle, Sakhalin can be viewed as comparable with other recently colonized countries, such as New Zealand. For the latter, Reference Irwin and OwensIrwin and Owens (2004) identified a trend of high avalanche fatalities during European settlement, followed by a relatively low number of fatalities and later by the recent wave of ‘recreational’ fatalities. They also suggest that this sequence recalls the history of avalanche fatalities in the USA, which, in common with New Zealand, had multiple mining victims during the early period in the country’s history. However, the recent fatality waves due to recreational activities in these two countries do not parallel Sakhalin data, where no shift from victims in settlements, transportation corridors and work categories to recreational activities has occurred. None of the developed countries, such as Norway, Japan, Switzerland or New Zealand (Reference Irwin and OwensIrwin and Owens, 2004), has such a low (almost zero) percentage of recreational fatalities as the Sakhalin region.
As was shown in Section 4.3, the fatality rate decrease over time is most likely connected to the end of colonization and the high population exposure during the most rapid development period. From 1905 until the 1960s the population and economy of Sakhalin experienced very intensive growth. Rapid industrial development of southern Sakhalin and the Kuril Islands by the Japanese and then the Soviets, including a high rate of immigration and construction of new roads, railways, tunnels and bridges, lasted until the 1960s. Population growth then stopped, and in the 1980s the economy began to decline until the collapse of the Soviet Union in 1991, which triggered a further decrease in population and economic activity, leading to a much lower avalanche exposure of the population.
Thus, the obvious decline in the number of avalanche incidents cannot be considered an indicator of improved safety in the region (Reference Kazakova and LobkinaKazakova and Lobkina, 2007). The gradual recovery of the economy, and the growing popularity of winter sports, may result in a larger number of victims in the future. Even though it is hard to make predictions given the present decline in the population (>7000 people per year), it is clear that snow-avalanche defense structures that are outdated and not fit for purpose (Reference Zhiruev, Okopny, Kazakov and GensiorovskiyZhiruev and others, 2010; Reference SuchkovSuchkov, 2012) will lead to more disasters.
To extend and verify our conclusions about colonization as a factor contributing to high avalanche disaster rates, we collected data of avalanche fatalities on Hokkaido for the same period (Fig. 23). Statistical information about avalanches was collected from the following newspapers: Otaru-shinbun and the Hokkaido Times (until the end of the Second World War), and Hokkaido-shinbun and the Hokkaido Times (since the end of the war). Hokkaido can also be considered a recently colonized territory, since the most intensive development took place at the beginning of the 20th century. Moreover, Hokkaido can be viewed as part of Japan’s same northward frontier expansion, with the most significant population growth occurring in the first half of the century (Fig. 23d). As Figure 23b shows, the growth in the cumulative number of fatalities recalls the pattern found for Sakhalin (Fig. 15b), with a steep slope before the 1960s and a shallower one afterwards. This strongly resembles the population change with time (Fig. 23d and e). Similarly to Sakhalin (Section 4.3) the cumulative number of fatalities by 1960 (around the end of the population boom) corresponds to 83% (498 people) of the total number of Hokkaido losses in avalanches over the period (602 people; Fig. 23b). Such features may indicate the universality of the association between avalanches and colonization of any new territory. The main difference between the two islands is that since the 1980s off-piste skiers, walkers, snowmobilers and climbers have made up about half the victims on Hokkaido. A similar transition may await Sakhalin in the near future.
(a) Annual number of fatalities on Hokkaido, Japan, 1910– 2009. (b) Cumulative number of fatalities (with a septic polynomial fit). (c) Number of fatalities by decade. (d) Population variation at Hokkaido during 1910–2010 (with a septic polynomial fit). (e) Normalized rates for changes in population (red) and in cumulative fatalities (blue).

6. Conclusions
In this paper we have attempted (1) to reconstruct a 100 year history of avalanche disasters on Sakhalin and the Kuril Islands and (2) to characterize its main physical and societal statistical features. By combining all available archive records from the Japanese, Soviet and Russian eras it has been possible to create and analyze a continuous record of the main incidents that occurred in the region between 1910 and 2010. A strong relationship between overall population growth and the number of avalanche victims has been demonstrated. This association has illuminated a shock wave of snow-avalanche disasters in response to intense colonization of the islands. According to some systematic studies of the consequences of colonization (e.g. Reference Ertan, Putterman and FiszbeinErtan and others, 2012), the disease climate of the new environment faced by immigrants can strongly affect colonization (e.g. through high mortality rates). The violent encounter with snow-avalanche disasters during the ‘colonial’ era of Sakhalin and the Kuril Islands is evident and may be paralleled as a similar kind of environmental factor, which can delay development.
The evidence documented in this paper places Sakhalin among the most avalanche-affected areas in the world. In total, 756 fatalities (officially 726) and more than 238 injuries occurred in 275 incidents. The centurial arithmetic mean was 8 fatalities per year. Almost two-thirds of the fatalities and injuries occurred during the Japanese administration. The total number of fatalities exceeds all recorded fatalities caused by snow avalanches in the history of Canada, Iceland or New Zealand (e.g. Reference Jóhannesson and ArnaldsJóhannesson and Arnalds, 2001; Reference Stethem, Jamieson, Schaerer, Liverman, Germain and WalkerStethem and others, 2003; Reference Irwin and OwensIrwin and Owens, 2004) or all recorded non-recreational fatalities in France in the 20th century (Reference AnceyAncey and others, 2006) or in the USA or Austria since 1950 (Reference HöllerHöller, 2007; CAIC, 2013). The pattern of the fatality rate was found to decrease over time and is distinct from that in any other region known to us (except Hokkaido), due to the lack of deaths resulting from recreational activities. Finally, the high number of victims places the Sakhalin region in the upper category of countries by their fatalities per capita (0.113 per 100 000 people per year).
We believe that a full record and gradually accumulating knowledge of past disasters and their locations, if considered carefully and taken seriously, will give added resilience to the present and future societies of the islands. Furthermore, the initial effort presented here to combine the information assimilated from the two countries opens the possibility of analyzing certain aspects of the dataset in greater detail (e.g. case studies focused on meteorological conditions preceding the incidents, or precise localization of avalanche tracks and reconstruction of dynamic properties of avalanches).
Author Contribution Statement
E.A.P. designed and performed the research, collected and analyzed data, wrote and revised the paper. K.I. performed research, contributed and analyzed data, commented on the manuscript. V.E.S. collected and contributed data and commented on the manuscript. N.E. provided new analytic tools and commented on the manuscript, contributing to revisions of the paper.
Acknowledgements
We thank S. Matoba for help with collecting Japanese meteorological records from Sakhalin and the Kuril Islands for the first half of the 20th century. The research leading to these results was made possible by funding from the People Programme (Marie Curie Actions) of the European Union’s Seventh Framework Programme (FP7/2007–2013) under REA grant agreement No. 298672 (FP7-PEOPLE-2011-IIF, ‘TRIME’). E.A.P. is grateful for the above support and also to E.A. Hardwick for improving the English in the manuscript, to Y. Ito for comments on the manuscript and to T. Nakamura and Y. Seo for discussions about historical aspects of the paper. K.I. acknowledges financial support partially from Grant-in-Aid for Scientific Research of JSPS (Japanese Society for the Promotion of Science) to collect archival materials that made this study possible. Finally, we thank two anonymous referees for constructive criticisms, and the editors, P. Bartelt and T.H. Jacka, for suggestions that helped to improve the paper.
Appendix
Figure 24 provides a summary of meteorological data extracted from the Monthly Reports of the Meteorological Observatory of Japan for 1913–40 (CMO, 2013). It shows computed anomalies (the standardized difference from the mean) of two-month-averaged (January and February) records of monthly mean air temperature, total monthly precipitation, maximum 24 hour precipitation and monthly mean wind speed for old Japanese meteorological stations located on Sakhalin Island (Honto, Maoka, Ootomari, Otiai and Sikka) and at Syana in the Kuril Islands (see Fig. 7b for locations). Note that we do not provide records before 1913 or after 1940, since they are not available, at least not through open access. However, due to the exceptional number of avalanches in the 1930s we consider that the 1913–40 period is sufficient for evaluating the climate impact on the avalanche statistics.
Anomalies of two-month-averaged (January and February) records of (a) monthly mean air temperature, (b) total monthly precipitation, (c) maximum 24 hour precipitation and (d) monthly mean wind speed for six old Japanese meteorological stations located on Sakhalin (Honto, Maoka, Ootomari, Otiai,and Sikka) and at Syana in the Kuril Islands.

From Figure 24 it can be seen that anomaly signals are more homogeneous for air temperature and wind speed, and that there is more inter-station variability for precipitation records. Main results of the multivariate regression analysis are shown in Figure 25 and Table 4. We tested three methods (two multivariate regressions with different numbers of variables and stepwise selection), all of which led to the same conclusions: that the incident anomaly (as well as burial or disaster index anomalies) was mainly driven by population and monthly mean or maximum 24 hour precipitation terms. The overall model tests are provided in Tables 4 and 5. Table 4 shows that both regression models for the incident anomaly have comparable R 2 values (0.62 and 0.75, respectively) with statistically significant p –values (p < 0: 001), meaning that our predictor variables significantly explain >62% of the variance in the predicted variable. In particular, Figure 25 illustrates that both models explain the 1915 and 1935–40 incident anomaly peaks relatively well, but mispredict a peak in 1927.
Results of two multivariate regression models with different numbers of population and meteorological variables.

Evaluation of models’ output

Coefficients of two regression models for incident anomaly with their 95% confidence intervals


 Open access

