


Introduction
Since the release of its first version in February 2012, the Randolph Glacier Inventory (RGI) has been a centerpiece of glaciological research and successfully applied in a range of glacier change studies, as well as in impact assessments of glacial change at global and regional scales (Pfeffer and others, Reference Pfeffer2014; Hock and others, Reference Hock2019). The latest version (6.0) of the RGI was released in July 2017 (RGI Consortium, 2017). In it, glacier outlines and their accompanying attributes in RGI are provided as shapefiles (a vector format). In addition, a gridded glacier map is supplied at 0.5° spatial resolution in which zonal records of glacierized areas (in km2) are stored in a plain-text .DAT file (RGI Consortium, 2017). However, there are significant differences in total glacierized area between the gridded and the shapefile data in RGI 6.0, at both global and regional scales (Table 1).
Area comparison between the shapefile and gridded map in RGI 6.0
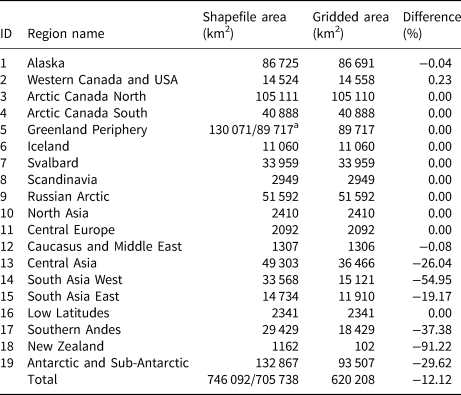
a The total area of the region is 89 717 km2 if glaciers strongly connected to Greenland ice sheet (~40 354 km2) are excluded.
Climate change studies frequently rely on gridded datasets, which are easy to use and comprise an effective tool for various glaciological and climatic applications, including, but not limited to, glacier change assessments (e.g. Brun and others, Reference Brun, Berthier, Wagnon, Kaab and Treichler2017), glaciological characteristics (e.g. Scherler and others, Reference Scherler, Wulf and Gorelick2018), assessing glacier response to climate change (e.g. Sakai and Fujita, Reference Sakai and Fujita2017), hydrology-related research (Huss and Hock, Reference Huss and Hock2018) and modeling glacier changes (e.g. Raper and Braithwaite, Reference Raper and Braithwaite2006; Shannon and others, Reference Shannon2019). Increasingly, global and regional gridded datasets at different resolutions, such as the outputs of Coupled Model Intercomparison Project phase 6 (CMIP6, Eyring and others, Reference Eyring2016), are emerging and gridded data are critical for linking between glaciers and the corresponding meteorological variables. In this study, we identify errors in the currently available global gridded glacier dataset and present a new global gridded glacier dataset based on the RGI 6.0 which used an alternative gridding method to eliminate the errors.
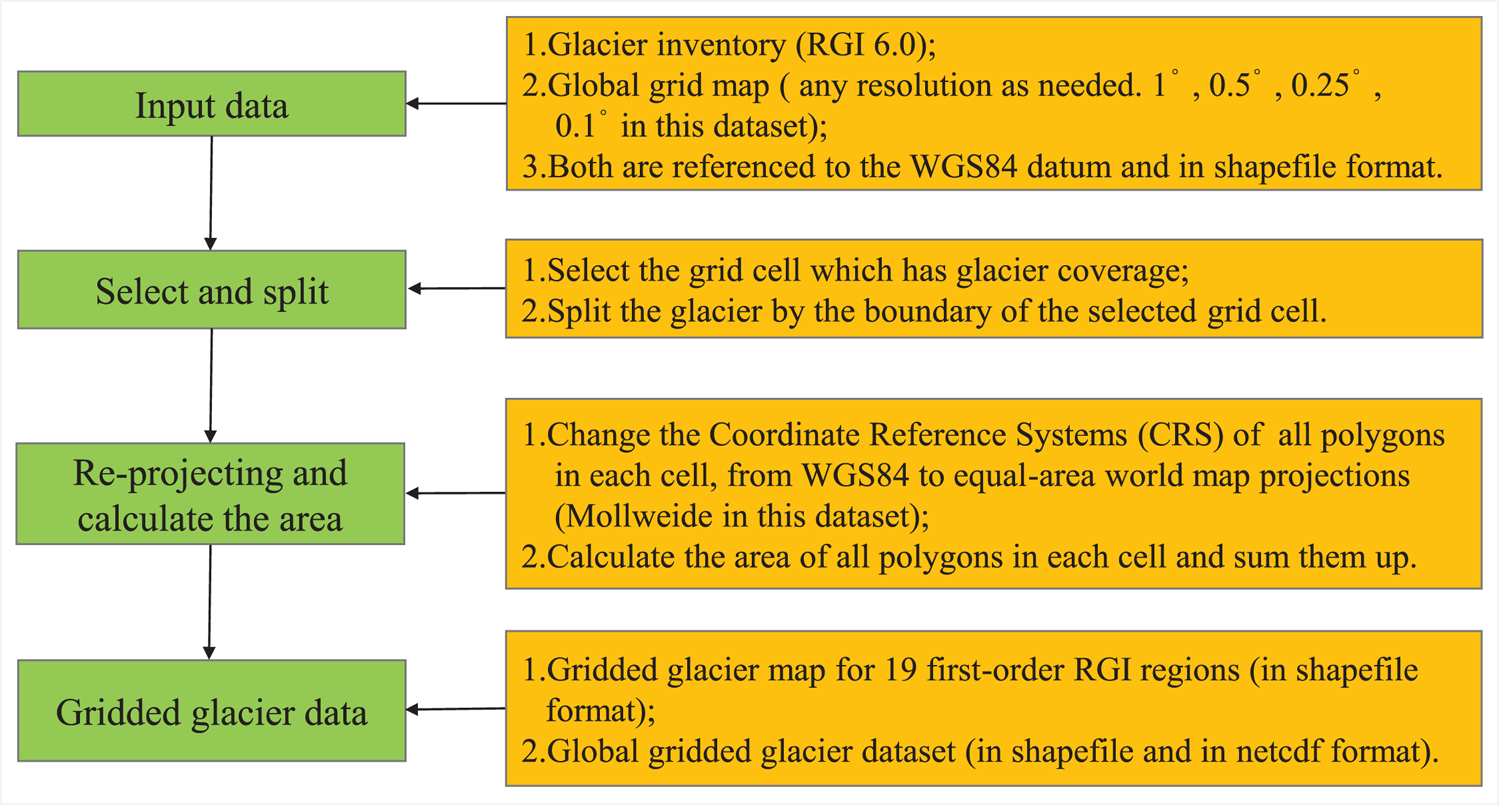
Data and methods
We obtained the RGI 6.0 shapefiles as input (original) data, as well as the 0.5° × 0.5° grid data for the (following) comparative analysis, both of which are freely available at GLIMS (https://www.glims.org/RGI/rgi60_dl.html). The steps to generate the gridded dataset are shown in Figure 1. First, we produced the global grid map at a given resolution which is referenced to the WGS84 datum. Second, we split the glaciers using the boundaries of the cell. Third, we re-projected all polygons in the cell to Mollweide projection and recalculated the area of each polygon in the cell, and then summed them up to get the total glacier area of the cell at last (Fig. 1). Compared to the previous method, which typically uses the center point of glaciers and attributes the area to the cells in which the center point is located (so-called CP method), we eliminated the error caused by the glaciers overlapping grids which is unavoidable in the CP method. Since the sources of glacier inventory outlines are remarkably diverse, we recommend using the method by Pfeffer and others (Reference Pfeffer2014) to propagate uncertainty, as this eliminates the effort of the inventory source. The errors for each grid in the 0.5° dataset are provided in the Supplementary material.
Schematic representation of gridded glacier data.
Results and application
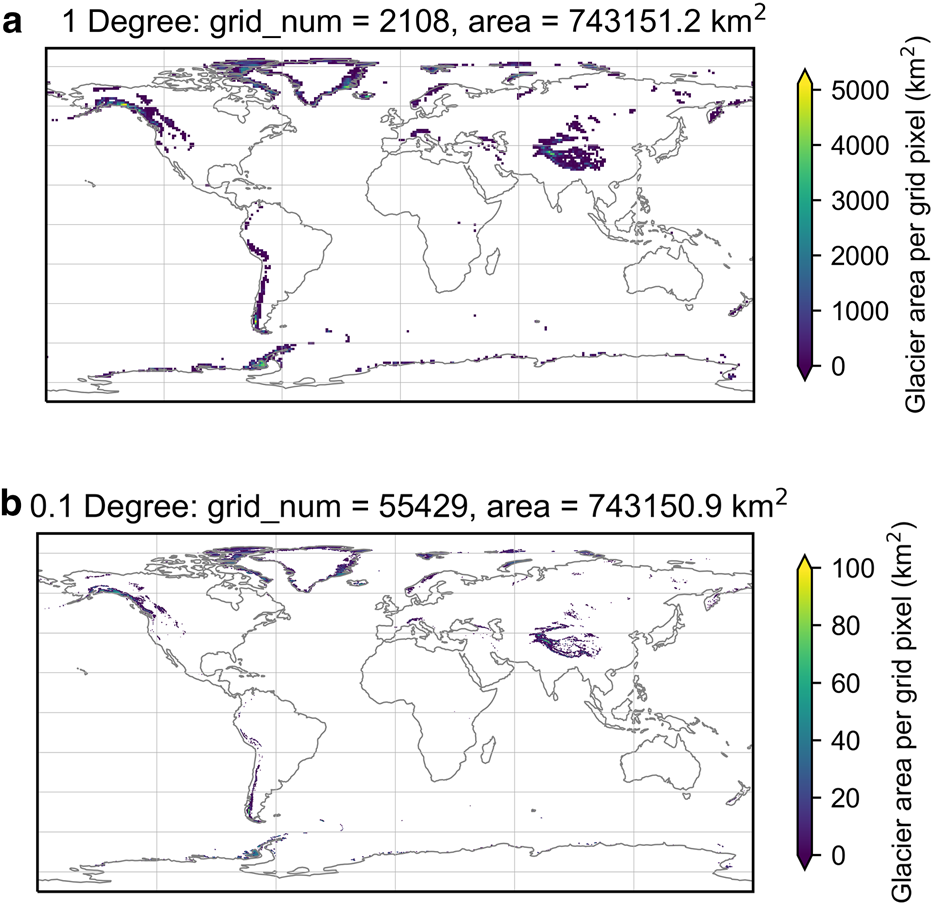
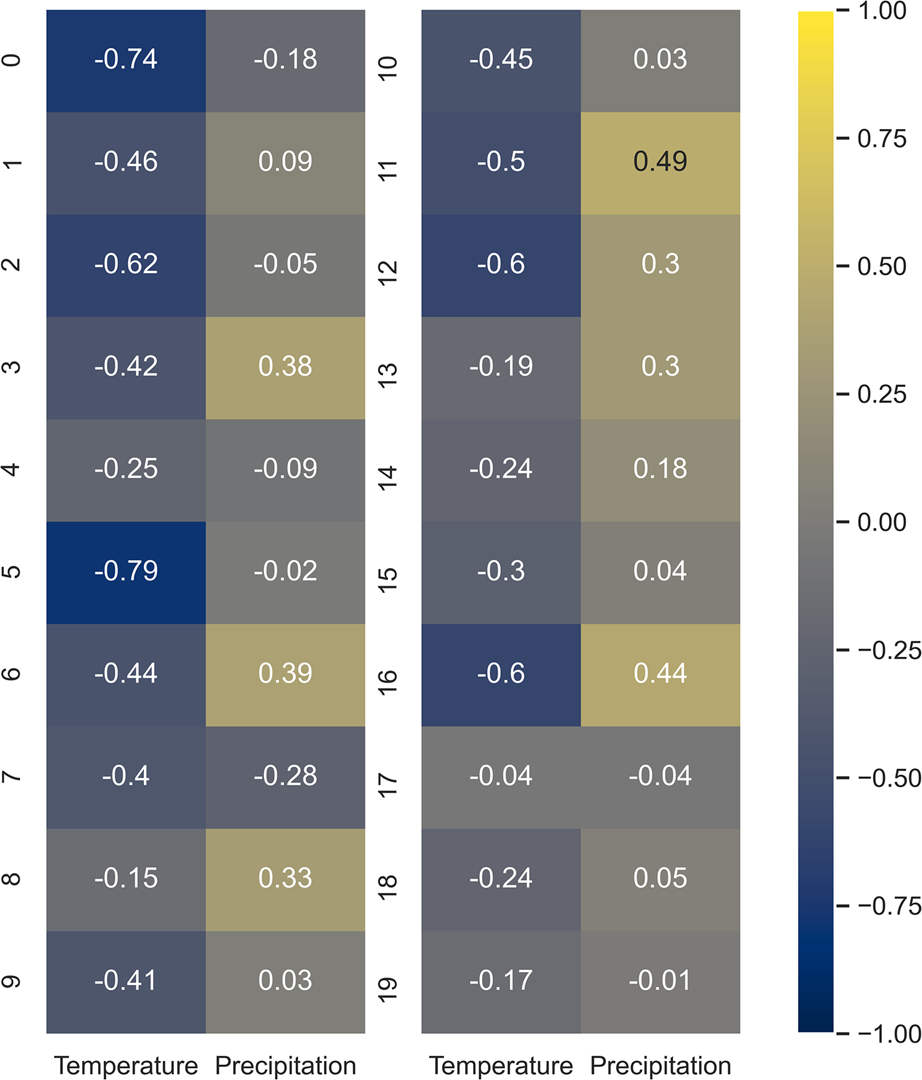
Here, we present the new global gridded glacier dataset based on the RGI 6.0. We provide four spatial resolutions of 1° × 1°, 0.5° × 0.5°, 0.25° × 0.25° and 0.1° × 0.1° as options to meet the requirements of different users (Fig. 2). It is noteworthy that glaciers strongly connected to the Greenland ice sheet (~40 354 km2) are included into our gridded dataset. Our approach and code (data availability) are directly applicable to future regional and global glacier inventories. In addition, some attributes of glaciers could also be re-gridded by using our method. For example, we made a gridded dataset of supraglacial debris based on Herreid and Pellicciotti (Reference Herreid and Pellicciotti2020) with a spatial resolution of 0.5° × 0.5° with this method (Fig. S1).
Global gridded glacier map with two spatial resolutions. Grid_num means the number of glacierized grids.
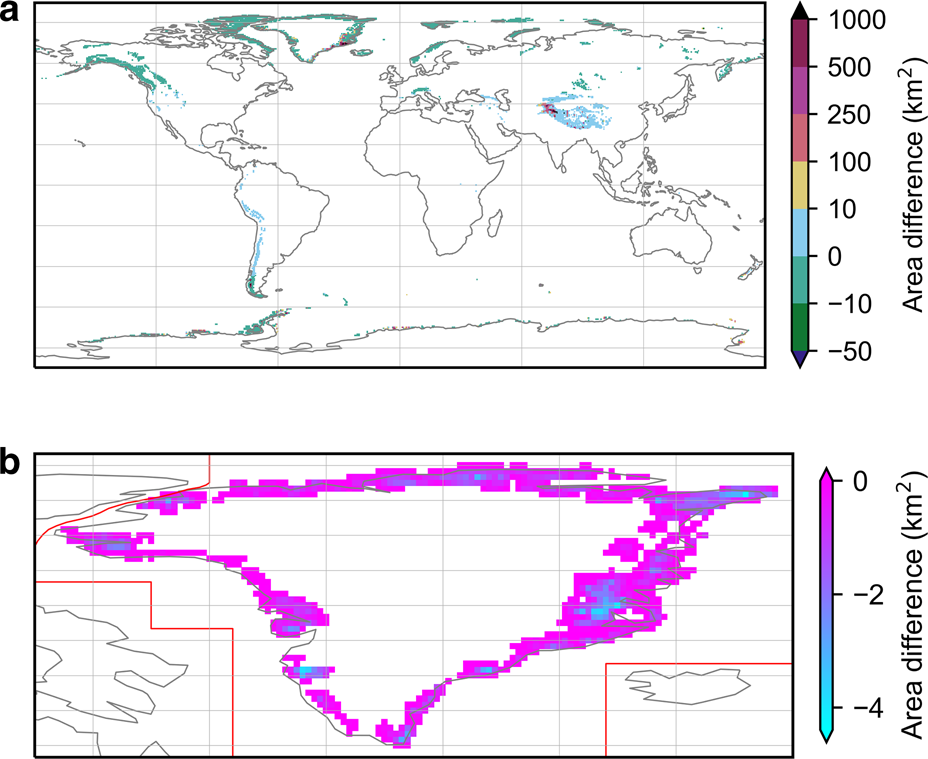
In Figure 3, we show a grid-based comparison between our dataset and the RGI gridded glacier dataset at 0.5° spatial resolution. As for the Greenland Periphery, given that glaciers strongly connected to the Greenland ice sheet (~40 354 km2) are excluded from RGI gridded dataset, another version is created with our method (Fig. 1) for verification of the reliability of the new gridded glacier dataset (Fig. 3b). Our results are consistent with the RGI 6.0 gridded data for many regions, but we compute very different gridded areas for High Mountain Asia, Southern Andes, New Zealand and Antarctic and Sub-Antarctic regions, where the RGI shapefile and gridded areas differ greatly to one another. Our dataset greatly reduced errors existing in the RGI gridded glacier map (Table 2). The accuracy of our gridded dataset depends critically on the selection of map projection and the method for area calculation. Since there is no previous study which utilized glacier polygons split by the boundaries of the cell for reference, we compared the area of each glacier provided by the RGI Consortium and the recalculated area to assess the map projection and the calculation method we used is reasonable or not (Fig. S2). We found that the recalculated area of each glacier was ~0.3% smaller than the RGI-provided area. However, 0.3% is considerably smaller than the uncertainty of the glacier extent in RGI (~5%, Pfeffer and others, Reference Pfeffer2014).
(a) Grid-based comparison between the new dataset and RGI gridded glacier dataset at 0.5° spatial resolution globally. (b) Comparison of glaciers in Greenland periphery in two datasets when glaciers strongly connected to Greenland ice sheet are excluded.
Area difference between the RGI 6.0 shapefile values and the new gridded dataset values for each region
a Greenland glaciers strongly connected to the ice sheet are included.
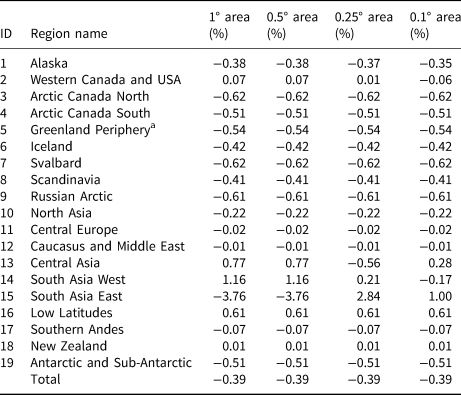
We demonstrate the application of our gridded dataset with two examples. First, we use two glacier inventories for the alps (Paul and others, Reference Paul, Frey and Le Bris2011, Reference Paul2020) to demonstrate the utility for glacier area change assessments. It is always hard to perform a glacier-by-glacier area change assessment between the latest and the earlier inventories due to the inhomogeneous interpretation of glacier extents, but a cell-by-cell comparison could reveal the spatial variability of glacier area changes (Fig. 4). The uncertainty in area change for each grid could be assessed following the law of error propagation:

where e i means the grid error in the initial state and e f means the grid error in the final state, both of which could be calculated using the method by Pfeffer and others (Reference Pfeffer2014). Second, we use this gridded dataset to determine correlation (Pearson coefficients) between glacier variations and climate changes on global scale for the period 1981–2016 (Fig. 5). The annual mass balance is derived from the latest compilation dataset of direct and geodetic observations developed by Zemp and others (Reference Zemp and Huss2019). By using the method of area weighted average (Li and others, Reference Li, Ding, Shangguan and Wang2019) which is dependent on the glacierized areas (in km2) in each cell, the annual climate variable series (including temperature and precipitation) for each first-order region can be derived from the ERA5 dataset with 0.5° × 0.5° resolution (Hersbach and others, Reference Hersbach2020). The results show that there is a higher level of correlation between mass balance and temperature than between mass balance and precipitation (Fig. 5).
(a) Glacier inventory of the Alps in 2003; (b) glacier inventory of the Alps in 2015 and (c) gridded area change (0.1° × 0.1°) between the two glacier inventories (in km2).
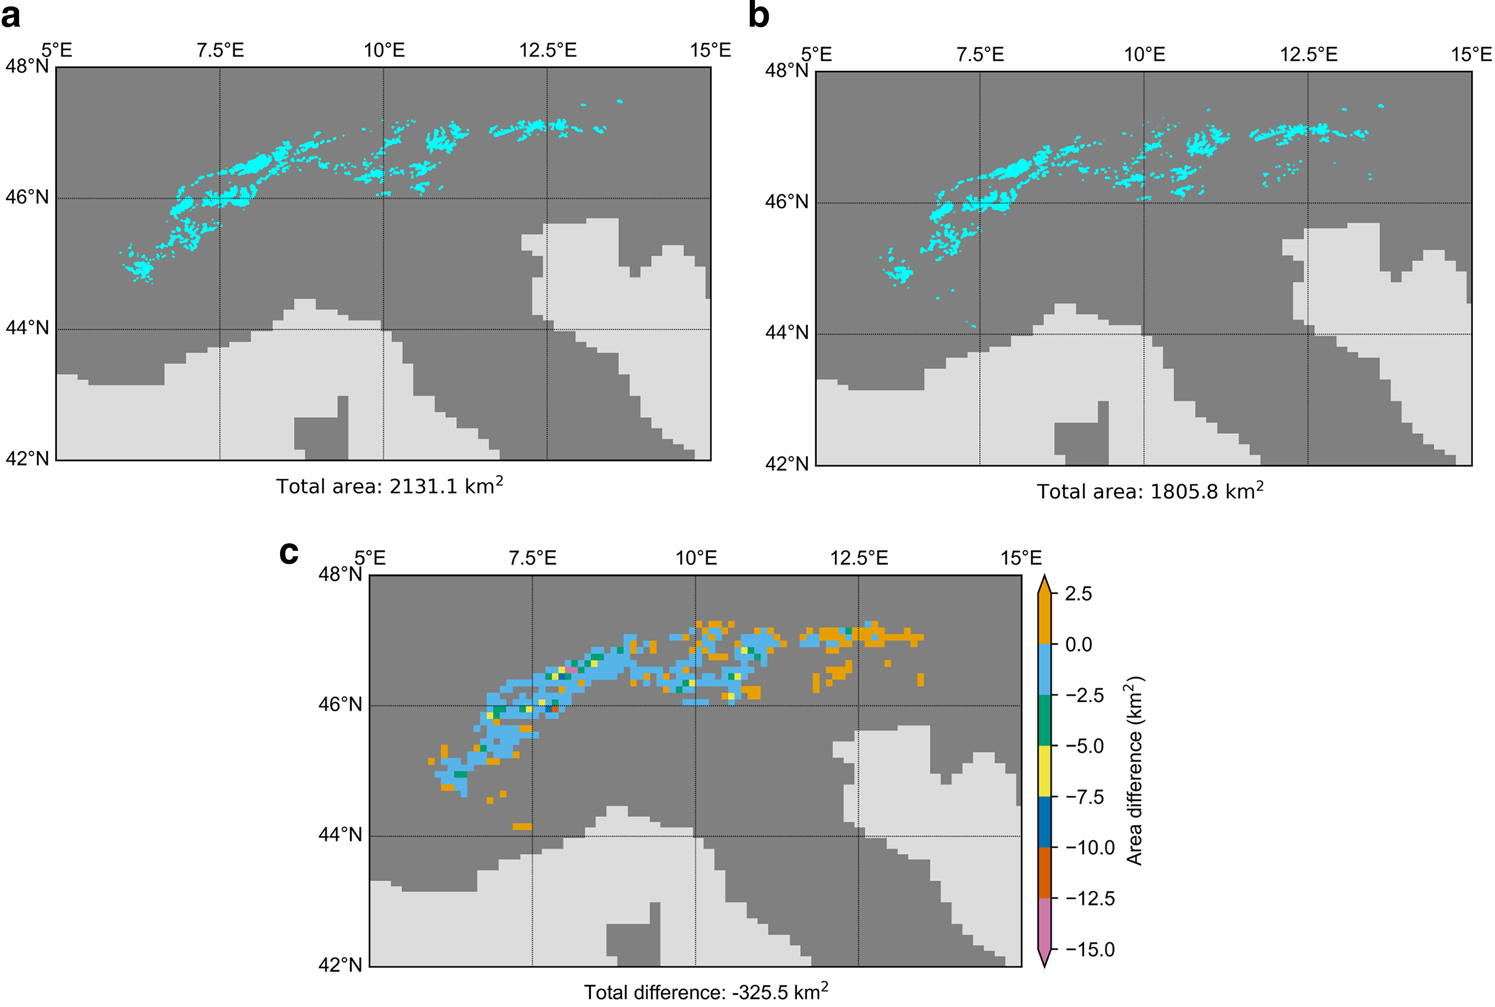
Pearson correlation coefficients between annual mass balance and glacier area-averaged temperature and precipitation over the 1981–2016 period. Integers from 1 to 19 on the y-axis corresponding to the ID of the 19 RGI regions as defined in Table 1. The number 0 represents correlation coefficients on the global scale.
We acknowledge that addressing the issue of gridded glacier maps in the RGI 6.0 is not technically difficult. However, it is an academic issue that must be overcome in order to provide more accurate datasets for glaciological research.
Conclusions
There are significant differences in the total glacier area between the gridded data and the shapefile data in the RGI 6.0 at both global and regional scales. Based on the RGI 6.0, we developed a new global gridded glacier dataset which reduced the errors of the RGI gridded glacier map. Moreover, we demonstrated the application of this gridded dataset with two examples.
Supplementary material
The supplementary material for this article can be found at https://doi.org/10.1017/jog.2021.28.
Data
The datasets and the code can be downloaded from https://github.com/rylanlee/RGI-Gridded.git and is linked on https://www.glims.org/RGI/rgi60_dl.html.
Acknowledgements
This study is funded by the Strategic Priority Research Program of the Chinese Academy of Sciences (Grant No. XDA19070501) and the Ministry of Science and Technology (Grant Nos. 2018|FY100502 and 2018YFE010010002). A special acknowledgement should be expressed to China–Pakistan Joint Research Center on Earth Sciences that supported the implementation of this study. We express our appreciation to Evan Miles and one anonymous reviewer, Hester Jiskoot (Chief editor) and Neil Glasser (Scientific editor) for their constructive and meaningful comments that helped in improving this paper.


 Open access