




Introduction
Automated outbreak detection systems (AODS) support infection control departments in timely identification of possible outbreaks. Reference Aghdassi, Kohlmorgen and Schroder1,Reference van Mourik, van Rooden and Abbas2 Current AODS usually count the number of newly detected colonized or infected patients with targeted micro-organisms at a specific hospital location at the time of sampling. Reference Sim, Pinto and van Mourik3 Two examples are the percentile-based system (P75), Reference Sim, Pinto and van Mourik3 currently employed in our tertiary care hospital, and the statistics-based CLuster AleRt system (CLAR), Reference Aghdassi, Kohlmorgen and Schroder1 implemented in several German hospitals. P75 signals a potential outbreak when the prespecified threshold is exceeded, while CLAR applies statistical models to detect significant temporal outbreak signals, adjusting for baseline incidence and variation.
However, given the sometimes prolonged incubation periods and frequent patient transfers within healthcare facilities, incorporating the patient’s in-hospital movement pathway into the AODS may also be relevant for outbreak detection. Previous studies have shown that certain departments can function as central hubs within the hospital network, Reference Myall, Peach and Weiße4,Reference Price, Mookerjee and Dyakova5 and can significantly influence the likelihood of transmission events. Reference Donker, Wallinga, Slack and Grundmann6 In the context of hospital surveillance, groups of medical services and hospital wards, such as internal medicine or oncology, can be considered as epidemiologically linked units. Reference Pi, Expert, Clarke, Jauneikaite and Costelloe7,Reference Bean, Stringer, Beeknoo, Teo and Dobson8
This study aims to improve AODS by accounting for patient transfer history within healthcare facilities when identifying possible outbreaks. Earlier studies have shown that P75 and CLAR yield comparable results, but it remains unclear how their performance changes when patient transfers are incorporated. Reference Sim, Pinto and van Mourik3 In this study, P75 and CLAR were extended with three methods to account for patient in-hospital transfers. First, we determined if communities of epidemiologically linked wards, when integrated into AODS, contributed to more sensitive and timely identification of potential outbreaks than individual wards. Second, we incorporated individual patient’s movement history data into the AODS, by assigning newly detected colonizations or infections to both current and previously visited inpatient locations, with a final extension additionally accounting for time spent in each ward.
Methods
Study setting
This single-center retrospective cohort study used data from the University Medical Center Utrecht, a tertiary care hospital in the Netherlands with approximately 1,100 beds. The hospital comprises multiple specialized units, including hematology, oncology, neurosurgery, and cardiothoracic surgery. It also includes a dedicated pediatric hospital with pediatric and neonatal intensive care units (ICUs).
Study population
This study includes all patients admitted to inpatient locations between January 1, 2014, and December 31, 2021. Patients who objected to the use of their data for research purposes were excluded, as were patients with admissions lasting less than 4 hours and admissions to the emergency room, psychiatry, or military wards.
Data collection
Data on patient admission, discharge, and transfers were collected from the electronic health record (EHR) databases. For each admission and transfer, this included patient pseudo-ID, admission pseudo-ID, transfer-ID, patient age in years, admission and discharge dates, department names, code, and description. Transfers within a single department and specific bed or room numbers were not collected.
Data on all isolates obtained from microbiological cultures were collected from the laboratory information system and included both clinical and screening cultures. Data included patient pseudo-ID, specimen number, specimen date, specimen type, isolate number, and antibiotic susceptibility testing results. Susceptibility results were used to identify microorganism–phenotype combinations of interest (Table 1). For each patient, only the first isolate of a specific microorganism–phenotype combination per year was included, and all repeat findings within 365 days after the first finding were excluded.
Microorganism–phenotype–ward combinations of interest and selected for this study for AODS evaluation

Table 1. Long description
The table presents data on microorganism-phenotype-ward combinations of interest selected for AODS evaluation. It includes columns for organism, resistance phenotype, ward, and whether the combination was selected for AODS evaluation. The table has 15 rows and 4 columns. Organisms listed include Acinetobacter spp., Escherichia coli, Citrobacter freundii, Enterobacter cloacae, Klebsiella pneumoniae, Klebsiella oxytoca, Serratia marcescens, Pseudomonas aeruginosa, Stenotrophomonas maltophilia, Enterobacteriaceae, Candida norvegensis, Aspergillus fumigatus, Bacillus spp., PRSP, MRSA, MSSA, and Vancomycin-resistant enterococci. Resistance phenotypes range from specific antibiotic resistances to all isolates. Wards include all wards, specific wards like Hematology, ICU, NICU, and combinations of these. Selection for AODS evaluation varies by organism and ward, with some combinations selected for specific wards or epidemiologically linked wards.
Note: Antibiotic resistance and susceptibility were qualitatively described as “resistant’”(R), “intermediate’”(until 2020), or from 2021 onwards as “susceptible, increased exposure’”(I), and “susceptible’”(S), based on minimum inhibitory concentration (MIC) test results. All classifications followed EUCAST guidelines. Up until 2021 I and R classes were taken together as resistant, afterward the category I was considered susceptible. Abbrevations: ESBL - extended spectrum beta-lactamase, ICU - intensive care unit, MDR - multidrug resistant, MRSA - methicillin resistant Staphylococcus aureus, MSSA - methicillin susceptible Staphylococcus aureus, NICU - neonatal intensive care unit, PICU - pediatric intensive care unit, PRSP - penicillin resistant Streptococcus pneumoniae.
Automated outbreak detection systems
The outbreak detection algorithms used are the P75 and the CLAR system. Reference Aghdassi, Kohlmorgen and Schroder1,Reference Sim, Pinto and van Mourik3,Reference Schroder, Pena Diaz and Rohde9 The P75 system summarizes the monthly counts of new detections of a specific microorganism (and prespecified microorganism–phenotype combinations and/or wards under surveillance). The alert threshold is based on the 75th percentile of monthly counts for the preceding year and is recalculated annually. If a subsequent monthly count exceeds the threshold, an alert for a possible outbreak is generated.
The CLAR system was developed in-house by Charité University Hospital in Berlin and uses data from the previous 15 months to calculate a baseline incidence for organisms of interest. Reference Schroder, Pena Diaz and Rohde9 This baseline is then compared to the counts from the preceding 30 days. The CLAR system employs six different algorithms relying on different probability distributions, and an alert is generated when any threshold is exceeded.
In both systems, alerts are generated for individual wards. To distinguish between first and repeated alerts related to the same possible outbreak, each alert was assigned an alert series identifier. Alerts occurring within 30 days of a previous alert were considered part of the same series. The earliest alert in a series was labeled as the first alert, and any subsequent alerts were labeled as repeated alerts.
Grouping ward communities
Communities of wards with frequent patient exchanges were identified using network analysis. An undirected graph was generated, with edges representing patient transfers between hospital departments (the nodes). Hospital admissions were used as the unit of analysis. Network analyses were performed separately for the adult and pediatric hospital buildings, as exchange between these facilities is very uncommon. Patients without transfers were excluded from the network analysis. Wards with few admissions and ambulatory care wards, such as the clinical IVF treatment center, were also excluded.
Incorporating patient transfers
To assess the influence of patient transfers on the detection of potential outbreaks, we extended the P75 and CLAR AODS systems, which included only the ward at the time of culture, with three alternative system configurations (Figure 1).
Overview of the different AODS variants using a hypothetical example of a single patient (A, C, D) or a hypothetical network of patient transfers (B). The colors indicate whether a microorganism finding is assigned to a ward and included in the AODS (orange) or not (blue). The number inside each circle represents the score assigned to that ward within the AODS. (A) The base case AODS. (B) All findings within wards in a ward community group are added together (as being one epidemiological unit). (C) Individual patient history—scoring based on each previously visited ward. (D) Individual patient history—time spent per ward. Scoring based on the number of days spent at previously visited wards.

Figure 1. Long description
The diagram presents an overview of various Automated Outbreak Detection System (AODS) variants using hypothetical examples. It includes a single patient’s journey through different hospital wards and a network of patient transfers between wards. The colors blue and orange indicate whether a microorganism finding is assigned to a ward and included in the AODS. Blue circles represent wards with no points assigned in the AODS, while orange circles represent wards with points assigned. The number inside each circle signifies the score assigned to that ward within the AODS. Panel A shows the base case AODS where a patient moves from the Intensive Care Unit (ICU) to Medium Care and then to a Nursing Ward, with a positive test result. Panel B illustrates a network with ward community grouping, where findings within wards in a community group are combined. Panel C depicts individual patient history scoring based on each previously visited ward. Panel D shows individual patient history scoring based on the number of days spent at previously visited wards.
In the first extension, individual wards were grouped into ward communities (ie, epidemiologically linked wards with frequent patient transfers) using Louvain clustering. Reference Blondel, Guillaume, Lambiotte and Lefebvre10 Ward groupings from the preceding year were incorporated into the AODS as predefined epidemiologically linked units.
In the second extension, individual patient transfer history was incorporated by assigning the cultures to all wards visited within the previous 14 days. Each previously visited location received a count of 1, regardless of the duration of stay.
In the third extension, each previously visited location received a score equal to the number of days the patient had spent there within the previous 14 days, such that longer stays resulted in higher cumulative scores.
To assess the impact of our extensions we simulated prospective use of each approach using retrospective data for a selection of micro-organisms and ward types (Table 1) that we consider representative to interpret the performance. Each system version was run for each calendar week using data known up to that timepoint, and for each week generated alerts were documented.
All analyses were performed in R using RStudio (version 4.4.1 (2024.06.14)). Network analyses used the cluster_louvain function from the igraph R package. Reference Csárdi and Nepusz11,Reference Csárdi, Nepusz, Traag, Horvát, Zanini, Noom and Müller12 R code and a detailed description of ward grouping and patient transfer extensions are available on Github (https://github.com/susannepinto/AODS_patient_movements).
Assessment of AODS extensions
Differences between AODS variants were assessed descriptively and by expert-opinion assessment from infection prevention experts for a selection of microorganisms (Table 1).
Descriptive assessment of alerts
To compare alerts generated by the eight AODS variants, both the number of identical alerts and the number of distinct alerts were quantified. Alerts were considered identical if they matched in microorganism–phenotype combination, location, and alert date. We specifically examined alerts not identified by the base case P75 system. Performance metrics included the mean number of alerts, mean number of patients per alert, average alert duration, and, where applicable, the percentage of repeated alerts. These analyses could not be performed for 2014 because the systems require data from the preceding year as baseline.
Assessment by infection prevention experts
A randomized selection process was used to curate a balanced sample of alerts for expert review. This sample included unique alerts from each AODS variant for selected microorganism–phenotype combinations (Table 1) and alerts generated by patient transfer-based systems that were not present in the base case P75 method.
Selected alerts were then divided into two sets. Four infection prevention experts, including two in training, independently reviewed one set in random order. Alerts were scored as:
-
1. Not relevant
-
2. Good to know (monitor for new cases)
-
3. Good to investigate (review patients or create an epidemiological curve)
-
4. Immediate action required (implement additional measures)
For interpretation, scores 3 and 4 were combined. Agreement was assessed using heatmaps and Cohen’s Kappa, calculated with the kappa2 function from the irr R package. Reference Gamer13 Differences in scoring were tested using a linear model with the glm function from the stats R package. 14
Results
Patient transfers and network analysis
The data set included approximately 150,000 patients, of whom around 27,500 (∼18%) had at least one positive microbiological culture between 2014 and 2021. A total of 486 patients objected to the use of their data and were excluded. The median length of stay per ward was 5.5 days, and patients had on average 3.7 transfers during their hospital stay. The data set used for network analyses (excluding short admissions, patients without transfers, and within-ward transfers) contained about 210,000 patient transfers for the entire study period.
Yearly ward communities were identified by Louvain clustering. For example, in 2019, five ward groups were identified for the adult building: one group consisting of wards connected to the adult ICU, one comprising cardiothoracic wards, one including internal medicine wards, one grouping neurology, and neurosurgery wards, and a remaining group containing several nursing wards. At the pediatric location, wards are grouped into three groups: one including mothers pre and postdelivery, a second including neonates and the NICU, and a third including all other pediatric wards (Figure 2). Because wards have been opened and closed over time, these groupings changed across years. However, ward group membership remained largely stable (S1 Figure and S2 Figure).
Networks of the adult (A) and pediatric (B) locations for 2019, grouping the wards has been performed with the Louvain clustering approach. Nodes represent wards, with color codes per ward grouping, edges represent patient transfers, with color scale and with indicating the number of transfers.

Figure 2. Long description
A heat map visualizing patient transfer networks in adult and pediatric hospital wards for 2019. The map uses nodes to represent different wards, with color codes indicating ward groupings. Edges between nodes represent patient transfers, with the color scale and width of the edges indicating the number of transfers. The adult ward network (A) and the pediatric ward network (B) are shown separately. The Louvain clustering approach groups the wards, and the color intensity of the edges reflects the frequency of patient transfers between wards. Notable clusters and high-transfer regions are visually distinguishable, providing insights into the flow of patients within the hospital.
Descriptive assessment of AODS alerts
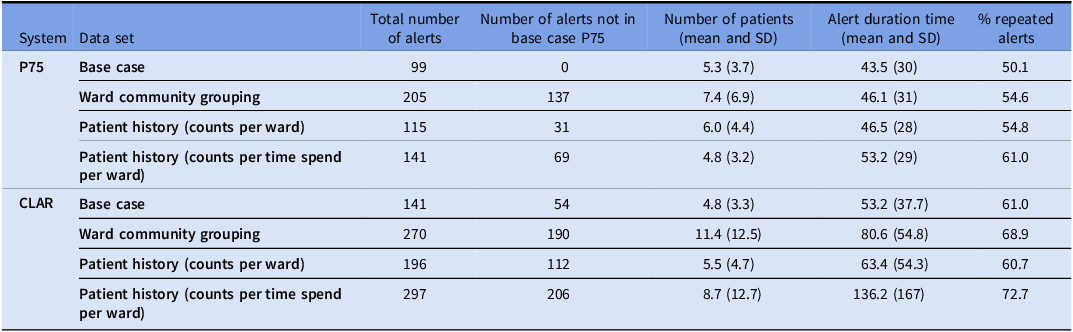
The total number of alerts differed between all AODS variants (Table 2 and S1 Table). The base case P75 generated the fewest alerts, whereas the CLAR AODS incorporating patient transfer history weighted by time spent per ward generated the most unique alerts. Despite generating the highest number of alerts, 73% were repeated alerts (Table 2). The CLAR system extended with ward community grouping included more patients per alert on average than the other systems (Table 2). When stratified by microorganism, these patterns showed only minor variation (S1 Table).
Summary table showing the alert characteristics for different selected AODS methods and extensions. These result include the micro-organisms selected for AODS evaluation see Table 1 (last column)

Table 2. Long description
The table presents a comparison of alert characteristics for various AODS methods and extensions. It includes data on the total number of alerts, the number of alerts not in the base case, the number of patients, and the alert duration time. The table has 10 rows and 6 columns. The columns are labeled System, Data set, Total number of alerts, Number of alerts not in base case P75, Number patients P75, Alert duration time, and percentage repeated alerts P75. The rows are labeled with different systems and data sets, such as P75 Base case, Ward community grouping, Patient history counts per ward, Patient history counts per time spend per ward, and CLAR Base case. Notable trends include the base case P75 generating the fewest alerts and the CLAR AODS incorporating patient transfer history weighted by time spent per ward generating the most unique alerts. The CLAR system extended with ward community grouping included more patients per alert on average than the other systems.
Note: Average alert duration is calculated as the mean time difference between the earlier and latest date associated with an alert.
Overall, CLAR-based AODS generated substantially more unique alerts than P75-based AODS (S3 Figure). The highest number of unique alerts was generated AODS incorporating ward community grouping, for both P75 and CLAR (S3 to S5 Figure). Computation time was longer for CLAR-based systems than for P75-based systems and for AODS incorporating patient transfer history compared to the base case and ward community grouping approaches.
Assessment of AODS alerts
The interrater agreement among experts assessing selected possible outbreaks was moderate and statistically significant (P < .01), with Kappa values of 0.631 for the first selection and 0.429 for the second. In both selections, the more experienced infection prevention expert judged alerts as more relevant than the expert in training (S6 Figure).
Figure 3 shows the differences in alert scoring by AODS, method, and their combination. Both base case P75 and CLAR systems included a proportion of alerts scored as not relevant. The P75 AODS incorporating ward community grouping had the lowest proportion of non-relevant alerts, but also the fewest highly relevant alerts (Figure 3C). Only alerts unique to each system were evaluated, which limited direct comparability.
Results of alert judgment by infection prevention experts of the study hospital for A) differences between AODS framework, B) differences between patient transfer incorporation methods, and C) differences between the combination of AODS and patient transfer incorporation method. A score of 1: the alert is scored as “not relevant/suspicious,” a score of 2: “good to know (wait and observe for new findings),” a score of 3: “good to research (looking up patients or making an epi-curve) or immediate action required (intervention with additional measures).”

Figure 3. Long description
The image contains three bar graphs. The first graph, labeled A, shows the proportion of average scores by AODS, comparing P75 and CLAR. The second graph, labeled B, displays the proportion of average scores by method, including base case, Louvain clustering, and patient history with different counting methods. The third graph, labeled C, illustrates the proportion of average scores by the combination of AODS and method. Each bar represents different scores: red for 1, green for 2, and blue for 3. The graphs highlight variations in alert judgments by infection prevention experts based on different AODS and methods.
According to the first two experts, the best-performing systems were the P75 AODS incorporating patient transfer history (counts per ward) and the CLAR AODS incorporating time-weighted patient transfer history (counts per day per ward). In contrast, the second pair of experts identified the P75 base case as the top-performing method (S7 Figure). Repeated alerts were generally rated as more relevant than first alerts (S7 Figure).
Discussion
This study demonstrates that incorporating patient transfer history into AODS can increase the detection of possible outbreaks requiring follow-up or investigation. Extending a percentile-based AODS to include individual patient transfer history (wards visited in the prior 14 days) had the most favorable balance between increased detection and alert relevance.
One of the challenges when extending AODS to improve detection of previously unnoticed potential outbreaks is the increase in false positive alerts. These additional alerts increase workload for infection prevention experts, who must assess each alert to distinguish true outbreaks from noise. A higher alert burden may contribute to alert fatigue and reduce the effectiveness of alert response. Incorporating additional data therefore requires careful calibration to ensure that AODS remain practical for routine use.
Prolonged outbreaks with low case numbers present a particular challenge for AODS based on statistical or threshold methods, as such systems may fail to recognize slow-moving transmission patters. Accurately defining and incorporating microorganism-specific transmission and incubation periods remains a challenge and warrants further investigation. In this study, we used a fixed 14-day look-back window for inpatient transfers, although this may not be optimal for all organisms. Depending on the microorganism, patient characteristics, and culture practices, shorter or longer look-back periods may improve accuracy.
Possible outbreaks identified in this study were not routinely confirmed using bacterial sequencing or typing. Previous studies incorporating molecular typing or resistance-profile matching have shown that only a subset of algorithmically detected outbreaks represent true clonal transmission events. Reference Jon E.Edman-Wallér, Karp, Rizzardi, Jacobsson and Maria Werner15–Reference Miles-Jay, Snitkin and Lin18 Real-time whole-genome surveillance may further improve validation and prioritization of alerts. Additionally, AODS operate at species level, hence it overlooks outbreaks driven by horizontal transfer of antimicrobial resistance genes across species. Reference Marimuthu, Venkatachalam and Koh19
Several AODS exist beyond P75 and CLAR. For example, WHONET integrated with SaTScan has also been used to detect space–time potential outbreaks in laboratory data. Reference Huang, Yokoe and Stelling17 Although this approach offers a standardized and widely used framework, our earlier comparative evaluation demonstrated that WHONET-SaTScan was less sensitive to increases above baseline than P75 and CLAR, resulting in fewer detected potential outbreaks. Reference Sim, Pinto and van Mourik3 For this reason, it was not further evaluated in the present study. Another important consideration is the choice of network clustering technique used to group hospital wards. Although ward community grouping improved detection of previously overlooked possible outbreaks, results are likely influenced by hospital-specific structures and patient flow patterns. No single clustering approach is universally optimal, and future work should explore which methods perform best under varying institutional conditions.
This study focused exclusively on bacteria and fungi. Findings may not be generalizable to nosocomial transmission of viral pathogens, which differ in incubation periods, transmissibility, and are often identified through syndromic rather than culture-based surveillance. Moreover, threshold-based systems depend on historical data, meaning that prior events can influence thresholds and bias detection in subsequent years. Finally, handling repeated alerts remains a challenge. Although repeated alerts increase workload, they often involve a higher number of patients and are frequently necessary to recognize potential outbreaks. This also underscores that balancing sensitivity with alert burden remains an important consideration for AODS design.
In sum, integrating patient transfer data into AODS improved the detection of potential hospital outbreaks. Further refinement of system parameters, including microorganism-specific look-back periods and context-specific configuration of AODS may improve precision and usability. Systematic evaluation of generated alerts will support ongoing optimalization and contribute to more effective infection prevention practices.
Supplementary material
The supplementary material for this article can be found at https://doi.org/10.1017/ice.2026.10485.
Data availability statement
R code is available via GitHub (https://github.com/susannepinto/AODS_patient_movements). Data are not made publicly available due to sensitive data fields containing that could lead to indirect patient identification.
Acknowledgments
We would like to extend our sincere gratitude to the UMC Utrecht infection prevention experts who contributed their time and expertise in the scoring of the selected times series used in this study. We also gratefully acknowledge Softmedex, and in particular, Peter Geytenbeek, for their valuable support in the conceptualization and interpretation of this work. Finally, we acknowledge the colleagues at Institute of Hygiene and Environmental Medicine at Charité University for making the CLAR algorithm available for this project.
Author contributions
SP and MvM were involved with study conception and design, data collection, and analysis. MvM was involved with ethics approval. SP, MAMH-dZ, and MvM were involved with interpretation of results and manuscript preparation.
Financial support
SP, MAMH-dZ, and the IP experts were funded under a collaboration project co-funded by the PPP Allowance made available by Health∼Holland, Top Sector Life Sciences and Health, to stimulate public–private partnerships. Open access funding provided by University Medical Center Utrecht.
Competing interests
The authors report no competing interests.
Ethical standard
Ethics approval and consent to participate: Waiver of consent was obtained from institutional review board for use of all data. However, for purposes of this study, persons who registered an objection to the use of their medical data were excluded.
Declaration of generative AI and AI-assisted technologies in the manuscript preparation process
During the preparation of this manuscript, the authors used generative AI to improve the English language and correct spelling and grammatical errors. After using this tool, the authors carefully reviewed and edited the text and take full responsibility for the content of the published article.
Consent for publication
Not applicable.




 Open access

