


Impact Statement
Unlike the flow around a single building (or bluff body), the wake behind a cluster of tall buildings – typical of modern urban environments – shows complex flow phenomena comprising individual wakes in the near-wake region, uniform wake velocity in the transition-wake region and then a merged wake similar to that of a single building in isolation in the far-wake region. The present paper aims to characterise and understand the turbulent fluctuating components’ behaviour about the mean flow and establish a link between the two. Additionally, we explore the scaling of the vortex shedding, highlighting the characteristic length scale associated with the different wake regions. Studies such as this can shed light on the disturbance that tall buildings impose on the urban boundary layer, challenging customary urban modelling assumptions, and could form the basis of urban planning guidelines aimed at increasing pedestrian comfort or better understanding wind loading on tall urban structures.
1. Introduction
Tall buildings are ubiquitous in urban areas to accommodate the growing population. These buildings, both in isolation and in clusters, interact with the atmospheric flows in a complex way, resulting in a significant change in wind comfort for pedestrians, dispersion of pollutants and local temperature (Reference Xu, Yang, Yoshida and TamuraXu et al. 2017; Reference Fuka, Xie, Castro, Hayden, Carpentieri and RobinsFuka et al. 2018; Reference Li, Schubert, Kropp and RybskiLi et al. 2020; Reference Marucci and CarpentieriMarucci & Carpentieri 2020a; Reference Makedonas, Carpentieri and PlacidiMakedonas, Carpentieri & Placidi 2021). As more buildings are being built with the growing population, it becomes important to understand the effect of these tall building clusters on the wind flow in the near- and far-wake regions.
Various attempts have been made to understand the characteristics of two-dimensional wakes behind multiple cylinder arrangements (Reference Alam, Zhou and WangAlam, Zhou & Wang 2011; Reference Burattini and AgrawalBurattini & Agrawal 2013; Reference Kahil, Benhamadouche, Berrouk and AfganKahil et al. 2019; Reference Zhang, Chen, Zhou and WangZhang et al. 2019; Reference Fang, Yang, Ma and LiFang et al. 2020; Reference Du, Chen, Dong, Ma, Xu and ZhaoDu et al. 2021; Reference Nguyen, Inam, Lasagna and XieNguyen et al. 2023). The interaction of wakes is highly sensitive to the gap between the cylinders and their orientation relative to the flow. Reference Kumar, Sharma and AgrawalKumar, Sharma & Agrawal (2008) conducted a numerical study on the flow around nine square cylinders placed normally to the flow direction at a Reynolds number (based on cylinder diameter,  $d$, and streamwise velocity at the inlet, $U_o$) of $Re_d=80$. They observed insignificant wake interaction when the gap between the cylinders ( $s$) was greater than $6d$. They have also noted a rapid decrease in the coefficient of mean drag and Strouhal number ( $St$) with an increase in $s/d$. On the contrary, the study of the flow around six square cylinders placed in the direction of flow by Reference Sewatkar, Patel, Sharma and AgrawalSewatkar et al. (2012) at $Re_d = 100$ showed that the mean drag coefficient increases with an increase in $s/d$. Reference Abbasi, Saha, Gu and YingAbbasi et al. (2014) studied the effect of $Re_d$ and $s/d$ on 4 square cylinders arranged in a $2\times 2$ array in the range $60 \leq Re_d \leq 175$ and $s/d=1, 3$ and $6$. They observed four distinct wake patterns depending on the spacing and Reynolds number. The effect of the Reynolds number was more profound for smaller spacing between the cylinders.
Reference Liu, Xiao and YangLiu, Xiao & Yang (2015) performed wind tunnel studies to understand the effect of array angles ( $\alpha$) and the spacing between the square cylinders, and observed that, at $\alpha =15^\circ$, the downstream cylinders experienced maximum lift force. Reference Zhang, Chen, Zhou and WangZhang et al. (2019) conducted particle image velocimetry (PIV) to study the flow around a $2\times 2$ array of square cylinders at different $s/d$ and $\alpha$. They observed that $St$ increases rapidly in the range of $10^\circ \leq \alpha \leq 20^\circ$ and becomes almost constant for $\alpha > 22.5^\circ$.
Reference Nguyen, Inam, Lasagna and XieNguyen et al. (2023) measured the wake flow characteristics of a  $2\times 2$ array of square cylinders using large-eddy simulations (LES) and observed that, in the cluster, the aerodynamic forces on each of the cylinders were significantly different from each other, and were highly non-stationary in nature. Reference Fang, Yang, Ma and LiFang et al. (2020) studied the effect of solid volume fraction (SVF) on the flow around an $8\times 8$ array of square cylinders at $Re=63\ 832$. They noted the suppression of vortex shedding and occurrence of large-scale eddies for SVF $< 0.49$.
In the majority of engineering applications, such as calculating aerodynamic forces on high-rise buildings, as well as the transport of pollutants around them, two-dimensional wake theory is not exactly applicable, primarily because of two reasons: (a) the finite height of the buildings, and (b) the buildings being immersed in a deep boundary layer.
Reference Castro and RobinsCastro & Robins (1977) studied the flow around a cube subjected to uniform and boundary-layer upstream conditions. They reported that separating shear layers reattached to the cube surface in the case of boundary-layer upstream conditions, unlike the uniform upstream flow. Reference Sakamoto and ArieSakamoto & Arie (1983) studied the effect of aspect ratio ( $AR=H_B/W_B$, where $H_B$ is the building height and $W_B$ is the building width) on the vortex-shedding phenomenon around a square and circular cylinder. It was observed that for $AR > 2$ ( $2.5$) for a square (circular) cylinder, the vortex shedding changed from arch type to a Kármán vortex. They have also given the relation between $St$ ( $=fw/U_0$, where $f$ is the frequency of the vortex shedding, $w$ is the width of the cylinder and $U_0$ is the free-stream velocity) and $AR$.
$AR$.
Reference Wang and ZhouWang & Zhou (2009) carried out experimental studies on the near-wake properties of a finite-sized square cylinder with the ratio of height ( $H_B$) to width ( $W_B$) of the building ranging from 3 to 7 at $Re=9300$. They observed that the near-wake region is characterised by the interaction of three distinct types of vortices: tip vortices, base vortices and spanwise vortices.
In recent years, there have been many studies on flow obstruction by considering porous circular patches of circular cylinders. Examples of such cases are river vegetation, atmospheric flow over forests and wind farms. Reference Nicolle and EamesNicolle & Eames (2011) studied the effect of void fraction ( $\phi =N(d/D)^2$, where $N$ is the number of cylinders, $d$ is the diameter of the cylinder and $D$ is the patch diameter). They reported that, for $\phi < 0.05$, an individual wake pattern exists while, for $\phi > 0.15$, the wake generated by the array is similar to that of a solid body cylinder. Similar studies were conducted by Reference Chang and ConstantinescuChang & Constantinescu (2015) at $Re=10^4$ and $0.023 <$ SVF $< 0.2$. Their studies showed that some of the cylinders in the array experienced highly unsteady lift and drag forces, depending on $d/D$ and SVF. Based on LES studies, Reference Zhou and VenayagamoorthyZhou & Venayagamoorthy (2019) identified the relationship between the geometry of the patch, local flow bleeding and global flow diversion for the porous obstruction in a uniform flow.
Reference Nicolai, Taddei, Manes and GanapathisubramaniNicolai et al. (2020) performed wind tunnel studies to study the wake behaviour of porous patches in deep turbulent boundary layers ( $\delta /H_B=3.58$). They reported that the size of the wakes that are being shed by the patches of cylinders is much greater than that of the solid cylinder wake.
Reference Wangsawijaya, Nicolai and GanapathisubramaniWangsawijaya, Nicolai & Ganapathisubramani (2022) conducted PIV measurements on the flow around circular porous patches at different SVFs (0.098 to 1). They found that, with an increase in SVF, there is a decrease/increase in flow bleeding in the streamwise/vertical directions. To date, studies on porous obstruction have only focused on circular geometries of cylinders, essentially mimicking the atmospheric flows over forests and wind farms. There has been some recent work on urban canopy flows, taking into consideration square and rectangular building geometries. Reference Hertwig, Gough, Grimmond, Barlow, Kent, Lin, Robins and HaydenHertwig et al. (2019) performed wind tunnel experiments to study the flow over urban canopies with and without tall buildings, and also tall buildings surrounded by buildings of varying heights at two different wind angles. A reduction in streamwise velocity ( $U$) was noted in the roughness sublayer due to the sheltering effect produced by the low-level buildings.
Reference Marucci and CarpentieriMarucci & Carpentieri (2020b) studied the effect of thermal stratification on the flow over an urban canopy of rectangular building arrays oriented  $45^\circ$ to the flow. A significant reduction in Reynolds stresses and turbulence was noted inside the canopy for the stably stratified flow.
Reference Makedonas, Carpentieri and PlacidiMakedonas et al. (2021) studied the flow over tall urban canopies with uniform as well as varying building heights. They observed that, despite the same average canopy height, ( $h_{avg}$), $\delta$ almost doubles in the case of a non-uniform height canopy when compared with a uniform height counterpart.
Reference Lim, Hertwig, Grylls, Gough, Reeuwijk, Grimmond and VanderwelLim et al. (2022) studied the pollutant dispersion on a 1 : 2400 scale model of tall buildings in Beijing using LES and PIV. In their experiments, they observed that the vertical momentum and scalar fluxes were dominated by the rooftop shear layer.
There is still a lack of a fundamental understanding of the wake flow behind tall building clusters. Most of the above-mentioned studies on the flow around multiple bluff bodies have either been limited to the case of an infinite aspect ratio with uniform inlet flow conditions, or they focus predominantly on the vertical extent of the wake; however, analysis of the lateral wake becomes important as it can also play a crucial role in determining several processes such as pollutant dispersion, wind movement and wind loading. While a recent attempt has been made to circumvent these limitations around a uniform array of cuboids (Reference Vanderwel and GanapathisubramaniVanderwel & Ganapathisubramani 2019), it mainly focussed on the development of an internal boundary layer above finite multiscale roughness patches.
In the present study, we aim to understand the (vertical and lateral) turbulent characteristics in the wake of a cluster of tall buildings with a square cross-sectional area, extending the mean flow characterisation discussed in Reference Mishra, Placidi, Carpentieri and RobinsMishra et al. (2023). Herein, we consider buildings with finite aspect ratios, different spacings ( $W_S$) as well as clusters of different array size ( $N$) immersed in a deep boundary layer. The benchmark case of a single isolated building is also considered for comparison.
2. Methodology
2.1 Experimental facility and cluster model
The experiments were carried out in the EnFlo wind tunnel at the University of Surrey. It is an open circuit tunnel with a test section of length  $L$, width $W$ and height $\,H$ of 20 m, 3.5 m and 1.5 m, respectively, with a maximum achievable flow speed of 5 m s $^{-1}$. To generate an artificial boundary layer in the wind tunnel, a set of seven Irwin spires was placed at
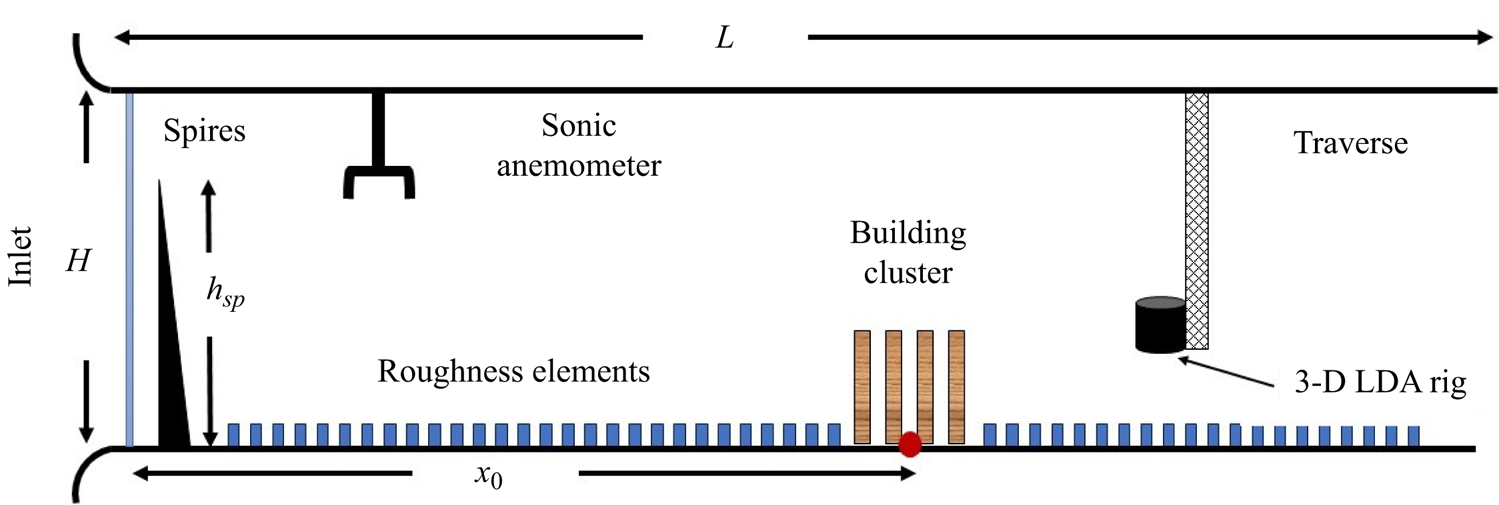
  $x=0.5$ m from the inlet of the test section. These spires are 986 mm high with widths of 121 and 4 mm at the base and tip, respectively. The lateral separation between each spire was 500 mm. Following the spires, rectangular roughness elements were placed in a staggered arrangement on the floor throughout the test section. These elements are 20 mm high and 80 mm wide. The lateral and longitudinal spacing between each roughness element was 240 mm. A circular turntable of 1.5 m diameter was located at $x_0=14$ m from the inlet, where the cluster model was placed for this study. A schematic of the relative arrangement of the Irwin spires, roughness elements and the building models is shown in figure 1.
Schematic of the Enflo Wind Tunnel and relative arrangement of spires, roughness elements and building cluster. Not to scale. 3-D, three-dimensional.
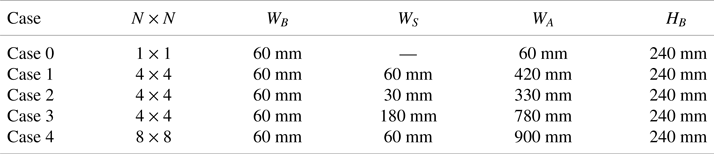
For the present experimental campaign, three different cases of cluster have been studied. The geometry of the different cases is given in table 1. Each individual building is of a square cross-section of width ( $W_B$) 60 mm and height ( $H_B$) 240 mm, resulting in an aspect ratio ( $AR$) of 4. The effects of spacing between the buildings ( $W_S$) and array size (
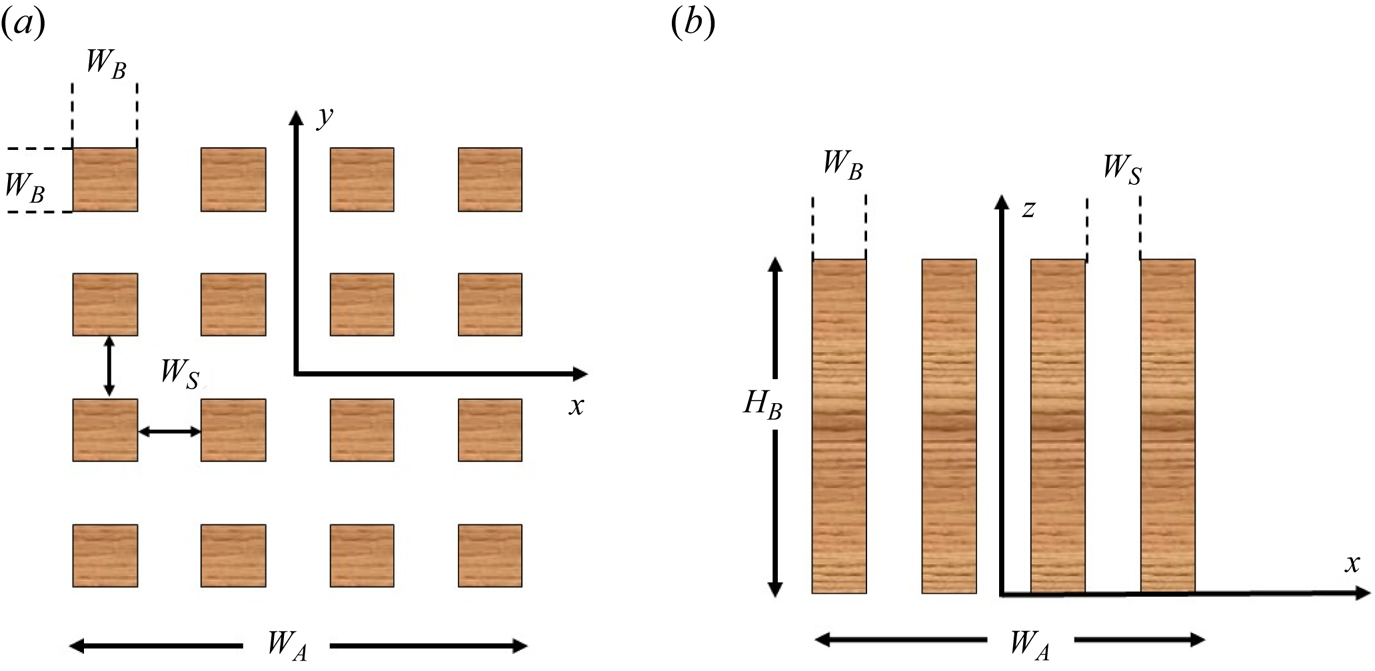
 $N$) were also studied (case 2, case 3 and case 4). The wake of a single building in isolation was analysed for comparison and the results are shown in the supplementary information. The relative arrangement of the tall buildings within the array is shown in figure 2. The origin of the reference system is taken at the centre of the cluster and at ground level.
Geometries of the different cases employed in the present study.
Schematic of the cluster arrangement and coordinate system employed. Not to scale. (a) Top view and (b) side view.
2.2 Flow measurements
Point-wise three-component velocity measurements were achieved using a three-dimensional laser Doppler anemometry (LDA) system. The  $U$–
$U$– $V$ components of velocity are measured with the lasers having wavelengths of 514 and 488 nm, while the $W$ component is measured with the laser of wavelength 532 nm. With a target acquisition frequency set to 100 Hz, the sampling duration for each measurement was set to 1 min. An aerosol solution of sugar particles with a mean diameter of 1 $\mu$m was used as tracing particles and was generated using an in-house ultrasonic mist generator. To obtain the reference velocity of the flow ( $U_{ref}$), an ultrasonic anemometer was installed near the inlet (5 m from the inlet, 0.75 m from the nearest sidewall and 1 m from the floor), as shown in figure 1. The value of $U_{ref}$ for the present experiment was recorded to be 2 m s $^{-1}$. The boundary-layer height ( $\delta$) was calculated based on Reference IrwinIrwin (1981) and was found to be approximately 912 mm at the centre of the measurement region, resulting in a relative building height $H_B/\delta \approx 0.26$. The Reynolds number based on $\delta$ and $U_{ref}$ was $Re_\delta =1.2\times 10^5$. The friction velocity ( $u^*$) was calculated from the vertical Reynolds shear stress distribution ( $u^*=\sqrt {\tau _0\rho ^{-1}}\approx \sqrt {-\overline {u'w'}}$). The roughness length ( $z_o$) was obtained by fitting to the logarithmic law of the velocity. The values of $u^*$ and $z_o$ were found to be 0.12 m s $^{-1}$ and 1.5 mm, respectively. Lateral and vertical wake profiles were acquired to characterise the wake flow. The lateral wake profiles were taken at the cluster mid-height ( $z = 120$ mm) in the region $0.7W_A \leq x \leq 4.5W_A$. The analysis on the lateral profiles in § 3 is based on this mid-height wall-normal location. The vertical profiles were measured at $y= 0$ in the range $0.25H_B \leq z \leq 2.5H_B$. The traverse that holds the three-dimensional LDA rig travels independently in the $x$,
$x$,  $y$ and $z$ axes. The rig can move in the range $-1100\ {\rm mm} \leq y \leq 1100$, and $60\ {\rm mm} \leq z \leq 700\ {\rm mm}$, limiting our data collection, particularly over the wall-normal range.
3. Results
3.1 Characteristics of single building wake
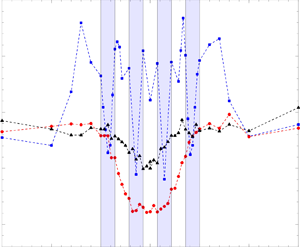
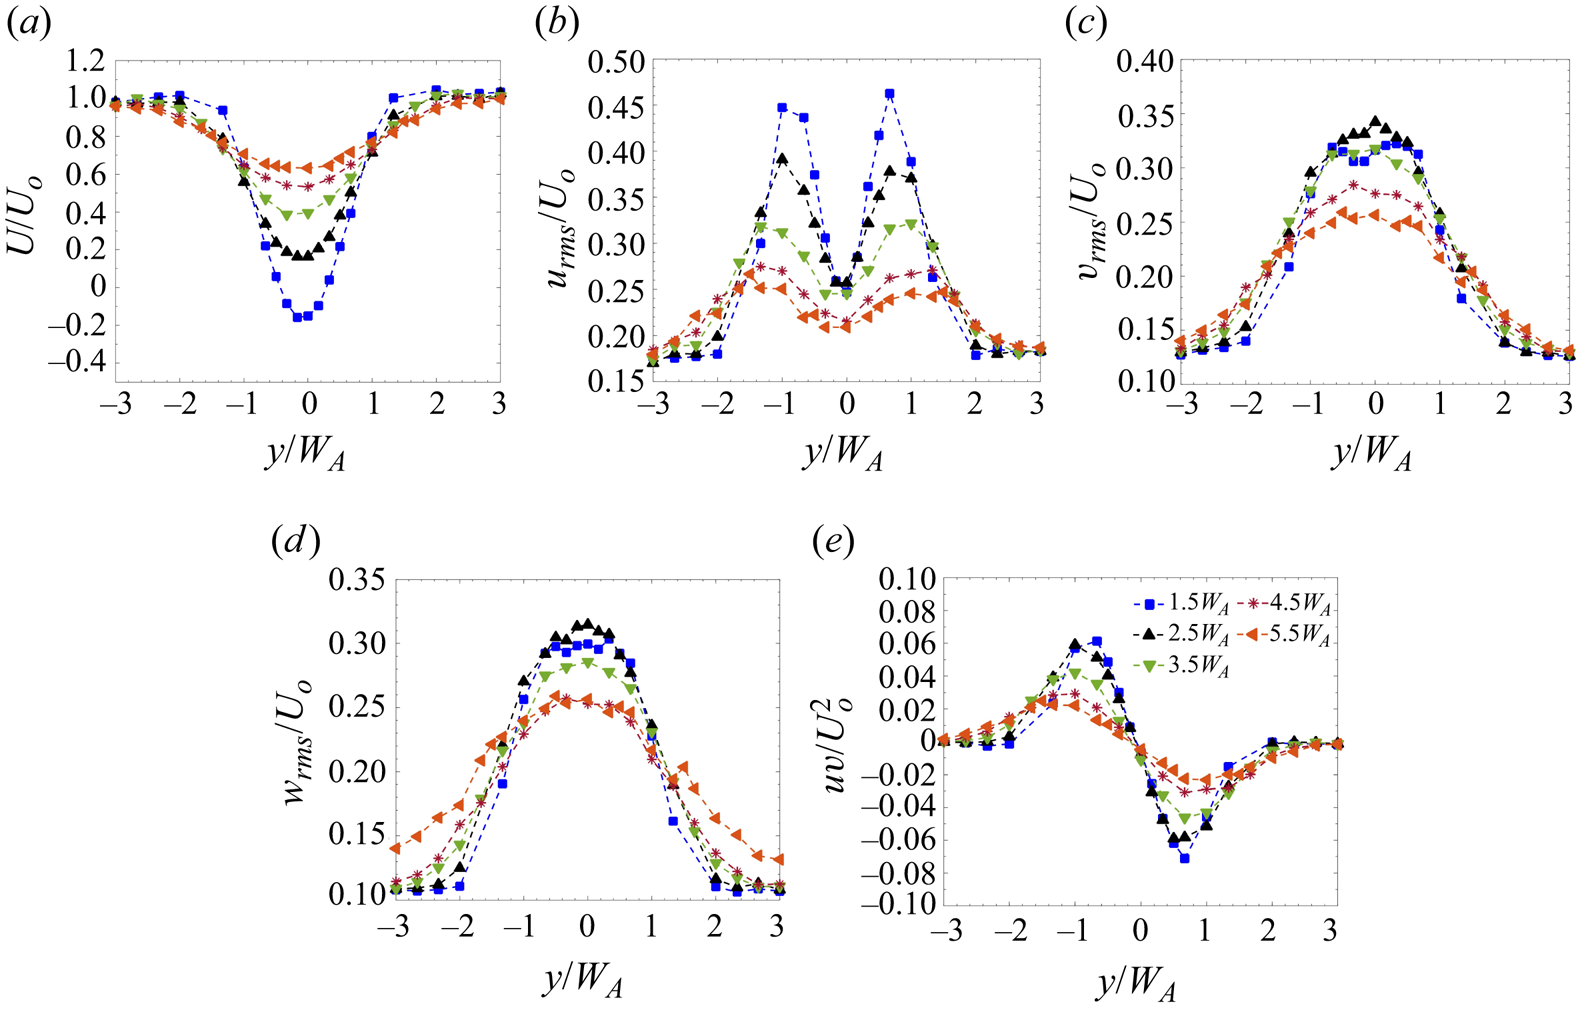
There have been extensive studies of the wake of a single cylinder mimicking a tall building (Reference Castro and RobinsCastro & Robins 1977; Reference Sakamoto and ArieSakamoto & Arie 1983; Reference Kawamura, Hiwada, Hibino, Mabuchi and KumadaKawamura et al. 1984; Reference Sumner, Heseltine and DansereauSumner, Heseltine & Dansereau 2004; Reference Wang, Zhou, Chan, Wong and LamWang et al. 2004; Reference Wang and ZhouWang & Zhou 2009), hence the main features are only briefly summarised herein to aid comparison with the cluster wake. Behind a single building, a momentum deficit region is observed following a Gaussian profile. Due to lateral momentum exchange between the wake and the free-stream flow, the velocity deficit decreases and the wake width increases downstream (figure 3a). The profile of the root mean square of the streamwise velocity ( $u_{rms}$), non-dimensionalised with the local free-stream velocity ( $U_0$), shows double maxima near the edges of the building (figure 3b). The maxima corresponds to the vortex shedding phenomenon from the edge of the building (Reference Alam, Zhou and WangAlam et al. 2011). The value of $u_{rms}$ decreases towards the wake centreline due to a decrease in the shear layer strength (Reference Lyn, Einav, Rodi and ParkLyn et al. 1995; Reference Wang, Zhou, Chan, Wong and LamWang et al. 2004; Reference Khan, Sooraj, Sharma and AgrawalKhan et al. 2018). The peak of $u_{rms}$ decreases downstream from approximately 45 % at $x=1.5W_A$ to 25 % of $U_0$ at $x = 5.5W_A$ due to vortex shedding and mixing with the free stream, leading to gain in the velocity of the wake (Reference Khan, Sooraj, Sharma and AgrawalKhan et al. 2018). Beyond $x = 4.5W_A$, there is no significant decay in the $u_{rms}$ profile. The fluctuations in the transverse velocity ( $v_{rms}$) are observed to be less than that of $u_{rms}$ at any given streamwise location (figure 3c). Interestingly, a double peak is observed in the $v_{rms}$ profile at $x = 1.5W_A$. The peak increases to 35 % at $x = 2.5W_A$ and decays thereafter. A similar trend is observed in the $w_{rms}$ profiles in the wake of a single building (figure 3d). Both $v_{rms}$ and $w_{rms}$ were observed to first increase with $x$, attaining maximum at $x=2.5W_A$, and then decrease thereafter. At $x = 5.5W_A$, the peak values of all three turbulence intensities are almost similar (around 25 %). The Reynolds shear stress ( $uv$) profile, non-dimensionalised with $U_0^2$, is antisymmteric in nature (figure 3e). The peak of $uv$ decreases from 6 % at $x=1.5W_A$ to approximately 2 % downstream at $x=5.5W_A$. The higher magnitude of Reynolds shear stress at $x=1.5W_A$ indicates the presence of vortex shedding, as also noted by Reference Balachandar, Mittal and NajjarBalachandar, Mittal & Najjar (1997) for a circular cylinder and by Reference Lyn, Einav, Rodi and ParkLyn et al. (1995) for a square cylinder.
Lateral wake profiles of (a)  $U/U_0$, (b) $u_{rms}/U_0$, (c) $v_{rms}/U_0$, (d) $w_{rms}/U_0$ and (e) $uv/U_0^2$. Legend in (e) applies to all panels. Single building case.
3.2 Characteristics of tall building cluster wake
The wake of the tall building clusters can be categorised into three distinct wake regimes (Reference Mishra, Placidi, Carpentieri and RobinsMishra et al. 2023): (a) near-wake regime that extends from the edge of the cluster up to  $x = W_A$, measured from the centre of the cluster, (b) transition-wake regime that extends in the region $W_A \leq x \leq 2W_A$ from the centre of the cluster and (c) far-wake regime that extends from $x = 2W_A$ onward. The distinction of these wake regions is observational. In the near-wake region, we observe multiple wakes, behind each building on the leeward side. These wakes merge downstream. The near-wake region is followed by transition-wake region, where the wake velocity recovers very slowly. The far-wake region is characterised by a wake similar to that of the single building. In this section, we discuss the characteristics of the wake flow, with a focus on the turbulence quantities, within each region.
3.2.1 Near-wake regime ( $x \leq W_A$)

Figure 4 shows the mean and turbulent velocity profiles in the near-wake region for a  $4\times 4$ cluster with a spacing between the buildings equal to the building width ( $W_S=W_B$). As noted by Reference Mishra, Placidi, Carpentieri and RobinsMishra et al. (2023), alternate maxima and minima in the velocity profile within the cluster ( $-0.5W_A \leq y \leq 0.5W_A$) are observed due to the formation of the individual wakes behind each row of buildings. Immediately downstream of the cluster ( $x=0.7W_A$), a negative value of the streamwise velocity ( $U$) is observed behind the inner buildings, while $U$ is positive behind the outer buildings (figure 4a). This suggests that the length of the recirculation region is greater behind the buildings which are inside the cluster. The jet flow in the channels between the buildings shows momentum excess compared with the local wake behind the buildings; however, there is still a deficit when compared with the free-stream flow outside the cluster. In the near-wake region, the individual wakes recover at the expense of the momentum excess ( $x=0.85W_A$ to $1W_A$) of the jets. The outer buildings interact with the free-stream flow, which results in a faster recovery of wakes in the outer region than in the inner region. Reference Wang and ZhouWang & Zhou (2009) observed the formation of spanwise vortices around the building (along with the tip and base vortices generated at the rooftop and the base of a building, respectively). The developing spanwise vortices facilitate the lateral exchange of momentum between the local wakes and jets. The spanwise velocity profile ( $V$) also shows a similar trend to that of $U$ in the near-wake region (figure 4b). The magnitude of $V$ is maximum at the edge of the buildings. These alternate maxima and minima at the building edges suggest the presence of spanwise vortex shedding, as observed by Reference Wang, Zhou, Chan, Wong and LamWang et al. (2004).
Lateral profiles of (a)  $U/U_o$, (b) $V/U_o$, (c) $u_{rms}/U_0$, (d) $v_{rms}/U_0$ and (e) $w_{rms}/U_0$ in the near-wake regime of a $4\times 4$ cluster (case 1).
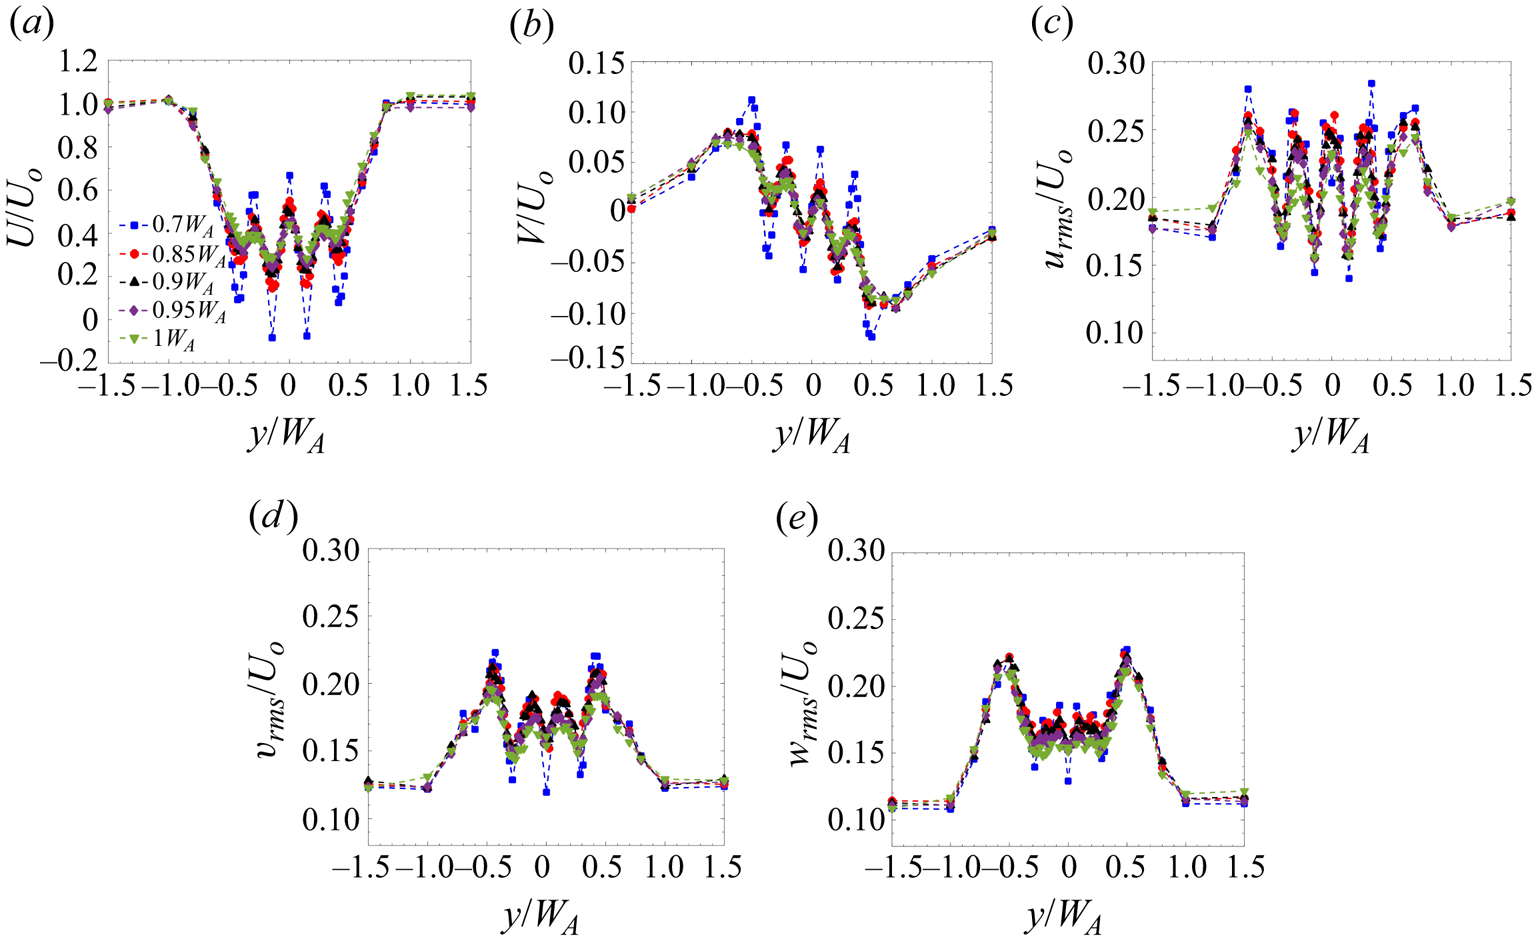
The turbulent characteristics in the near-wake region of case 1 are shown in figure 4(c). In the free-stream region (away from the cluster), the streamwise and spanwise turbulent intensities are maintained at 18 % and 12 % respectively. The value of  $u_{rms}$ in the near-wake regime shows alternate maxima and minima, similar to the streamwise velocity profile (figure 4a). Interestingly, the turbulent characteristics behind the building cluster are significantly lower when compared with a single building case (figure 3). This reduction in the turbulence intensity could be associated with the local blockage produced by the group of buildings (Reference Larsen, Larose, Livesey, Robins, Roberts and SpeirsLarsen et al. 1999; Reference Alam, Zhou and WangAlam et al. 2011), and the modification to the lateral shear characterising the wake region. The maximum $u_{rms}$ reported in the near-wake region is 28 % for the cluster, compared with 45 % in the wake of a single building. Close to the cluster, at $x=0.7W_A$, small individual peaks are observed at the edge of each building, strongly indicating the presence of vortex shedding stemming from the individual buildings.
Downstream ( $x=0.85W_A$ onward), a single peak is observed between each building. This phenomenon could be due to the oscillating nature of the shear layer, as noted by Reference Alam, Zhou and WangAlam et al. (2011). Another interesting observation which should be noted is that, although the location at which the maxima in $u_{rms}$ occur is symmetric about $y=0$, the magnitude of these maxima is not symmetric. For example, the value of $u_{rms}$ is 28 % at $y = -0.7W_A$, while it is 26 % at $y = 0.7W_A$. Although the difference is not that significant, it highlights some interesting phenomena. With fixed spacing between the buildings ( $W_S = W_B$), the jet flow between the buildings could be biased, with sufficient strength to form a wide vortex sheet on one side and a narrower one on the other. Reference Alam, Zhou and WangAlam et al. (2011) noted that this behaviour is generally observed when the gap between the cylinders ranges from $W_S = 0.3$ to $1.2 W_B$, which corresponds well with the spacing used here. The inner buildings, on the other hand, have a symmetric distribution of root-mean-square profiles. The interaction of the inner shear layers further downstream helps to organise the flow in the streamwise direction; this is visible in the symmetrical distribution of $u_{rms}$ from $x=0.85W_A$ onward.
The lateral profiles of cross-streamwise turbulence intensities ( $v_{rms}$ and $w_{rms}$) show maxima at the building centre and minima in the channel between buildings (figures 4d and 4e). Interestingly, the strength of both the cross-streamwise turbulence intensities is greater around the outer buildings than the inner buildings. This can be associated with the larger fluid entrainment from the ambient towards the wake centre. Their magnitude is smaller than the corresponding turbulent intensities of a single building. Within the cluster, the channelling effect due to the array of buildings causes a reduction in $v_{rms}$ and $w_{rms}$. With an increase in $x$, the intensities tend to increase behind the channel. In the near-wake region, the peaks in $v_{rms}$ and $w_{rms}$ can be associated with the small-scale turbulence that is being generated in the wake of individual buildings. As the individual wakes merge, there is a steep decay in the cross-streamwise turbulence intensities, particularly behind the inner buildings within the cluster. At the edge of the cluster, large-scale vortices develop which are correlated with higher values of $v_{rms}$ and $w_{rms}$.
3.2.2 Transition-wake regime ($W_A \leq x \leq 2W_A$)

The flow characteristics of the transition-wake regime for case 1 are shown in figure 5. As evident from the mean streamwise velocity profile (figure 5a), the individual wakes have merged in the transition wake. Interestingly, it is observed that the wake does not seem to recover in this region. Within  $1.1W_A \leq x \leq 2W_A$, there is no significant change in the velocity deficit. The spanwise velocity ( $V$) also does not vary in the streamwise direction (figure 5b). This constant velocity zone is the main feature of the transition wake. A similar phenomenon was observed for the flow around porous obstacles (Reference CastroCastro 1971; Reference Zong and NepfZong & Nepf 2012). In this region, the wake is advected at a uniform velocity. Reference Zong and NepfZong & Nepf (2012) termed this wake regime as a ‘steady wake’. We observe that the wake advection velocity (i.e. its minimum) is around 0.4 $U_0$ throughout the transition-wake region. A peak of $V$ is observed at $y = \pm 0.8W_A$ in this region, suggesting the formation of a shear layer. The shear layers that originate on either side of the cluster do not interact with each other until the end of the transition-wake region. Due to this non-interaction, the wake does not recover in the transition-wake region; this results in a reduction of turbulence, as discussed below.
Lateral profiles of (a)  $U/U_o$, (b) $V/U_o$, (c) $u_{rms}/U_0$, (d) $v_{rms}/U_0$ and (e) $w_{rms}/U_0$ in the transition-wake regime of a $4\times 4$ cluster (case 1).
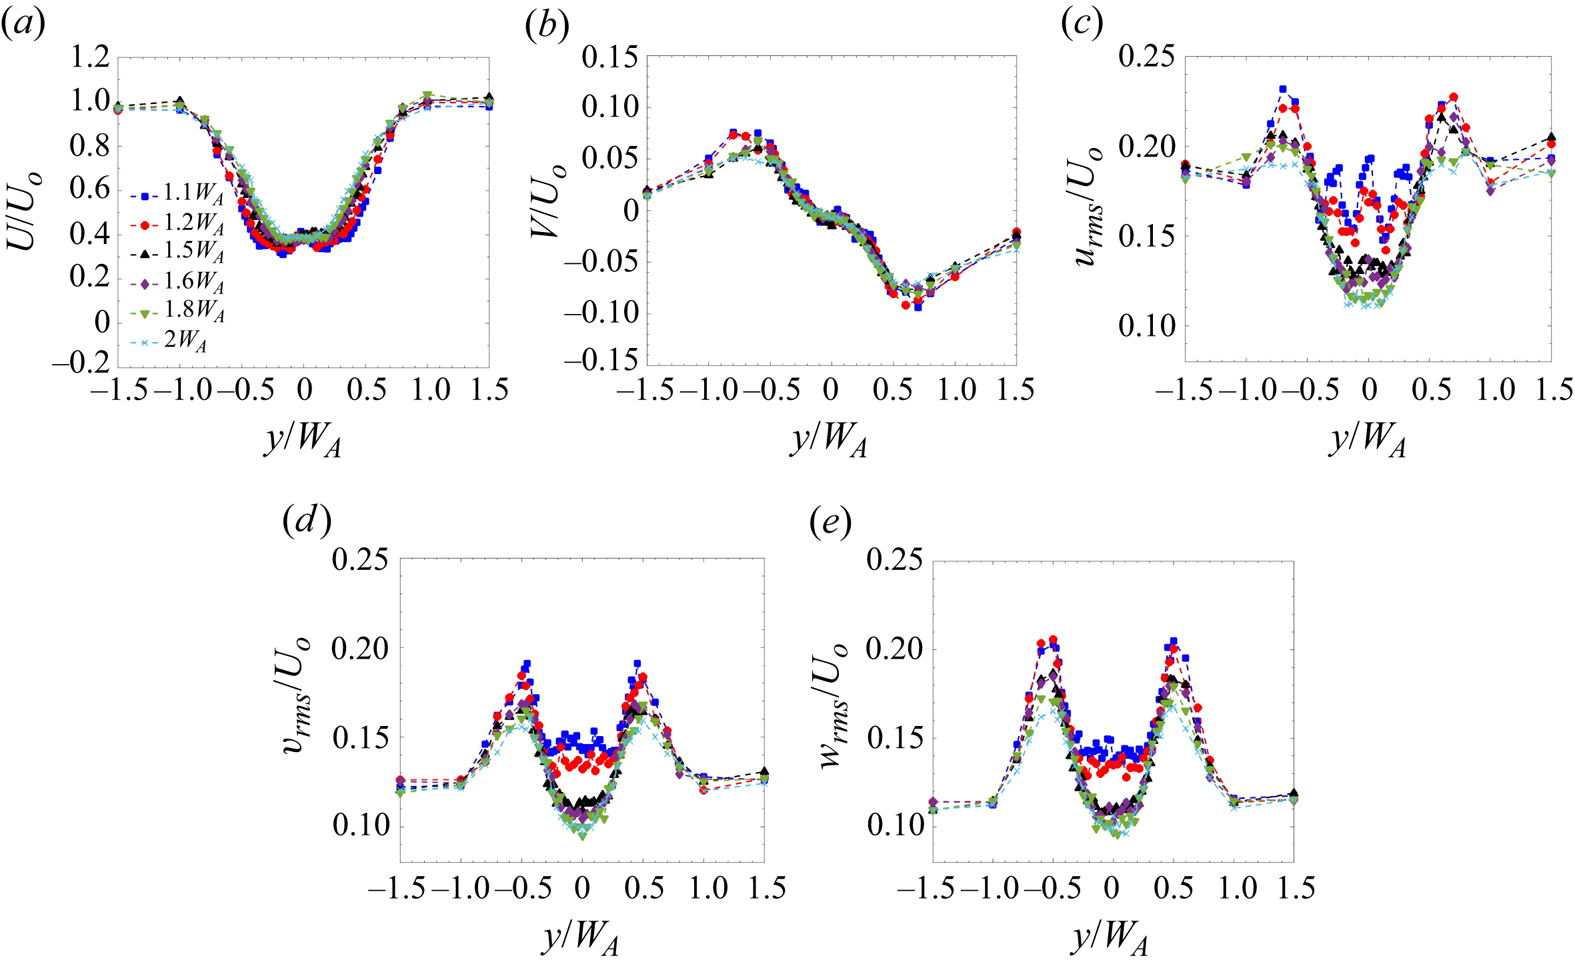
Figures 5(c)–5(e) shows the lateral profiles of the normalised  $u_{rms}$, $v_{rms}$ and $w_{rms}$ values in the transition-wake region, respectively. Here, the turbulence within the cluster ( $-0.5W_A \leq y \leq 0.5W_A$) is lower than in the free-stream region. The $u_{rms}$ profile shows that the building wake effect is still persistent at $x = 1.1$ and $1.2W_A$, which is evident from the alternating maxima and minima within the cluster. The effect of the two central buildings is observed up to $x=1.5W_A$. This suggests a delay in the response of turbulent intensities to the change in the mean flow characteristics. Similar behaviour of delayed response has been observed in internal pipe flows in transient flow conditions before (Reference He and JacksonHe & Jackson 2000; Reference Guerrero, Lambert and ChinGuerrero, Lambert & Chin 2021, Reference Guerrero, Lambert and Chin2023) wherein this delay is proposed to be associated with the response of turbulence production, its distribution and propagation from the wall. In the present case, the added turbulence is generated by the presence of the buildings in the boundary layer. The turbulent intensity has been observed to depend on the way these vortices interact with each other in the case of multiple cylinders (Reference Alam, Zhou and WangAlam et al. 2011). The delay could, therefore, be associated with the mutual interaction of the vortices generated around the individual buildings in the cluster. However, further analysis would be required to validate this hypothesis, which is beyond the scope of the present paper.
There is a steep reduction in  $u_{rms}$ along the cluster centreline ( $\kern0.7pt y=0$) in the region $1.5W_A \leq x \leq 2W_A$. The value of $u_{rms}$ (at $y=0$) is reduced by 33 % compared with the free-stream turbulence. This reduction is likely due to a combination of the local blockage introduced by the cluster and the significant reduction in the velocity gradients along $y$ and $z$ (
$z$ ( ${\rm d} U/{{\rm d} y}$ and ${\rm d} U/{\rm d} z$) in the transition region ( $-0.5< y/W_A<0.5$ in figure 5(a), and $0 < z/H_B < 1$ in figure 7a), as the shear layers that grow along the edge of the cluster still have not penetrated the cluster centre. These two effects cannot be decoupled, so it is not possible to reliably comment on the relative magnitudes of these two effects. A similar trend is observed for the $v_{rms}$ and $w_{rms}$ profiles in figures 5(d) and 5(e), respectively. In the region $1.5W_A \leq x \leq 2W_A$, $v_{rms}$ drops to 10 % in the cluster as compared with 12 % in the free-stream region. The peak in the magnitude is observed at the cluster edge, which shows the developing shear layer due to the velocity differential between the wake and the free-stream flow.
3.2.3 Far-wake regime ($x\ge 2W_A$)

The mean flow behaviour in the far-wake region for case 1 is shown in figure 6(a,b). The wake flow in this region loses the local information of the number of buildings, the spacing between them and the orientation of the individual buildings, and instead behaves similarly to a wake behind a single building (with the array width,  $W_A$, as the characteristic cluster width). The streamwise velocity profile (figure 6a) shows a recovering single wake profile from $x = 2W_A$ onward. The spanwise velocity profile is also observed to collapse similarly to the profile behind a single building (figure 6b). The interaction between the shear layers formed at the edge of the cluster facilitates the recovery of the wake. As noted by Reference Mishra, Placidi, Carpentieri and RobinsMishra et al. (2023), the mean velocity profiles in the far-wake regime collapse reasonably well when scaled with the centreline velocity deficit and the wake half-width.
Lateral profiles of (a)  $U/U_o$, (b) $V/U_o$, (c) $u_{rms}/U_0$, (d) $v_{rms}/U_0$ and (e) $w_{rms}/U_0$ in the far-wake regime of a $4\times 4$ cluster (case 1).
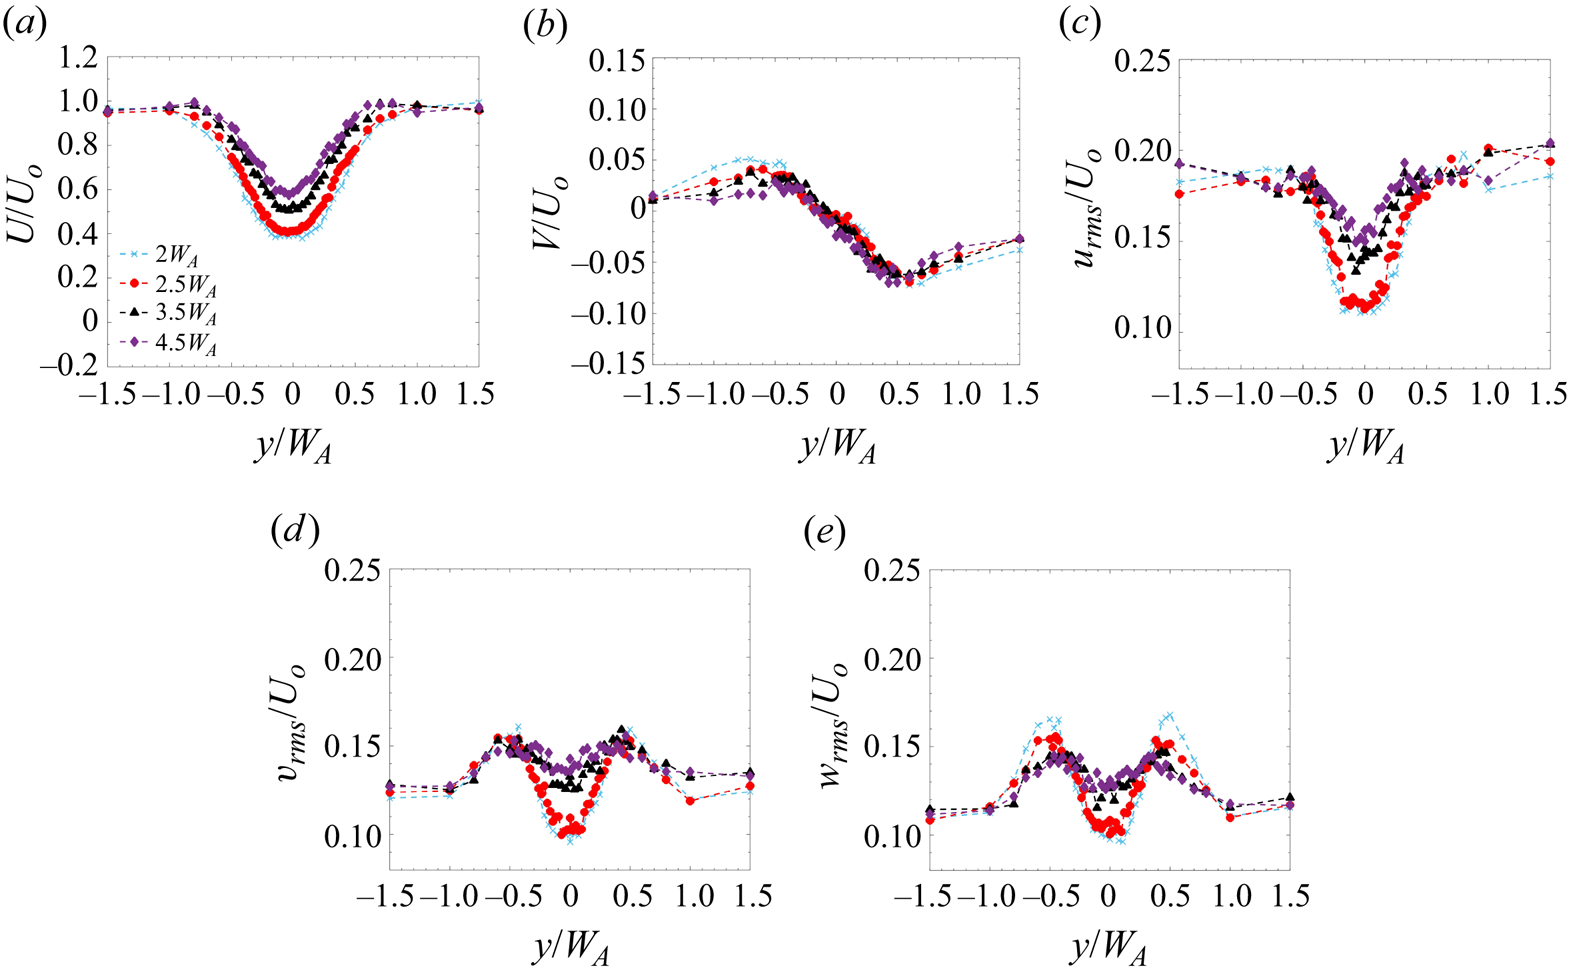
The turbulence profiles in the far-wake region plotted in figure 6(c–e) offer some interesting insights. It is observed that the magnitude of  $u_{rms}$ is significantly lower behind the cluster as compared with the free-stream region (figure 6c). The minimum in $u_{rms}$ is observed to persist up to $x = 2.5W_A$, which again shows the delay in the generation and propagation of turbulence from the near-wall region. The location of the maximum is also observed to shift away from the cluster, a behaviour also noted in the wake of a single building. At $x = 4.5W_A$, the maximum $u_{rms}$ occurs at $y=\pm 1.5W_A$ for the $4 \times 4$ cluster and at $y=\pm 1.35W_A$ for the single building, further validating that the wake properties in the far-wake regime are similar to those behind an isolated building. However, the magnitude is lower than the single building case at matched streamwise locations ( $x/W_A$). The turbulence in the cluster region is observed to increase in the streamwise direction for $x > 2.5W_A$. This increase in turbulence can be associated with the development of the boundary layer in this region, as discussed in § 3.2.4. The cross-streamwise turbulent intensities also show a reduction in the magnitude within the cluster with an increasing trend with the streamwise distance (figures 6d and 6e). The turbulent profiles are still recovering within the measured area in the far-wake region (i.e. $x \leq 4.5W_A$).
It is worth mentioning here that, based on the turbulent velocity components ( $u_{rms}$, $v_{rms}$ and $w_{rms}$), the spatial extent of the near- and transition-wake regions is greater (i.e. extends further) than the corresponding regions identified based on the mean streamwise velocity in Reference Mishra, Placidi, Carpentieri and RobinsMishra et al. (2023). The wake flow is highly unsteady in the near- and the transition-wake regions. As such, one might expect a difference in the response time of the mean flow and the turbulent velocities, as suggested in the literature around accelerating and decelerating wall-bounded flows (Reference He and JacksonHe & Jackson 2000; Reference Guerrero, Lambert and ChinGuerrero et al. 2021, Reference Guerrero, Lambert and Chin2023). According to Reference He and JacksonHe & Jackson (2000), under transient flow conditions, the turbulence is regenerated near the wall and then propagates towards the wall-normal direction with a friction velocity ( $u^*$). In the present case, this delay could be possibly due to the clustering effect of the buildings. As discussed in § 3.2.6, increasing the spacing between the buildings reduces the clustering effect, resulting in a faster response of the turbulent quantities. A more detailed analysis is required to understand the correlation between this delay and various geometrical parameters of the cluster, which is beyond the scope of the present investigation.
3.2.4 Vertical wake recovery
To understand the vertical growth and recovery of the wake behind a cluster of buildings, mean and turbulent characteristics along the array centreline ( $y=0$) for case 1 are plotted in figure 7. The mean and turbulent intensities are non-dimensionalised with the free-stream velocity ( $U_\delta$) outside the boundary layer and the vertical distance ( $z$) is non-dimensionalised using the building height ( $H_B$). Note that the centreline in the case of a $4 \times 4$ cluster lies in the channel between the buildings. The vertical mean velocity profiles are plotted in figure 7(a). These clearly show local flow acceleration in the channel immediately downstream of the cluster ( $x=0.75W_A$). As discussed in § 2.2, the lowest wall-normal location that the LDA could reach was 60 mm, and therefore, data below $z=0.25H_B$ could not be acquired. It is interesting to note that the flow acceleration does not take place throughout the building height. The tip and base vortices developed at the roof and base of the building, respectively, interact with the jet flow in the channel, resulting in a vertical exchange of momentum (Reference Wang and ZhouWang & Zhou 2009). The interaction between these vortices and the jet results in inflection points in the mean velocity profile in the near-wake region: one occurs near the building roof height due to the interaction of the jets with the roof vortex and another occurs near the base of the building due to the interaction of the jets with the base vortices. For instance, at $x = 0.75 W_A$, the point of inflection occurs at $z = 0.75H_B$. At this location, the streamwise velocity gradient ( ${\rm d} U/ {\rm d} z$) is switching from negative to positive. This inflection point shifts downward from the building's roof with an increase in the streamwise distance. From the vertical profile at $x = 1W_A$, it is evident that the vortices have penetrated the core of the jet, with $U$ becoming almost constant up to $z = 0.75H_B$. Close observation of the vertical velocity profile shows that $U$ is uniform along $x$ in the transition-wake region ( $1W_A \leq x \leq 2W_A$). This highlights the existence of a uniform momentum zone in the transition wake region which has been observed in other boundary-layer flow phenomena (Reference de Silva, Hutchins and Marusicde Silva, Hutchins & Marusic 2016; Reference Chen, Chung and WanChen, Chung & Wan 2020; Reference Hearst, de Silva, Dogan and GanapathisubramaniHearst et al. 2021; Reference SaleskySalesky 2023). The boundary layer starts re-developing in the far-wake region due to the exchange of momentum from above the roof's shear layer. The recovery of the boundary layer starts at the cluster height, moving downward towards the ground; this can be observed from the velocity profile at $x = 2$ and $2.5W_A$.
(a) Boundary-layer profile of  $U$ downwind of the cluster and (b) correlation coefficient $r_{uw}$ between streamwise and wall-normal velocity (case 1).
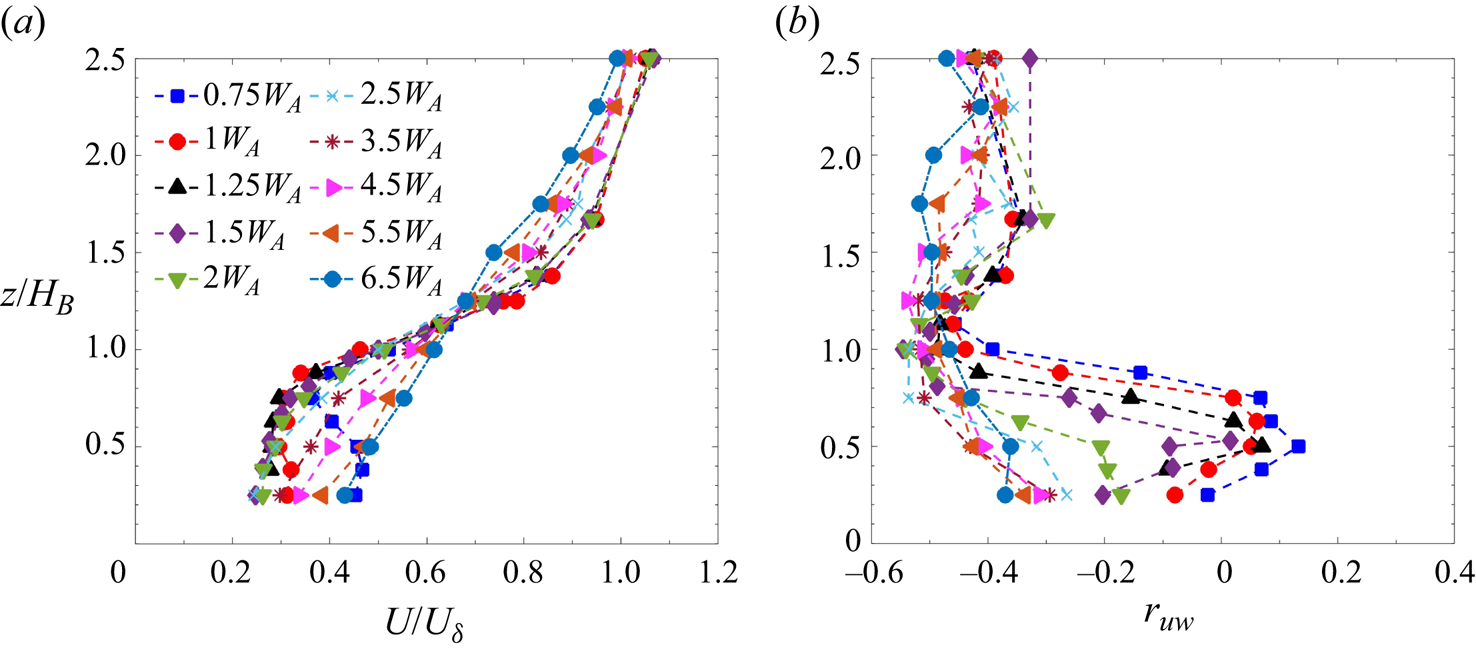
The correlation coefficient,  $r_{uw} =\overline {u'w'}/\sigma _u \sigma _w$, is plotted against vertical distance (in the roughness sublayer) in figure 7(b) at various streamwise locations to understand the momentum transfer efficiency throughout the cluster height. The $r_{uw}$ profile inside the cluster ( $z \leq H_B$) offers some interesting insights into the momentum exchange in the channels. The correlation in the near-wake regime is close to zero for $0.25H_B \leq z \leq 0.75H_B$, which almost coincides with the accelerated region in the velocity profile (figure 7a). This implies that the eddies generated in this region are highly disorganised (Reference Oke, Mills, Christen and VoogtOke et al. 2017). The change in the sign of $r_{uw}$ in the near-wake region is a response to the change in the sign of ${\rm d} U/ {\rm d} z$ in the range $0.25H_B \leq z \leq 0.75H_B$ (Reference Hertwig, Gough, Grimmond, Barlow, Kent, Lin, Robins and HaydenHertwig et al. 2019). A large negative value of $r_{uw}$ indicates a more organised motion in the channel. The reorganisation of the wake takes place in the transition-wake region with the tip and base vortices penetrating towards the cluster mid-height and the spanwise vortices penetrating laterally into the wake's centre (and the channels between the buildings). In the far-wake region, the correlation is negative throughout the roughness sublayer (RSL), its value being close to $-$0.4. Below the cluster height, the structures in the far-wake region are more organised. Above ( $z \geq H_B$), the correlation coefficient approaches $-$0.4 for all streamwise locations; this indicates an efficient mixing of momentum above the cluster height. Typically, $r_{uw}$ was found to approach the value of $-$0.32 in the surface layer (Reference Oke, Mills, Christen and VoogtOke et al. 2017).
3.2.5 Shear layer growth in the wake of building clusters
To understand the growth of the shear layer from the edge of the wake towards the centre of the cluster, the lateral mixing layer edge ( $y_{mix}$) for different cases is calculated and plotted in figure 8(a). Here, $y_{mix}$ is calculated from the edge of the cluster ( $y = \pm 0.5 W_A)$ as the distance towards the centre where the Reynolds shear stress reaches 10 % of its maximum value at each given $x$ location, as suggested in Reference Nicolai, Taddei, Manes and GanapathisubramaniNicolai et al. (2020). It should be noted that, in the near-wake region, alternate maxima and minima occur in the Reynolds shear stresses, and therefore, the mixing layer edge is omitted for this region. At the onset of the transition-wake region, a single shear starts to develop on either side of the cluster. For case 1, at $x = 1.1W_A$, $y_{mix}$ is closer to the edge of the cluster. Then, it grows towards the centre of the cluster in the transition region, reaching $y=0.4W_A$ at $x= 2W_A$. The mixing layer is observed to grow nearly linearly in this region, which is generally the case of a plane mixing layer (Reference PatelPatel 1973; Reference Champagne, Pao and WygnanskiChampagne, Pao & Wygnanski 1976). The growth of $y_{mix}$ from both ends of the cluster is symmetric. Herein, the average mixing layer growth rate ( ${\rm d} y_{mix}/{{\rm d}\kern0.7pt x}$) in the transition region was observed to be 0.3. Interestingly, a nonlinear growth was observed in the case of circular patches of circular cylinders in Reference Nicolai, Taddei, Manes and GanapathisubramaniNicolai et al. (2020). This difference in behaviour could be attributed to the different arrangements of clusters immersed in the boundary layer. While lateral bleeding occurs in classical studies of patches of cylinders (Reference Zhou and VenayagamoorthyZhou & Venayagamoorthy 2019; Reference Nicolai, Taddei, Manes and GanapathisubramaniNicolai et al. 2020; Reference Wangsawijaya, Nicolai and GanapathisubramaniWangsawijaya et al. 2022), it is not expected in the present experiment as the buildings are arranged in a regular pattern in the direction of the wind. In the far-wake region of case 1, the edge of the mixing layer is observed to reach the centre of the cluster ( $y=0.5W_A$ from the edge). In this region, $y_{mix}$ is characterised by a nonlinear growth. Here, there is an interaction between the lateral shear layers, with the shear layer originating at the roof level. Their mutual interaction causes a nonlinear growth, as also noted by Reference Nicolai, Taddei, Manes and GanapathisubramaniNicolai et al. (2020). The lateral growth for cases 2 and 4 are observed to be similar to that of case 1. The slight difference in the growth of the shear layer for case 3 could be attributed to the weaker interaction of the individual wakes in the near region ( $0.5 \le x/W_A \le 1$) due to the larger spacing between the buildings. Interestingly, the behaviour of the mixing layer for the $4 \times 4$ cluster follows that of the single building case for $x/W_A\ge 3$.
Mixing layer edge (a) lateral, (b) vertical.
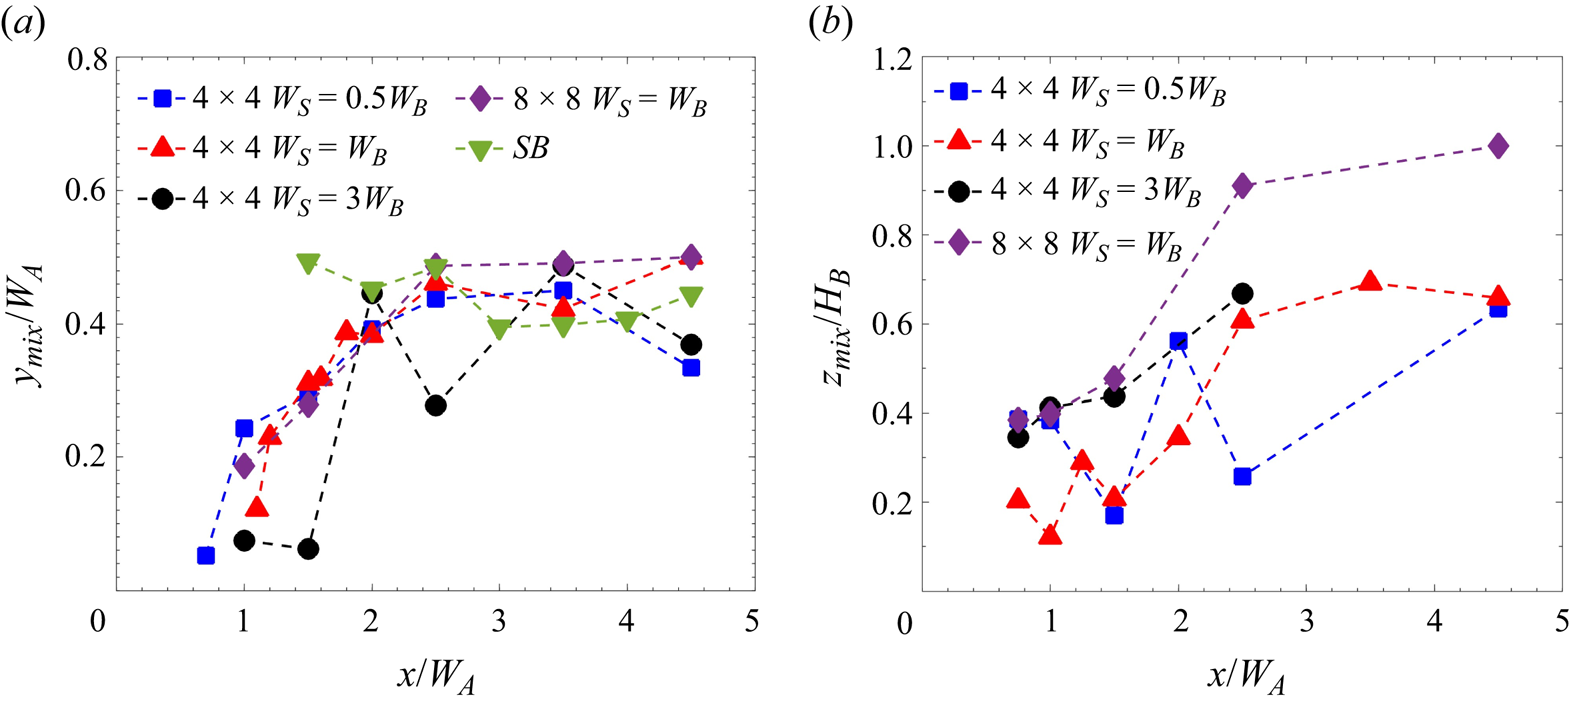
The growth of the vertical shear layer is shown in figure 8(b). Due to the limitation of the experimental set-up, the wall-normal range of the measurements was limited, hence the location where the Reynolds shear stress reaches 10 % of its maximum value in the vertical direction ( $z$) is unknown. Alternatively, the vertical mixing edge ( $z_{mix}$) is calculated as a distance from the location of the maximum Reynolds Shear stress ( $-\overline {uw}_{max}$) towards the ground where the Reynolds shear stress reaches 50 % of its maximum value at each $x$. The growth of $z_{mix}$ in the transition region is slower than $y_{mix}$. It should be noted that the location of $-\overline {uw}_{max}$ is different for different cases as the shear layer develops over the cluster. The vertical shear layer growth is observed to be a function of the width of the cluster ( $W_A$), with the maximum width observed for case 4 ( $8\times 8$ cluster). For a given cluster size, the wake width increases with an increase in $W_S$. The wider shear layer for cases 3 and 4 is seemingly responsible for the faster recovery of turbulence in the far-wake region, as further discussed in § 3.2.6. For case 2 ( $W_S=0.5W_B$), the proximity of the buildings affects the growth of the vertical shear layer in the near- and transition-wake regions. Due to the mutual interaction of vertical and lateral shear layers, $y_{mix}$ and $z_{mix}$ grow nonlinearly in the far-wake region, as also found in Reference Nicolai, Taddei, Manes and GanapathisubramaniNicolai et al. (2020).
3.2.6 Effect of cluster spacing and size
The turbulent properties of the wake are expected to depend on the spacing between the individual buildings ( $W_S$) and the size of the cluster array ( $N$). The mean and turbulent flow characteristics for a $4\times 4$ cluster with $W_S=0.5W_B$ (case 2) and $3W_B$ (case 3) are plotted in figure 9. The mean velocity profile shows that, with an increase in $W_S$, the mutual interaction of the building wakes in the near-wake region reduces. For example, the wake profile at $x=0.7W_A$ shows a recirculation region for case 1 and case 2, (figures 4a and 9a, respectively), while this is not observed for case 3 at this location. This highlights that the near-wake dynamics is characterised by the building width ( $W_B$) rather than the array width ( $W_A$). However, the extent of the three wake regions is observed to be purely governed by $W_A$, at least for the spacing considered for the present study ( $0.5W_B \leq W_S \leq 3W_B$). Similar to case 1, the transition-wake regions for cases 2, 3 and 4 show a uniform velocity within the cluster region and a single wake profile in the far wake (figures 9 and 10).
Lateral profiles of mean flow (a–c) and normalised turbulent intensities (d–f) at different  $W_S/W_B$ for the $4\times 4$ cluster.
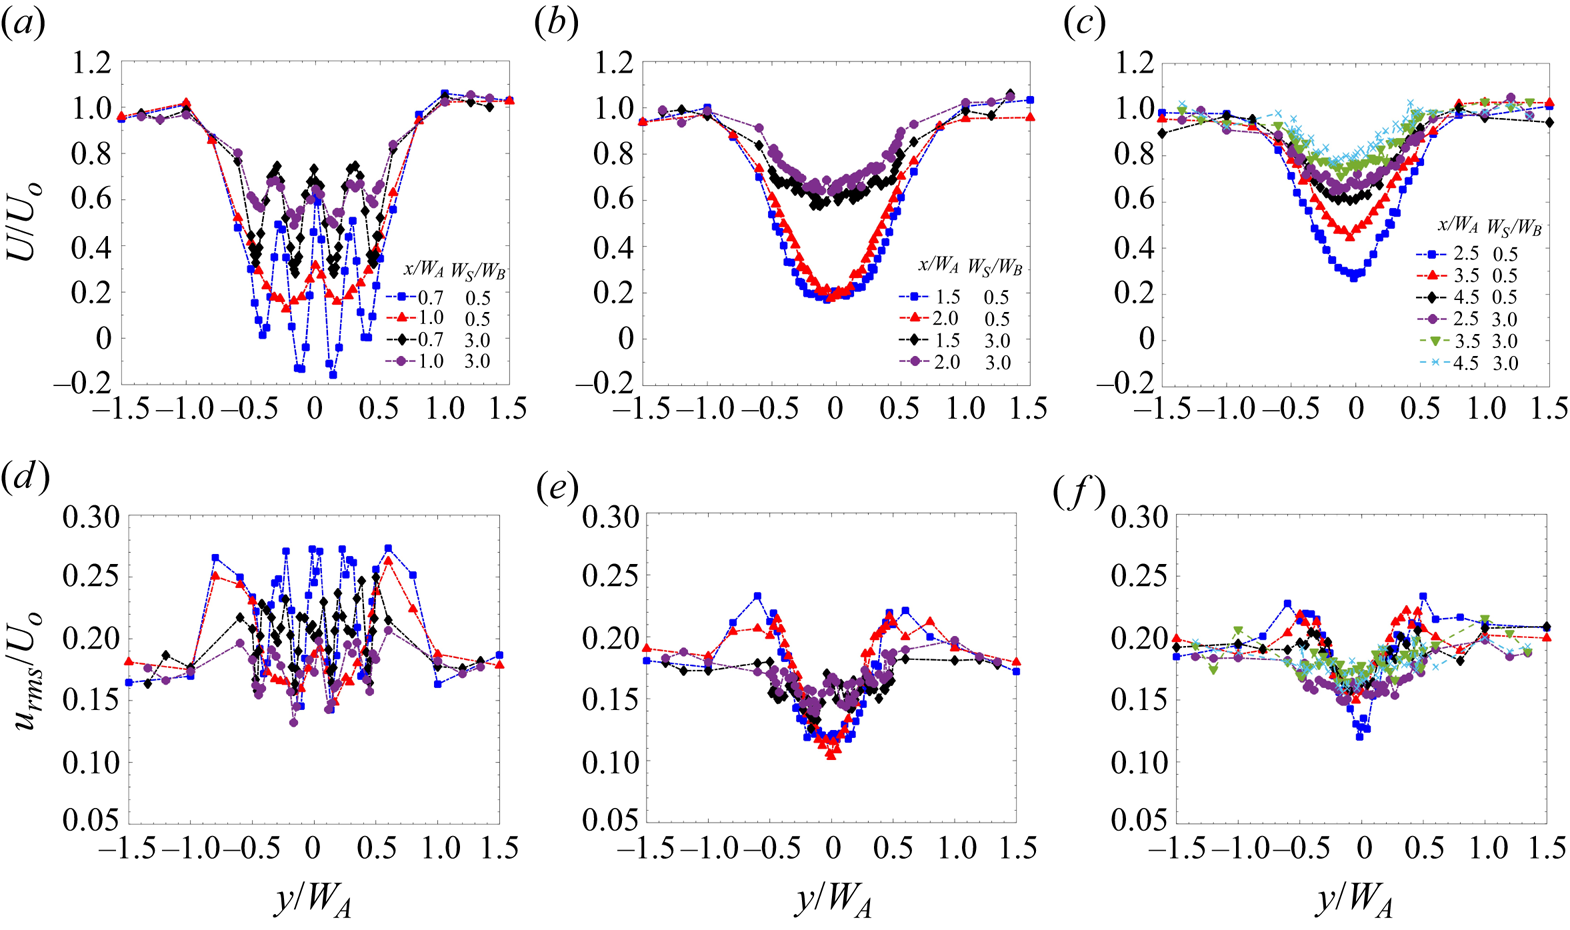
Lateral profiles of mean flow (a–c) and normalised turbulent intensities (d–f) for the  $8\times 8$ cluster with $W_S=W_B$.

The lateral profiles of  $u_{rms}$ for cases 2, 3 and 4 are also plotted in figures 9(d–f) and 10(d–f), respectively, along with the mean streamwise velocity profiles. The profiles in the near-wake region for $W_S=W_B$ (figure 4c), $0.5W_B$ and $3W_B$ (figure 9d) show that, at $x=0.7W_A$, the peak $u_{rms}$ is consistently around $0.25U_o$ within the cluster region, further validating that the turbulence produced by the individual buildings influences the near-wake characteristics. With an increase in $W_S$, the mutual interaction of the wake between the buildings reduces and the root-mean-square velocities recover faster to free-stream conditions. For example, the minimum in $u_{rms}$ behind each building is approximately $0.15U_o$ in the near-wake region for all the cases considered. In the transition-wake region, the minimum in $u_{rms}$ for case 1, case 2 and case 4 is around $0.1U_o$, while for case 3, it is approximately $0.14U_o$. Hence, increasing the spacing reduces the wake interaction between buildings, decreasing the clustering effect. As a result, the turbulent quantities recover faster. The recovery of $u_{rms}$ in the far-wake region of case 4 is faster than in cases 1 and 2, which could be attributed to the vertical shear layer penetrating the wake region, as shown in figure 8(b).
3.3 Vortex shedding behind tall building clusters
The wake of tall building clusters witnesses complex structures with multiple local wake developments behind individual buildings, their mutual interactions in the transition region and the development of a single structure in the far-wake region. The classical two-dimensional wake analysis around a square cylinder has shown the dominant frequency of vortex shedding to be around  $St =0.125\unicode{x2013}0.13$ (Reference OkajimaOkajima 1982; Reference Sakamoto and ArieSakamoto & Arie 1983; Reference Sumner, Heseltine and DansereauSumner et al. 2004). To measure the dominant vortex-shedding frequency in the lateral wake of a single building and for tall building clusters, wavelet analysis is employed on the spanwise velocity fluctuation ( $v$). The wavelet analysis offers an advantage over the fast Fourier transform (FFT) due to its capability to capture local time spectra of signals that are non-stationary in time (Reference MahrtMahrt 1991; Reference Perrier, Philipovitch and BasdevantPerrier, Philipovitch & Basdevant 1995) and is therefore well suited for unsteady aerodynamics problems (Reference Nguyen, Nguyen, Owen and HargreavesNguyen et al. 2022, Reference Nguyen, Inam, Lasagna and Xie2023). The wavelet transformation of any given signal, $\varphi (\tau )$, can be defined as
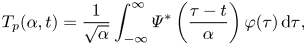 \begin{equation} {T_p(\alpha, t) = \frac{1}{\sqrt{\alpha}}\int_{-\infty}^{\infty} \varPsi^ * \left(\frac{\tau-t}{\alpha}\right) \varphi(\tau) \,{\rm d}\tau}, \end{equation}
where  $T_p(\alpha, t)$ is defined as the wavelet coefficient, $\varPsi ^*$ is the complex conjugate of the mother wavelet function, $\alpha$ is the dilation factor and $t$ is the translation parameter. For the present analysis, we have employed the Morse wavelet function (Reference Olhede and WaldenOlhede & Walden 2002; Reference Nguyen, Inam, Lasagna and XieNguyen et al. 2023). The spectral analysis is done on the fluctuating spanwise velocity ( $v'$) at the location corresponding to the maximum $u_{rms}$. For the single building case, we observed the peak in $u_{rms}$ at $y=\pm 0.67W_A$. The time–frequency analysis at two streamwise locations ( $1.5W_A$ and $4.5W_A$) for the single building is plotted in figure 11. The corresponding dominant non-dimensionalised frequency of vortex shedding is plotted in figure 13(a). For a single building, $St_B$ is calculated based on building width, $W_B$ and free-stream velocity at the top of the boundary layer, $U_\delta$. The time–frequency analysis of a single building shows a distinct peak with the dominant frequencies of $f=2.5$ Hz and $2.4$ Hz for $x=1.5W_A$ and $4.5W_A$, respectively (marked as a black dashed line). The frequency of vortex shedding was observed to be roughly constant and to occur in the range $0.07 \leq St_B \leq 0.075$ for the streamwise locations considered in the present experiment (see figure 13a). The dominant frequency for boundary-layer flow around a finite cylinder is observed to be lower than for the case of a two-dimensional wake. According to Reference ZdravkovichZdravkovich (1997), the decrease in the Strouhal number for the finite cylinder case is attributed to the elongation of the vortices due to the downwash induced by tip vortices, thus prolonging the spanwise vortex shedding. Reference Wang and ZhouWang & Zhou (2009) observed the dominant frequency at $St = 0.11$ in the mid-height of the square cylinder. This difference is attributed to the difference in the building height ( $H_B$) to boundary-layer thickness ( $\delta$) ratio in their case against the present experiment. Reference Sakamoto and ArieSakamoto & Arie (1983) noted the relation between $St$ and $AR$ for square and circular cylinders at various $H_B/\delta$ and observed the dominant frequency to be around $St =0.08$ at $AR=4$ and $H_B/\delta =0.42$. The lower value of shedding frequency suggests an interaction of the spanwise vortices with the tip and base vortices.
Time–frequency scalogram map of the lateral fluctuating velocity ( $v'$) in the wake of a single building at (a) $x=1.5W_A$ and (b) $x=4.5W_A$.
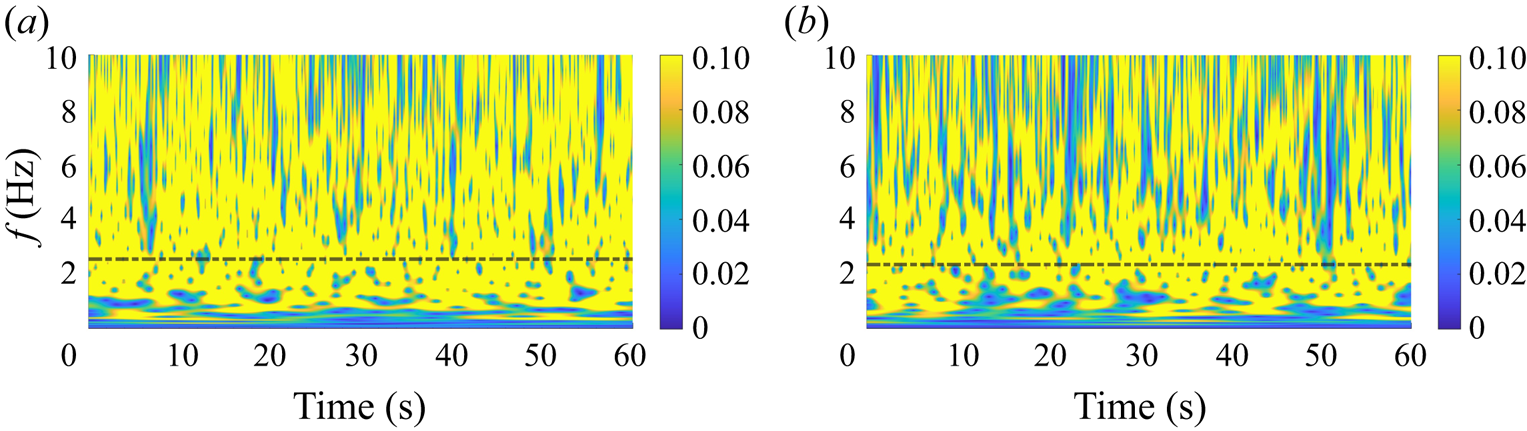
The analysis of the cluster of tall buildings becomes complex due to the formation and mutual interaction of several vortices in the near-wake region. The maximum  $u_{rms}$ for case 1 is observed at $y=\pm 0.7W_A$ in figures 5(c) and 6(c). The spectral analysis at $y=-0.7W_A$ is plotted in figure 12 for different streamwise locations. In the near-wake region, the dominant frequency occurs at $f=4.45$ Hz and $2.85$ Hz at $x=0.7W_A$ and $0.85W_A$, respectively. The power spectral peak becomes broader at $0.85W_A$ compared with the spectrum at $x=0.7W_A$ (not shown). The broadening of the spectrum suggests the co-existence of multi-scale vortices (Reference Nguyen, Inam, Lasagna and XieNguyen et al. 2023). Looking at the velocity profile in the near-wake region (figure 4a), we can speculate on the existence of, at least, two different scales for the shear layer: one developing around the individual buildings (presumably scaling with $W_B$), and the other developing around the cluster as a whole (likely to scale instead with $W_A$). The vortices are, therefore, shed at different frequencies from these shear layers. This could offer an interpretation for the broader peak in the near-wake region of the $4\times 4$ cluster compared with a sharp and narrow peak in the case of a single building. With an increase in the streamwise distance, the vortices merge together.
Time–frequency scalogram map of the lateral fluctuating velocity ( $v'$) in the wake of a $4\times 4$ cluster with $W_S=W_B$, at (a) $x=0.70W_A$, (b) $x=0.85W_A$, (c) $x=0.95W_A$, (d) $x=1.80W_A$, (e) $x=2.5W_A$ and (f) $x=4.5W_A$.
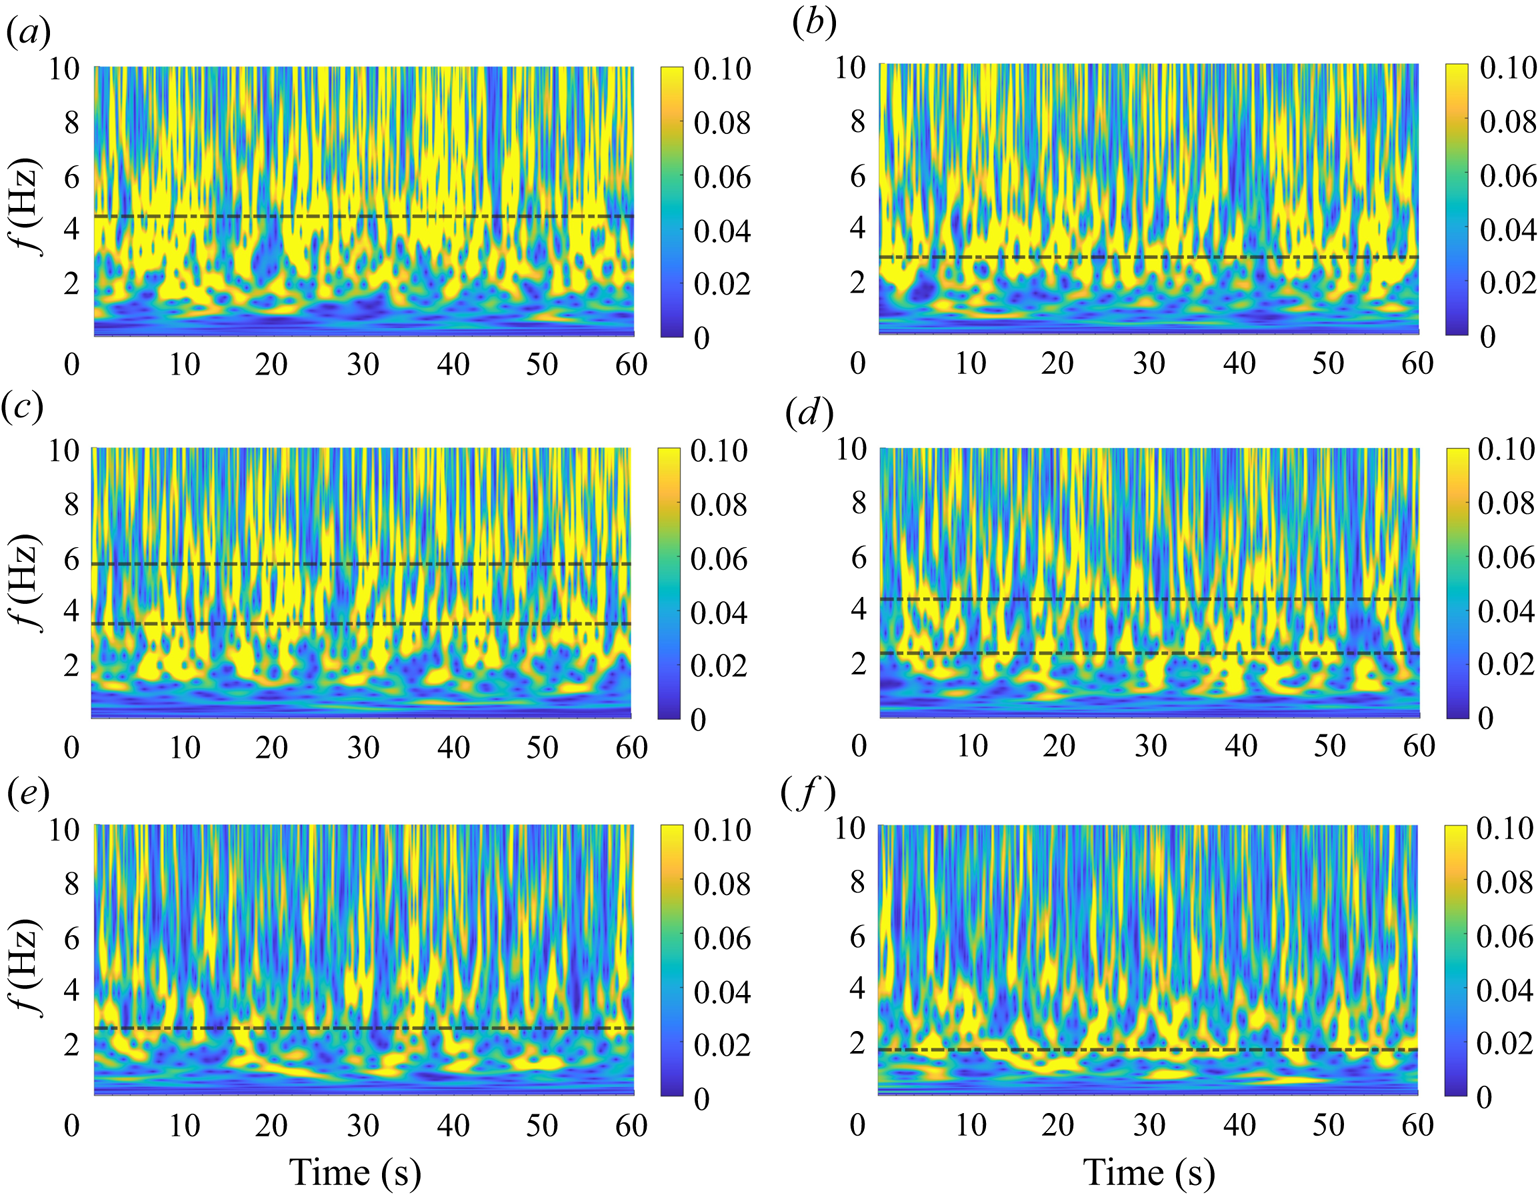
Some interesting comments originate from the power spectrum in the transition-wake region. Two dominant frequency peaks are observed in the velocity spectrum in this region ( $\,f= 3.5$, $5.7$ Hz at $x=0.95W_A$ and $f=2.4$, $4.4$ Hz at $x=1.8W_A$). These frequencies are unrelated (i.e. harmonic/sub-harmonic of each other). This indicates the presence of two dominant features. It is interesting to note that, at $x=0.95W_A$, the maxima in the spectrum occur at $f=5.7$ Hz (higher frequency), while at $x=1.8W_A$, the maxima occur at $f=2.4$ Hz (lower frequency). The two peaks are expected because of the switching of the vortex shedding between one characterised by the individual building scale and one due to the cluster scale. The twin peak is persistent throughout the transition region, while at $x = 2.5W_A$, a single dominant peak is again observed at $f=2.7$ Hz. This symbolises that the coherent structures in the far-wake region shed with a single dominant frequency. The peak in the spectrum is more prominent at $x=4.5W_A$, which is similar to the spectrum profile of a single building (figure 11). The difference in the peak, however, could be due to the interaction of the roof vortices with the spanwise vortices and could be linked to different aspect ratios, as previously suggested in case of a single building (Reference Sakamoto and ArieSakamoto & Arie 1983; Reference Kawamura, Hiwada, Hibino, Mabuchi and KumadaKawamura et al. 1984; Reference Wang and ZhouWang & Zhou 2009). It has also been observed that when the aspect ratio ( $AR$) of a finite cylinder is below a critical value, the downwash flow from the free end dominates the wake (Reference Sakamoto and ArieSakamoto & Arie 1983; Reference Okamoto and SunabashiriOkamoto & Sunabashiri 1992; Reference Pattenden, Turnock and ZhangPattenden, Turnock & Zhang 2005). In the present case, $AR$ is 4 for a single building, while it is 0.57 for the $4\times 4$ cluster (based on the width of the array). Therefore, it could be argued that the influence of roof and base vortices is dominant near the mid-height of the cluster, resulting in the occurrence of multi-scale coherence in the wake.
The variation of non-dimensionalised vortex shedding frequency with streamwise distance is plotted in figure 13. Figure 13(a) shows the Strouhal number calculated based on the building width ( $St_B=fW_B/U_{ref}$). The $St_B$ for the single building is observed to lie between 0.07 and 0.075 for the streamwise distance covered in the present analysis. This is consistent with the findings of Reference Sakamoto and ArieSakamoto & Arie (1983). For clusters of tall buildings, we observe a large variation in $St_B$ in the near- and transition-wake regimes. This could be possibly due to the switching of the vortex-shedding frequencies due to the existence of multi-scale vortices in these regions. Except for $W_S=0.5W_B$ (case 2), the normalised vortex-shedding frequency ( $St_B$) for all other building clusters was observed to be in the range $0.07 \leq St_B \leq 0.13$ in the near-wake region. In the far-wake region, structures merge and stabilise, forming a stable vortex-shedding frequency. The value of $St_B$ is observed to fall below 0.1 for $x \geq 2W_A$. In figure 13(b), the Strouhal number is calculated based on the cluster width ( $St_A=fW_A/U_{ref}$), to distinguish it from the previously introduced $St_B$ based on the individual building width, in the transition- and far-wake regions for the different cases. In the far-wake region, the dominant frequency of vortex shedding is observed to decrease from $St_A=0.75$ at $x=2W_A$ to $St_A=0.4$ at $x=4.5W_A$, when $W_A$ is considered as the characteristics length scale. The higher value of $St_A$ suggests the dominance of the oscillations in the flow (Reference KatopodesKatopodes 2018).
Vortex-shedding frequency based on (a)  $W_B$ and (b) $W_A$.

4. Conclusions
The present paper aims to understand the turbulent characteristics in the wake of tall building clusters. Experiments were performed in the wake of  $4\times 4$ cluster with $W_S=W_B$ using three-dimensional LDA. Results were extended for $4\times 4$ clusters with different spacings between the buildings and also for an $8\times 8$ cluster with $W_S=W_B$.
Results show that, in the near-wake region, the accelerated flow in the channels does not extend throughout the canopy height. With an increase in the distance, the roof and base vortices penetrate the jet region, decelerating the flow in the channels. A uniform vertical velocity profile is found to represent the transition-wake region up to  $z=0.75H_B$. The accelerated flow is disorganised in the near-wake region, leading to a value of the Reynolds stress correlation coefficient ( $r_{uw}$) close to zero. With an increase in $x$, momentum is exchanged in an orderly fashion. We observed that $r_{uw}$ approaches $-$0.4 above the cluster height.
For the same flow conditions, the turbulent characteristics ( $u_{rms}$ and $v_{rms}$) of a $4\times 4$ cluster are observed to be significantly lower than for the single building case. In the near-wake region, the maximum $u_{rms}$ is 28 % as compared with 45 % in the wake of a single building. Unlike $u_{rms}$, the value of $v_{rms}$ is greater around the outer buildings, suggesting a shear layer of the scale of the cluster in addition to the building-scale shear layer. Based on mean velocity variation in the wake, the near wake extends up to $x=1W_A$; transition wake occurs in the region $1W_A \leq x \leq 2W_A$, and far-wake region for $x \geq 2W_A$. However, these regimes are observed to be a little longer when considering the behaviour of turbulent intensities. Building wakes are still persistent in the $u_{rms}$ and $v_{rms}$ profiles up to some extent in the transition-wake region. This delay in the turbulence response to the acceleration/deceleration in the mean flow is attributed to the delay in the response of turbulence production, its distribution and propagation in the wall-normal direction. There is a steep reduction in the values of $u_{rms}$ and $v_{rms}$ within the cluster in the transition-wake region and they are mostly uniform in the region $1.5W_A \leq x \leq 2W_A$. The mean velocity profile shows wake recovery in the far-wake region ( $x \geq 2W_A$). However, there is a delay in the response of the turbulence, and the root-mean-square profiles start to recover after $x = 2.5W_A$. It was observed that, in terms of turbulent intensity behaviour, the near-wake region exists for $x\le 1.2W_A$, the transition-wake region for $1.2W_A \leq x \leq 2.5W_A$ and the far-wake region thereafter. With an increase in the spacing between the buildings ( $W_S$), the turbulent velocities show a faster recovery in the transition region, suggesting a weaker wake interaction at higher $W_S/W_B$.
Wavelet analysis of the fluctuating lateral velocity ( $v$) at the locations of the maximum $u_{rms}$ has shown a dominant frequency ( $St_B$) of approximately 0.07 in the wake of a single building, which is lower compared with the two-dimensional wake shedding frequency ( $St=0.13$). On the contrary, the dominant vortex-shedding frequency for tall building clusters is observed to vary in the range $0.07 < St_B < 0.18$ in the near-wake region. The spectrum peak is broader for the $4\times 4$ cluster, indicating the existence of multi-scale coherent structures in the wake. In the transition region, two dominant peaks are observed in the spectrum, capturing the two dominant length scales in this region. In the far-wake region, all individual wakes merge to form a single wake scaling the width of the cluster. As a consequence, there occurs a single dominant peak in the spectrum in this region. Finally, the vortex-shedding frequency based on the cluster width ( $W_A$) is observed to approach $\approx$0.4 in the far-wake region for the different cases studied.
Supplementary material
The data supporting this study's findings are available from https://doi.org/10.17605/OSF.IO/HWDCX.
Acknowledgement
The authors thank Dr P. Hayden, Dr A. Wells and Dr S. Ding for their help with the experimental set-up and data acquisition.
Funding
The research was supported by EPSRC under the agreement no. EP/V010921/1 titled ‘Fluid dynamics of Urban Tall-building clUsters for Resilient built Environments (FUTURE)’ coordinated by the University of Surrey.
Declaration of interests
The authors declare no conflict of interest.
Author contributions
The collection of original data, initial data analysis and figures, along with the first draft of the paper were prepared by A.M. Further discussions on results and revisions were done by M.P., M.C. and A.R. All authors reviewed the manuscript.


 Open access