

In recent years, Western societies have seen a significant increase in political polarization, with out-party animosity more than doubling over the past two decades (Iyengar et al., Reference Iyengar, Lelkes, Levendusky, Malhotra and Westwood2019). This heightened polarization not only impacts political choices but also spills over into nonpolitical realms such as employment, charitable donations, and social relationships (e.g. Gift and Gift, Reference Gift and Gift2015; Huber and Malhotra, Reference Huber and Malhotra2017; Ladd, Reference Ladd2018; Klein Teeselink and Melios, Reference Klein Teeselink and Melios2024). Such biases are typically attributed to out-group animosity, though alternative explanations are yet to be ruled out. While some may avoid out-partisans due to their political views, the party tag can also be perceived as a cue for other distinguishing factors (Shafranek, Reference Shafranek2021). It therefore remains unclear whether existing studies inflate the perceived role of partisanship in nonpolitical decisions.
To address this, we focus on dating decisions. Existing research on partisanship in relationships offers mixed results, ranging from subtle effects (Huber and Malhotra, Reference Huber and Malhotra2017) to pronounced biases (Nicholson et al., Reference Nicholson, Coe, Emory and Song2016), with some studies suggesting a middle ground (Easton and Holbein, Reference Easton and Holbein2021). These inconsistencies raise questions about the true extent of political influence in relationship formation, particularly as prior studies often conflate inherently political attributes with nonpolitical but politically correlated traits. Experiments that manipulate party identity without accounting for these traits risk conflating choices driven by inferred characteristics with those driven by party affiliation (Dafoe et al., Reference Dafoe, Zhang and Caughey2015).
In this study, we examine the relative influence of partisanship in online dating decisions using a conjoint experiment with 3,000 respondents in the UK. Unlike conventional studies that merely manipulate party identity (e.g. Easton and Holbein, Reference Easton and Holbein2021; Nicholson et al., Reference Nicholson, Coe, Emory and Song2016), we use a realistic experimental design that mirrors the actual experience of online dating platforms. Recognizing the predominantly visual nature of these platforms, where users’ first impressions are often determined by physical appearance, our conjoint profiles incorporate profile pictures representing facial attractiveness and race. Additionally, we factor in both nonpolitical and politically correlated attributes that often influence dating decisions, making our design more attuned to real-world user behavior on dating platforms (Vecchiato and Munger, Reference Vecchiato and Munger2021).
In line with previous work, our results show that partisans on both sides of the aisle choose to avoid dating out-partisans. However, we find that the effect of partisanship is slightly outweighed by political tolerance. On average, users with profiles that signal they are open to dating out-group members are more likely to be chosen, regardless of partisanship. This hints at an aversion to out-partisans shaped more by inferred characteristics than by mere political labels. At the same time, partisanship still exerts a relatively strong influence on dating decisions, even in the presence of other central traits—participants care about partisanship as much as they do about physical appearance, and twice as much as they care about education. This finding is particularly compelling as our study, probing partisan preferences in seemingly inconsequential decisions, provides a stringent test of the reach of political bias.
Our results also contribute to an expanding literature on asymmetries in affective polarization (Baron and John, Reference Baron and John2019; Ditto et al., Reference Ditto, Clark, Liu, Wojcik, Chen, Grady, Celniker and Zinger2019; Morisi et al., Reference Morisi, Jost and Singh2019; Jost et al., Reference Jost, Baldassarri and Druckman2022; Klein Teeselink and Melios, Reference Klein Teeselink and Melios2024). Results in this literature, mainly focusing on the US, are mixed, with one meta-analysis finding no difference in ideological bias between partisans (Ditto et al., Reference Ditto, Clark, Liu, Wojcik, Chen, Grady, Celniker and Zinger2019), and another showing that conservatives (Republicans) are significantly more biased than liberals (Democrats) (Baron and John, Reference Baron and John2019). We provide new evidence that, in the context of dating in the UK, such asymmetry exists, but it is stronger on the liberal side. We show that the preference for co-partisan dates is approximately twice as strong among Labor supporters compared to Conservatives. Our results are in line with recent evidence suggesting asymmetries in polarization are growing faster among left-leaning partisans over the past few years (Bouke and Melios, Reference Klein Teeselink and Melios2025). This asymmetry is especially evident when partisans encounter counter-stereotypic profiles. While Conservatives appeared more accommodating of atypical out-partisans, Labor supporters exhibited a disinclination toward them, which hints at taste-based discrimination among this group. These findings contrast with recent US research, which posits that stereotype inconsistencies consistently diminish partisan social divides (e.g. Ahler and Sood, Reference Ahler and Sood2018; Shafranek, Reference Shafranek2021).
Furthermore, while ample evidence exists on the intrusion of political biases into nonpolitical spheres in the US, our research extends this line of inquiry to the European context, specifically the UK. This is important given the recent surge in political polarization in the UK accompanying the EU referendum (Duffy et al., Reference Duffy, Hewlett, McCrae and Hall2019). As such, our study not only expands the contextual scope of studying partisan biases but also documents differences between the US and other contexts in a period of intensified political divisions.
The structure of this paper is as follows. Section 1 provides our theoretical framework and research hypotheses. In Section 2, we detail our experimental design and empirical methodology. Our findings are presented in Section 3, and the robustness of our results is examined in Section 4. We conclude with a discussion in Section 5.
1. Theory and hypotheses
In this study, we integrate theories from social and political psychology to identify key determinants of online dating preferences, categorizing attributes into three primary groups: political, politically correlated, and nonpolitical. The rationale behind this approach is rooted in our key research objective: to discern the extent to which partisanship is used as a social heuristic in online dating. If the introduction of alternative attributes moderates the impact of political homophily, it could signify that individuals leverage partisanship as a quick gauge for compatibility, rather than a strict criterion. In economic terms, this would point to “statistical” discrimination, where group membership informs assumptions about other traits. In contrast, if political homophily remains dominant despite other attributes, it implies “taste-based” discrimination, driven by out-group animus (Guryan and Kofi Charles, Reference Guryan and Kofi Charles2013).
We identify eight political, nonpolitical, and politically correlated attributes that are deemed important in online dating, and we derive 17 preregistered hypotheses.Footnote 1 First, we predict one main effect for each attribute value (all attributes are dichotomous), yielding an initial set of eight hypotheses. In addition, the interaction effects of all attributes with partisanship yield seven additional hypotheses. Acknowledging existing evidence on gender gaps in preferences for height and education, we propose hypotheses for heterogeneous effects based on the respondent’s gender (two additional hypotheses).
1.1. Political attributes
Individuals exhibit a proclivity to associate and interact with others who resemble them, a behavioral inclination known as social homophily (McPherson et al., Reference McPherson, Smith-Lovin and Cook2001). Social homophily arises for both fixed and flexible attributes such as race (e.g. Fu and Heaton, Reference Fu and Heaton2008), education (Zeng and Xie, Reference Zeng and Xie2008), income (Sweeney and Cancian, Reference Sweeney and Cancian2004), and religiosity (Vargas and Loveland, Reference Vargas and Loveland2011). It also extends to various levels of relationships, such as marital unions (e.g. Mare, Reference Mare1991; Kalmijn and Flap, Reference Kalmijn and Flap2001), cohabitation (Blackwell and Lichter, Reference Blackwell and Lichter2004), friendships (Quillian and Campbell, Reference Quillian and Campbell2003), and casual interactions (McClintock, Reference McClintock2010).
Naturally, homophily extends into the realm of politics, where it manifests as a propensity for individuals to foster connections with those who echo their political values while avoiding those who do not (e.g. Iyengar et al., Reference Iyengar, Sood and Lelkes2012; Gift and Gift, Reference Gift and Gift2015; Nicholson et al., Reference Nicholson, Coe, Emory and Song2016; Huber and Malhotra, Reference Huber and Malhotra2017). Out-partisans are also viewed as less attractive and less worthy of matchmaking efforts (Nicholson et al., Reference Nicholson, Coe, Emory and Song2016; Easton and Holbein, Reference Easton and Holbein2021). This may stem from the fear that choosing a partner with different political views will lead to disagreements on core values (Graham et al., Reference Graham, Haidt and Nosek2009; Gerber et al., Reference Gerber, Huber, Doherty and Dowling2012), which could influence important life decisions such as residential location (Tam Cho et al., Reference Tam Cho, Gimpel and Hui2013; Pickard et al., Reference Pickard, Bove and Efthyvoulou2022), lifestyle choices (DellaPosta et al., Reference DellaPosta, Shi and Macy2015), or child-rearing (Center, Reference Center2014; Lindke and Oppenheimer, Reference Lindke and Oppenheimer2022). While it is plausible to expect that partisanship influences date selection, the extent of its influence compared to other factors remains unclear. Typically, people are drawn toward partners who resemble them. This sorting process makes political homophily more likely, but it is not conclusively the only, or the most significant, determinant of partner selection. Evidence from a recent roommate-choice conjoint analysis in the US shows that partisanship outweighs all other considerations (Shafranek, Reference Shafranek2021). Nonetheless, roommate selection involves a largely different set of considerations, and it is unclear whether these findings would translate seamlessly to the dynamics of romantic partner selection. In addition, given the unique nature of the US political landscape, characterized by a dramatic rise in affective polarization over the past few decades (Boxell et al., Reference Boxell, Gentzkow and Shapiro2022), we must be cautious in extending these findings to other contexts. Therefore, given the paucity of research in this area, we pose the following research question (RQ): What is the relative influence of party identity on partner selection?
Our study introduces an attribute for partisanship, divided into two categories: Labor and Tory.Footnote 2 Drawing from the existing literature, our expectation is that individuals will show a marked preference for dating partners with the same partisan identity.
• H1a: Participants are more likely to select in-party rather than out-party dates.
Notably, while we expect to observe in-group favoritism among participants overall, we acknowledge the potential for heterogeneity in this effect between Labor and Conservative supporters. The literature extensively documents such asymmetries in polarization (Baron and John, Reference Baron and John2019; Ditto et al., Reference Ditto, Clark, Liu, Wojcik, Chen, Grady, Celniker and Zinger2019), yet there is no consensus regarding their direction or magnitude. For instance, some studies report higher polarization among right-leaning supporters, driven by factors such as threat sensitivity and group conformity (Jost et al., Reference Jost, Baldassarri and Druckman2022), whereas others suggest stronger in-group favoritism among liberals, particularly younger and more educated cohorts (Bouke and Melios, Reference Klein Teeselink and Melios2025). Given these mixed findings, we make no ex ante predictions and treat the question of asymmetries as an exploratory analysis.
Other studies suggest that imperfect information might attest to the dislike of out-groups. For instance, some measures of affective polarization can potentially confound negative attitudes toward out-partisans with a broader distaste for partisanship, political discussion, and politics as a whole (Klar et al., Reference Klar, Krupnikov and Barry Ryan2018; Shafranek, Reference Shafranek2021). People may also avoid out-partisans due to the perception that they harbor negative attitudes or emotions toward them. This may contribute to affective polarization and reduce opportunities for cross-party cooperation (Druckman and Levendusky, Reference Druckman and Levendusky2019; Druckman et al., Reference Druckman, Klar, Krupnikov, Levendusky and Barry Ryan2022). Huddy and Yair (Reference Huddy and Yair2021) show that positive inter-group interactions can mitigate this tendency and reduce partisan animosity. This implies that the root of affective polarization might not be a genuine aversion to out-partisans, but rather misinterpretations of their attitudes. Given these findings, we anticipate that participants will prefer potential dates who display tolerance or openness in their political views, as these traits imply a readiness for positive interactions across party lines.
We operationalize political tolerance as an individual’s openness (or lack thereof) to forming relationships with members of the political out-group. Profiles describe candidates as having either a low tolerance for out-party members (“No Tories/Labor!”) or displaying high tolerance (“Open to match with anyone”). To minimize ambiguity and enhance the accuracy of participant judgments, both the partisanship and tolerance attributes are presented side by side in the candidate’s profile. For instance, a Tory with high out-party tolerance is described as: “Tory, but open to match with anyone.” This attribute frames tolerance in a tangible, real-world dating context rather than in more abstract expressions of political attitudes.
• H1b: Participants are more likely to select politically tolerant, rather than intolerant, dates.
• H1c: Political tolerance will interact with partisanship to significantly influence date selection. Specifically, participants will demonstrate a stronger preference for tolerance when evaluating out-partisan profiles compared to co-partisan profiles.
1.2. Politically correlated attributes
Partisanship is associated with various stereotypes (Rothschild et al., Reference Rothschild, Howat, Shafranek and Busby2019; Shafranek, Reference Shafranek2021). How might challenging these stereotypes influence partner selection? Specifically, if a conservative encounters a liberal who defies the typical stereotype, will they be more open to selecting them as a potential date compared to a typical liberal (and vice versa)? Exposure to counter-stereotypic information can redirect people from heuristic thinking, diminishing the role of stereotypes in evaluating out-groups (Hutter and Crisp, Reference Hutter and Crisp2005; Vasiljevic and Crisp, Reference Vasiljevic and Crisp2013; Prati et al., Reference Prati, Crisp and Rubini2015, Reference Prati, Moscatelli, Pratto and Rubini2018). To test the effect of counter-stereotypic traits on partner selection, we incorporate politically correlated attributes in the conjoint profiles.
We identify ideology (traditional and progressive), race (White and Black), education (degree and no degree), and diet (vegetarian and nonvegetarian) as factors that are both highly aligned with partisanship in the UK and important in the formation of romantic relationships. To ensure a systematic approach to attribute selection, we validated these choices through an analysis of vote choice determinants using data from the British Election Study (BES, see Appendix A). The analysis confirms the strong predictive power of our selected attributes for vote choice.
Conventional wisdom posits a robust relationship between ideology and partisanship within Western democracies as voters commonly associate with parties that echo their ideological views.Footnote 3 Racial background also has a marked influence on political preferences. While racial and ethnic minorities predominantly align with the Labor Party (Anwar Reference Anwar2013; Back and Solomos Reference Back and Solomos1995; Saggar and Heath, Reference Saggar, Heath, Evans and Norris1999; Heath et al., Reference Heath, Fisher, Rosenblatt, Sanders and Sobolewska2013), the Conservative Party tends to resonate more with the majority (White) demographic (Henderson et al., Reference Henderson, Jeffery, Wincott and Wyn Jones2017). To avoid ambiguities in participants’ perceptions, our study simplifies race as “White” and “Black.” Education, too, wields significant influence over political affiliations. Contemporary voting patterns in the UK indicate a stronger connection to education levels, with degree-holders leaning more toward progressive or liberal stances (Hobolt, Reference Hobolt2016; Kirkup, Reference Kirkup2021). Additionally, dietary choices, particularly veganism and vegetarianism, often align with liberal-left views due to the associated political priorities, like animal rights and environmental concerns (Emel and Neo, Reference Emel and Neo2015; Hodson and Earle, Reference Hodson and Earle2018).
As with partisanship, evidence on political homophily holds for measures of political ideology. Individuals tend to prefer romantic partners who share their ideological beliefs and are less inclined to date someone with opposing views (e.g. Huber and Malhotra, Reference Huber and Malhotra2017). This effect also holds for race and diet. Members of one’s own racial group are often perceived as more physically attractive and familiar than those from different racial backgrounds (McPherson et al., Reference McPherson, Smith-Lovin and Cook2001; McClintock, Reference McClintock2010). Much of this tendency is explained by shared social groups, interests, beliefs, and geography, and it leads internet daters to filter potential matches by race (Lin and Lundquist, Reference Lin and Lundquist2013). While there is not much evidence on mixed-diet attraction and relationships, differences in health philosophies and food choices have been linked to increased relationship conflict, particularly when individuals feel criticized for their food choices (Bove et al., Reference Bove, Sobal and Rauschenbach2003; Burke et al., Reference Burke, Randall, Corkery, Young and Butler2012). Given these trends, it is anticipated that respondents will predominantly opt for dates with shared ideology, race, or diet.
• H2: Participants are more likely to select dates who share their (a) ideology, (b) race, or (c) dietary habits.
While it is also common for individuals to seek partners with similar levels of education (Skopek et al., Reference Skopek, Schulz and Blossfeld2011), numerous studies have shown that education enhances desirability across the board. This is evidenced in self-reports, census data, speed dating, and online dating, and is attributed to its association with prospective income (Pawlowski and Koziel, Reference Pawlowski and Koziel2002; Kurzban and Weeden, Reference Kurzban and Weeden2005; Prokosch et al., Reference Prokosch, Coss, Scheib and Blozis2009; Lin and Lundquist, Reference Lin and Lundquist2013; Egebark et al., Reference Egebark, Ekström, Plug and Van Praag2021; Hopcroft, Reference Hopcroft2021). However, drawing on research highlighting differential preferences for educational attainment across genders, both in marital and in online dating contexts (Fisman et al., Reference Fisman, Iyengar, Kamenica and Simonson2006; Skopek et al., Reference Skopek, Schulz and Blossfeld2011; Egebark et al., Reference Egebark, Ekström, Plug and Van Praag2021), we posit that women are more inclined to select male partners with a higher educational level than their own. Conversely, men will favor female partners with educational levels that are lower than their own.Footnote 4
• H2d: Participants are more likely to select dates with a degree compared to those without one.
• H2e: There are significant gender differences in preferences for education. Female participants are more likely to select male dates with higher educational attainment than their own, whereas male participants are more likely to select female dates with lower educational attainment than their own.
We also predict significant interactions between levels of these attributes and partisanship. In particular, both Labor and Conservative Party supporters will evaluate counter-stereotypical out-partisans more favorably than typical out-partisans. We define a counter-stereotypical profile as any profile where party identity does not align with the ideology, race, education, and/or dietary habits of the typical partisan. To verify respondent perceptions of these attributes and whether the included traits are indeed linked to partisanship, we incorporate a section at the end of the survey where respondents are prompted to identify whether each attribute level corresponds more with supporters of the Conservative Party, the Labor Party, or neither.
• H2: Respondents are more likely to select out-partisans with counter-stereotypic (f) ideology, (g) race, (h) educational attainment, and (i) dietary habits.
1.3. Nonpolitical attributes
Social scientists have identified a range of nonpolitical attributes that influence partner choice (Walster et al., Reference Walster, Aronson, Abrahams and Rottman1966; Belot and Francesconi, Reference Belot and Francesconi2013; Rodriguez et al., Reference Rodriguez, Hadden and Raymond Knee2015; Egebark et al., Reference Egebark, Ekström, Plug and Van Praag2021). We focus on physical appearance, as measured by facial attractiveness (high and low) and height (tall and short). These traits were chosen because they are stable, immediately observable upon entering the online dating scene, and exhibit marked correlations between partners. We detail how these attributes are constructed in Section 2 and provide the detailed theoretical discussion in Appendix B. Our framework informs the following hypotheses:
• H3a: Participants are more likely to select physically attractive dates over physically unattractive dates.
• H3b: Participants are more likely to select tall dates over short dates.
• H3c: There are significant gender differences in preferences for height. Female participants are more likely to select taller male profiles, whereas male participants are more likely to select shorter female profiles.
• H3: Physical attractiveness (d) and height (e) will interact with partisanship to significantly influence date selection. Specifically, participants will demonstrate a stronger preference for profiles characterized as physically attractive and tall when evaluating out-partisan profiles compared to co-partisan profiles.
2. Research design
We recruited a gender-balanced sample of 3,000 Prolific respondents to participate in the study between July 1 and 6, 2023. The survey was administered in three consecutive rounds to enable continuous data verification. The sample consisted of non-married UK residents between the ages of 18 and 40, which roughly matches the age range of individuals depicted in our conjoint profile images. The average time taken to complete the survey was five minutes. A pretest (n= 500) conducted on May 10, 2023, allowed us to select the most suitable images for inclusion, and a pilot test (n= 200) was carried out on June 18, 2023, to refine the study design and ensure the clarity of the questionnaire. Table 1 presents summary statistics from our sample alongside corresponding proportions from the BES Wave 25 (Edward Fieldhouse et al., Reference Fieldhouse, Green, Evans, Mellon, Prosser, Bailey and de Geus2024).Footnote 5 We provide further details on sample selection and power analysis in Appendix G.Footnote 6
Summary statistics

Notes: Respondents are initially classified as Labor or Tory based on their 2019 general election vote. For those who abstained or cast their vote outside of these parties, classifications are based on which party they rated higher using the feeling thermometer scale. All other respondents are classified as “Neither.” Proportion BES refers to the percentage of people below 40 that fall within each category, using Wave 25 of the BES Internet Panel.
Participants first completed a set of preliminary screening questions.Footnote 7 They were then instructed to complete the male or female conjoint tasks based on their specified sexual orientation. Those who did not express a particular sexual preference were guided to a random task set. Ultimately, 48.4 percent of participants completed the male sets and 51.6 percent completed the female sets. Participants who failed two attention checks were excluded from the analysis. The full survey instrument is provided in Appendix F.
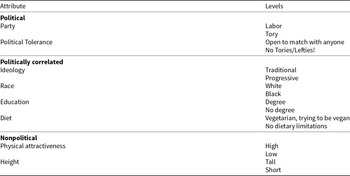
We chose to include only dichotomous attributes in the conjoint experiment to simplify the choice task for respondents and reduce respondent fatigue (Bansak et al., Reference Bansak, Hainmueller, Hopkins, Yamamoto, Druckman and Green2021). Binary attributes also simplify the design space considerably, making it easier to achieve an optimal or near-optimal design. The attribute levels for height were based on the average national height among men and women in the UK: 5ʹ8″ and 5ʹ4″ for tall and short women, respectively, and 6ʹ and 5ʹ8″ for tall and short men, respectively. Table 2 shows the attributes and levels included in the conjoint task.
Conjoint design: attributes and levels

Notes: The “No Tories/Lefties” notation in political tolerance is contingent upon the party identified in the profile. For instance, a Labor profile would indicate “No Tories” and vice versa. Height is indicated as 5ʹ8″ and 5ʹ4″ for tall and short women, respectively, and 6ʹ and 5ʹ8″ for tall and short men, respectively.
To make our experiment more realistic and representative of an online dating platform, we use profile pictures to represent facial attractiveness and race. In a standard conjoint task, participants often encounter profiles that simply list attributes such as age, race, or political affiliation, from which they indicate or rank their preferences. However, when trying to emulate the experience of online dating platforms, a list of attributes falls short. These platforms are predominantly visual, with users forming impressions based on profile images before diving into textual details. As such, the inclusion of profile pictures adds a layer of realism and enhances the ecological validity of our experiment (Vecchiato and Munger, Reference Vecchiato and Munger2021). We sourced objective attractiveness evaluations from a gender-balanced group of 500 participants on Prolific. For a detailed explanation of the photo selection and editing process, see Appendix E. Figure E2 in Appendix E provides a sample choice set. To construct the choice tasks, we employ a D-optimal fractional design which maximizes the statistical information from experimental data by minimizing the variance of the parameter estimates. This methodology is commonly used in design construction because it results in more precise estimates of the attribute effects (Hall et al., Reference Hall, Kenny, King, Louviere, Viney and Yeoh2001). One significant benefit of using a fractional design is its ability to reduce the total number of tasks while still maintaining high precision in the estimated effects, making it particularly advantageous for our study, where we include unique photos for each choice task.
Estimating the main effects of eight binary attributes requires at least nine degrees of freedom. For a model with interaction effects of all attributes with partisanship, we require at least 15 degrees of freedom. We choose to include 16 choice sets to marginally increase statistical power without compromising survey quality or inducing respondent fatigue, and we randomize the order of choice sets to minimize order effects (Bansak et al., Reference Bansak, Hainmueller, Hopkins, Yamamoto, Druckman and Green2021). The R package skpr is used for the conjoint design (Morgan-Wall and Khoury, Reference Morgan-Wall and Khoury2021). We observe a D-efficiency value of 99 percent, indicating a high level of efficiency in capturing maximum information with the minimum number of choice sets. This suggests that we can confidently estimate the effects of each attribute with a high degree of precision.
3. Results
We organize the results into four main steps. First, we present results from a baseline model to test our hypotheses on the independent effects of profile attributes and address the RQ on the relative influence of partisanship. Second, we use matching indicators to test the hypotheses on shared traits, capturing the influence of alignment between respondent and profile attributes. Third, we examine gender differences in preferences to evaluate our gender-specific hypotheses. Finally, we assess moderators of political homophily, first testing the effects of tolerance and nonpolitical traits and then analyzing the influence of counter-stereotypical profiles on dating choices.
3.1. Main effects
We begin by presenting the main Average Marginal Component Effects (AMCEs) in Figure 1 and Table C2 in Appendix C. The figure provides estimates derived from a simple model that does not include any interaction terms. We retain the original coding for all attributes except partisanship, which is coded in relation to respondents’ own traits to indicate whether they belong to a similar party relative to the hypothetical profile. Respondents who are not aligned with either of the two political parties are excluded from this analysis. The AMCEs can be interpreted as the change in the probability of a profile being chosen when the attribute value is present, compared to when it is not, averaged across the other attributes (Hainmueller et al., Reference Hainmueller, Hopkins and Yamamoto2014). The coefficients plot visually depicts these AMCEs, showing the influence of each attribute level on the selection of dating profiles. Error bars are included to indicate 95 percent confidence intervals.
The effect of partisanship on dating preferences.

The figure clearly illustrates the substantial influence of political considerations on dating preferences, notwithstanding the presence of other distinguishing attributes. It is evident that politics serves as more than a mere indicator of lifestyle preferences or associated traits. Instead, individuals display strong dating preferences that specifically revolve around party affiliation: on average, profiles of co-partisans enjoy an 18.2 percentage point (pp) advantage over out-partisan ones. However, we observe that political preferences extend beyond mere partisanship. Political tolerance exerts a slightly greater influence on the selection process (0.199) and holds the greatest sway within the conjoint model. To contextualize, participants were as likely to favor a politically tolerant date as they were to opt for an attractive profile (0.182). This effect is more than twice the size of the coefficient for education (0.068), and the same holds true for partisanship.
A natural question emerges from these findings: are participants drawn to profiles expressing political tolerance, or are they merely repelled by those expressing intolerance? It is conceivable that a significant portion of the effect we observe is a result of participants steering clear of profiles that openly reject their political group. For instance, a Tory participant confronted with a “No Tories!” declaration might naturally be disinclined to select that profile. However, subsequent analyses hint at a more profound preference for tolerance (see Section 3.4). We observe that even within their own partisan group, participants value tolerance. In other words, if a participant identifies as a Tory, they appear more inclined toward another Tory who is “Open to match with anyone” over one who mentions “No Labor.” This indicates that the preference for tolerance is not a simple rejection of potential negative bias against oneself, but a genuine appreciation of open-mindedness in potential partners.
These results collectively lend support to H1a–b, suggesting that both partisanship and out-party tolerance are significant positive factors in shaping dating preferences. The findings also corroborate H2d and H3a–b pertaining to the positive influence of education, physical attractiveness, and height. Additionally, in terms of the RQ, the findings propose that while political homophily is a dominant factor in date selection, its impact is on par with physical attractiveness and is marginally outweighed by political tolerance.
3.2. Matched attributes
Analyzing individual attribute levels may obscure crucial differences driven by heterogeneous preferences. Some segments of the sample could favor specific characteristics in their dates, while others might prefer the absence of those traits, resulting in a dilution of their influence when considered collectively. An alternative approach to assess how profile characteristics influence respondents’ dating preferences involves testing the effects of matched characteristics between the profile attributes and participants’ characteristics, rather than focusing on individual attribute levels.
To achieve this, we construct matching indicators for all conjoint attributes, paralleling profile attributes with respondent traits at each level. A detailed description of these variables is presented in Table C3 of Appendix C.Footnote 8 For matching partisanship and ideology, independents and moderates are excluded, as in the previous analysis. Table C4 in Appendix C presents the AMCEs for when attributes correspond versus when they don’t (i.e. match vs. no match). For a more detailed view, Figure 2 breaks down coefficients across the two different categories for each attribute.
Attribute correspondence and dating preferences.

At the outset, the findings show that partisanship retains a significant influence among matched attributes, reinforcing its importance beyond being an indicator of other sociopolitical preferences. Nonetheless, Labor supporters demonstrate a stronger preference for co-partisan dates compared to Tories. On average, the probability of choosing a date among Labor respondents increases by about 22 pp if the date is also a Labor supporter, compared to an increase of about 13.7 pp among Tory respondents when the date is also a Tory. This suggests that Labor supporters value political alignment in their potential partners more highly than Tories do. This is in line with recent evidence from the US, which suggests that in young and educated populations, stronger in-group bias is more common among liberals (Labor supporters) than conservatives (Conservatives) (Bouke and Melios, Reference Klein Teeselink and Melios2025). With regard to political tolerance, individuals who align in intolerance are less likely to pair (−0.052), compared to those aligning in tolerance (0.155). Evidently, this pattern stems from an aversion toward intolerant out-partisans. In contrast, there is still a pairing tendency among intolerant co-partisans (see Table C6 of Appendix C).
The influence of matched attributes also extends to politically correlated traits, reinforcing the principle of social and political homophily in partner selection, as outlined in H2a–c. This is evidenced by the significant influence of matched race, diet, and ideology as seen in Table C4. In disaggregating these matches, we observe that dietary and ideological similarities hold roughly equal weight for the different subsamples. Racial matching reveals a higher likelihood for White matches compared to Black matches. This might be attributed to a multitude of factors, ranging from demographic distributions and societal norms to racial biases. Our findings could also be influenced by the smaller sample size of Black matches, reducing the statistical power to detect differences. Higher educational attainment is preferred by both degree and non-degree holders, in line with H2d.
Physical attractiveness exhibits a considerable shift in direction. While it initially holds a positive and significant AMCE of 0.182, it declines to −0.027 when viewed as a matched attribute. In other words, respondents are less likely to choose profiles that match their self-rated attractiveness, holding all else constant. This effect is driven by the tendency of (self-rated) unattractive respondents to avoid unattractive profiles (−0.091). Simultaneously, attractiveness remains desirable among attractive respondents (0.088), in line with H3a. Matched height holds less importance when compared to other attributes. We observe a preference for matched height among tall individuals (0.015), and no significant effect among short individuals. As mentioned in the conceptual framework, we expect that the influence of height is amplified when we look at gender differences, and we turn to this next.
3.3. Preferences by gender
To identify gender differences in dating preferences, we reestimate the benchmark model separately for men and women. In Figure 3, the AMCEs for both male and female respondents are presented. For the clarity and precision of this analysis, we specifically excluded data from respondents who assessed profiles of the same gender, aligning with our theoretical focus on opposite-sex relationship dynamics.
Gender differences in dating preferences.

The most salient gender differences emerge in ideology, partisanship, and physical attractiveness, respectively. First, on average, men exhibit a bias against dates with progressive ideologies (−0.029), whereas women favor them (0.105). This represents the most salient disparity between the two genders. Second, men place a considerably higher emphasis on attractiveness (0.257) compared to women (0.149). Third, while both genders lean toward co-partisans, this tendency is significantly higher among women. Partisan alignment slightly supersedes the preference for tolerance among female respondents, a trend not evident among men. These findings echo prior observations that female partisans, on average, exhibit a stronger preference for their in-group compared to men (Nicholson et al., Reference Nicholson, Coe, Emory and Song2016). To further untangle the gender difference in partisan preferences, we estimate the gender model separately for the Labor and Tory subsamples and present the results in Figure 4.
Gender and party-based differences in preferences for political attributes.

We observe that within the Labor cohort, women exhibit a co-partisanship preference that is 14.1 pp higher than their male counterparts. Conversely, the preference for tolerant dates among men exceeds that of women by 7.7 pp. Among Tories, the gendered distinction reverses: men’s preference for co-partisans exceeds women’s by 10 pp. Nevertheless, the preference for political tolerance remains comparably high for both men and women, with insignificant differences between them. From this examination, it becomes clear that the gendered disparity in co-partisanship over tolerance is predominantly influenced by female Labor respondents.
Turning to our initial expectations with regard to gender differences, we observe that height preferences, while negligible for men (0.002), carry greater weight in the dating decisions of women (0.062). This partly supports H3c: while it confirms that female participants prefer taller men, the data show no significant height preference among male participants. Concerning education, both men (0.080) and women (0.065) favor partners with a degree, and there are no significant gender differences in preferences for education. We therefore reject H2e. The results are similar in Table C8 of Appendix C, where height and education are recoded to reflect the respondent’s level of education (more or less educated) and height (taller or shorter) relative to the profile.
It should be noted that the motivations for using online dating applications tend to differ between men and women, with men more frequently seeking casual interactions and women more often looking for long-term relationships (Sumter et al., Reference Sumter, Vandenbosch and Ligtenberg2017). These divergent relationship goals likely shape the importance placed on various traits when evaluating potential partners, as reflected in the results above (Nicholson et al., Reference Nicholson, Coe, Emory and Song2016). For instance, men’s bias against progressive ideologies and their stronger emphasis on physical attractiveness could stem from a focus on short-term interactions, where physical and nonpolitical characteristics are prioritized. Conversely, women’s higher tendency to favor progressive ideologies and co-partisanship might be linked to a preference for long-term compatibility, where shared values play a more significant role. This aligns with the observation that women, on average, exhibit a stronger preference for in-group alignment than men.
3.4. Moderators of political homophily
In this section, we test for potential moderators of political homophily. First, we examine whether out-group tolerance mitigates the influence of partisanship on date selection. Second, we test the influence of nonpolitical attributes, namely physical attractiveness and height, in modulating political homophily. It is plausible that the salience of political alignment diminishes when other compelling attributes, such as physical attractiveness or a desirable height, are at play. To probe interaction effects, we fit an ordinary least squares (OLS) regression against our data, introducing an interaction term between shared partisanship and the relevant attributes in separate regressions. Finally, we examine whether participants are more likely to select out-partisans with counter-stereotypic traits. We run separate regressions for Tory and Labor respondents, where each group evaluates out-partisan profiles. Figure 5 shows the predictive margins of tolerance, separated by in-party and out-party affiliations.
Interaction of political tolerance and partisanship in date selection.

We find a significant and negative interaction between partisanship and political tolerance (β = –0.162, p< 0.000). The value placed on tolerance is reduced by over half when the profile is that of a co-partisan. In evaluating out-partisan profiles, participants are approximately 28 pp more likely to select a tolerant over an intolerant date. In contrast, with a co-partisan profile, the preference for tolerance (over intolerance) decreases to a 12.38 pp difference. Overall, out-group tolerance clearly moderates the effect of political homophily in partner selection. Although profiles characterized by high tolerance are generally preferred, this preference diminishes when the potential date shares the respondent’s own partisan identity, supporting H1c.
Turning to nonpolitical attributes, we plot the predictive margins of beauty and height, separated by in-party and out-party affiliations. We are interested in whether these two traits can moderate political homophily in date selection; that is, whether being attractive or tall can make people more likely to choose a date from a different political party. The results are provided in Figure 6.
Interaction of nonpolitical attributes and partisanship in date selection.

The interaction between attractiveness and partisanship is significant and negative (β= –0.071, p< 0.000), suggesting that being attractive decreases partisan preferences in date selection. Specifically, attractiveness increases the probability of being selected for a date by 15.2 pp within the same party and by 22.69 pp across different parties. This denotes a 6.49 pp decline in the attractiveness premium when evaluating co-partisans. Framed differently, participants are nearly as inclined to choose an attractive out-partisan as they are to opt for an unattractive co-partisan. These results are in line with H3d.
Similar results are observed for height (β= –0.063, p< 0.000). For out-partisan profiles, being tall increases the probability of being chosen for a date by 5.28 pp compared to being short. However, for co-partisan profiles, this height premium practically disappears, with tall individuals being only 0.31 pp more likely to be selected compared to their shorter counterparts. This suggests a reduction of 4.97 pp in the height premium when evaluating co-partisans. These results are in line with H3e.
1. Counter-stereotypical profiles
Next, we turn to the influence of counter-stereotypic attributes on date selection. Our analysis incorporates four key politically correlated attributes: ideology, race, education, and diet. At the conclusion of the survey, participants were asked about the degree to which they associate each attribute with supporters of the Conservative Party, the Labor Party, or neither. Responses to this question are presented in Figure 7. In line with the literature discussed in Section 1, we observe that Black individuals are predominantly linked with the Labor Party, whereas White individuals are more strongly associated with the Conservative Party. Ideologically, those with progressive beliefs are predominantly linked with Labor, with an approximate 63.36 pp higher likelihood, whereas traditionalists are overwhelmingly linked with the Conservative Party, by a notable margin of 67.01 pp. For dietary preferences, vegans and vegetarians are respectively 48.85 and 46.70 pp more likely to be linked with Labor over Conservative Party supporters. Contrary to our initial discussion, we find that degree holders are somewhat more associated with the Conservative Party, while non-degree holders are somewhat more linked to Labor. However, a majority (55.04 percent) do not link degree holders with either party, suggesting that they are not distinctly stereotyped toward one party over the other.
Partisan associations with attribute levels.

H2f–i predicts that respondents would show a preference for out-partisans who display counter- stereotypical attributes. This means that if Tory and Labor participants adhered to this expectation, both would be more open to selecting a potential date from the opposing party if that individual displayed traits that defied the typical partisan stereotypes. Figure 8 presents the AMCEs of politically correlated attributes for Tory and Labor respondents separately. For each sample, we restrict the analysis to the corresponding out-partisan profiles. In other words, we examine the responses of the Tory (Labor) sample when exposed to Labor (Tory) profiles. As in previous figures, the coefficients can be interpreted as the change in the probability of a profile being chosen when the attribute value is present, compared to when it is not, averaged across the other attributes.
Preferences for counter-stereotypical traits.

The data suggest that Tory respondents favor counter-stereotypic Labor profiles: they demonstrate a positive and significant preference for White (0.178), nonvegetarian (0.077), and traditional Labor profiles (0.229), compared to the corresponding baseline values. In contrast, Labor respondents, when evaluating Tory profiles, tend to favor more stereotypic traits. They are less likely to select a Tory profile when the photo depicts a Black individual compared to a White one (−0.051). Similarly, when presented with a Tory profile described as vegetarian, they show a pronounced preference for the alternative (−0.265). The sole deviation from this trend is ideology. Labor respondents are more likely to select a Tory profile labeled as progressive over traditional (0.125).
This observed asymmetry contrasts with the existing literature on interparty relations and stereotype consistency (e.g. Ahler and Sood, Reference Ahler and Sood2018; Shafranek, Reference Shafranek2021). While our study is not designed to empirically identify the causes of this variance, we offer two plausible explanations. First, despite our intent to study the effects of partisan norm violations in isolation, the specific attributes used—namely Black and vegetarian traits—might have inadvertently invoked other negative stereotypes toward these groups. This could partly explain the reluctance amongst Labor respondents to select out-partisans with these counter-stereotypic attributes. Second, the social psychology literature on the backlash against expectancy-violating behavior provides an additional layer of understanding (Jackson et al., Reference Jackson, Sullivan and Hodge1993; Bettencourt et al., Reference Bettencourt, Dill, Greathouse, Charlton and Mulholland1997; Mendes et al., Reference Mendes, Blascovich, Hunter, Lickel and Jost2007). When individuals encounter behaviors or identities that breach societal norms, they may react with discomfort or negativity. For Tory respondents, encountering a White or nonvegetarian Labor supporter does not deviate much from societal norms, and such profiles might not provoke any cognitive dissonance. In contrast, a Black or vegetarian Tory may appear as more of an anomaly, which might trigger perceptions of unfamiliarity and threat.
4. Robustness checks
We conduct a series of robustness checks to ensure the validity and reliability of our findings on the influence of partisanship in online dating. These checks are intended to address potential concerns regarding model specification, measurement, the timing of data collection, and subgroup variations (refer to Appendix D for the complete set of regression tables related to our robustness checks). First, we use a conditional logit model, consistent with the random utility model of choice (McFadden et al., Reference McFadden1973), to assess the main results, and find that they align closely with the findings from the OLS model. Next, we examine the robustness of our findings on matched attribute preferences by using an alternative measure of “matched tolerance.” In our main analysis, the measure of matched tolerance is derived by subtracting two values: the affection respondents reported feeling toward supporters of their own party and the affection they reported feeling toward supporters of the out-party. This approach approximates tolerance toward individual party supporters, capturing the interpersonal sentiment respondents hold toward people with different political affiliations. For our robustness checks, we gauge tolerance at an institutional level by adopting a differential measure using party feeling thermometers. Participants were asked to rate their closeness to the Labor Party and the Conservative Party on a scale of 0 to 10. This differential measure captures respondents’ emotional proximity to each party as a whole rather than their feelings toward individual supporters. The results are provided in Table C12. We find that shared partisanship still outweighs all other considerations in this model. Shared tolerance remains significant with closely aligned magnitudes.
Third, we examine whether responses differ by survey round (Table C13) and survey duration (Table C13). The results remained substantively unchanged across rounds, confirming the stability of our findings. We further examined whether the time taken by participants to complete the survey affected their responses. Hasty decision-making might yield distinct outcomes compared to more deliberative responses. However, our findings revealed no significant differences attributable to the survey’s completion duration.
Fourth, we explore the potential heterogeneity in our main findings based on respondents’ demographic characteristics. The regressions in Table C15 represent the estimated effects of the conjoint attributes on date choice, while accounting for interactions with relationship status (Panel A), age (Panel B), and education (Panel C). The indicator variable for relationship status takes on a value of 1 if the respondent is in a relationship, and 0 otherwise. Age is a continuous variable ranging from 18 to 40, and education takes on a value of 1 if the respondent has a degree, and 0 otherwise. Overall, we find no statistically significant differences in dating preferences by relationship status or age. For education, we observe slight differences in ideology, racial, and diet preferences. Participants with a degree are significantly more likely to select progressive (0.029) and vegetarian (0.026) dates, compared to those who are traditional and nonvegetarian. They are also less likely to select White compared to Black dates (−0.024). Nonetheless, their preference for co-partisans and tolerant dates is, on average, similar to those without a degree.
In addition, we test whether participants in our study exhibit lexicographic preferences. Testing for such preferences in a conjoint experiment is important as it allows us to understand whether respondents are making choices based on a single attribute, regardless of the levels of other attributes. In real-life decision-making, individuals often prioritize one key feature and make their choice based on that, ignoring other aspects. By this test (available in Figure A1), we are able to see that our participants evaluate all attributes when making their choices.
Finally, we extend the heterogeneity analysis to participants’ political characteristics in Table C16. Specifically, we distinguish between independents and partisans and between strong and moderate partisans. We define independents as participants who did not vote in the last general election and expressed equal closeness to both the Labor and Conservative Parties on the feeling thermometers. Strong partisans are identified based on their differential feeling thermometer value toward their in-party and the out-party. Participants are classified as strong partisans if the differential value exceeds the median value of 5. Otherwise, they are denoted as moderate partisans. The regressions in Table C16 represent the estimated effects of the conjoint attribute values on date choice, while accounting for interactions with the independents indicator in Panel A and the strong partisans indicator in Panel B. The results indicate that independents place significantly less value on partisanship (−0.161) and ideology (−0.129) compared to partisans, and a slightly higher value on political tolerance (0.034). Notably, independents also value the nonpolitical attributes of height (0.021) and attractiveness (0.090) more than partisans. Strong partisans, on the other hand, place a significantly higher value on partisanship (0.134) and ideology (0.156) compared to moderates, and a slightly lower value on tolerance (−0.093). They also value height (0.006) and attractiveness (−0.105) less.
5. Conclusion
There is an emerging consensus that political polarization across Western societies has spilled over unto nonpolitical decisions, including who people choose to date. Online dating platforms provide fertile ground for partisan sorting, allowing users to easily signal their political allegiances and for prospective dates to “swipe left” on opposing views. In this study, we use a conjoint experiment with 3,000 UK participants to estimate the relative desirability of a date based on their political and nonpolitical traits. We consider the role of politically correlated attributes such as tolerance, ideology, education, and diet to assess the extent to which they moderate the influence of partisanship on partner selection.
First, we reaffirm past conclusions that partisanship crucially shapes dating preferences; however, we find that the scale of its influence is comparable to, if not surpassing, traditional dating criteria. Participants valued partisanship as much as they did physical attractiveness, and twice as much as they valued educational considerations. Second, unlike previous work, we identify different factors that cause individuals to look beyond political differences when forming relationships. Notably, political tolerance emerged as a central influence, moderating partisan predilections in dating choices. Essentially, while individuals exhibited limited tolerance in their own dating preferences, strongly favoring co-partisans, they placed a high value on tolerance in their potential partners.
Beyond the primary findings, our study identifies pronounced heterogeneities in dating preferences by gender and political alignment. We provide novel evidence that Labor Party supporters exhibit stronger political biases in their dating choices. We also observe marked asymmetries in how partisans respond to counter-stereotypic profiles. While Tories displayed a preference for atypical over stereotypic out-partisans, Labor supporters notably leaned toward the latter. This finding diverges from recent US research, which posits that stereotype inconsistencies consistently diminish partisan social divides (Ahler and Sood, Reference Ahler and Sood2018; Shafranek, Reference Shafranek2021, e.g.) but aligns with recent evidence suggesting asymmetries in polarization are growing faster among left-leaning partisans (Bouke and Melios, Reference Klein Teeselink and Melios2025).
Men notably exhibited a bias against progressive ideologies, whereas women leaned favorably toward them. Interestingly, women were significantly more likely than men to select dates from their own party, with female respondents prioritizing partisan alignment even slightly above political tolerance, a tendency less apparent among men. We show that this gendered disparity is largely attributed to female Labor respondents, who exhibited the most pronounced partisan bias across all gender-party combinations. One possible explanation for this pattern is the perception that conservative male voters are often associated with less feminist views (Bryson and Heppell, Reference Bryson and Heppell2010). These gender-specific findings align with recent reports indicating that young men and women in much of the developed world are politically “drifting apart” (The Economist, 2024).
The overarching theme discerned from our analysis is clear: while partisanship undoubtedly holds sway in the dating realm, other factors—many previously overlooked or under-emphasized—can meaningfully mediate its influence. This challenges the long-standing narrative that depicts political divides as almost insurmountable barriers in relationship development. On a broader scale, the observations derived from this study underscore the importance of rectifying misconceptions surrounding out-partisan perceptions. This is in line with previous findings which show that partisans are amenable to corrections about out-party demographics and the extent of their disagreement with opposing views (e.g. Klar et al., Reference Klar, Krupnikov and Barry Ryan2018; Druckman et al., Reference Druckman, Klar, Krupnikov, Levendusky and Barry Ryan2022). Hence, fostering a more accurate understanding of out-partisans might be the key to mitigating deep-seated animosities, a step that holds profound implications for enhancing social cohesion and nurturing more informed, empathetic citizens.
In considering our findings, several areas for future research emerge. First, while our study focuses on Labor and Conservative Party affiliations, the confines of a two-party focus may not fully capture the nuances of the UK’s multiparty system. This suggests potential for future research which considers a broader spectrum of political affiliations, providing a more holistic view of dating preferences in a diverse political landscape. Second, while our analysis identifies asymmetric gender and partisan preferences, the foundational causes behind these patterns are not fully clear. This hints at the need for additional research work, perhaps qualitative in nature, to further explore and understand these findings.
Third, while our selection of attributes is grounded in extensive theoretical and empirical justification, it is neither exhaustive nor capable of capturing all potentially significant traits that influence relationship formation. One such example worth mentioning is geography.Footnote 9 Geographic factors, such as the size and composition of the local dating pool, may strongly influence how individuals trade-off political and nonpolitical characteristics when choosing partners. While online dating platforms initially reduce geographic barriers, location likely becomes an important consideration as relationships progress offline. Urban–rural differences, in particular, could shape dating dynamics in distinct ways. For instance, if young women are more likely to move from rural areas to cities, while young men remain in rural locations, this might create gender imbalances in local dating pools. Such imbalances could encourage urban women, benefiting from a larger and more diverse pool of potential partners, to place greater emphasis on nonpolitical characteristics. In contrast, rural men, operating within a smaller and less politically varied pool, might prioritize political alignment more strongly. These possibilities underscore the need for further research into how geography, gender, and partisanship interact to shape dating preferences.
Finally, the temporal setting of our analysis, particularly in the aftermath of the Brexit referendum, prompts further inquiry. Given the palpable divisions arising from the Leave vs. Remain discourse, a pertinent RQ emerges: how do Brexit-related identities influence dating preferences independent of traditional party alignments? This line of inquiry could provide comparative insights into the influence of opinion-based groups, like Brexit factions, versus established party affiliations in shaping interpersonal preferences.
Supplementary material
The supplementary material for this article can be found at https://doi.org/10.1017/psrm.2025.10011. To obtain replication material for this article https://doi.org/10.7910/DVN/G1H0UA
Acknowledgements
We would like to thank seminar participants at USC, LSE and SPSA 2024 as well as Kate Laffan, Costin Ciobanu, Bouke Klein Teeselink, and George Kavetsos for their valuable comments on different stages of this paper. All interpretations and errors are solely the authors’ responsibility.
Competing Interests
None.



 Open access

