


1. Introduction
Forecasting volcanic eruptions is a fundamental goal of natural hazard management but is notoriously difficult (Sparks, Reference Sparks2003; Coppola, Reference Coppola2020). One key to forecasting and mitigation is continuous monitoring of volcanoes and their surroundings to identify early indicators of unrest (Sparks and others, Reference Sparks, Biggs and Neuberg2012; Phillipson and others, Reference Phillipson, Sobradelo and Gottsmann2013; Caricchi and others, Reference Caricchi, Townsend, Rivalta and Namiki2021). Thermal unrest is a particularly useful early indicator since volcanic activity always involves heat transfer to the atmosphere (Coppola, Reference Coppola2020) and this sometimes (but not always) begins months or years before eruptions (Reath and others, Reference Reath, Pritchard, Moruzzi, Alcott, Coppola and Pieri2019; Girona and others, Reference Girona, Realmuto and Lundgren2021). Thermal unrest is also important for its impacts on other aspects of the Earth System, which in some cases might be easier to detect than the thermal signature itself. This is particularly relevant for glaciers, which can respond to thermal unrest through changes in their dimensions, elevation, surface morphology and velocity (Julio-Miranda and others, Reference Julio-Miranda, Delgado-Granados, Huggel and Kääb2008; Barr and others, Reference Barr, Lynch, Mullan, De Siena and Spagnolo2018; Reinthaler and others, Reference Reinthaler, Paul, Delgado Granados, Rivera and Huggel2019; Martin and others, Reference Martin, Barr, Edwards, Spagnolo, Vajedian and Symeonakis2021; Howcutt and others, Reference Howcutt2023; Mallalieu and others, Reference Mallalieu2024b). We hypothesize that the change in glacier velocity occurs when heating (perhaps due to the enhancement of underground hydrothermal activity, Girona and others, Reference Girona, Realmuto and Lundgren2021) triggers basal melt, leading to increased subglacial water pressures, reduced basal friction, increased sliding and ice acceleration (Iken and Truffer, Reference Iken and Truffer1997; Mair and others, Reference Mair, Willis, Fischer, Hubbard, Nienow and Hubbard2003). This means that thermal unrest might lead to periods of glacier speed-up prior to volcanic eruptions, followed by periods of glacier slow-down as efficient subglacial drainage networks develop (Magnússon and others, Reference Magnússon, Björnsson, Rott and Pálsson2010). These links suggest opportunities for volcano monitoring and eruption forecasting at a global scale, since more than 2500 glaciers globally are located within 5 km of an active volcano (∼7 million people live within 30 km of these volcanoes, Fig. 1, Edwards and others, Reference Edwards, Kochtitzky and Battersby2020) and satellite images now allow glacier velocity to be frequently and routinely monitored (Millan and others, Reference Millan, Mouginot, Rabatel and Morlighem2022). Despite this, robust links between volcanic activity and changes in glacier velocity are lacking (Rivera and others, Reference Rivera, Bown, Carrión and Zenteno2012; Barr and others, Reference Barr, Lynch, Mullan, De Siena and Spagnolo2018), and the potential of glacier velocity monitoring for eruption forecasting has never been tested. To help address this, we investigate changes in the surface velocity of Cone Glacier (Fig. 2), Alaska, between November 2017 and January 2022 to establish whether eruptions of Mount Veniaminof (on which Cone Glacier sits) in 2018 and 2021 triggered observable changes in glacier velocity.
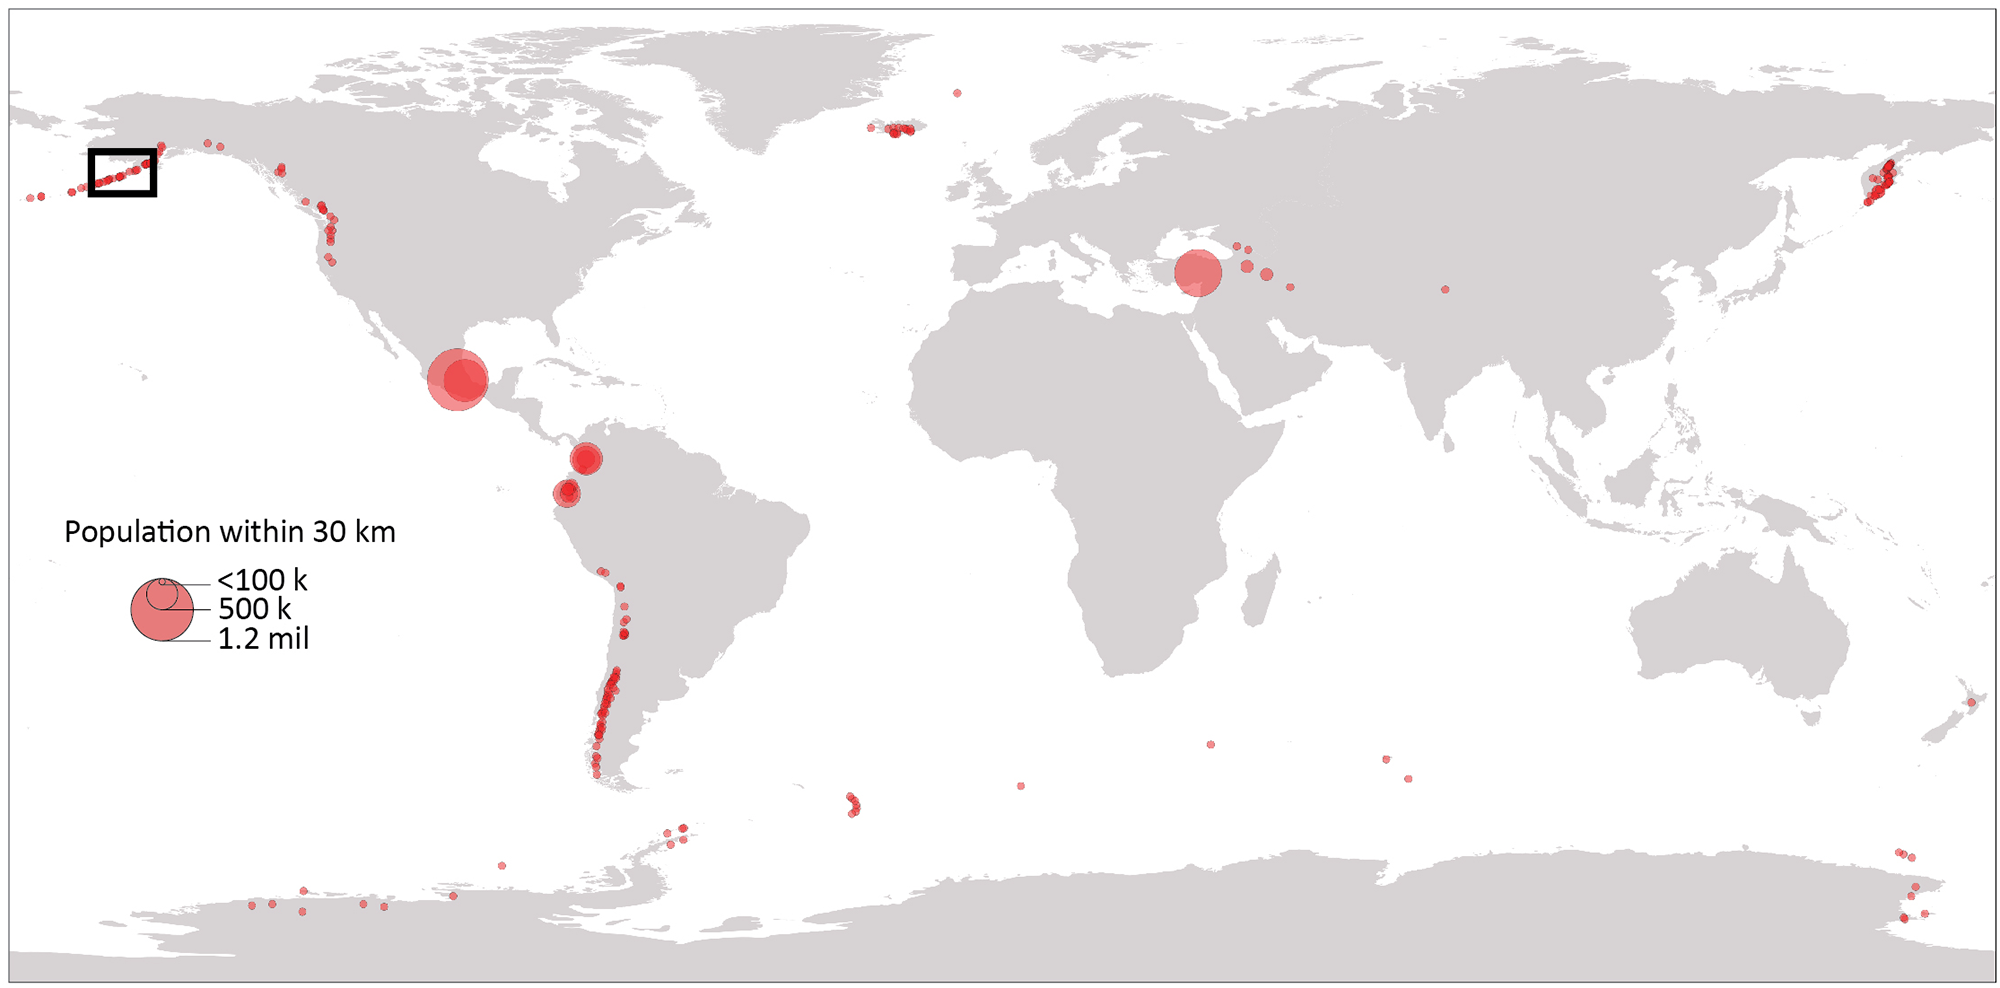
Active volcanoes globally that have glaciers within a 5 km radius. Circle size corresponds to the number of people living within 30 km of each volcano. Data from Edwards and others (Reference Edwards, Kochtitzky and Battersby2020). The black box shows the general location of Mount Veniaminof (the focus of this study).
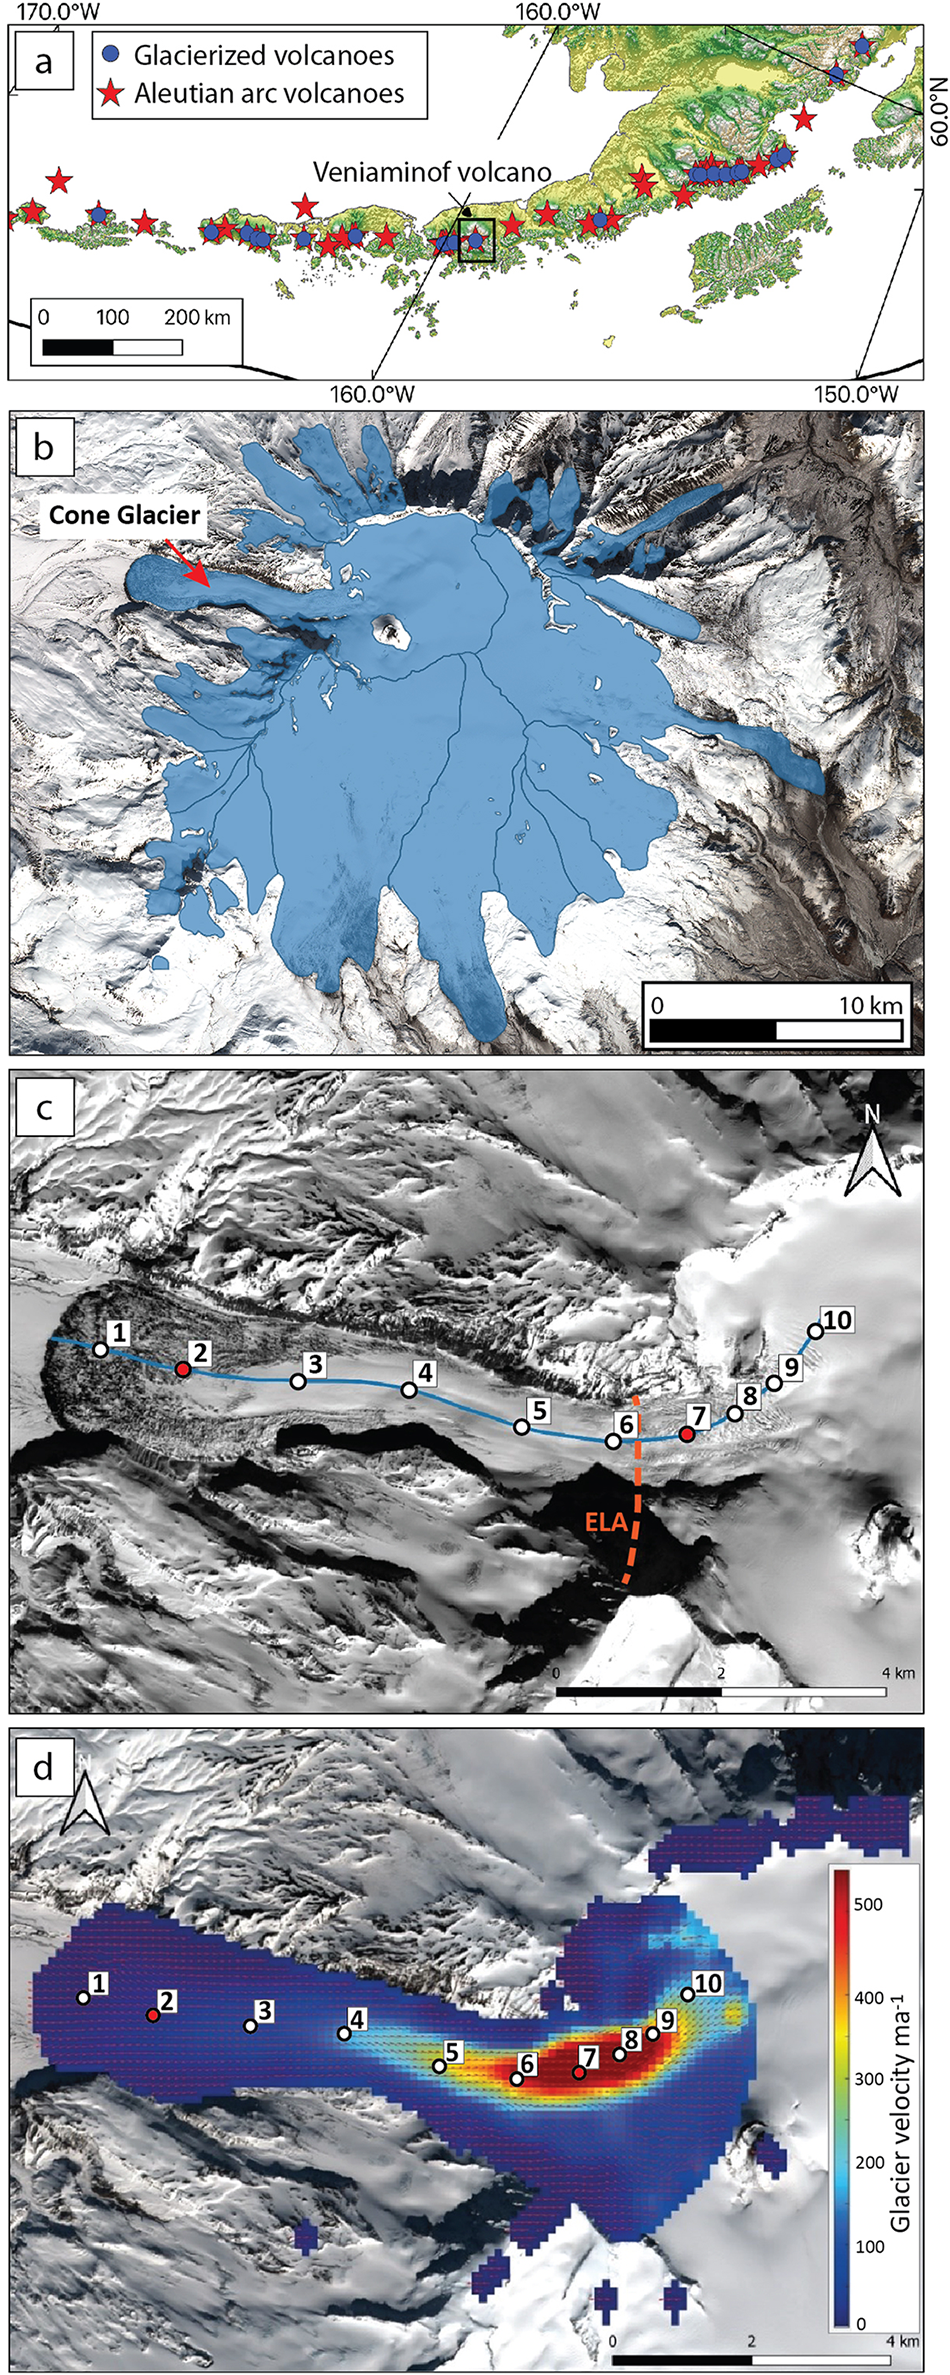
(a) Location of Mount Veniaminof in the Aleutian Arc volcanic system. (b) The glaciers of Mount Veniaminof (including Cone Glacier), as depicted by the Randolph Glacier Inventory (RGI 7.0 Consortium, 2023). (c) Profile approximately following the centerline of Cone Glacier with points (numbered) used for surface velocity time-series analysis. The approximate location of Cone Glacier’s equilibrium line altitude (orange dashed line) is based on data from Welch and others (Reference Welch, Dwyer, Helgen, Waythomas and Jacobel2007). Points 2 and 7 are (which are key to Sections 3 and 4) are shown in red. (d) The mean annual surface velocity of Cone Glacier. In (b), (c) and (d), the background is a Sentinel-2 true color satellite image from 25 March 2017.
Mount Veniaminof is a large (2507 m a.s.l.) glacierized stratovolcano on the Alaska Peninsula (Fig. 2a) which has experienced at least 19 eruptions since 1830–40 (Waythomas and others, Reference Waythomas, Edwards, Miller and McGimsey2023). The volcano has a summit caldera filled with glacial ice up to 475 m thick (Welch and others, Reference Welch, Dwyer, Helgen, Waythomas and Jacobel2007) that is drained by several outlet glaciers, including Cone Glacier (56.20° N, 159.44° W, Fig. 2b). Cone Glacier and the other outlets have equilibrium-line altitudes of ∼1300 m a.s.l. (Welch and others, Reference Welch, Dwyer, Helgen, Waythomas and Jacobel2007), placing the entire ice-filled caldera in the accumulation zone (Waythomas and others, Reference Waythomas, Edwards, Miller and McGimsey2023). Beyond the summit caldera, Cone Glacier comprises a steep and heavily crevassed icefall which descends to a region of lower surface slopes near the terminus (Fig. 2b). Each historical eruption of Veniaminof occurred within the summit caldera from a cinder cone (labelled Cone A in Fig. 2b, see also Fig. 3a) which rises ∼250 m above the surrounding ice (Waythomas and others, Reference Waythomas, Edwards, Miller and McGimsey2023). Volcanic activity has been mostly limited to small-to-moderate Strombolian eruptions with lava fountaining, low-level gas emissions and occasional lava flows (Fig. 3b; Loewen and others, Reference Loewen, Dietterich, Graham and Izbekov2021; Waythomas, Reference Waythomas2021). The two most recent eruptions occurred in 2018 and 2021. The 2018 eruption lasted ∼4 months (4 September–27 December) with a Volcanic Explosivity Index (VEI) of 2 (Waythomas and others, Reference Waythomas, Edwards, Miller and McGimsey2023). This eruption produced activity very similar to all other observed historic eruptions, with limited ash dispersal from the cone summit (approx. 25 000 m3; Waythomas and others, Reference Waythomas, Edwards, Miller and McGimsey2023) from sporadic Strombolian eruptions and the production of lava flows (1 200 000 m3; Waythomas and others, Reference Waythomas, Edwards, Miller and McGimsey2023) from the cone flanks that flowed downslope onto the ice surface and melted through the surficial snow and firn layers. Rare clear days in July and August 2018 immediately preceding the eruption onset showed elevated surface temperatures on the cone, but due to equipment issues no seismicity was recorded during that period (Waythomas and others, Reference Waythomas, Edwards, Miller and McGimsey2023). Comparisons of estimates to changes in the ice surface based on aerial surveys during the eruption (2018) and the following year (2019) are consistent with the eruption having melted into the caldera snow/firn/ice surface more than 100 m (Dietterich and others, Reference Dietterich, Loewen, Orr, Laker and Hults2021). The 2021 eruption lasted ∼1 month (starting on 4 March) with a VEI of 0–1 (Waythomas and others, Reference Waythomas, Edwards, Miller and McGimsey2023). Accurately quantifying subglacial melt during these eruptions is difficult, but widespread melt can probably be assumed since even during a comparatively quiescent phase (July 2005) geothermal heat flux in Veniaminof’s summit caldera was ∼19 W m-2 (Welch and others, Reference Welch, Dwyer, Helgen, Waythomas and Jacobel2007), which is notably larger than the average geothermal flux in Alaska (Batir and others, Reference Batir, Blackwell and Richards2015) and almost certainly sufficient to trigger widespread basal melt (Salamatin and others, Reference Salamatin, Murav’yev, Shiraiwa and Matsuoka2000). The routing of any produced meltwater is unclear partly because of uncertainties about subglacial topography (Welch and others, Reference Welch, Dwyer, Helgen, Waythomas and Jacobel2007), though drainage beneath Cone Glacier has been postulated by Yount and others (Reference Yount, Miller, Emanuel and Wilson1985) in relation to the 1983–84 volcanically active period. During this eruption, a large supraglacial lake formed and developed an englacial drainage tunnel on the eastern side of the volcanic cone (Fig. 3c and d); while no evidence for a jökulhlaup was directly linked to the drainage of the lake, an entrance to the drainage tunnel was directed to the north suggesting drainage through or beneath Cone Glacier. Unfortunately, there are no discharge/run-off data available for Muddy River, which drains from the terminus of Cone Glacier. Gridded (0.25° × 0.25°, 2 m above the surface elevation) ERA5 monthly reanalysis climate data (Hersbach and others, Reference Hersbach2020) show that in the Veniaminof region mean annual temperature and annual precipitation have increased by ∼2.3°C and ∼290 mm, respectively, since 1950. Over the 2017–22 period, annual values ranged from 0.4–3.1°C and 1556–1920 mm, but neither dataset shows an overall trend.
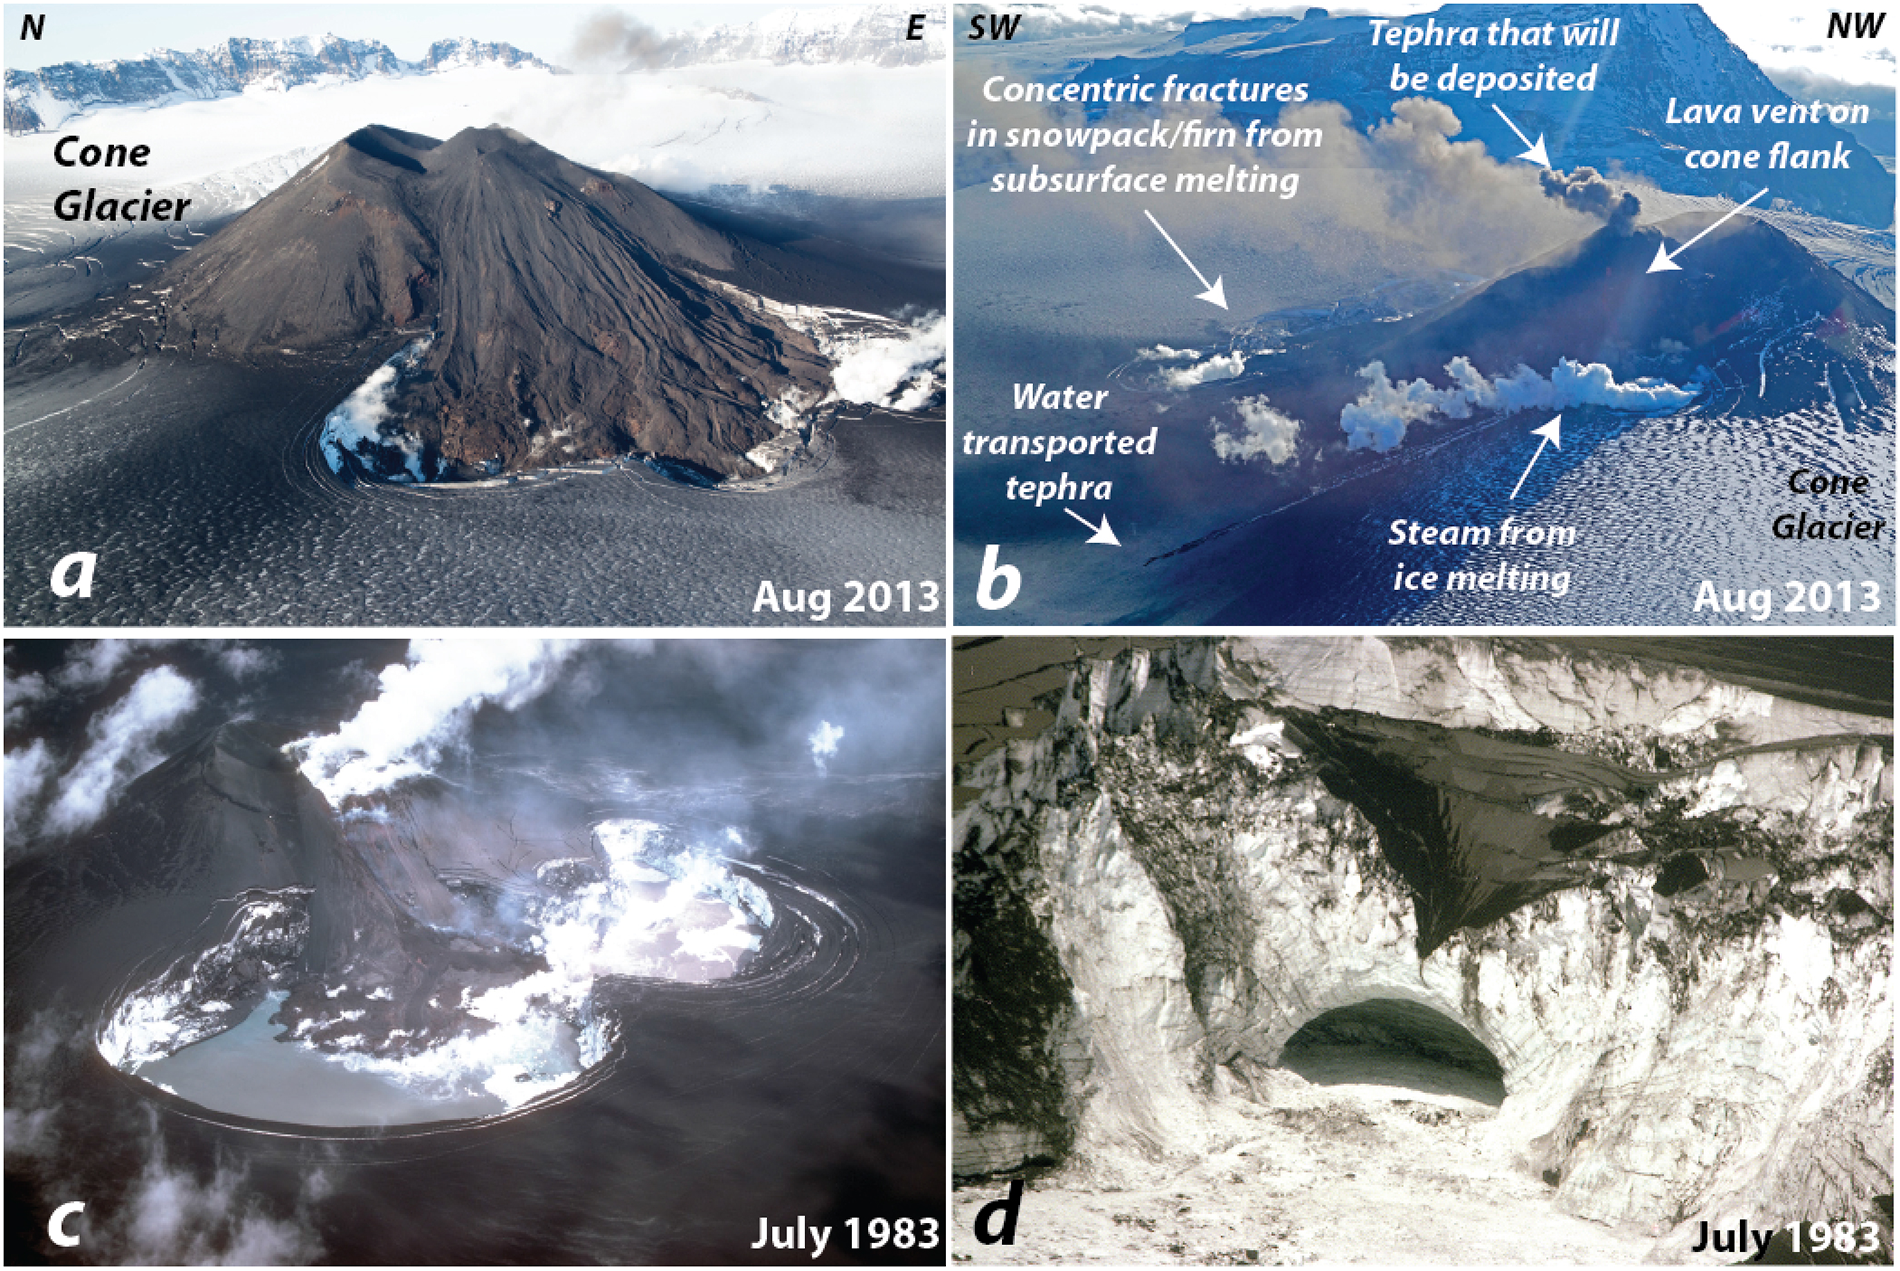
Illustration of volcano-glacier interactions at Mount Veniaminof. (a) Image looking north at the southern flank of caldera cone showing the extent of the lava field developed during the 2013 eruption (B.E. image). (b) Image looking west at the eastern flank of the caldera cone showing the production of summit tephra, co-temporal eruption of a lava flow from the sub-summit flank vent, concentric snowpack/firn fractures, steam production from direct lava-ice contact and supra-glacial water-deposited tephra from the 2013 eruption (B.E. image). (c) Oblique view of bilobate supra-glacial lakes formed during the 1983–84 eruption (image courtesy of M.E. Yount, Alaska Volcano Observatory). (d) Subsurface drainage cavern visible at the northeastern side of the supra-glacial lakes during the 1983–84 eruption (image courtesy of M.E. Yount, AVO).
2. Methods
The surface velocity of Cone Glacier was measured from November 2017 to January 2022 at intervals determined by satellite image availability. This period covers volcanic eruptions in 2018 and 2021 and several months of quiescence before and after. Velocity was tracked using Sentinel-2 near-infrared band 8 satellite images and the Glacier Image Velocimetry (GIV) open-source toolkit (Van Wyk de Vries and Wickert, Reference Van Wyk de Vries and Wickert2021a). The near-infrared band was chosen as it provides good contrast between different features on glacier surfaces (Van Wyk de Vries and Wickert, Reference Van Wyk de Vries and Wickert2021a). A total of 99 cloud-free images with a 10 m spatial resolution were used and were restricted to a single orbit to minimize georeferencing error and topographically correlated distortions which can manifest as apparent displacements unrelated to glacier motion (Kääb and others, Reference Kääb, Winsvold, Altena, Nuth, Nagler and Wuite2016). GIV is optimized for producing monthly velocity data. Therefore, different velocity values computed from image pairs that fall into a given month are averaged, but also time windows of more than 1 month are considered with a lower weight (Van Wyk de Vries and Wickert, Reference Van Wyk de Vries and Wickert2021a). This strategy of not only using consecutive image pairs to reproduce velocity data is called temporal-oversampling (Section 2.2.4 in Van Wyk de Vries and Wickert, Reference Van Wyk de Vries and Wickert2021a). Test runs were performed in GIV, varying the temporal oversampling, minimum and maximum time intervals for image pairs, image filtering and output resolutions (see Van Wyk de Vries and Wickert, Reference Van Wyk de Vries and Wickert2021a, and the GIV user manual for full parameter descriptions—Van Wyk de Vries and Wickert, Reference Van Wyk de Vries and Wickert2021b). Results with minimum noise were obtained by selecting an output resolution of 100 m, limiting the time separation for image pairs to a minimum of 21 days and a maximum of 1 year and setting the time oversampling factor to 30 (Van Wyk de Vries and Wickert, Reference Van Wyk de Vries and Wickert2021a, Section ‘2.2.4 Non-consecutive images’). Calculating velocity in this way generally reduces noise but introduces a degree of smoothing to the velocity time series. This procedure of ‘temporal oversampling’ is described in detail in Section ‘2.2.6 Temporal resampling’ of Van Wyk de Vries and Wickert (Reference Van Wyk de Vries and Wickert2021a). Mean velocity fields (including respective standard deviations and error fields) were obtained as direct outputs from GIV. Monthly mean velocity here refers to the temporal mean of all individual velocity pairs. The North-South and East-West components are temporally averaged separately, and a new ‘mean velocity’ vector is computed from these. Our velocity maps have largest standard deviations, calculated from velocity maps with overlapping temporal baselines, along the edges of the glacier (see Fig. S1), due to topographic shadows, reduced surface crevassing and lower overall flow speeds (e.g. Heid and Kääb, Reference Heid and Kääb2012; Van Wyk de Vries and Wickert, Reference Van Wyk de Vries and Wickert2021a). We estimate surface velocity error from ten randomly selected ‘stable ground’ points (i.e. regions ‘off-ice’ which are not expected to be moving). Because standard deviation is greatest along the glacier’s edges, velocity time-series were extracted for ten points along a profile roughly following the glacier centerline (Fig. 2c). A time-series of mean monthly temperature and monthly precipitation for November 2017–January 2022 was obtained from gridded ERA5 reanalysis data (Hersbach and others, Reference Hersbach2020) for the 0.25° × 0.25° grid square within which Cone Glacier sits.
3. Results
For the entire November 2017–January 2022 period, the surface velocity of Cone Glacier ranged from ∼10 to 20 m a−1 near the terminus to ∼630 m a−1 at the highly crevassed icefall region further up glacier (Fig. 2d). These annual velocities are similar to other Alaskan glaciers (Burgess and others, Reference Burgess, Forster and Larsen2013) and the overall spatial pattern with high velocities in the icefall region and slower velocities near the terminus is common to glaciers globally (Hodge, Reference Hodge1974). We calculate a median velocity uncertainty of 10.02 m a−1 with an interquartile range of 8.09–13.11 m a−1, suggesting that absolute velocities are more uncertain in slow-moving regions near the terminus but have good reliability (<5% error) in the fast moving icefall region. Generally, the velocity data show a seasonal cycle with fastest velocities in spring and early summer, but there is a contrast between the parts of the glacier near the terminus (points 1–3) which show little relation between air temperature and velocity and the upper parts of the glacier (points 4–10), including the icefall region, which show a clear relationship (compare points 2 and 7 in Figs. 4 and S4 for all other points). It is also apparent that even in the icefall region, in 2018, the seasonal velocity cycle was disturbed by a period of elevated velocity that began ∼10 months before the volcanic eruption and ended ∼3 months before it. Glacier velocities were unseasonably low immediately before and during the eruption (September–December) and for at least 3 months after (into early spring 2019). In 2021, a period of elevated velocity began ∼2 months before the eruption and continued until ∼3 months after. Near the glacier terminus (Fig. 4a), velocity generally slowed from spring 2018 to early 2021. (Note: explanations for these trends are discussed in Section 4.2). A comparison between glacier velocity and precipitation revealed no clear or consistent relationships, either near the terminus or further up glacier (see Figs. S4 and S5). It is also worth noting that over our period of interest (i.e. November 2017–January 2022) neither the thickness nor surface gradient of Cone Glacier (both of which can impact ice velocity, Cuffey and Paterson, Reference Cuffey and Paterson2010) varied significantly. For example, at point 2 (see Fig. 2c) between 2015 and 2019 (a period for which published glacier elevation change data are available), Cone Glacier thinned at a rate of ∼0.7 m a−1 (Hugonnet, Reference Hugonnet2021).
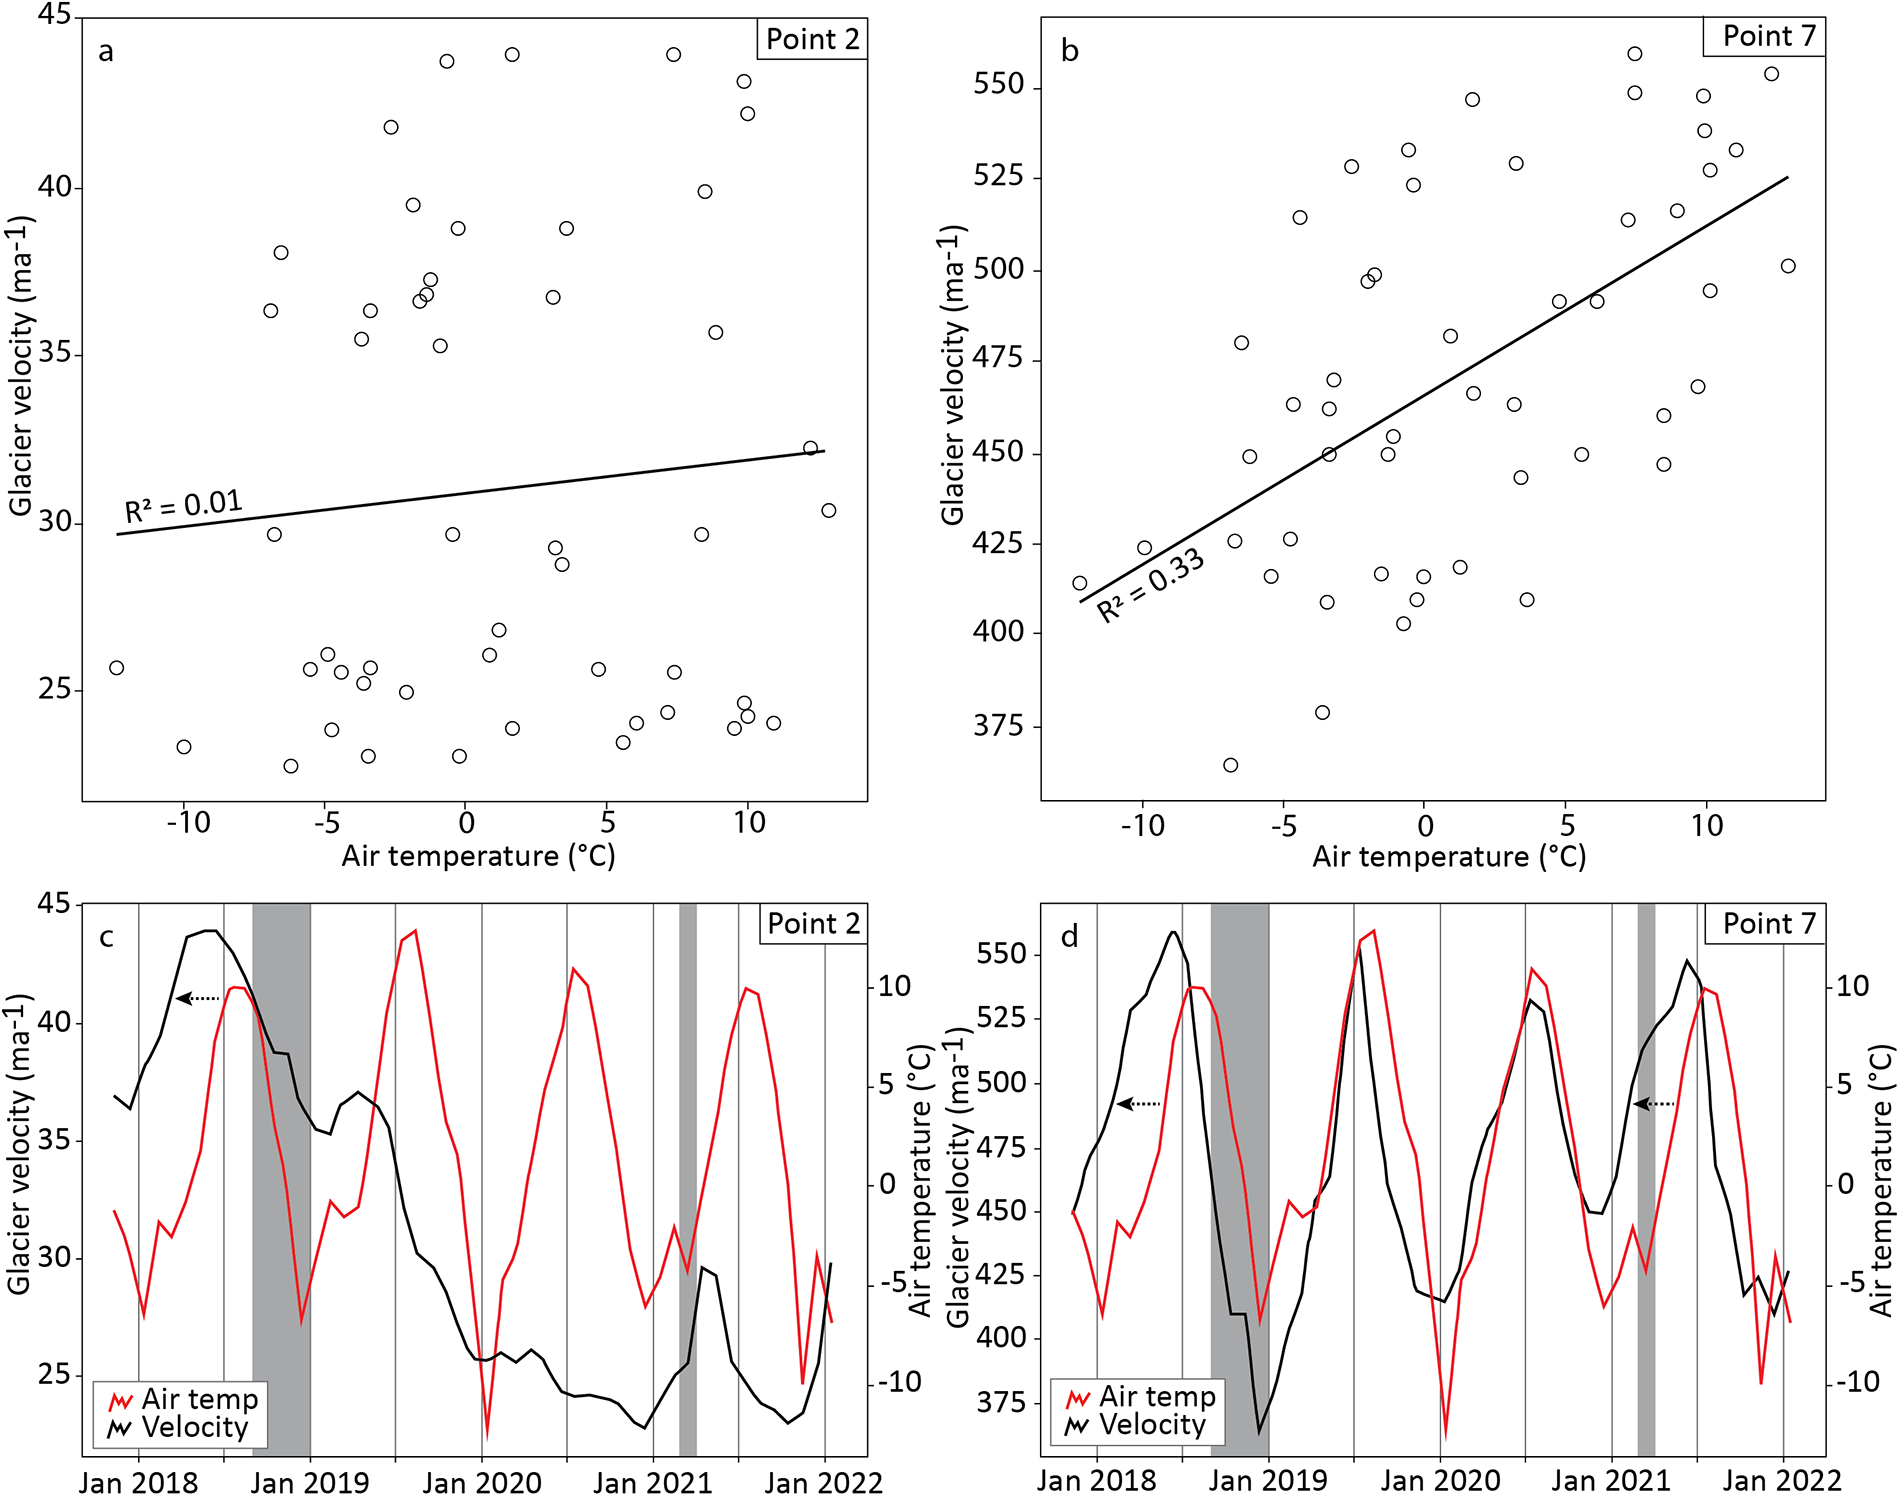
Comparison of velocity data for points 2 and 7 (see point locations in Figure 2c), reflecting near-terminus and icefall regions of Cone Glacier. (a) and (b) Relationship between monthly velocity and air temperature. The solid line (and associated R 2 values) shows the relationships for the entire November 2017–January 2022 period. (c) and (d) Time-series of glacier velocity and air temperature. Dashed horizontal arrows illustrate offsets between periods of increased glacier velocity and periods of increased air temperatures. Grayed areas reflect eruptions at Veniaminof. The median velocity uncertainty is 10.02 m a−1 with an interquartile range of 8.09–13.11 m a−1. Note this figure highlights only two points on the glacier surface but data for all ten points are presented in Figures S2 and S3.
4. Discussion
4.1. Climatic impacts on Cone Glacier’s velocity
Results from Cone Glacier show that during the November 2017–January 2022 period, seasonal air temperature fluctuations partly regulated ice velocity, with fastest flow during the warmest months of the year (and vice versa). This is particularly true in the icefall region (see Fig. 4b) away from the glacier’s terminus. This seasonal cycle is characteristic of temperate glaciers since increased air temperatures and associated meltwater coincide with poorly evolved and hydraulically inefficient subglacial drainage systems in spring/early-summer, triggering an increase in basal water pressure, a reduction in friction and a period of ice acceleration (Iken and Truffer, Reference Iken and Truffer1997; Rathmann and others, Reference Rathmann2017). Velocity slows during late summer as subglacial drainage systems become more efficient, and meltwater is therefore evacuated without substantially increasing subglacial water pressures (Schoof, Reference Schoof2010; Sole and others, Reference Sole2013; Larsen and others, Reference Larsen, Ahlstrøm, Karlsson, Kusk, Langen and Hvidberg2023). Velocities slow further in winter when decreased air temperature reduces meltwater supply and ice deformation gradually closes subglacial channels (Schoof, Reference Schoof2010).
4.2. Volcanic impacts on Cone Glacier’s velocity
In its icefall region (point 7, Fig. 4d), Cone Glacier’s velocity shows a seasonal cycle (Section 4.1). Despite this, in both 2018 and 2021, velocity is unseasonably high months prior to eruptions (Fig. 4d). We suggest that these unseasonably high glacier velocities are a result of widespread volcanic heating (including directly beneath Cone Glacier) which triggered ice melt and caused glacier acceleration when subglacial drainage was inefficient (e.g. in winter and early spring). In this circumstance, we don’t necessarily envisage a subglacial flood, but widespread basal melt and associated lubrication. In 2018, velocities were unseasonably low immediately before, during and after the eruption (which occurred in September–December) most likely because the ongoing heating reinforced efficient subglacial drainage (by enlarging subglacial channels), with any volcanically triggered meltwater produced during and after the eruption therefore efficiently discharged from the bed with limited impact on velocity (Fig. 4d). By contrast, in 2021, the eruption occurred in March, when the drainage system would normally be inefficient. The pre-eruption heating here was likely able to allow a distributed subglacial drainage system to start to develop, but not sufficient to form a fully efficient system, perhaps due to comparatively limited volumes of subglacial meltwater during this short and small eruption (Waythomas and others, Reference Waythomas, Edwards, Miller and McGimsey2023). Thus, meltwater produced during and after the eruption may have drained inefficiently and contributed directly to glacier speed-up which continued for several months after the eruption (Fig. 4c). Here, we discuss these impacts for Cone Glacier’s icefall region (point 7, Fig. 4b) but they also apply (to varying degrees) to other regions of the glacier (see Fig. S2), with contrast between the upper parts of the glacier (particularly points 5–10) where a seasonal velocity cycle is interrupted by short term periods of acceleration/deceleration, and the lower parts of the glacier (particularly points 1–3) where a seasonal velocity cycle is hard to discern and where a general reduction in velocity occurred from spring 2018 to late-2020/early-2021 (see Fig. S2). In all, these results suggest that volcanic activity can have observable impacts on glacier surface velocities, but that the nature of this relationship is modulated by the intensity and temporal extent of the volcanic unrest and associated thermal activity, and its interference with the existing subglacial hydrological drainage. Unfortunately, at Mount Veniaminof, there are no local geothermal heat flux measurements covering our period of interest but (as noted in Section 1) even during a comparatively quiescent phase (July 2005) geothermal heat flux in the summit caldera was ∼19 W m−2 (Welch and others, Reference Welch, Dwyer, Helgen, Waythomas and Jacobel2007) and almost certainly sufficient to trigger widespread basal melt (Salamatin and others, Reference Salamatin, Murav’yev, Shiraiwa and Matsuoka2000).
4.3. Glacier seed-up and eruption forecasting
Data from Cone Glacier indicate that periods of elevated surface velocity can precede volcanic eruptions by several months. A similar pattern was identified at Glaciar Amarillo, Chile, where glacier acceleration preceded the May 2008 eruption of Volcán Chaitén by a few months (Rivera and others, Reference Rivera, Bown, Carrión and Zenteno2012). As with Cone Glacier, the speed-up of Glaciar Amarillo is presumed to reflect increased ice melt, elevated subglacial water pressure and enhanced basal sliding triggered by thermal unrest prior to the eruption (Rivera and others, Reference Rivera, Bown, Carrión and Zenteno2012). Thus, both Cone Glacier and Glaciar Amarillo potentially indicate that glacier speed-up can be an early indicator of volcanic unrest. These are the only two glaciers globally where pre-eruption glacier speeds have been specifically investigated, yet neither is ideal for investigating volcanic impacts on glacier velocity. At Cone Glacier, the eruptive vent is not subglacial but protrudes above the surrounding ice (Waythomas and others, Reference Waythomas, Edwards, Miller and McGimsey2023), while Glaciar Amarillo is located ∼16 km east of Volcán Chaitén, the site of the eruption. This suggests that several other glaciers might show even stronger links between volcanic activity and glacier speed (Mallalieu and others, Reference Mallalieu2024b), and with direct monitoring of discharge from glacier-fed streams combined with continued analysis of glacier mass balance these links might become better understood.
5. Conclusions
In this study, we demonstrate that Cone Glacier (Alaska) experienced unseasonably fast flow velocities months prior to eruptions of Mount Veniaminof (on which the glacier sits) in 2018 and 2021, with unseasonably slow velocities immediately before, during and after the 2018 eruption. We suggest that these impacts on glacier velocity were caused by widespread volcanic heating (including directly beneath Cone Glacier) which triggered glacier melt and associated changes in subglacial water pressures (but without necessarily generating a subglacial flood) (for detail, see Section 4.2). Furthermore, the nature and magnitude of changes in glacier velocity may have been modulated by the state of the subglacial drainage system during the period of enhanced heating. Elevated pre-eruption ice flow velocities were also observed at Glaciar Amarillo, Chile, before the May 2008 eruption of Volcán Chaitén (Rivera and others, Reference Rivera, Bown, Carrión and Zenteno2012). In combination, these examples indicate that glacier speed-up might be an early indicator of volcanic unrest. This has potentially important implications for volcano monitoring and eruption forecasting at a global scale, since glacier velocity is now routinely and cost-effectively monitored and ∼250 of the world’s active volcanoes either have glaciers on their flanks or within a 5 km radius (Fig. 1) (Edwards and others, Reference Edwards, Kochtitzky and Battersby2020). This equates to more than 2500 glaciers globally that have the potential to act as indicators of imminent eruptions.
Supplementary material
The supplementary material for this article can be found at https://doi.org/10.1017/jog.2024.107.
Data availability statement
Glacier velocity and climate data presented in this study are available through Zenodo via https://doi.org/10.5281/zenodo.7919494.
Acknowledgements
This research was funded by Leverhulme Trust Research Project Grant: RPG-2019-093. We thank the reviewers and handling editor and are grateful to several members of the Alaska Volcano Observatory (AVO) for fruitful discussions on this manuscript during a visit to Fairbanks in December 2023.
Author contributions
Michael Martin conducted the research on which this paper is based. Iestyn Barr led the writing. Iestyn Barr, Benjamin Edwards, Matteo Spagnolo and Elias Symeonakis devised the project and contributed to manuscript preparation. Kathryn Adamson and Joseph Mallalieu contributed to the study design and manuscript preparation. Donal Mullan led climate-related aspects of the study and contributed to manuscript preparation. Maximillian Van Wyk de Vries helped with glacier velocity measurements and contributed to manuscript preparation.
Competing interests
The authors declare no competing interests.


 Open access