


Background and introduction
For many years, there has been widespread awareness (among policy makers, practitioners, researchers, people using services, their families and the media) that the adult social care system in England needs fundamental reform. While health care is delivered via a National Health Service available to all based on clinical need and largely free at the point of delivery, adult social care (practical assistance for frail or disabled people with activities of daily living such as getting up, getting washed/dressed, going to the toilet, eating etc) is organised locally by locally-elected Councils, is means-tested and access depends on meeting increasingly strict eligibility criteria. After an assessment of need by a social worker, care (if deemed eligible) may be provided from a mix of public, private and voluntary sector agencies, in a sector characterised by low status and low pay. Always organised differently and funded less generously than more universal services such as health care, adult social care has also faced a combination of pressures arising from demographic change and increased costs, rising need and demand, and the pursuit (since 2010) by successive governments of a policy of austerity and cuts to public expenditure. This article reviews the reform and costs of adult social care, drawing on initial analyses commissioned in the late 2000s to inform government policy in the run up to the 2010 General Election (Glasby et al., Reference Glasby, Ham, Littlechild and McKay2010). These informed, and were quoted, in a subsequent White Paper (HM Government, 2010, p.52) which set out ambitious plans for the creation of a ‘National Care Service’, with much greater similarities to the National Health Service than to the previous highly targeted, discretionary and poorly funded adult social care system. With the election of a new government in 2010, this was never implemented; the subsequent austerity agenda led to nearly a decade of spending cuts, service pressures and a growing sense of crisis. By 2019, there were almost daily warnings of the potential collapse of the current system, severe and adverse impacts on people with care and support needs (and their families), a mounting workforce crisis, the bankruptcy of a series of large care providers, and well-publicised abuse scandals (National Audit Office, 2018; BBC, 2019a-b; Holt, Reference Holt2019; Local Government Association, 2019; House of Lords Economic Affairs Committee, 2019).
Against this background, this paper reviews what happened to adult social care spending from 2010 to the present day, comparing this with the reform and spending scenarios we set out in 2010. Given a massive shortfall in available funds and the financial/service pressures facing adult social care, we also explore how the growing gap between need and funding is currently being plugged – and the severe impacts this is having on people’s lives. The paper then projects future funding and its share of regional gross value added (GVA, a common measure of the value of goods and services), enabling us to set out spending on adult social care as a proportion of the overall value of the economy to 2060. To our knowledge, this is the first analysis of its kind to present policy makers with different scenarios for adult social care funding and reform, to view these in practice (by comparing them to nearly a decade of policy) and to set out the relationship between future economic growth and the provision of sustainable adult social care. In the process, the paper sets out the very different ways in which spending has changed for working age adults and older people, with older people bearing the brunt of social care funding cuts in terms of unmet need, greater levels of self-funding, poor quality and greater pressure on families. This paper focuses on the adult social care system in England, but most developed countries are struggling with similar pressures (Colombo et al., Reference Colombo, Llena Nozal, Mercier and Tjadens2011). This was also the case even before the world-wide recession (Tarricone and Tsouros, Reference Tarricone and Tsouros2008; Australian Government Productivity Commission, 2010; Glendinning, Reference Glendinning2010), and current pressures are not merely the product of austerity.
Adult social care reform and funding up to 2010
In 2010, Downing Street and the (then) Department of Health commissioned a review of the social and economic benefits of adult social care reform (Glasby et al., Reference Glasby, Ham, Littlechild and McKay2010). We described an English social care system widely recognised as ‘broken’, by commentators, policy makers, service users and families alike. Our report outlined the drivers of increasing social care demand, including demographic change and changes in family structure. We discussed the sources of perceived injustices in the existing system, including rising public expectations and increasing concerns about geographical and economic equity. We described a sense of ‘crisis’ in terms of funding, fairness and perception and provided an overview of the recent history of adult social care policy responses to these issues, setting out five key rationales for reforming adult social care:
-
1. Maintaining social and public expectations that the state will provide a degree of collective support to its most vulnerable citizens;
-
2. Supporting people to have greater choice and control over their services, and hence over their lives;
-
3. Enabling people to remain independent for as long as possible so that their needs do not deteriorate into a future/costly crisis;
-
4. Providing support to those in need so that they can contribute fully as active citizens; and
-
5. Reducing some of the negative impacts of poor social care on families and individuals who care for others.
In addition, we reviewed the evidence for five potential mechanisms for reform pursued by successive governments over time which seemed likely to continue to influence future policy:
-
1. Strategic commissioning – seeking best value for money by securing services from a mixed economy of care;
-
2. Greater collaboration between health and social care (on the assumption that local agencies working together might meet needs more effectively and reduce the costs of operating independently of each other);
-
3. Personalisation – utilising direct payments and personal budgets to achieve better outcomes for either the same (or potentially slightly less) money for some user groups;
-
4. Technology – with potential to provide better support to people through a system of telecare as well as to improve the efficiency of current working practices;
-
5. Workforce reform – reducing the costs associated with unfilled vacancies, use of agency staff and absenteeism.
In particular, we reviewed the impact each of these reform mechanisms might potentially have, setting out three future scenarios for future adult social care reforms and costs. In 2002, a formal review of health care spending commissioned by the government and undertaken by Sir Derek Wanless, a leading banker, projected different spending scenarios for the NHS. This was picked up with enthusiasm by the (then) New Labour government and led to significant increases in NHS funding in order to try to achieve a ‘fully engaged’ scenario (Wanless, Reference Wanless2002, preface: Letter to the Chancellor of the Exchequer) in which:
“Levels of public engagement in relation to their health are high. Life expectancy increases go beyond current forecasts, health status improves dramatically and people are confident in the health system and demand high quality care. The health service is responsive with high rates of technology uptake, particularly in relation to disease prevention. Use of resources is more efficient.”
Although the Review also recommended a similar process be undertaken in social care, this recommendation was not taken up by the government. Building on this approach, we set out three similar scenarios for social care:
-
Slow uptake : future policy and practice remain as now, with periodic attempts to more fully integrate health and social care, but without sustained and real change; little permanent workforce reform; some support for carers; ongoing preventative/rehabilitative pilots, but a failure to embed these in mainstream services; and low uptake of technology. This scenario describes a system which tries to meet basic social expectations by providing a bare minimum, albeit with some aspiration to higher quality and more responsive rights-based services. Despite a stated commitment to longer-term change, action is limited and sporadic, with the commitment more rhetoric than reality. Under this scenario, costs increase at a rate of 2% per year (Figures 3a-c), leading to a doubling of adult social care costs within two decades.
-
Solid progress : while the stated aims of policy remain similar, there is a more concerted effort to improve outcomes and deliver savings through integration; a greater understanding/embedding of the principles of personalisation; a genuine and sustained attempt to rebalance mainstream services towards a more preventative/rehabilitative approach (i.e. to move away from a ‘fire-fighting’ approach which focuses on meeting the needs of people in crisis, to one which can increase investment in prevention and rehabilitation to help people remain living independently at home, or to return home after a spell in hospital if they have experienced some sort of crisis in their health); a sustained commitment to a commissioning-led systemFootnote 1 ; greater support for carers; significant workforce reform; and more innovative use of IT. In practice, the intended benefits are not fully realized to quite the extent envisaged (for example, integration does not deliver as much as expected, and the impact of personalisation is reduced by professional and cultural barriers). Over time, thinking retreats to meeting basic needs, extending some rights and trying to boost prevention/rehabilitation. Under this scenario, costs are contained at current levels.
-
Fully engaged : there is a sustained commitment to genuine change, motivated by a desire to realize in full the benefits for the health and social care system and for wider society. Where the evidence base is currently contested or unclear, the mechanisms used surpass expectations and start to really deliver. Thus, partnerships achieve the outcomes/savings that intuition suggests they ought; commissioning proves an effective lever for reforming the system; personalisation is experienced as a lived reality by front-line staff and service users; there are high rates of technology take-up; and there is effective and ongoing workforce reform. This approach is underpinned by a genuine commitment to a rights-based approach, to mainstreaming prevention and rehabilitation, and to using social care funding to achieve a much broader range of social and economic benefits for users and carers. Under this scenario, there is a 2% reduction in costs (albeit the assumptions about what may be possible to achieve verge on the heroic).
To our knowledge, this was the first time the ‘Wanless scenarios’ – influential in persuading New Labour to significantly increase NHS spending, essentially tripling the health care budget over their period in office – were applied to adult social care, and the first analysis to present policy makers with such detailed projections for different levels of commitment to reform. Ultimately, our review highlighted the high costs of inaction – on existing demographic trends and with standard cost assumptions, we concluded that the real costs of adult social care (that is, after allowing for inflation) could double within two decades. Moreover, this would be the case for current services and approaches (which had already been strongly criticised for failing to fully and appropriately meet need), leading to significantly higher costs with no improvement in the quality of care. Even under our most optimistic and demanding scenario of ‘full engagement’, real spending on social care would merely be held at its 2010 level.
Adult social care policy and funding since 2010
Following the defeat of New Labour in 2010, the newly elected Conservative/Liberal Democrat Coalition rejected the previous administration’s White Paper, publishing its own ‘Vision for Social Care’ (HM Government, 2010). This set out seven key principles for reforming the adult social care system, focusing on prevention, personalisation, partnership, plurality, protection, productivity and people (Department of Health, 2010, p.8). Despite their impressive alliteration, these felt no different to previous policy commitments. The new government also committed to producing a new White Paper, and creating a sustainable legal and financial framework for adult social care by building on two key reviews: a legal review (commissioned by the New Labour government in 2008) led by the Law Commission, and a review of funding options for long-term care (chaired by Sir Andrew Dilnot).
The Law Commission’s review (Law Commission, 2011), published in May 2011, surveyed over sixty years of social care law since the National Assistance Act 1948. It concluded that the law had become confusing and unclear, and proposed a single statute that would integrate existing duties while updating them with best practice in terms of personalisation, safeguarding and commissioning (key parts of the current system, but lacking a statutory basis). Its core recommendation was to establish a new, positive legal basis for social care: the duty of local authorities to promote individual wellbeing, as opposed to ‘meeting need’. This would also necessitate local authorities thinking about the wellbeing of the population, not just those individuals fitting pre-defined eligibility criteria.
In July 2011, ‘Fairer Care Funding’: the report of the Commission on Funding of Care and Support was published (Dilnot, Reference Dilnot2011). This argued that care remains the last large uninsurable social risk: private insurers had failed to produce products that enable people to pool this risk through the market, and individuals can face catastrophic costs that cannot be predicted in advance (no one knows who will need care and who will not). In response, the report proposed raising the asset threshold from the existing £23,250 to £100,000, expanding the number of people who would receive state-funded care. It also proposed a cap on the amount any individual would contribute to their care (potentially £35,000), thereby helping individuals to plan ahead for future care costs and encouraging the insurance industry to develop new products.
The government then published a Draft Care and Support Bill (HM Government, 2012) in two parts, corresponding to each Commission’s recommendations, later enacted as the Care Act (HM Government, 2014). This represented the largest overhaul of adult social care law since the establishment of the welfare state. Part One of the Care Act was implemented in April 2015, alongside other support documents and statutory guidance. The Act:
-
Defined adult social care as the promotion of individual wellbeing
-
Placed a duty on local authorities to promote prevention and integration
-
Established a new right to assessment for carers
-
Placed a duty on authorities to maintain an information and advice service for all residents
-
Placed a duty on authorities to facilitate a diverse, vibrant and sustainable market for care and support services that benefit the whole population
-
Established a right to advocacy if a person lacks the capacity to be fully engaged in statutory social care functions
-
Established national eligibility criteria for social care assessments
-
Placed a duty on authorities to make safeguarding enquiries and establish an ‘Adult Safeguarding Board’ made up of local stakeholders, including the NHS and police.
Part Two of the Care Act set out the government’s response to the Dilnot Commission. It set an increased upper capital limit of £118,000 for care home residents (including the value of their home) and £27,000 for those who receive care at home. It also set an increased lower capital limit of £17,000 and an overall cap on expenditure of £72,000. These changes were marked for implementation in April 2016. Government also set out an aspiration that by defining care cost liability, interest in developing care insurance products would be stimulated in the private insurance market.
Although Part Two of the Care Act was much less generous than recommended by the Dilnot Commission, the newly elected Conservative government (2015-) baulked at its practical and cost implications and delayed enactment of Part Two of the Act, later abandoning it altogether (see Jarrett, Reference Jarrett2018, Reference Jarrett2019 for an overview of a number of the key events set out in the paragraph below). Following Theresa May’s election as leader, the Conservatives pledged to publish a Green Paper putting forward new proposals. During the 2017 General Election campaign (Conservative Party, 2017), the government set out ideas even further removed from the Dilnot recommendations: eschewing the lifetime cap and proposing to include the value of people’s homes when means-testing for home care (as well as for residential care). Negative reaction to the proposals was seen as a key factor in the loss of the Conservative’s overall majority, with many perceiving the changes to be regressive and/or a reduction in service. Political opponents labelled the changes a ‘Dementia Tax’, and the policy (which seemed to have been developed in a small inner circle without adequate consultation and debate) quickly unravelled. During a press conference to discuss the proposals, May declared ‘nothing has changed’ while also announcing a possible cap on costs and that yet further proposals would be set out in the government Green Paper, previously announced in the March 2017 Budget. In the context of Brexit negotiations, the government has delayed this Green Paper’s publication multiple times; it remains unpublished at time of writing. There have been at least 12 government Green/White Papers, vision documents and independent reviews since 1999 (Jarrett, Reference Jarrett2019), yet we are no closer to reforming the funding of adult social care than twenty years ago. Indeed, of proposals relating specifically to funding, none of the main recommendations have been implemented, and it is difficult to believe it will be 13th time lucky.
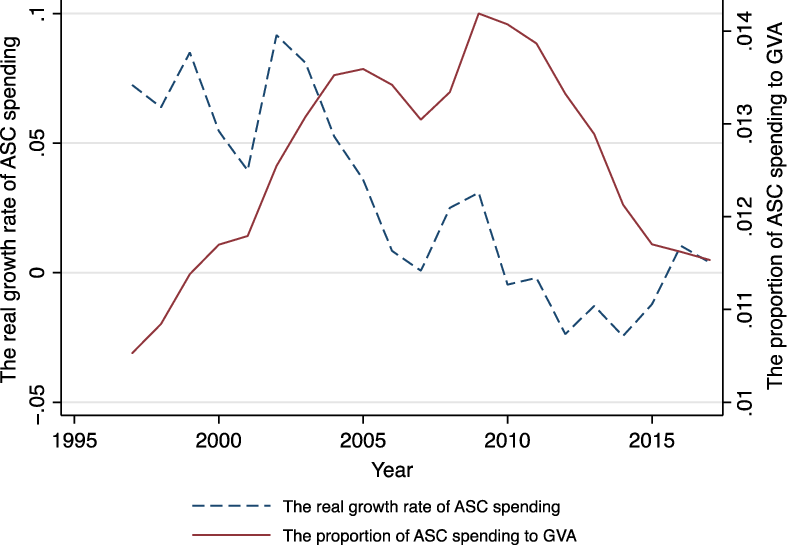
In spite of the focus of the Care Act on promoting wellbeing, many have argued that the laudable intentions of the new legislation were instantly undermined by the ‘austerity’ agenda begun by the Coalition Government in 2010. This was described by one council leader as ‘the end of local government as we know it’ (Glasby, Reference Glasby2015) and the Local Government Association calculates councils will have lost almost 60p in every £1 central government provides for local services (2010-20) (https://www.local.gov.uk/about/news/funding-black-hole). Our own analysis (Figure 1) shows that local authority spending on adult social care increased in real terms until 2011. Thereafter it declined (despite increases in need and demand), with an 8% reduction in gross spending between 2009-10 and 2015-16. Moreover, Figure 2 shows a massive reduction in the real growth rate of gross spending on adult social care and in the ratio of gross spending to Gross Value Added. Although councils protected social care expenditure relative to other areas of local government expenditure over the period, additional demographic pressures, broader funding pressures and increases in costs (such as the implementation of the National Living Wage) have culminated in a sense of ‘crisis’ in publicly funded adult social care services, and per adult spending fell by 13.5% over the period (Humphries et al., Reference Humphries, Thorlby, Holder, Hall and Charles2016). In recognition of these pressures, piecemeal injections of additional funding have been needed (for example, with government allowing local authorities to place an additional charge on local Council Tax, and some transfers of funding from NHS budgets). Consequentially, gross adult social care spending reached £17.53 billion, with a slight in-year increase in 2017 (albeit still lower than in 2010) (Cromarty, Reference Cromarty2019).
Gross expenditure on adult social care
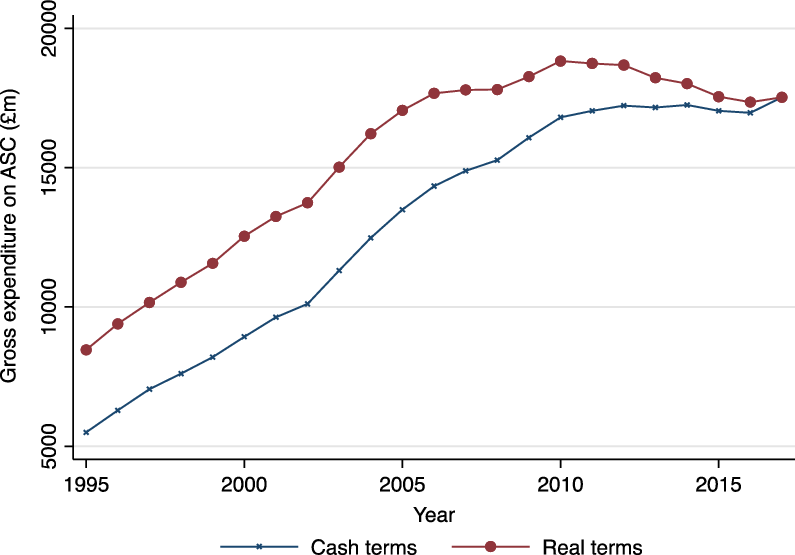
Real growth rate of gross expenditure on adult social care
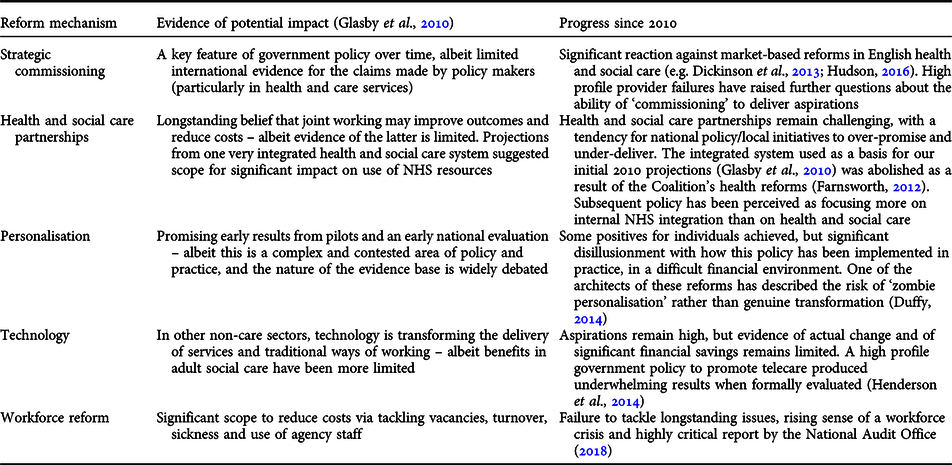
Returning to our 2010 analysis, we characterise the last ten years as a ‘lost decade’ for adult social care. Although the Care Act is now on the statute book, its influence on what is happening has in practice been minimal. Indeed an early review carried out by the Minister responsible for steering the legislation through Parliament found that (regarding the experience of carers, at least) the new law was too often poorly understood or ignored – and that the answer to the question of ‘has this made a difference?’ was ‘not yet’ (Carers Trust, 2016). Moreover, for many commentators, the failure of successive governments to move beyond platitudes and re-statements of previous policy towards anything substantive has been simply appalling (see, for example, Glasby, Reference Glasby2015; Humphries et al., Reference Humphries, Thorlby, Holder, Hall and Charles2016; Butler, Reference Butler2018; House of Commons Health and Social Care and Housing, Communities and Local Government Committees, 2018; Age UK, 2019; Johnson, Reference Johnson2019). There is no evidence of any real progress with the five main reform mechanisms we identified in 2010 and, indeed, quite a lot of evidence that previous attempts to pursue such policies have either stalled or gone backwards (Table 1).
Progress with key reforms
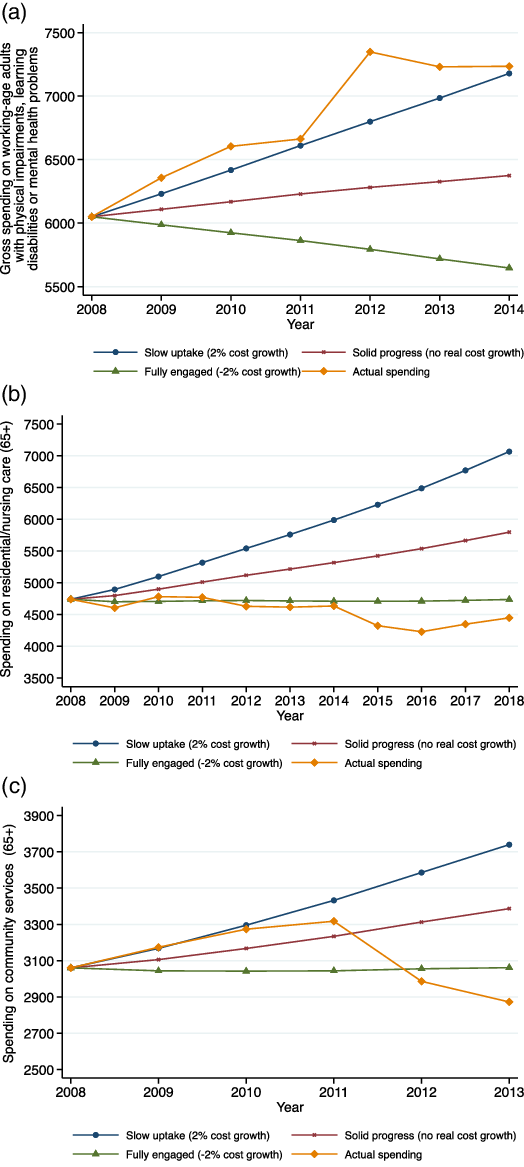
Of the three scenarios set out in 2010, this is worse than ‘slow uptake’, and – had funding remained available – we would expect the cost of adult social care to have rocketed. However, adult social care spending is heavily constrained by the availability of local government funding more generally, and it is possible to shed light on these seeming impossible financial and service pressures by comparing what happened in practice with our initial 2010 projections (Figure 3a-3c).
Between 2008 and 2014, local authority spending on social care for working-age people with physical impairments, learning disabilities or mental health problems was broadly consistent with or slightly above a ‘slow uptake’ scenario (increasing at an overall rate of around 2% per year). Given broader cuts to local government funding, this is a significant cost pressure – but spending has at least (broadly) kept pace with what we might have expected from our 2010 projections. Over the same period, however, spending on older people’s social care departed dramatically from our projections. In Figures 3b-3c, spending on older people (both on their residential/nursing care and on community services including home care services) fell significantly in real terms, to well below the levels needed to sustain previous services, even in the most challenging, ambitious and optimistic of our scenarios.
Given the ‘lost decade’ summarised above, a significant gap has thus opened between the rising cost of maintaining current services and the actual money spent. Actual spending on residential/nursing care for older people in 2018 was £4,449 million, for instance, while projected spending, under a ‘slow uptake’ scenario, was £7,066 million. Actual spending in 2013 and projected spending under a ‘slow uptake’ scenario on day and domiciliary provision for older people were £2,872 million and £3,739 million respectively. This raises profound questions about the impact this disparity may be having on service users, staff and other services.
a-c: Projected v actual spending (public adult social care funding) at 2008 prices, 2008-
The impact of spending reductions
With need and costs projected to rise significantly, and spending, especially on older people’s services, falling dramatically, our review of the evidence/analysis suggests that six key impacts are emerging:
-
1. Increasing levels of unmet/under-met need and rising levels of ‘self-funding’: based on an analysis of the English Longitudinal Study of Ageing, Age UK (2018) estimates that the number of older people who do not receive adequate support with ‘Activities of Daily Living’ (getting out of bed, going to the toilet, getting washed and dressed, etc.) increased to 1.4 million people in 2017. This means one in seven older people (14% of the 65+ population) was living with some level of unmet need (an increase of 19% since 2015). When the definition is broadened to ‘Instrumental Activities of Daily Living’ (shopping, cooking, managing medication, etc.), the number of older people who do not get the help they need rises to 1.6 million. Overall, an estimated 400,000 fewer older people are receiving social care as eligibility criteria have tightened in response to insufficient resources (Age UK, 2018). When this happens, extra pressure is placed on families (see below) and more people are forced to make their own arrangements, as best they can, in the absence of public support, by arranging and paying for their own care where this is feasible. Although it is difficult to obtain accurate information on levels of self-funding, latest UK Household Longitudinal Survey (UKHLS) data suggest around 350,000 people fund their own home care or care home places in England, many more than previously thought (Henwood et al., Reference Henwood, McKay, Needham and Glasby2018). Moreover, unlike other areas of life where having financial resources opens up new choices and opportunities, self-funders tend to be isolated, marginalised and disadvantaged compared to people receiving publicly-funded support, and pay a premium of some 40% for their residential/nursing care, effectively cross-subsidising council-funded residents (Henwood et al., Reference Henwood, McKay, Needham and Glasby2018).
-
2. Quality of care: where people are receiving social care support, there are increasing pressures on quality. The House of Commons Health and Social Care and Housing, Communities and Local Government Committees observe (2018, p.12):
“The quality of care provided is also suffering. We heard it described as ‘extremely patchy’, ‘variable’ and that the care given to people with dementia was often lower quality… Caroline Abrahams, Charity Director at Age UK, explained how the challenges in the workforce affected quality: ‘lack of continuity, never seeing the same person twice […] rushed visits – maybe quarter of an hour rushing in and out – with no time to establish a proper relationship, let alone real communication’.”
-
3. Pressures on carers: the growth in unmet need is also reflected in growing pressure on carers (family members, friends and neighbours who provide unpaid support for people with social care needs). In the annual budget survey of Directors of Adult Social Services, well over a quarter felt cuts to services had already reduced quality of life for carers, and many more expected this to be the case in future (ADASS, 2019). In the State of Caring survey 2019, over one-third of carers (37%) responding described themselves as “struggling to make ends meet”, while only one in ten felt confident that the support they receive and rely upon will continue (Carers UK, 2019). Nearly three-quarters (72%) said they had suffered mental ill health as a result of caring and 61% reported physical ill health as a result of caring. Data provided by NHS Digital (2019a) suggest that the proportion of carers reporting negative effects on their health has increased since 2016-17, with more carers reporting feeling tired, having disturbed sleep, general feelings of stress and feeling depressed.
-
4. Pressures on staff: a review of the adult social care workforce (National Audit Office, 2018) identified high overall turnover rates (27.8% in 2016-17) and vacancy levels (6.6% in 2016-17, and even higher for the care worker and registered nurse sub-categories), exacerbated by the difficulty of recruiting to low paid, low status roles. The House of Commons Communities and Local Government Committee (2017) has also drawn attention to the stressful and uncertain nature of care work, with many members of social care staff facing low wages, zero hours contracts and poor training. In 2018, 47.8% of care workers left within a year of starting (p.3) and the mean number of sickness days for directly employed adult social care staff in local authorities was 10.3 days per year (compared with 4.3 days for all workers nationally) (NHS Digital, 2019b, p.19).
-
5. Pressures on service providers: as the gap between need and funding widens, the provider market – mainly for-profit providers – has faced severe and sustained financial pressures. In 2017, a Competition and Markets Authority study of care homes in England (Competition and Markets Authority, 2017) concluded that existing (primarily publicly-funded) care home markets would prove to be unsustainable at current rates paid by local authorities. The ADASS (2019, p.30) Budget Survey revealed that “75% of Councils (up from 66% last year) reported that providers in their area had closed, ceased trading or handed back contracts in the last six months, with thousands of individuals affected as a consequence.” There have also been widespread media reports of national providers (both in home care and residential care), such as Allied Healthcare and Four Seasons, facing severe financial problems and potential bankruptcy (Care Quality Commission, 2018).
-
6. Pressures on partner agencies: when access to adult social care is significantly reduced, pressure can increase on the NHS (a universal service, free at the point of delivery, and unable to ‘say no’ to people in need in the way adult social care can). In recent years, vociferous campaigning to boost adult social care spending by various NHS bodies (see, for example, Dickson, Reference Dickson2019) has seen the NHS use its greater popularity, visibility and political capital to advocate on behalf of social care partners. A particular pressure point has been older people medically fit for discharge from hospital who are unable to vacate their bed due to lack of capacity in community services. Internal NHS factors account for most delays, but since 2010 waiting for social care services has grown as a reason for this. By October 2018, the most common reason for delay was patients awaiting a care package in their own home (rolling average of 1,008 patients delayed per day) while the third most common was awaiting a nursing home placement (rolling average of 673 patients delayed per day). Between August 2010 and February 2017, 1,185 more patients per day were delayed for social care-related reasons, a 96% increase (Nuffield Trust, 2019). Most debate has centred on the knock-on effects of the social care crisis on the NHS, but pressures have also been reported on the police and other services (see, for example, Cottam, Reference Cottam2018). Our 2010 analysis also demonstrated that spending on adult social care can affect people’s ability to work and social security spending, so it seems likely cuts in adult social care and social security also affect other partner agencies.
Long-term cost projections
Our cost projections for adult social care are based on assumptions about the proportion of people who will receive support from local authorities, the movement of the population, changes in the unit cost of social care and Gross Value Added (GVA), and stability in adult social care policies (see Annex for details). Existing studies focus on projecting adult social care spending (e.g. Wittenberg et al., Reference Wittenberg, Hu and Hancock2018), but do not explore if local authorities and the government can meet increased care demand. Tax revenue, a primary resource for adult social care support, is closely related to local economies, which can be measured by GVA. We therefore use GVA as a proxy for government’s financial capacity and project the ratio of gross spending on adult social care to GVA. The purpose of this projection is to emphasise the importance of the government budget (economic growth) when examining the sustainability of the adult social care system.
Our data source for adult social care expenditure is the finance return (PSS-EX1), now replaced (from 2014) by the Adult Social Care Finance Return (ASC-FR). The ASC-FR introduces new classifications [Long-Term (LT) and Short-Term (ST) support], posing comparability problems post-2014, especially for primary support and service provision. LT support refers to continuous care to maintain an individual’s quality of life, provided in a nursing, residential or community setting; ST support is time-limited and aims to maximise an individual’s independence, reducing their future need for support. Based on the new classification framework, we project gross spending on LT and ST support for older people (65+) and the working-age population, as well as the corresponding ratio of spending to total GVA, for 2018 to 2060; our projections are based on the three scenarios used in our 2010 analysis. We assume that the proportion of older people who receive support from local authorities for LT or ST support are constant. With constant ratios and 2016-based population projections from the ONS, we project the number of people receiving support. Projected costs are the product of the number of people receiving support, the real costs of this in 2018 and the assumed growth rate of real costs. From 1997 to 2018, the average GVA growth rate in real terms was approximately 2%. We therefore assume GVA increases by 2% annually for our projection period. The ratio of spending on adult social care to GVA is calculated by dividing projected spending by GVA.
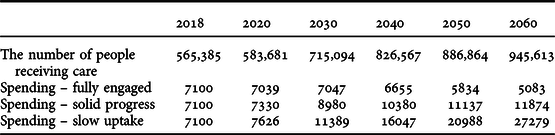
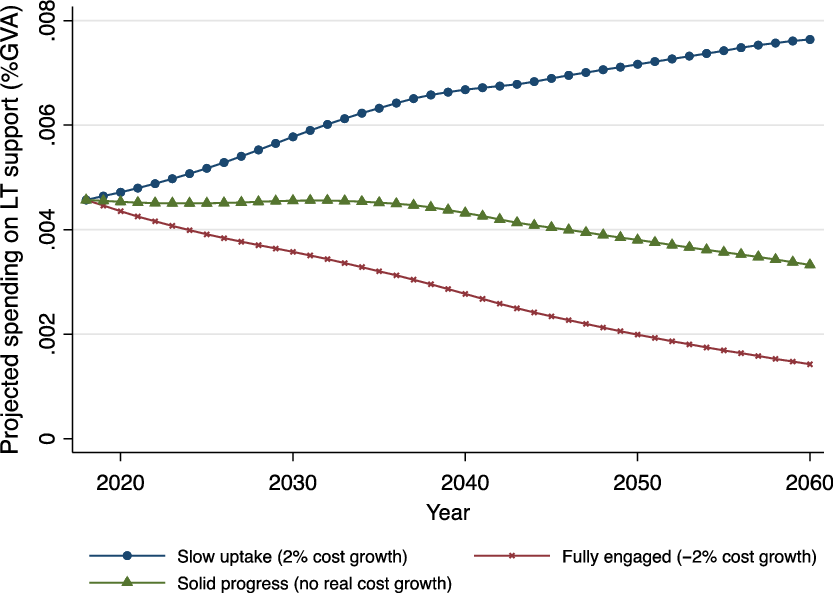
We assume that the number of people who receive local authority funded care support changes with ONS population projections. In 2018, 565,385 people aged 65+ received LT support; this increases to 945,613 in 2060 (Table 2). For ‘slow uptake’ and ‘solid progress’ scenarios, projected gross spending on LT support for older people increases, respectively, from £7,100m in 2018 to £27,279m and £11,847m in 2060. Spending is projected to fall, to £6,655m in 2040 and to £5,083m in 2060, under a ‘fully engaged’ scenario. Figure 4 displays the share of spending to GVA in England, which decreases in the ‘solid progress’ and ‘fully engaged’ scenarios, from 0.457% in 2018 to 0.333% and 0.142%, respectively, in 2060. Under ‘slow uptake’, the share is projected to increase to 0.668% in 2040 and to 0.764% in 2060.
Projected gross spending on long-term care for older people (65+) (£m)
Projected gross spending on long-term support for older people (% GVA)
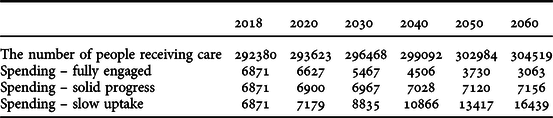
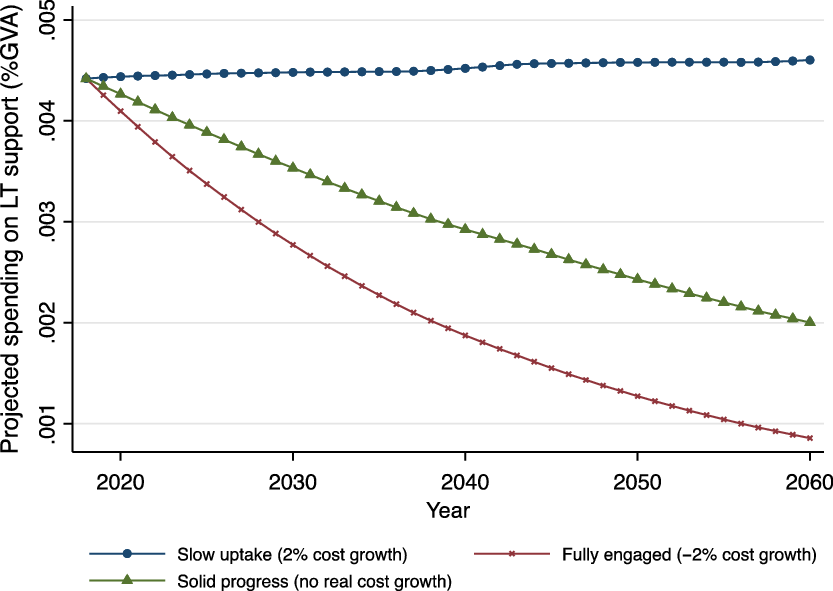
In 2018, the number of working-age people receiving LT support was 292,380 (Table 3), increasing to 299,092 in 2040 and 304,519 in 2060. In a ‘fully engaged’ scenario, spending on LT support will decrease from £6,871m (2018) to £4,506m in 2040 and to £3,063m in 2060. Under ‘solid progress’ and ‘slow uptake’ scenarios, it will increase to £7,156m and £16,439m respectively. The share of spending to GVA decreases from 0.442% in 2018 to 0.2% in 2060 with ‘solid progress’, and to 0.086% under a ‘fully engaged’ scenario (Figure 5). If the average cost increases by 2% annually (‘slow uptake’), this share will increase to 0.452% in 2040 and to 0.46% in 2060.
Projected gross spending on long-term support for working-age people (£m)
Projected gross spending on long-term support for working-age people (% GVA)
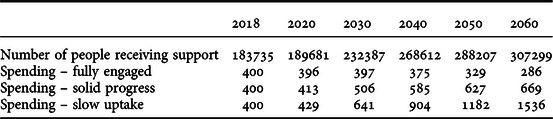
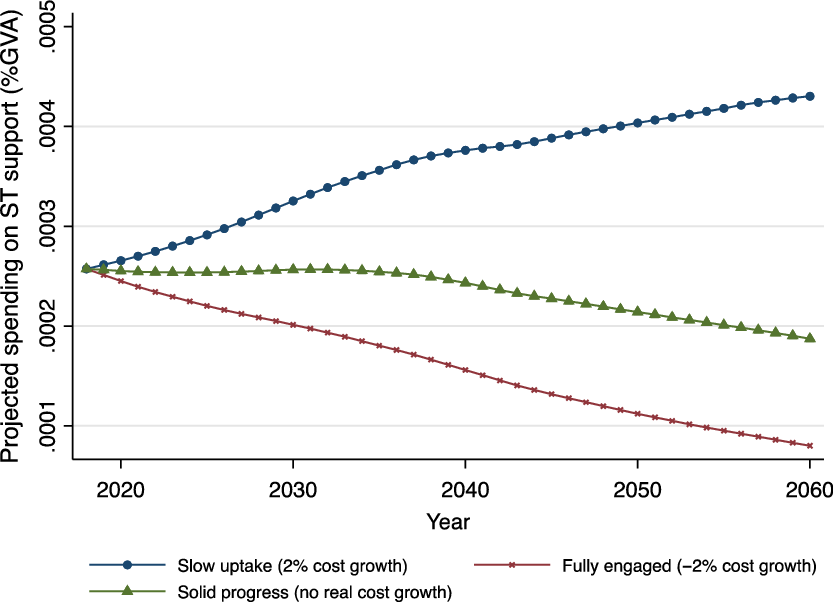
The number of people aged 65+ receiving ST care was 183,735 in 2018 (Table 4) and projected to increase to 268,612 in 2040 and to 307,299 in 2060. Under a ‘solid progress’ scenario, gross expenditure will rise from £400m in 2018 to £669m in 2060, and to £1,536m under a ‘slow-uptake’ scenario. Spending is projected to fall, to £286m in 2060 under a ‘fully engaged’ scenario, while the share of spending to GVA decreases to 0.008% (Figure 6). The share will also drop under a ‘solid progress’ scenario (to 0.019%), although gross spending increases. We project that the share will increase to 0.043% under the ‘slow uptake’ scenario.
Projected gross spending on short-term care for older people (£m)
Projected gross spending on short-term support for older people (% GVA)
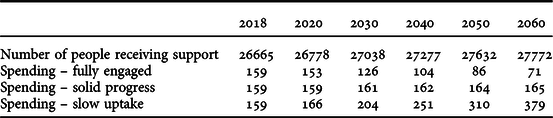
The number of working-age people receiving ST support was 26,665 in 2018 and will increase slightly, to 27,277, by 2040 and to 27,772 by 2060 (Table 5). Gross spending on ST support for this group was £159m in 2018. Spending is projected to remain constant and to increase slightly to £165m in 2060 under a ‘solid progress’ scenario. Under a ‘fully engaged’ scenario, however, spending will fall to £71m in 2060, while under a ‘slow uptake’ scenario it increases to £379m. Along with economic growth, the share of spending to GVA decreases dramatically under ‘solid progress’ and ‘fully engaged’ scenarios (Figure 7). The share will slightly increase (from 0.01% in 2018 to 0.011% in 2060) under a ‘slow uptake’ scenario.
Projected gross spending on short-term care for working-age people (£m)
Projected gross spending on short-term support for working-age people (% GVA)
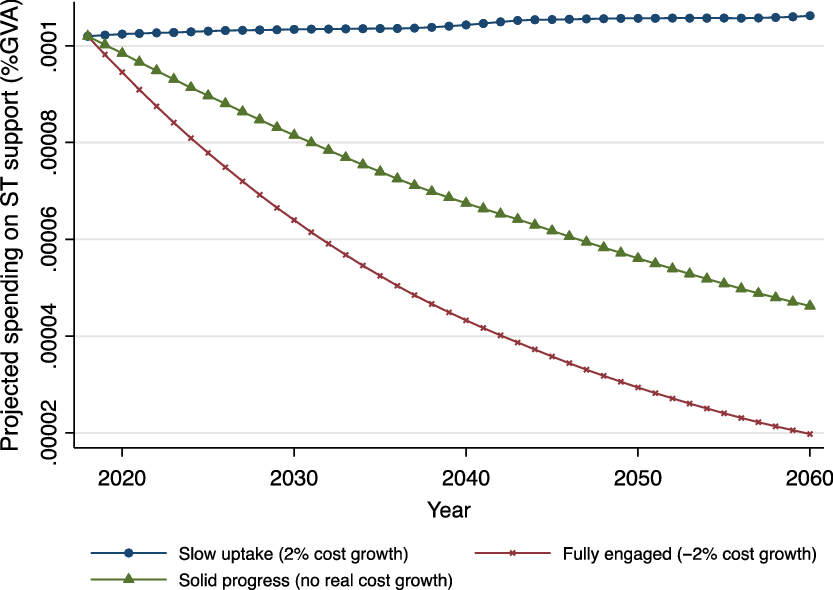
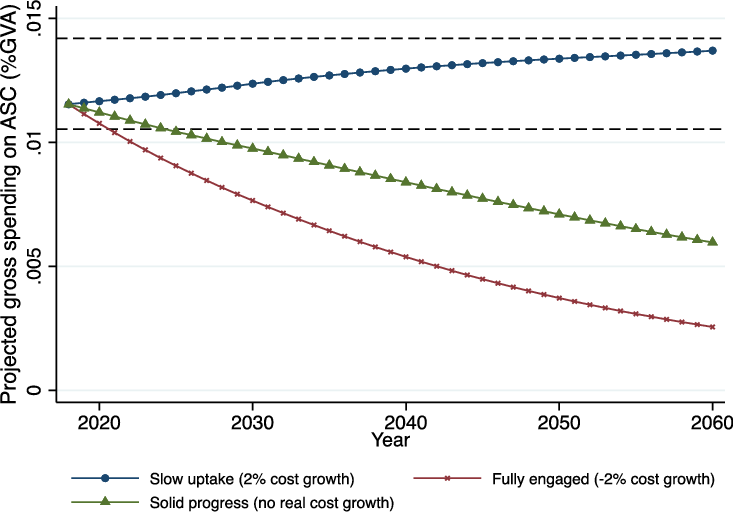
Figure 8 displays the projected share of gross public spending on all adult care services to GVA. Between 1997 and 2018, the share reached a 1.419% high in 2009 and a 1.053% low in 1997; we include these historical upper and lower bound values (using dashed reference lines in the figure) to reference our projections. The proportion of gross spending on adult social care to GVA was 1.153% in 2018 – above the lower reference. Under a ‘fully engaged’ scenario, the share will decrease, and go below the lower reference, by 2021, as it will (by 2025) under a ‘solid progress’ scenario. Even in the ‘slow uptake’ scenario (where gross expenditure on adult social care is expected to increase), the share of spending to GVA will still be below the upper reference level. This suggests governments will be able to meet increased demand for adult social care if the economy grows at 2% annually, but that the availability of future funding for it is inextricably linked to the future performance of the economy.
Projected gross spending on adult social care (% GVA)
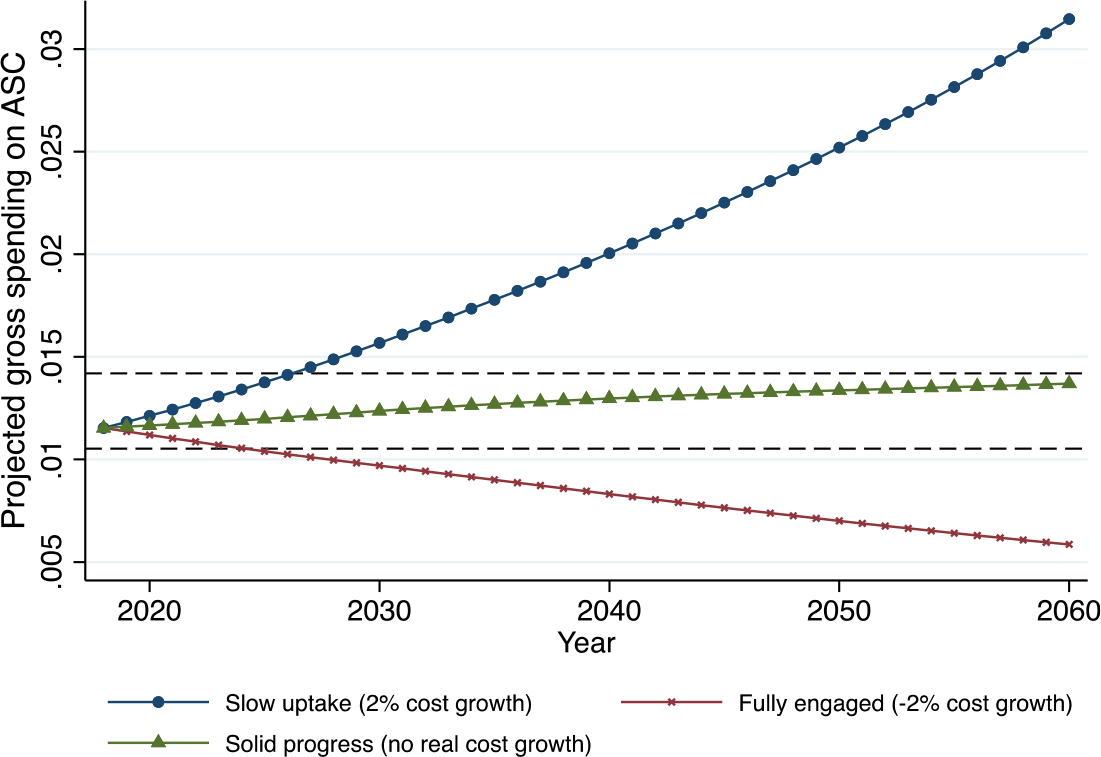
Figures 9-11 show the projected share of gross spending under different growth rate conditions. In Figures 9-11, the growth rate of GVA is assumed to increase by 1%, 0.5%, and 0%, respectively. If governments maintain the current ‘slow uptake’ scenario, the share of gross expenditure on adult social care to GVA will exceed the upper reference line by 2031 (given 1% economic growth), 2028 (given 0.5% economic growth) and by 2026 (if the economy stays at 2018 growth levels). If the share exceeds the upper boundary, it may be difficult for government to meet increased demand for social care. When investigating sustainable funding for adult social care, our projections emphasise the need to consider economic growth and early implementation of reforms. As the population ages, the government’s financial burden will increase, and available funds for implementing reform will decrease.
Projected gross spending on adult social care (% GVA) - GVA increases by 1% annually
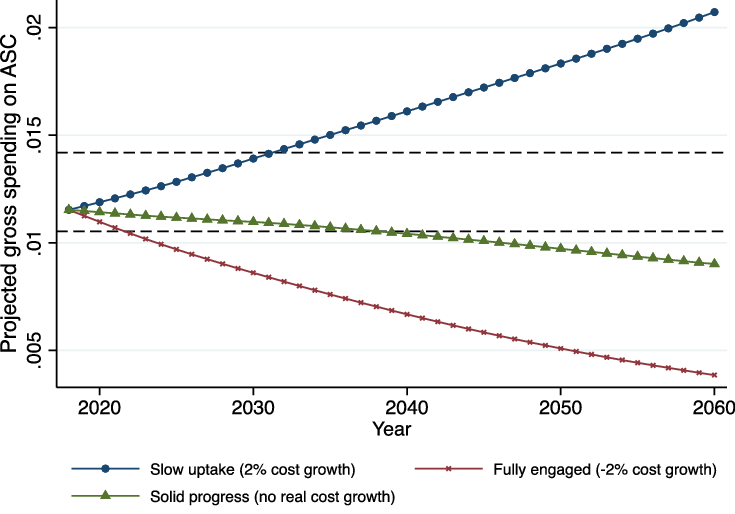
Projected gross spending on adult social care (% GVA) - GVA increases by 0.5% annually
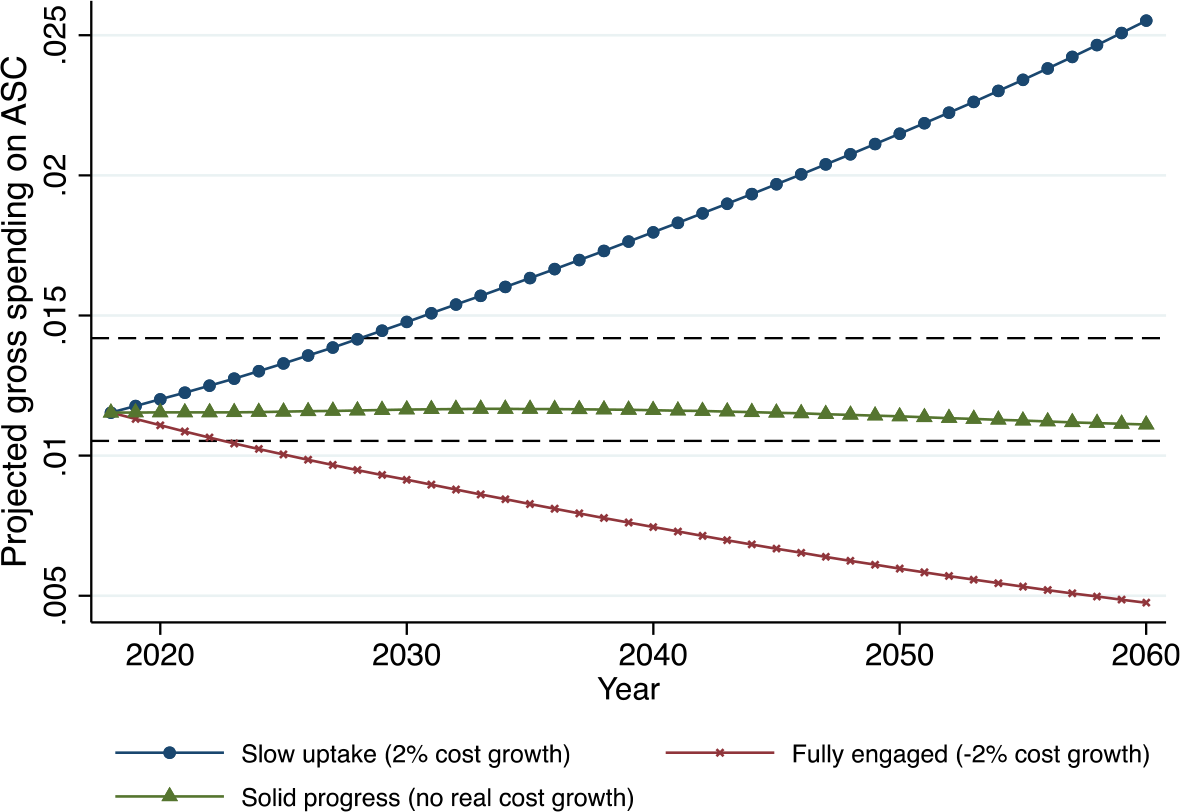
Projected gross spending on adult social care (% GVA) - No increase in GVA
Discussion and Conclusion
This paper portrays ‘a lost decade’ in which previous reforms and New Labour’s investment stalled and, in many cases, began to go backwards. Although our 2010 analysis concluded that ‘doing nothing’ was not an option, when New Labour lost the 2010 General Election, its proposed adult social care reforms were instantly jettisoned. Despite the Care Act 2014, policy in the subsequent decade has been even less ambitious than the ‘slow uptake’ scenario we presented to government as the least attractive/feasible approach (leading to no increase in quality and a doubling of adult social care costs within two decades). Predictably, the result has been greater unmet/under-met need, more self-funding, lower quality care, a crisis among care providers, and much greater pressure on staff, families and partner agencies. Unless something significant changes, current pressures will only increase, and the adult social care system will quickly become unsustainable (if this point has not already been reached).
The impact of these funding pressures is not being felt equally by older people and people of working age and their families. Although most of the media and policy debate on adult social care focuses on older people (the largest group of people using services), the discourse in broader society about the needs of older people has been extremely negative. In an era of austerity, there have been legitimate debates about the importance of intergenerational equity and the welfare of a younger generation facing significant economic challenges, increased levels of anxiety, rising higher education costs, less secure employment, rising house prices, less secure pensions and (latterly) reduced life expectancy (Kontopantelis, Reference Kontopantelis2018; Shaw, Reference Shaw2018; Yates, Reference Yates2019). Within adult social care, however, the cost of care for people of working age has risen largely as projected, while services for older people have been cut back severely. There have been vociferous campaigns about the poor quality of care provided to young people and adults with mental health problems and learning disabilities (Duffy, Reference Duffy2013; Mencap, 2016; TUC, 2018), yet the plight of older people has been much less discussed – despite being a national scandal which ought to generate just as much shock and anger. Underlying this situation, we identify three inter-related factors:
-
1. A significant number of young people with profound physical impairments, learning disabilities and/or mental health problems are entering adult social care services with very profound and expensive needs; their impairments mean they will need significant support for life. At present, there is little scope for reducing their need for services via greater prevention or more active rehabilitation, and costs are likely to increase as more people with such needs become adults and enjoy far greater life expectancy than in the past. This is a major achievement of the welfare state, and to be celebrated.
-
2. Expenditure cuts seem to be more acceptable when applied to older people than when they affect people of working age. Despite the legitimate needs of other groups, it is hard to interpret the trends in Figures 3a-3c and 4a-4c other than as (at least in part) the product of ageist attitudes and assumptions about the role and needs of older people. It seems services for older people can be cut in ways unimaginable – and which would certainly be more vehemently challenged – if they occurred in other service settings.
-
3. Many of the impacts summarised above involve people and their families suffering quietly in their own homes – the sheer human misery caused by our ‘lost decade’ is simply not as visible as financial pressures on more prominent, popular and better understood services (hospitals or schools, for example). When social care for older people is cut to the bone, lives are blighted, distress and pressure increase, and the resilience of individuals and their families is ground down. Yet this happens slowly – day by day, week by week and month by month. It is not sudden, dramatic or hi-tech in the way a crisis in an Accident and Emergency department may be, and tends to attract less media, political and popular attention.
As well as analysing past and current spending, we have made long-term projections of adult social care spending based on the ratio of gross spending as a proportion of GVA. If the economy grows by 0.5% annually, projections of gross spending on adult social care to GVA, under the ‘slow uptake’ model, will exceed the highest levels of spending over the past two decades by 2028; this will happen by 2026 if the economy stays at 2018 levels, and by 2031 with economic growth at 1%. These findings have two important implications. First, economic growth is crucial for sustaining adult social care, and future governments may be able to close the current funding gap if they pursue significant reforms and the economy grows significantly. Secondly, it is critical to implement adult social care reforms as soon as possible: governments will face greater financial stress the longer they wait to intervene in a system already at breaking point and in desperate need of reform. With yet more urgency than in 2010, we warn: ‘Doing nothing is NOT an option’.
Acknowledgements
The authors gratefully acknowledge the support of the Economic & Social Research Council (award ES/P009255/1, Sustainable Care: connecting people and systems, 2017-21, Principal Investigator Sue Yeandle, University of Sheffield)
Appendix: cost projections
2010 analysis
Sources of data: the cost projections discussed throughout the report are based on a number of simplifying assumptions, applied to data of various kinds. The data underlying the projections are drawn from:
-
ONS population projections – for numbers of people of different ages, and of different living arrangements (couple versus single). Such data is crown copyright (ONS, 2001)
-
Census 2001 – for proportions of older people living in residential settings
-
BHPS 2007-08 (wave 17) for receiving services among those living at their own residences (BHPS, 2009)
-
PSS expenditure data of different kinds, from the DH Information Centre
-
Estimates of the number of disabled people with learning disabilities (from Emerson and Hatton, Reference Emerson and Hatton2008)
-
Estimates of the work patterns of informal carers, from the Family Resources Surveys of 2003/04 and 2007/08 (the latest available) – DWP, 2009
-
Analysis of the work participation rates of disabled and non-disabled people, from the quarterly Labour Force Surveys of Jul-Sep 2004 and Jul-Sep 2009 (ONS, 2009)
-
Analysis of sickness absence rates from the same source
Methods: separate ad hoc approaches were used to estimate the potential cost savings from having more disabled people and carers back in the labour force. The main assumptions were of pay rates at the minimum wage (pessimistic) and full-time employment (optimistic).
The methodology used to analyse overall spending projections was that of cell-based simulation. This is a robust approach that has often been deployed to project future spending (see, for example, Wittenberg et al., Reference Wittenberg, Pickard, Malley, King, Comas-Herrera and Darton2008a, Reference Wittenberg, Malley, Comas-Herrera, Fernandez, King, Snell and Pickard2008b). It is based on attributing outcomes to pre-specified groups in the population – such as the chances of being in residential care for groups defined by age, gender and marital status. The numbers of people in each group change each year, drawing on data from population projections. The product of the size of the group, and the associated incidence of care needs, multiplied by a cost factor, generates the components of the cost projections.
An alternative approach – micro-simulation – may be used to look at results at the level of individuals, but imposes greater requirements in terms of data and of programming the models (Wittenberg et al., Reference Wittenberg, Pickard, Comas-Herrera, Davies and Darton1998). Developing new micro-simulation models was not possible given the short duration of this review. However it was possible to construct simple cell-based simulations to suggest how spending might develop in future if a host of assumptions about the incidence of care and its costs continue to be met. These were projections, not predictions.
Selecting the scenarios: in our 2010 report we outlined a number of strategies that might generate cost savings, and improved outcomes. These have been quite substantial in some instances, but more limited in other areas. There were also strong and important differences in the robustness of the evidence, and the confidence that may be placed in different estimates of areas of saving.
Even given these factors, it is not possible to simply ‘add up’ the kinds of savings proposed to reach an overall figure. Some of the savings were in different areas of spending and so it would be double-counting to include both sets (for example, greater personalisation of care budgets, and the role of commissioning). There was also limited data on whether the cost savings achievable may be regarded as a ‘one-off’ reduction or instead may be treated as dynamic factors that continue to reduce future costs by similar proportions. In many cases the future savings may require upfront investment, in new procedures or infrastructure, that need to be included in the round.
For these reasons the overall scenarios modelled (a 2% reduction in costs under a ‘fully engaged’ scenario, no change in costs under a ‘solid progress’ scenario, and a 2% increase in a ‘slow uptake’ scenario) were based on the kinds of figures found within each strategy and were not attempts to naively sum up the sets of individual financial assumptions.
What the projections demonstrated was the large momentum built into the future costs of social care by population change. The overall costs in real terms continued to increase quite sharply even if there was no change in the real unit costs of care provision. Even if costs could be cut by two per cent annually in real terms – a demanding challenge – the effect was barely to constrain real levels of spending to their current level.
A critical assumption made was that there are no ‘start-up’ costs to the reforms. In reality many of the proposed reforms might cost more in the short term, even if they saved money in the longer term. However there was very limited information available about the size of such costs, and they had not been a focus for research.
2019 analysis
Sources of data: the projections on the adult social care cost in this article are based on a series of assumptions. The data applied in the projections are obtained from:
-
ONS 2016-based population projections – for numbers of people across different ages
-
Adult Social Care Activity and Finance Report, England – 2017-18 – for the number of people who receive support by care type and age group and for spending on adult social care by long-term and short-term support and by age group
-
The regional gross value added (GVA), Office for National Statistics 2018
Methods: We assume the proportion of people at different age groups receiving long-term and short-term support is constant. Following the 2010 analysis, care cost is assumed to increase by 2% under the ‘slow uptake’ scenario, remain constant under the ‘solid progress’ scenario, and reduce by 2% under the ‘fully engaged’ scenario.
‘Slow uptake’:
 $$Projectedcos{t_{jit}} = {{ASCCo{sts_{ji2018}}} \over {Populatio{n_{j2018}}*RateCar{e_{ji2018}}}}*Populatio{n_{jt}}*RateCar{e_{ji2018}}*{\left( {1 + 2\% } \right)^{t - 2018}}$$
‘Solid progress’:
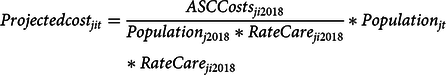 $$Projectedcos{t_{jit}} = {{ASCCost{s_{ji2018}}} \over {Populatio{n_{j2018}}*RateCar{e_{ji2018}}}}*Populatio{n_{jt}}*RateCar{e_{ji2018}}$$
‘Fully engaged’:
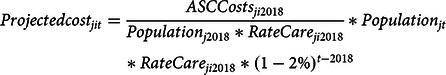 $$Projectedcos{t_{jit}} = {{ASCCost{s_{ji2018}}} \over {Populatio{n_{j2018}}*RateCar{e_{ji2018}}}}*Populatio{n_{jt}}*RateCar{e_{ji2018}}*{\left( {1 - 2\% } \right)^{t - 2018}}$$ $Projectedcos{t_{jit}}$
represents the projected costs of adult social care support for age group j (j=1 or 2, 1 for those aged 16-64 and 2 for those aged 65 and over) and support type i (i=1 or 2, 1 for LT support and 2 for ST support) in year t (t=2018, 2019,…, 2060).
$Projectedcos{t_{jit}}$
represents the projected costs of adult social care support for age group j (j=1 or 2, 1 for those aged 16-64 and 2 for those aged 65 and over) and support type i (i=1 or 2, 1 for LT support and 2 for ST support) in year t (t=2018, 2019,…, 2060). $ASCCost{s_{ji2018}}$
is the actual gross spending on adult social care for age group j and support type i in 2018.
$ASCCost{s_{ji2018}}$
is the actual gross spending on adult social care for age group j and support type i in 2018. $Populatio{n_{jt}}$
is the number of population for age group j in year t.
$Populatio{n_{jt}}$
is the number of population for age group j in year t. $RateCar{e_{ji2018}}$
is the ratio of people in age group j who receive adult social care support under type i in 2018. We assume that the economy grows at 2% based on data for the past 20 years. The projected GVA in a specific year t is:
$RateCar{e_{ji2018}}$
is the ratio of people in age group j who receive adult social care support under type i in 2018. We assume that the economy grows at 2% based on data for the past 20 years. The projected GVA in a specific year t is:
 $$GV{A_t} = GV{A_{2018}}*{\left( {1 + 2\% } \right)^{t - 2018}}$$
The proportion of gross spending on the adult social care is calculated as:
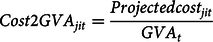 $$Cost2GV{A_{jit}} = {{Projectedcos{t_{jit}}} \over {GV{A_t}}}$$


 Open access