


Introduction
The study of civil society in authoritarian countries is among the most contested and politicized research topics. Because of the expectation and fear that a well-developed civil society can bring multiparty democracy to authoritarian regimes, this topic has been a core interest of domestic and overseas social scientists, policymakers, and politicians (Toepler et al., Reference Toepler, Zimmer, Fröhlich and Obuch2020). The states have never been passive actors. Social scientists in these countries must strategically comply with official political narratives (Perry, Reference Perry2020). How does an authoritarian state co-opt its social scientists and their research on civil society? We know little about the answer. As the power of authoritarian countries rises globally, our knowledge falls short in understanding the paradoxical presence of civil society studies in these regimes.
This paper examines two important channels of state co-optation: funding resources and scholarly networks. States can impact social scientists’ research agendas both by controlling funding priorities and influencing scholarly communities through elite scholars. Do these measures work as expected? To what extent do regimes institutionalize the co-opting process, and what are the essential elements of this process? These theoretical and practical questions are core to this study.
By analyzing a Chinese scholarly network involving 14,088 researchers from 2493 institutions and the 12,640 peer-reviewed Chinese articles published by these scholars between 1998 and 2018, I found that an individual’s position in a scholarly network matters. Scholars who are at the center of an academic network closely follow the government’s policy plans. These individuals can serve as excellent agents of the state by broadcasting policy agendas and narratives because they can reach all the other scholars in the network through the shortest paths. At the same time, scholars who connect different intellectual communities tend to have novel ideas that deviate from the state’s central planning. Surprisingly, funding is not an effective direct means of co-optation. A possible explanation is that the funded scholars may have already been co-opted by the state through the promotion and tenure process, which suggests that funding works through institutions but not directly on individual scholars. Combining these findings together, this study concludes that China may have already formed an authoritarian knowledge regime.
Scholarly Narratives: Civil Society Studies in Authoritarian Countries
The presence of nongovernmental organizations (NGOs) in authoritarian countries around the globe has attracted scholarly attention since the 1980s, and researchers have primarily theorized the state-civil society relationship from two perspectives: a neo-Tocquevillian perspective and a nuanced interdependence perspective (Lewis, Reference Lewis2013, 326). The neo-Tocquevillian scholarship frames civil society as a necessary social power for contesting the state’s hegemony. It dominated the literature from the 1980s through the 1990s and continues to frame academic discourse—especially in English-speaking scholarly communities. The interdependence perspective, which gained traction in the last two decades, recognizes the complexity of the interactions between nongovernmental entities and the state, aiming to provide a nuanced understanding of the transactions between different actors (Salmenkari, Reference Salmenkari2013). It also challenges the simple connection between civil society and democratization posited by the neo-Tocquevillian perspective. This pattern of scholarly narratives is consistent, even though the context varies across different authoritarian countries.
In the case of China, the first wave of scholarship examining the coexistence of nongovernmental and state actors started in the early 1990s, when scholars and policymakers primarily used a neo-Tocquevillian perspective to argue that the relationship between the state and civil society is in direct conflict (e.g., Chamberlain, Reference Chamberlain1993; Madsen, Reference Madsen1933). The second wave started in the mid-2000s when scholars and policymakers theorized the state-society relationship as contingent. Studies in this stream framed NGOs as the service arms of the state, leaving room for these nongovernmental actors to grow. However, their survival was seen as contingent upon them focusing on nonpolitically sensitive areas (e.g., “corporatism,” “graduated control,” and “consultative authoritarianism”; Kang & Han, Reference Kang and Han2022; Spires, Reference Spires2011; Teets, Reference Teets2013). The third wave evolved in the late 2010s when the relationship was theorized as being networked. Scholarship emphasized the active role of nongovernmental actors and the mutual embeddedness between NGOs and the state (e.g., Ma & DeDeo, Reference Ma and DeDeo2018; Teets, Reference Teets2018).
The civil society narratives summarized here and elsewhere are primarily syntheses of English scholarship and are potentially threatening to the hegemonic discourses that are core to sustaining authoritarianism. To respond to these threats, authoritarian states invest heavily to maintain their voice, and domestic scholars can hardly resist interventions that are systematic and institutionalized (Perry, Reference Perry2020). For example, both the Russian and Chinese governments sponsored their own science citation indexes for measuring research impact, and these metrics are essential to career promotion and receiving state grants (Xin-ning et al., Reference Xin-ning, Xin-ming and Xin-ning2001; Moskaleva et al., Reference Moskaleva, Pislyakov, Sterligov, Akoev and Shabanova2018).
In comparison with English scholarship, literature published in a country’s native language is closer to domestic policy and more susceptible to state’s interference. However, domestic scholarship and scholars have been given very limited attention in English-language communities (e.g., Zhang & Guo, Reference Zhang and Guo2021; Du, Reference Du2021). Accordingly, I focus on a collection of high-quality academic publications that are in Chinese in this study.
State Narratives: China’s Five-Year Plans
The Chinese government maintains a central planning system, a common practice for authoritarian countries, to prioritize and monitor its overall social and economic development goals. All central planning systems trace their conceptual and practical roots back to the Stalin plan of the Union of Soviet Socialist Republics in the late 1920s (Prybyla, Reference Prybyla1987, xiii). It was designed to provide a highly concentrated and comprehensive economic plan and offered strong advantages in mobilizing resources to develop key industries. After the completion of its second Five-Year Plan (FYP), the Soviet Union became the second-largest economy in the world (Chen et al., Reference Chen, Li and Fu2017, 195). The government of the Republic of China also started making policy plans in the late 1920s, and a central planning system was formally institutionalized after the country became a socialist state.
The People’s Republic of China made its first FYP in 1955 and primarily focused on establishing modern industries. As of 2020, China has released thirteen FYPs, and they have become the most influential policy documents outlining China’s socioeconomic development. Along with China’s reforms, the role of FYPs has been transformed from dictating economic activity to coordinating, implementing, and evaluating policy in a variety of social, political, and economic areas. This policy process is a continuous cycle that involves participation from all levels of government, intellectuals, and the general public, generating thousands of subplans and execution guidelines. The institutionalization of this policy process started during the 11th FYP (2006–2010), was fully employed in the 12th FYP (2011–2015), and has been continuously expanded during the 13th FYP (2016–2020) (Melton, Reference Melton and Kennedy2016, 42). China’s FYPs are effective at facilitating targeted social and economic development. For example, Wu et al. (Reference Wu, Zhu and Groenewold2019) found that industries prioritized by FYPs can see substantial growth. The FYPs can also influence corporate investment behavior (Xie et al., Reference Xie, Chen, Hao and Lu2019), financial industries (Chen et al., Reference Chen, Li and Fu2017), and social sectors (Zhao, Reference Zhao2016).
Since the late 1990s, the FYPs have included evolving guidance regarding the governance and framing of civil society. Because of political concerns, the terms “civil society” (gongminshehui 公民社会) and “nongovernmental organization” (feizhengfu zuzhi 非政府组织) are cautiously used in China’s official narratives. Instead, the party state employs a functional approach and uses language like “social management” (shehui guanli 社会管理), “social governance” (shehui zhili 社会治理), and “social organizations” (shehui zuzhi 社会组织). These terms originated at the central government level in 1998 and were discussed extensively during the sixteenth Chinese Communist Party Congress in 2004 (Pieke, Reference Pieke2012; Shi, Reference Shi2017), with one chapter of the 11th FYP (2006–2010) devoted to “Improving Social Management System.” Five years later, the 12th FYP (2011–2015) developed an entire section with five chapters directly related to civil society, and numerous regulations following the FYP were released at the central government level reinforcing the approach taken there, making 2011 a watershed year for civil society development in China (Simon, Reference Simon2013). The 13th FYP (2016–2020) also devoted one section with multiple chapters to the topic and underscored creating an innovative system to manage and govern civil society actors. In short, starting in 1998 there is ample evidence of an official narrative regarding civil society that has evolved as reflected in subsequent FYPs.
Contributing to Official Narratives: How are Social Scientists Co-opted?
Scholars have been important contributors to the FYPs and central planning system—an important apparatus for policy deliberation (Callahan, Reference Callahan2013, 8). Although academic freedom is constrained to some extent in all countries, social scientists in China have even fewer options because the state is highly motivated to influence social scientists (Noakes, Reference Noakes2014). How does the state co-opt its social scientists so that they will contribute to the official narratives of civil society as outlined in the FYPs? The literature on state co-optation in authoritarian regimes suggests two important approaches: resources and elite networks (Bertocchi & Spagat, Reference Bertocchi and Spagat2001; Gandhi & Przeworski, Reference Gandhi and Przeworski2021; Kreitmeyr, Reference Kreitmeyr2019).
Co-opting Through Resources
Research funding in China is political and one of the most direct means of state co-optation. As Smith (Reference Smith2010) put it, seeking research funding can shape the relationship between research and policy, and there is a “growing pressure to produce ‘policy relevant’ research” that is “diminishing the capacity of academia to provide a space in which innovative and transformative ideas can be developed, and is instead promoting the construction of institutionalized and vehicular (chameleon-like) ideas” (176).
The state has extensively invested in its top universities to raise their global rankings; meanwhile, it also engaged in an elaborate evaluation and grant-awarding system that impacts scholarly independence and research agendas (Perry, Reference Perry2020, 14–15). There are five primary sources of funding for social science researchers (Holbig, Reference Holbig2014, 17–19): (1) the National Social Science Fund of China (NSSFC), which is a flagship funding source for Chinese social sciences; (2) the Ministry of Education; (3) the Chinese Academy of Social Sciences; (4) the National Natural Science Foundation, which also funds social science research if relevant to natural sciences; and (5) local funding sources (e.g., research funds from provincial and municipal governments and universities). Funding sources 1–3 are tightly nested within the state’s propaganda system at the central government level and set the guidelines and priorities for funding social science research. The number and size of the grants received by a university from these sources are also tied to the university’s ranking. In general, the state’s use of research funding as a co-opting strategy leads to the first hypothesis:
Hypothesis 1
Scholars who receive government grants are more likely to align their research with the state’s official narratives.
Co-opting Through Elites
Another strand of literature on state co-optation in authoritarian countries focuses on social elites and shares an early theoretical viewpoint: the ultimate goal of authoritarian regimes is to integrate themselves with their host societies through “the admission of a wide range of social elites to consultative status in sociopolitical activities” (Jowitt, Reference Jowitt1975, 72). For example, Bank (Reference Bank2004) studied how the rulers of authoritarian regimes in the Middle East incorporate political elites through “economicisation.” Wong (Reference Wong2012) found that Beijing selectively chooses Hong Kong firms that are owned by prestigious elite families to co-opt because these firms yield the greatest demonstration effect. A recent advance along this research line combines co-optation theories with network analysis methods to study how social entrepreneurs, business and political elites, and international actors interact in Jordan and Morocco (Kreitmeyr-Koska, Reference Kreitmeyr-Koska2016; Kreitmeyr, Reference Kreitmeyr2019). The author found that the state actors and social and business elites are embedded in dense social entrepreneurship networks and that the elites’ positions in the networks are closely connected to the degree of co-optation.
Intellectuals are a privileged group in policymaking because of their expertise and ability to make authoritative claims (Campbell, Reference Campbell2002; Pielke & Roger, Reference Pielke and Roger2007). Individuals with special positions in scholarly networks are especially attractive to state co-optation. Scholars who are network centers can reach other intellectuals through shorter paths (i.e., they are “close” to other scholars). Moreover, these network centers are more capable of being “aware of whatever is going on in the network” and have higher status (Perry-Smith, Reference Perry-Smith2006, 88). Therefore, co-opting a scholar who is the center of a network can be an effective strategy to influence the entire academic community. This leads to the second hypothesis:
Hypothesis 2
Scholars who are at the center of a scholarly network are more likely to align their research with the state’s official narratives.
However, some scholars in networks may relatively autonomous and therefore can provide novel policy ideas. These individuals are often boundary spanners and intellectual brokers who have connections to different knowledge communities (Burt, Reference Burt2004). Because information is often homogeneous within close-knit groups but heterogeneous between groups, these brokers understand how to communicate using different ways of thinking and have more flexibility in adjusting their research agendas and narratives. Therefore, they have more options when faced with co-optation. Empirical studies of policy actors suggest that these knowledge brokers are especially important to policy innovation in both democratic and authoritarian systems (Smith, Reference Smith1993; Nay, Reference Nay2012; Sungurov, Reference Sungurov2012; Zhu, Reference Zhu2018). I therefore draw the third hypothesis as below:
Hypothesis 3
Scholars who are brokers between different intellectual communities are less likely to align their research with the state’s official narratives.
Knowledge Regime and Institutionalized State Co-optation
A knowledge regime is the “organizational and institutional machinery that generates data, research, policy recommendations, and other ideas that influence public debate and policymaking” (Campbell & Pedersen, Reference Campbell and Pedersen2014, 3). It focuses on the interaction between ideas and institutions in producing policy knowledge (Campbell & Pedersen, Reference Campbell, Pedersen, Beland and Cox2010, 167). The framework of knowledge regime was primarily developed to study advanced capitalist countries such as the USA, Britain, and Germany.
Unlike most western democracies, authoritarian China is neither a liberal nor a coordinated market economy; instead, it is a “socialist market economy” (Sigley, Reference Sigley2006, 498). Although it is debatable whether this term is academically rigorous (Huang, Reference Huang2012), it is prominent that government planning plays a central role in China’s social and economic development, which is also a representative feature of authoritarianism. Authoritarian states are motivated to institutionalize co-opting social scientists, raising the intriguing question: Does state planning lead to the creation of an authoritarian knowledge regime? We yet know too little.
Scholars have adapted the notion of knowledge regimes to study China and have singled out a significant feature of policymaking: the crucial role of linkage to the state (Nachiappan, Reference Nachiappan2013; Menegazzi, Reference Menegazzi and Menegazzi2018; Zhu, Reference Zhu2020). As Zhu (Reference Zhu2020) described it, the knowledge regime in China is a “politically embedded” one. However, not all interactions between the state and civil society researchers are equal—some scholars may be excellent agents for broadcasting state policy plans (i.e., Hypothesis 2), but others may have the freedom to pursue their own interests (i.e., Hypothesis 3). Existing literature has not defined what embeddedness actually means nor which linkages produce which outcomes.
These theoretical puzzles motivated and informed my analysis. Empirically, FYPs can serve as an excellent instrument to operationalize state planning in an authoritarian country, and the analysis of network position and funding resources can serve as different means of co-optation. By bringing them together, we can empirically construct the constituents of the knowledge regime in China and generate a framework for studying other authoritarian countries at large.
Method
Data on Civil Society Scholarship in Chinese
The datasets were created by searching for civil-society-related terms in journals indexed by the Chinese Social Sciences Citation Index (CSSCI). The CSSCI was developed by Nanjing University in the late 1990s and is a Chinese counterpart of the Social Sciences Citation Index. But unlike in the English academic community where the Social Sciences Citation Index and the Arts and Humanities Citation Index are separate, the CSSCI also includes humanities journals. As of 2019, it has indexed 568 high-quality peer-reviewed Chinese journals.
The datasets were built following three steps:
1. Identify all CSSCI-indexed journals.
2. Search within the bibliographic fields of title, keyword, and citation using keywords that specify the research area of civil society (refer to Online Appendix A.1 for the keywords used and justification).
3. Retrieve all bibliographic records between 1998 and 2018 (e.g., article title, abstract, author name, correspondence address, and reference list).
These steps generated three datasets: bibliography (e.g., article title, funding, and abstract), author (e.g., name and affiliation), and cited reference (e.g., reference title and publication year). I cleaned these datasets, disambiguated the records using multiple strategies, and generated a high-quality dataset (technical details in Online Appendix A.2). Overall, a group of 14,088 authors from 2493 institutions published 12,640 articles on civil society between 1998 and 2018, citing 127,746 references that include journal articles, books, research reports, and so on.
Measures
Measuring Co-optation: Similarity Between Scholarly and State Narratives
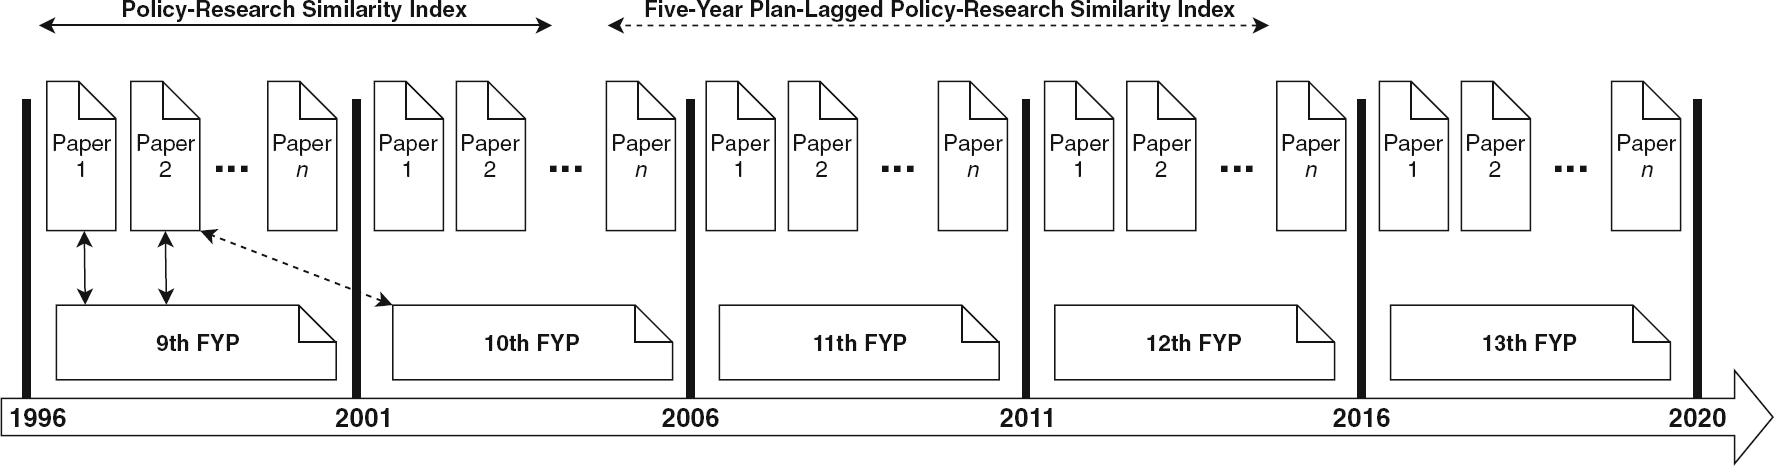
Building the Policy-Research Similarity Index. Notes: Used Word Mover’s Distance to calculate the similarities between texts (Kusner et al., Reference Kusner, Sun, Kolkin and Weinberger2015). Only showing the calculation of two articles’ Policy-Research Similarity Index and one article’s FYP-Lagged Policy-Research Similarity Index. FYPs are released at the beginning of each time period and valid for the entire period. FYP = Five-Year Plan

By using the Word Mover’s Distance (WMD) method in natural language understanding (Kusner et al., Reference Kusner, Sun, Kolkin and Weinberger2015), I built a time-series Policy-Research Similarity Index (PRSI; Fig. 1 and Eq. 1) to measure the extent to which a scholar’s research narrative is similar to the state’s policy plans. The WMD method employs word vectors to represent words and calculate the semantic distance between two documents (Mikolov et al., Reference Mikolov, Chen, Corrado and Dean2013). In other words, even when two texts have no terms in common, WMD can effectively measure their semantic similarity.Footnote 1
The WMD measure outperforms many canonical and state-of-the-art methods (Kusner et al., Reference Kusner, Sun, Kolkin and Weinberger2015, 6), and the application of word vectors has also been confirmed as a valid method in empirical social science studies (e.g., Kozlowski et al., Reference Kozlowski, Taddy and Evans2019; Rodriguez & Spirling, Reference Rodriguez and Spirling2021). I also checked this measure by comparing WMD to human coders. One doctoral student and one senior policy consultant, both of whom majored in Chinese public policy, were asked to practice on a random sample of twenty research articles published after the 13th FYP. They measured their attitudes toward the statement “this research applies the 13th Five-Year Plan’s discourse” using a Likert scale with 1 representing “strongly disagree” and 5 representing “strongly agree.” After deliberation, they rated another random sample of one hundred research articles independently. The intercoder reliability between the two human coders measured by kappa statistics was substantial (i.e., 0.61). The articles’ WMD values and average human ratings were statistically consistent (
 ).Footnote 2
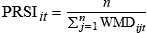
In Eq. 1, author i published n articles in year t, and
 represents the semantic similarity between author i’s article j published in year t and the current FYP for year t (i.e., the solid arrow lines in Fig. 1). Essentially, we are using the reciprocals for authors’ average WMD values in a given year.Footnote 3 The PRSI should indicate policy influence because research articles are published after FYPs. However, FYPs may also be influenced by published research articles (i.e., the dashed arrow lines in Fig. 1). Therefore, I calculated the PRSI-L by lagging research articles for five years so that they can be compared with a subsequent FYP.
Measuring Funding Resource
Research funding is measured by a binary variable that labels whether a scholar has funding in a given year.
 indicates that scholar i has at least one article published in year t with funding information disclosed. Because a project usually generates publications a few years later after being funded, “Description of funding” section in the result section and Online Appendix “E.1 Testing the lag between funding and publication” elaborate on this and test the lag effect.
Measuring Network Embeddedness
I constructed a weighted coauthor network for each year. In each network of a given year, the nodes represent scholars, and two nodes are connected if the scholars coauthor an article published in that given year. The ties are weighted using the frequency of coauthorship in the given year. The weights are crucial to considering the funneling effect because (1) collaborations are not equally important in terms of frequency, and a scholar tends to coauthor repeatedly with only a few others, and (2) as the units of analysis are individuals, it is necessary to consider attributes at that level (Newman, Reference Newman2001, 016132-2). Authors without any connections with other scholars are removed before analysis so that only embedded scholars are considered.Footnote 4
Closeness centrality is used to measure the extent to which a node is at the center of a network (Perry-Smith & Shalley, Reference Perry-Smith and Shalley2003, 96; Perry-Smith, Reference Perry-Smith2006). It is the reciprocal of the sum of the shortest paths from node i to all the other nodes. Therefore, an individual with higher closeness centrality has shorter path steps to all the other scholars.
Betweenness centrality is used to operationalize a scholar’s access to structural holes (Brandes, Reference Brandes2001). It measures how often a scholar lies on the shortest path between any other pair of scholars. Individuals with high betweenness centrality are better positioned to mediate information flow and connect people.Footnote 5
I used the Python package NetworkX (Hagberg et al., Reference Hagberg, Schult, Swart, Varoquaux, Vaught and Millman2008) to analyze the networks. The math equations to calculate these centrality values have been widely shared and thus are omitted here to save space.Footnote 6
Control Variables
Scholarly reviews and empirical studies have suggested that four categories of confounding factors can bias the estimation: network attributes, knowledge contribution, scholarly credibility, and political factors (e.g., Phelps et al., Reference Phelps, Heidl and Wadhwa2012; Gonzalez-Brambila et al., Reference Gonzalez-Brambila, Veloso and Krackhardt2013; Bozeman et al., Reference Bozeman, Youtie, Fukumoto and Parker2019). Online Appendix B has the details. While control variables cannot be exhaustive, together with the individual and time fixed effects and sensitivity tests, this study made its best effort to mitigate the problem of unobserved variables.
Estimation Strategy
The full model is Eq. 2, in which author i’s PRSI at year t is regressed on variables measuring (1) funding (Fund), (2) betweenness centrality (Betweenness), (3) closeness centrality (Closeness), (4) control variables (Control), and (5) the individual and time fixed effects (
 and
and
 ) and the error term (
 ).
).

I built the estimation models stepwise to primarily consider (1) possible confounding relationships among the explanatory variables (Models 1–5) and (2) the unobserved variables that are time or individual dependent (Models 6–8). The full model is Model 8. Online Appendix C details each of the models with a causal graph and expected results.
Models 1–5 I first estimated the coefficients of independent variables by pooling all observations without considering the panel structure of the dataset. Model 1 only considers the relationship between funding and policy-research similarity. Models 2–4 add network measures singly to consider potential confounding relationships and test more hypotheses. Model 5 considers all the explanatory variables.
Models 6–8 There may be unobserved variables that are consistent across entities but vary over time. For example, the funding opportunity increased dramatically over the years (Fig. 4), and the pressure to align research with official narratives also increased in the past two decades (Perry, Reference Perry2020). As a result, the positive association between funding and policy-research similarity can only be a function of time. Unobserved variables at the individual level are also a concern. For instance, funding opportunities are disproportionately distributed among Chinese universities, with elite universities receiving most of the resources. Therefore, scholars at top institutions have access to more resources but also face more pressure to align their research with policy plans and government goals (Perry, Reference Perry2020, 14). Models 6 and 7 consider the time and individual fixed effects, respectively. Model 8 is the full model as described in Eq. 2.
Results
I first describe the research activities and explanatory variables to give readers an intuitive impression, then present the results of the regression models introduced in “Estimation strategy” section. Online Appendix B details the control variables.
Description of Research Activities
Major Trends and Top Producers
Publication activities of civil society in China, 1998–2018

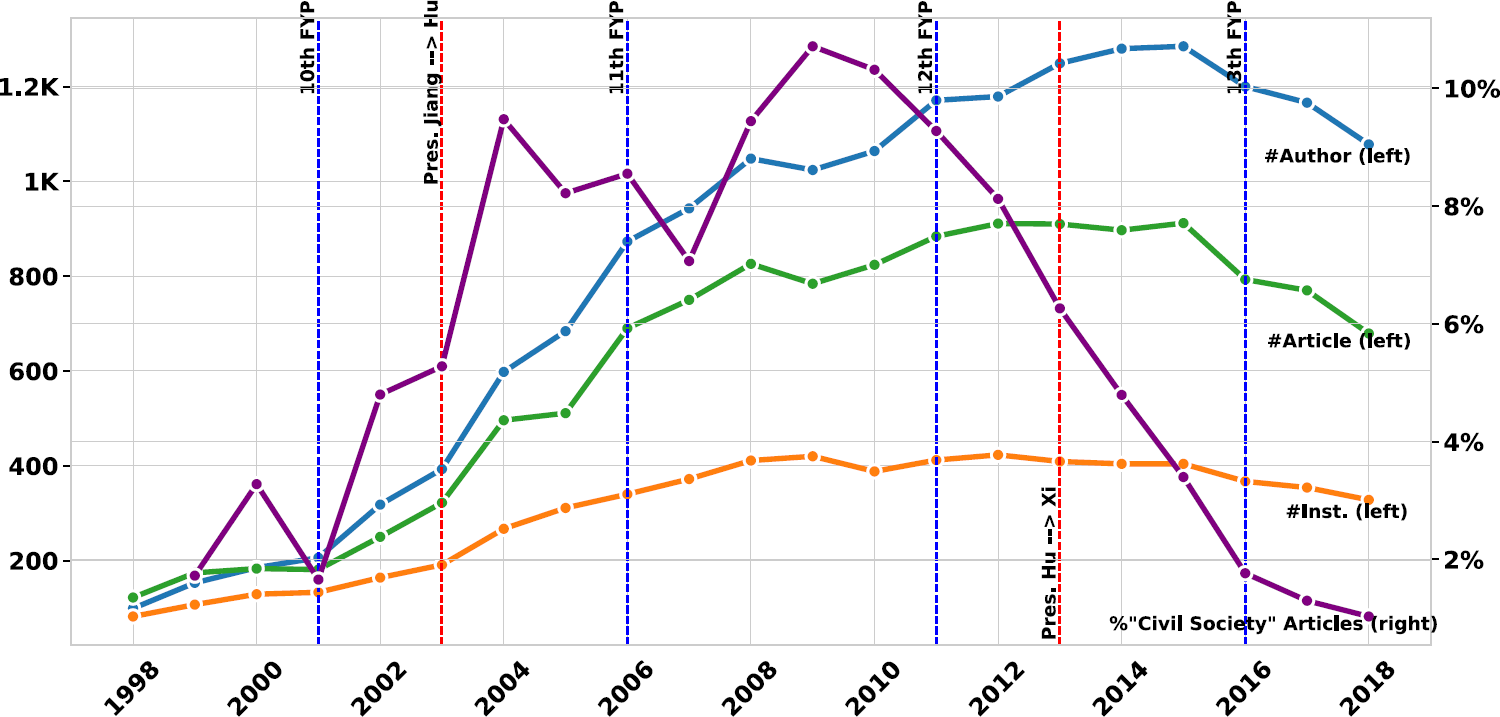
Figure 2 shows the publication activities of civil society in China by year. In 1998, a total of 122 articles on civil society were published by 99 authors from 82 institutions. Research in this field started to grow during the 10th and 11th FYPs (2001–2010), reaching its peak during the 12th FYP (2011–2015), with a total of 1285 authors from 404 institutions publishing 906 articles on civil society in 2015. This growth trend started to reverse during the 13th FYP (2016–2020). In 2018, a total of 679 papers were published by 1078 authors from 328 institutions—about the same amount as ten years prior. Overall, a group of 14,088 unique authors published 12,640 articles on nonprofit and civil society in core Chinese academic journals between 1998 and 2018.
Figure 2 also presents a subset of articles that use the exact term “civil society” (gongmin shehui 公民社会), which has been politically sensitive in China and only used by Chinese scholars sporadically. The percentage of articles using this term never went above 11% (peaking in 2009 at 10.7%), and the number dropped dramatically after the 12th FYP and during Xi Jinping’s presidency. In 2018, only 1% of all the articles published that year used this exact term.
Overall, the decreased research activities over time reflect the increasing level of control over China’s civil society since Xi came into power (Guo, Reference Guo2020; Nie & Jie, Reference Nie and Jie2021). Chinese scholars veered away from using “civil society” and embraced the official narratives introduced in the 12th FYP that were shared between policymakers and scholars (refer to Fig. 3 below).
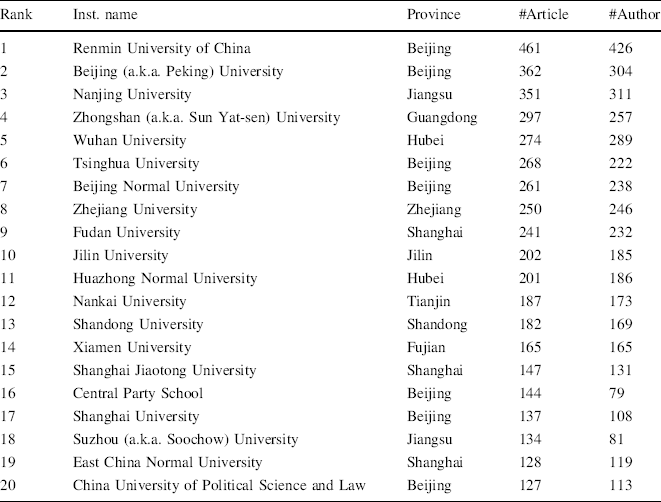
Major producers of knowledge on civil society are geographically diverse and widely spread across many universities in the country. Table 1 lists the top twenty institutions by the number of journal articles published. Although seven of the twenty are in Beijing, many of the rest are located throughout the country in other developed areas. An interactive geographic information system animation that maps 2493 institutions and their productivity from 1998 to 2018 is available online (https://jima.me/?cn_npo).
Top 20 Chinese institutions publishing on civil society, 1998–2018

Rank |
Inst. name |
Province |
#Article |
#Author |
|---|---|---|---|---|
1 |
Renmin University of China |
Beijing |
461 |
426 |
2 |
Beijing (a.k.a. Peking) University |
Beijing |
362 |
304 |
3 |
Nanjing University |
Jiangsu |
351 |
311 |
4 |
Zhongshan (a.k.a. Sun Yat-sen) University |
Guangdong |
297 |
257 |
5 |
Wuhan University |
Hubei |
274 |
289 |
6 |
Tsinghua University |
Beijing |
268 |
222 |
7 |
Beijing Normal University |
Beijing |
261 |
238 |
8 |
Zhejiang University |
Zhejiang |
250 |
246 |
9 |
Fudan University |
Shanghai |
241 |
232 |
10 |
Jilin University |
Jilin |
202 |
185 |
11 |
Huazhong Normal University |
Hubei |
201 |
186 |
12 |
Nankai University |
Tianjin |
187 |
173 |
13 |
Shandong University |
Shandong |
182 |
169 |
14 |
Xiamen University |
Fujian |
165 |
165 |
15 |
Shanghai Jiaotong University |
Shanghai |
147 |
131 |
16 |
Central Party School |
Beijing |
144 |
79 |
17 |
Shanghai University |
Beijing |
137 |
108 |
18 |
Suzhou (a.k.a. Soochow) University |
Jiangsu |
134 |
81 |
19 |
East China Normal University |
Shanghai |
128 |
119 |
20 |
China University of Political Science and Law |
Beijing |
127 |
113 |
Similarity Between Policy and Research
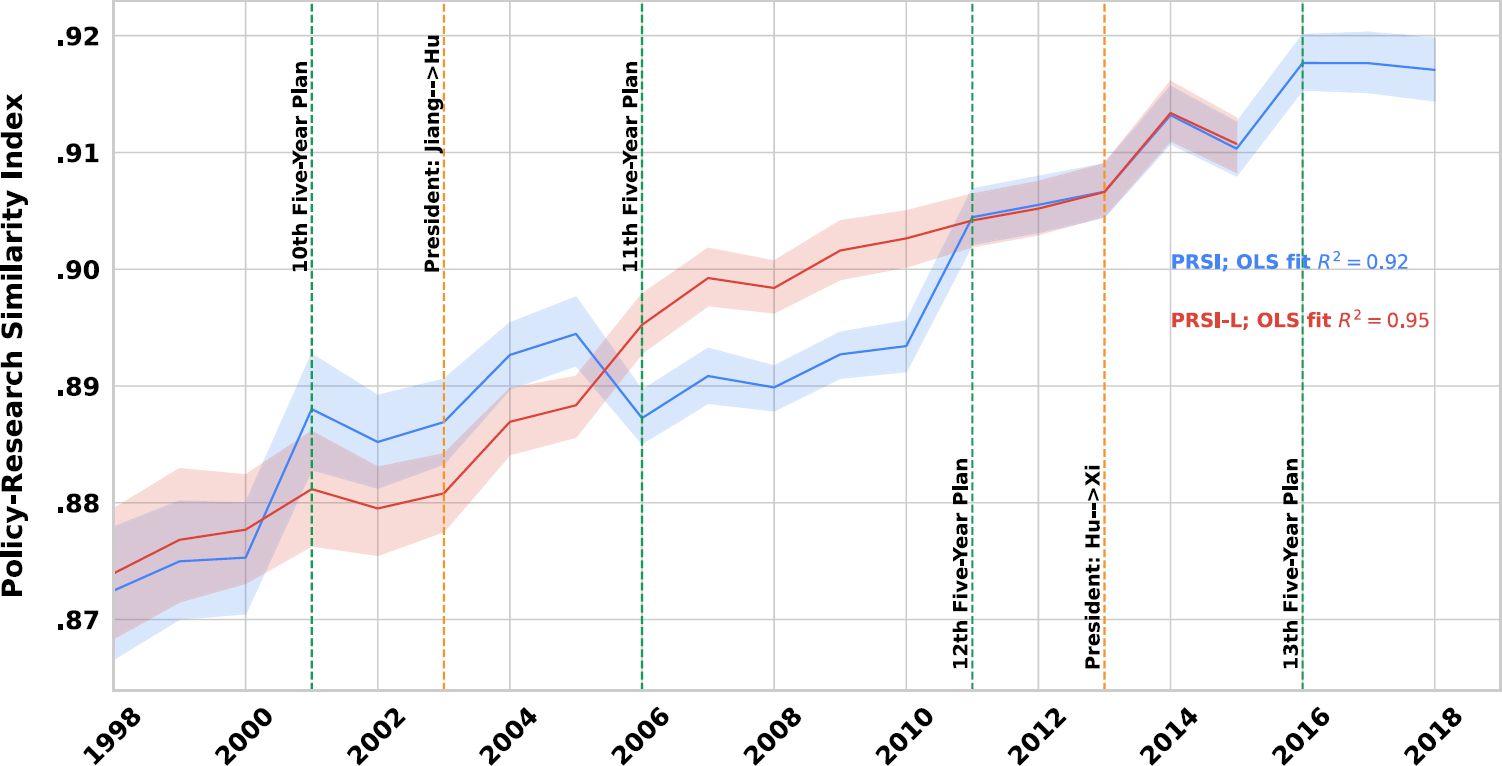
Figure 3 shows that the similarity between research and policy linearly increased in the past twenty years. (1) During the 10th FYP, the PRSI was larger than the PRSI-L, suggesting that research articles published between 2001 and 2005 were more similar to the current FYP than to the next FYP (i.e., the 11th FYP). (2) However, this trend was reversed during the 11th FYP—the PRSI-L was larger than the PRSI, indicating that articles published between 2006 and 2010 were more similar to the subsequent FYP (i.e., 12th FYP) than to the current plan. (3) During the 12th FYP (2011–2015), the two PRSI values started to converge, suggesting a shared narrative regarding civil society had coalesced among policymakers and scholars.
Based on these observations, we can infer a course of development for the narrative about civil society. (1) Between 2001 and 2005 (i.e., the 10th FYP), scholars followed a version of the narrative that was broadly consistent with the current FYP. However, the narrative changed in the subsequent 11th FYP. (2) Between 2006 and 2010 (i.e., the 11th FYP), scholars departed from the current policy narrative more than they did in the previous FYP and instead hewed closer to the narrative put forth in the subsequent policy plan (i.e., 12th FYP), suggesting their narrative was adopted by the subsequent FYP to some degree. (3) Between 2011 and 2015 (12th FYP), scholars adopted a policy narrative that continued in the 13th FYP. In general, the release of the 12th FYP in 2011 was a milestone for scholars and policymakers in developing a shared narrative of civil society in China. These empirical patterns echo two relevant facts discussed in the introduction section: (1) The 12th FYP (2011–2015) developed an entire section with five chapters directly related to civil society, and numerous regulations following the FYP were released at the central government level, making 2011 a remarkable year for civil society development in China (Simon, Reference Simon2013; 2) The institutionalization of this policy process started during the 11th FYP (2006–2010), was fully employed in the 12th FYP (2011–2015), and has been continuously expanded during the 13th FYP (2016–2020) (Melton, Reference Melton and Kennedy2016, 42).
Policy-Research Similarity Index, 1998–2018. Note: The Policy-Research Similarity Index is operationalized by Word Mover’s Distance (Kusner et al., Reference Kusner, Sun, Kolkin and Weinberger2015). Shaded areas show 95% confidence intervals

Description of Funding
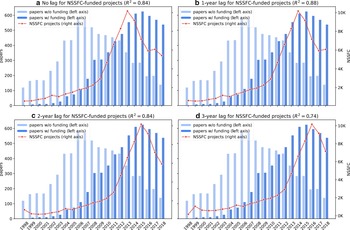
Figure 4 shows the number of papers by funding status and time and the number of NSSFC-funded projects by time. Funded papers increased from only 1 (0.82%) in 1998 to 539 (79.38%) in 2018. In the meantime, the number of NSSFC-funded projects saw a nearly tenfold increase (i.e., from 562 to 5421).
We should expect a substantial positive association between the number of NSSFC-funded projects and the number of funded papers because, in general, funded papers are a function of NSSFC funding.Footnote 7 Figure 4 shows the goodness of fit (i.e.,
 ) of the ordinary least squares models between NSSFC and funded papers. Since publication usually lags behind funding for a certain period of time, Fig. 4b–d present the number of NSSFC-funded projects by lagging one, two, and three years, respectively.
The
 values help us estimate the percentage of variance of funded papers that can be explained by the change in NSSFC-funded projects in corresponding scenarios. For example, the
 is 0.84 without lagging (Fig. 4a), indicating that 84% of the variance of funded papers is due to changes in the NSSFC-funded projects. According to the results, a project is most likely to generate publication within two years after being funded because the
 value of the 3-year lag sharply dropped to 0.74.Footnote 8 Other scholars suggest that the review process of Chinese journals usually takes less than a year (Jia et al., Reference Jia, Nie and Xiao2019, 795), which also supports my speculation (e.g., 1–2 years for research, plus another year for the turnaround with journals). The lag between publication and funding is important in informing the robustness tests detailed in Online Appendix E.1.
Funding status of civil society literature and the National Social Science Fund of China, 1998–2018. Note: NSSFC = National Social Science Fund of China. NSSFC data are from the official website (https://web.archive.org/web/20210429195128/http://fz.people.com.cn/skygb/sk/index.php/Index/seach), and are lagged by 1, 2, and 3 years in b, c, and d, respectively.
 values are obtained by fitting NSSFC to funded papers

Description of Networks
Coauthor Networks
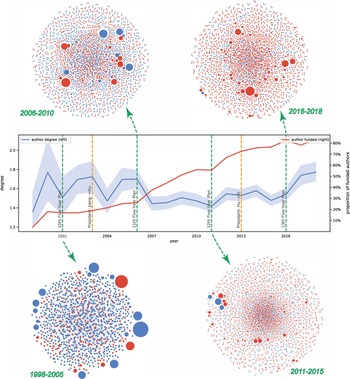
Figure 5 presents the connectedness of coauthor networks and funding status. According to the line graph, the average connection (i.e., degree) of authors did not substantially change over time, which is rare in scholarly networks—empirical studies have repeatedly found that the connectedness of scholarly networks increases over time (e.g., Goyal et al., Reference Goyal, van der Leij and Moraga-González2006; Rawlings et al., Reference Rawlings, McFarland, Dahlander and Wang2015). It suggests that there might be external interventions, possibly from the state, in the formation of the networks. The proportion of funded scholars significantly increased from less than 10% in the late 1990s to almost 80% in the late 2010s. The most rapid increase happened during the 11th and 12th FYPs. For the network graphs, red nodes are funded authors, while blue nodes are not; node size represents the betweenness centrality (i.e., intellectual brokers). The network visualizations clearly show that the funded scholars gradually took most of the positions of intellectual brokers (i.e., the large red nodes).
Author networks and funding status, 1998–2018 Note: The shaded area shows a 95% confidence interval. For the networks, red nodes are funded authors and blue nodes are not; node size represents the betweenness centrality (i.e., intellectual brokers). Isolated nodes (i.e., nodes without connections) have been removed for visual clarity (Color figure online)

Institutional Networks
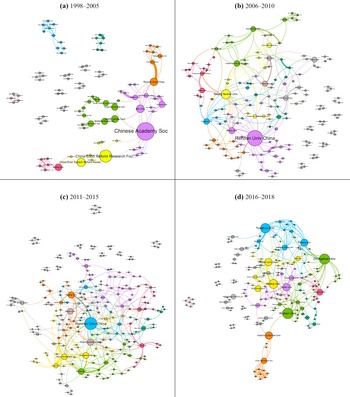
Figure 6 illustrates the evolution of institutional networks publishing on civil society from 1998 to 2018. In the graphs, node size represents betweenness centrality, color represents communities found by the Louvain algorithm (Blondel et al., Reference Blondel, Guillaume, Lambiotte and Lefebvre2008), and weighted links represent collaborations established by the coauthors. Larger nodes are more important in bridging the entire network because they pass novel and heterogeneous information (i.e., they are nodes with larger betweenness centrality values, and they are more accessible to structural holes). As the figure shows, the Chinese Academy of Social Sciences was a leading actor in connecting different institutional communities in the early phase of civil society studies (1998–2005; Fig. 6a). Then, Renmin University took over the bridging role for the next ten years (2006–2015; Fig. 6b, c), with many other institutions coming up along the way, for example, Beijing Normal University, Beijing University (a.k.a. Peking University), and Zhongshan University (a.k.a. Sun Yat-sen University). Between 2016 and 2018 (Fig. 6d), multiple universities started to take equally important roles in connecting the scholarly community (e.g., Beijing University, Fudan University, Tsinghua University, Wuhan University, and Zhongshan University).
Institutional networks publishing on civil society, 1998–2018 Note: Node size represents betweenness centrality, weighted links represent relationships established by coauthors, and color represents communities found by the Louvain algorithm (Blondel et al., Reference Blondel, Guillaume, Lambiotte and Lefebvre2008). For clarity in visualization, graphs are pruned using the k-core method with
 (Batagelj & Zaversnik, Reference Batagelj and Zaversnik2003). The time periods were chosen according to (1) data availability, the source database (i.e., CSSCI) was only available between 1998 and 2018 by the time of research; (2) the Five-Year Plans (i.e., 9th FYP, 1996–2000; 10th FYP, 2001–2005; 11th FYP, 2006–2010; 12th FYP, 2011–2015; and 13th FYP, 2016–2020) (Color figure online)

Predicting Co-optation: Scholars Using the State’s Narratives
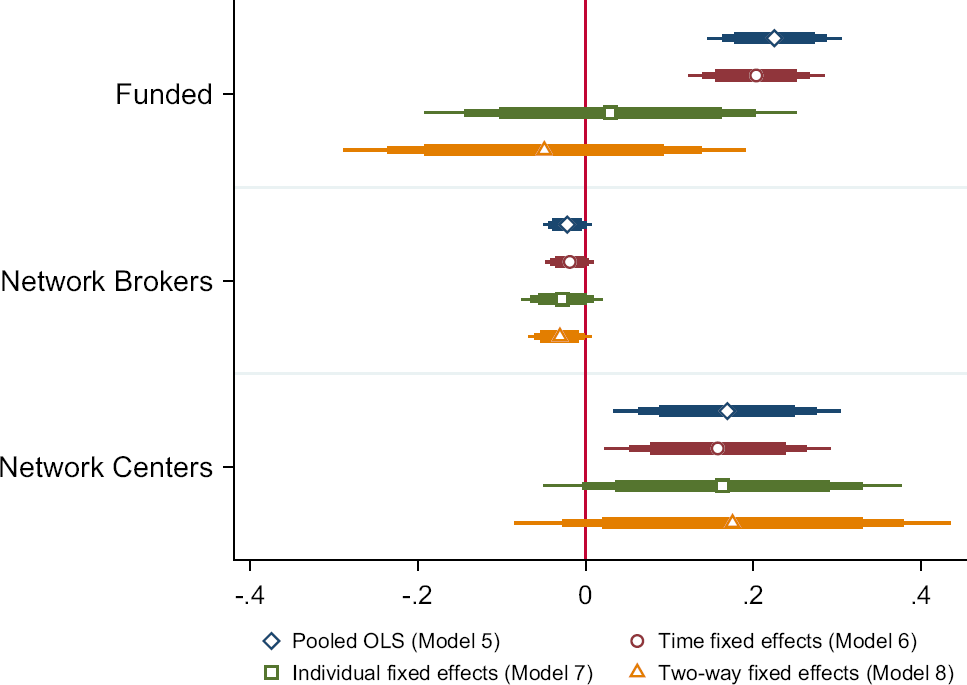
Figure 7 shows the primary results of Models 5–8 as introduced in “2.3 Estimation Strategy” (Online Appendix C and Table C1 have more details on estimation strategy and regression models). As the figure and appendix table present, funding is positively associated with the PRSI across all pooled ordinary least squares models. However, the association becomes insignificant once we run the regression at the entity level, suggesting there are individual-dependent influencers that confound the relationship between funding and the PRSI. The estimations of being knowledge brokers are substantially negative across all the models (Model 7 is significant at
 level), indicating that access to structural hole positions decreases the likelihood of using official narratives. The estimations of being knowledge centers are significantly positive across all the models, suggesting that individuals who are at the center of scholarly networks are more likely to employ policy plan narratives. In terms of magnitude of influence, knowledge centers have a much larger impact on PRSI than brokers (
 ).
).
Primary results of regression models predicting policy-research similarity Note: Detailed statistics of all models are in Online Appendix Table C1

The results of the control variables are in line with my expectations. In the full model (i.e., Model 8 in Table C1), density and degree are negatively associated with PRSI, but transitivity and reputation are positively associated. Although other control variables are not significant in the full model, the direction of association and significance of most of these variables are expected. The time and individual dependent variables appear to be powerful influencers.
In general, the hypotheses concerning network centers (H2) and knowledge brokers (H3) are well supported. The results of funding are mixed but not surprising. I will discuss these findings and their implications below.
Robustness Tests
I checked the robustness of regression analysis from statistical and theoretical perspectives. Refer to Online Appendix E for details.
Discussion
How does an authoritarian country co-opt its social scientists and their research on civil society? By studying the Chinese scholarly network and literature from 1998 to 2018, I researched the influence of funding resources and the embeddedness of intellectuals in coauthor networks. The findings are summarized in the article’s opening paragraphs. I now turn to a few lingering questions that are worth discussing further: (1) Why might research funding not be a direct measure of co-optation? (2) In an authoritarian country, where do novel research ideas about civil society originate from if the narratives are centrally planned by the state? And (3) what are the theoretical implications of these empirical results?
Co-opting Through Institutionalized Support
Sponsorship is the most direct measure for influencing academics. The Chinese government provides vast funding resources to scholars and also prioritizes its funding categories according to policy plans. However, my analysis indicates that funding has an insignificant effect on aligning research interests with policy plans after considering the individual fixed effect. In other words, a scholar’s preference for adopting state narratives does not vary by funding status. I have two potential explanations for this finding but also acknowledge that these reasons are speculative, and more empirical studies are needed to confirm these suppositions.
The first possible explanation is that the state’s sponsorship takes effect via institutions and does not directly influence individual scholars. As noted above, the state has made considerable investments in its top universities. As the “Request for Proposal of NSSFC” states, to be qualified as a primary applicant, a scholar must be affiliated with a renowned institution, be well established, and rank at the full-professor level or equivalent (misc National Social Science Fund of China, 2019). According to Table D1 and statistics from the London School of Economics (2011), those with an h-index larger than three can be considered as full professors. Therefore, roughly less than 2% of the scholars studying civil society in China are eligible to apply. It is highly likely that this small elite group may have already been successfully co-opted by the state through the promotion and tenure process because reputation is positively associated with policy-research similarity in the analysis (Model 8 in Table C1). Another empirical study also suggests that resource allocation in Chinese academia is influenced by political and administrative power (Jia et al., Reference Jia, Nie and Xiao2019). In general, the institutional characteristics and evaluation criteria have more pressure on social scientists.
A second but more speculative explanations is that scholars with certain personalities may be more likely to follow government directions than others. Although this study does not have direct evidence to support this possibility, there are many empirical studies confirming the connection between personal traits and political attitudes (e.g., Gerber et al., Reference Gerber, Huber, Doherty, Dowling and Ha2010; Mondak, Reference Mondak2010). Personal traits could also influence scholars in steering clear of studying topics like civil society that are politically sensitive.
Intellectual Brokers: Novel Ideas in a Planned Society
Where do novel research ideas originate from in an authoritarian country if the state is central to regulating policy and research narratives? I found that the brokers between different intellectual groups are the source of new ideas, even though the magnitude of their impact is marginal in comparison with other influencers. This finding also echoes studies of democratic societies (Burt, Reference Burt2004; Perry-Smith, Reference Perry-Smith2006) and other academic research fields (Leahey & Moody, Reference Leahey and Moody2014).
Scholars who are brokers between different research groups understand how to communicate using various ways of thinking. They also have more flexibility in adjusting their research agendas. As a result, these knowledge brokers appear less likely to be influenced by the state’s dominance. What is surprising is that these figures are consistently inclined to have research agendas that deviate from policy plans compared to those scholars who are not brokers. This finding is particularly important because it means that the source of novel ideas is structurally inherent even in a planned policy system—as long as scholars are free to collaborate and form scholarly networks, novel ideas will emerge from those knowledge brokers.
As Charles Merriam famously quipped, “To plan or not to plan is not [the] real issue” (Merriam, Reference Merriam1944, 397). The real issue is how plans are made—either through a decentralized approach or by a central planner (Hayek, Reference von Hayek1945, 520). The decentralized approach of democratic systems appears to maximize the participation of all actors, making the best use of knowledge in society. But in authoritarian states, policymaking is expected to be dictated by only a few individuals, thereby constraining the planning process because no one can command complete knowledge.
China has made considerable efforts to institutionalize its policy planning system and broad participation (Melton, Reference Melton and Kennedy2016). However, aside from participation and efficiency, diversity and novelty of ideas also matter. The use of knowledge in policymaking is inclined to be decentralized and polycentric in democracies (Polanyi, Reference Polanyi1951, 171; Hayek, Reference von Hayek2011, 230) helping generate a multipolar structure in which brokers are embedded (Heemskerk & Takes, Reference Heemskerk and Takes2016). Democratic societies therefore have structural advantages for policy innovation because intellectual brokers can be the source of novel ideas. But for an authoritarian state, policy participation is inclined to be structured in a “core-periphery” manner, limiting the formation of brokers between different knowledge clusters. Although authoritarian countries must maintain their hegemony, it is not in their best interest to eliminate policy innovations altogether. If they find novel policy ideas valuable, they should nurture the structural habitat for intellectual brokers because they are the source of new ideas.
Toward a Theory of Authoritarian Knowledge Regime
Forging the empirical findings together, we can identify four key components of the knowledge regime in authoritarian China: (1) the state’s official policy narratives, (2) institutionalized state sponsorship for co-opting intellectuals, (3) co-opted intellectuals centrally embedded in scholarly networks, and (4) intellectual brokers as sources of novel ideas.
State’s official policy narratives The state’s official discourse embedded in FYPs serves as a beacon to scholars and has a strong effect on scholarly narratives. As Fig. 3 illustrates, the similarity between research and policy discourse has increased over time, particularly, after “social management” was extensively discussed in the 12th FYP. Subsequently, scholarly discourse on civil society became stable across different FYPs, indicating that social scientists and policymakers are following a shared narrative regarding civil society. How has such convergence been achieved? The other constituents of an authoritarian knowledge regime provide answers.
Institutionalized state sponsorship of co-optation The state’s sponsorship of universities and the promotion and tenure process can systematically co-opt intellectuals. In comparison with the research funding awarded to individuals, the sponsorship through institutions is more embedded in the academic system and more effective at producing “establishment intellectuals” who are authoritative and actively align themselves with the state (Goldman & Gu, Reference Goldman and Edward2004, 6–7; Perry, Reference Perry2020).
Co-opted intellectuals centrally embedded An effective policy planning system should be able to broadcast the state’s will timely, which means its agents should have shorter paths to other researchers in a scholarly network (i.e., by being the center of a network). The interaction between central planning and the scholarly community in China is effective according to this perspective because the scholars who are network centers also actively align their research agendas with the FYPs.
Intellectual brokers as sources of novel ideas Despite the significant influence the state exercises in advancing its narrative, there are still structural gaps where knowledge brokers reside and foster innovative policy ideas. Authoritarian countries will find these novel ideas valuable, even though they must maintain their hegemony. Authoritarian regimes ought to foster these intellectual brokers and the structural habitats that allow for knowledge exchange and new ideas.
These four elements have coalesced and suggest that China has created an authoritarian knowledge regime in which social scientists and the state interact following institutionalized rules. These characteristics are certainly not exhaustive in describing such a knowledge regime, but this preliminary project can serve as a stimulus for future studies. Ever since Nathan (Reference Nathan2003) proposed the notion of authoritarian resilience, a wide range of scholars have examined the puzzle that why this communist state has not failed as expected. It is clear that the resilience of this authoritarian state goes beyond its political institutions, and it remains an open question whether and how such an authoritarian knowledge regime contributes to China’s resilience.
Acknowledgements
This paper was presented at the University of Hawai’i at Mānoa in December 2019, UT Austin LBJ School of Public Affairs Colloquium in April 2020, and UT Austin Center for East Asian Studies in October 2021. I thank ChiaKo Hung, David Yang, Jenifer Sunrise Winter, Kate Xiao Zhou, Morgen S. Johansen, Jacqueline L. Angel, Kirsten Cather, and Matthew Gonzalez for hosting the talks. I thank all talk and conference attendees, Chao Guo, Meiying Xu, Ronald Stuart Burt, Xiaobo Lü, and Yuhua Wang for their constructive comments. I thank the Texas Advanced Computing Center at UT Austin for cloud computing resources (Keahey et al., Reference Keahey, Anderson, Zhen, Riteau, Ruth, Stanzione and Cevik2020); Angela Vimuttinan and D. Olson Pook for editing and proofreading; and the editors of Voluntas for handling the manuscript and four anonymous reviewers for their constructive comments.
Funding
The project is partly funded by the 2019 Faculty Research Program of the IC2 Institute, the Academic Development Funds from the RGK Center, and the 2021-22 PRI Award from the LBJ School.
Declarations
Conflict of interest
The authors declare that they have no conflict of interest.
Ethical Approval
The author declares that this study complies with required ethical standards




 Open access

