


1. Introduction
The impact of conflict has often been described as development in reverse (Collier, Reference Collier2004), due to its profound and persistent effects on the economies by disrupting growth, trade, and stability. In sub-Saharan Africa, this reversal is particularly evident, with conflicts often leading to significant declines in GDP, destruction of infrastructure, displacement of populations, and erosion of human capital. The World Bank estimates that conflict costs sub-Saharan Africa an average of $18 billion per year in lost economic growth (Okwoche and Nikolaidou, Reference Okwoche and Nikolaidou2024). Furthermore, conflicts disrupt agricultural production, a key sector for many African economies, leading to food insecurity and increased poverty. The destruction of infrastructure, such as roads, power lines, and power plants, further hinders economic activity and impedes access to essential services like healthcare and education. The loss of human capital through death, injury, and forced migration has long-term consequences for economic development by disrupting livelihoods and straining resources in host communities. The ripple effects of these disruptions extend beyond immediate economic losses, impacting social cohesion, governance, and long-term development prospects.
While regional perspectives remain prominent in conflict literature, subnational analyses have become increasingly central, revealing crucial variations and dynamics within countries (Buhaug, Reference Buhaug2010; Buhaug et al., Reference Buhaug, Gleditsch, Holtermann, Østby and Tollefsen2011; Cederman et al., Reference Cederman, Gleditsch and Buhaug2013; Østby, Reference Østby2013; Fjelde and Østby, Reference Fjelde and Østby2014; Uexkull et al., Reference Uexkull, Croicu, Fjelde and Buhaug2016). Building on this foundation, our study employs advanced Bayesian spatial methods to further explore how specific development variables drive conflict at finer scales. A granular understanding of these variables is crucial for developing targeted strategies to mitigate conflict, promote stability, and foster sustainable economic development.
In this context, this paper analyzes the case of Nigeria to investigate how specific development and resource factors exert spatial influences on distinct typologies of armed conflict. The primary research question driving this study is: In what ways do economic and geospatial elements spatially influence various conflict types in Nigeria? Our aim is to discern and chart these spatial relationships through Bayesian techniques, which will aid in designing targeted development interventions. We propose that elements like closeness to resources and infrastructure tend to heighten the risk of conflict due to competition and ease of access, although the effect might differ depending on the conflict type, such as a positive correlation for rebel groups near oil reserves (resource-driven ambition) and a negative one for protestors in affluent urban regions (alleviation of grievances). Nigeria has a history of experiencing coups, government changes, and ethnic conflicts (Otiono, Reference Otiono2021). Ethnic tensions and power struggles have been prevalent (LeBas, Reference LeBas2020), accompanied by episodes of violence and repression (Turnbull, Reference Turnbull2021). Conflict in Nigeria includes rebel groups (such as Boko Haram in the northeast and militant groups in the Niger Delta), political factions (often vying for power and resources at the local and national levels), identity-based groups (frequently along ethnic or religious lines, leading to intercommunal violence), and instances of civil unrest (including protests, riots, and other forms of collective violence (Ojo et al., Reference Ojo, Oyewole and Aina2023)). In contrast to contexts where a limited range of conflict types is prevalent, Nigeria’s experience with significant levels of these diverse forms of violence permits a broader and more nuanced examination of the development-conflict nexus (Lekunze, Reference Lekunze2023). Utilizing geolocated conflict data from the Armed Conflict Location and Event Dataset (ACLED; Raleigh et al., Reference Raleigh, Kishi and Linke2023), we focus on the period between 1997 and 2023, which is characterized by significant economic transformations in Nigeria, including large-scale infrastructure projects (such as road construction, dam building, and urban development initiatives), significant demographic shifts (including rapid population growth and urbanization), and various forms of conflict. This timeframe encompasses critical junctures such as the 1999 transition to civilian rule, the mid-2000s oil boom driving resource-dependent growth, the 2009 onset of Boko Haram insurgency amid rising inequalities, and the 2016 economic recession with subsequent diversification efforts, allowing examination of how development patterns intersect with evolving conflict dynamics. ACLED’s comprehensive event-level data enable detailed spatial analysis, though we remain mindful of its media-based sourcing, which may introduce reporting biases (Eck, Reference Eck2012).
Nigeria is Africa’s largest oil producer and a major economic hub in sub-Saharan Africa, yet it faces persistent developmental challenges, including limited electricity access (around 55%) and inadequate infrastructure maintenance (The World Bank, 2014). This combination of resource wealth and structural vulnerability makes it a relevant case study for examining how development factors shape conflict risk.
In our spatial analysis, we study the impact of conflict incidence provoked by the distribution of economic and resource variables. These variables, encompassing infrastructure (roads, big urban population, and electric substations or lines) and natural resources (oil, diamonds, or arable lands), can be seen as influential factors in the likelihood of conflict in specific areas. For instance, proximity to resources like oil is expected to positively associate with rebel group activity (greed mechanism), while higher wealth may negatively correlate across types (reducing grievances). These factors might not influence the different types of conflict mentioned previously in the same manner. Therefore, our analysis considers not only the individual effects of these variables but also their potential interactions and spatial relationships in shaping the landscape of conflict. We hypothesize that the spatial clustering of specific combinations of these variables will be associated with distinct patterns of conflict, suggesting that geographically targeted interventions may be necessary to effectively mitigate conflict risk, guided by greed-grievance and resource curse frameworks to prioritize variables like resources (positive for greed-driven types) and inequality proxies (negative for grievance mitigation). Quantitative modelling of conflict risk has become a common practice in economic and conflict research (Kikuta, Reference Kikuta2020; Hegre et al., Reference Hegre, Nygård and Landsverk2021; Lindholm et al., Reference Lindholm, Hendriks, Wills and Schön2022). Our approach goes beyond traditional logistic regression models, employing more advanced analytical techniques.
To explore the connection between economic and resource variables and conflict in Nigeria, we use Bayesian analysis with integrated nested Laplace approximation (INLA; Rue et al., Reference Rue, Martino and Chopin2009) and stochastic partial differential equations (SPDEs; Lindgren et al., Reference Lindgren, Rue and Lindström2011). This methodology allows us to accurately measure the impact of each factor and its association with conflict. The findings, based on posterior marginal distributions, indicate substantive associations between most analyzed factors and conflict types, highlighting their relationships while accounting for spatial dependencies. Additionally, the generation of risk maps that estimate conflict rates, even in areas where conflicts are not reported, provides valuable economic insights, especially in guiding development decisions based on risk.
The effects of development factors on conflict are complex and nuanced, varying considerably across different conflict typologies. For example, while wealth consistently demonstrates a protective effect against various forms of conflict, the impact of other factors is contingent on the specific type of conflict.
This research offers several significant contributions to the economic development literature. First, from a methodological standpoint, this research develops a novel spatial econometric methodology employing raster data and Bayesian hierarchical modeling (INLA-SPDE) to analyze the complex spatial relationships between development factors and subnational conflict risk. This approach overcomes limitations of traditional panel data methods by explicitly accounting for spatial autocorrelation and heterogeneity, providing a more nuanced understanding of the spatial dynamics of development and conflict. Compared to Gaussian process regression (GPR) alternatives in conflict modeling (Croicu and Hegre, Reference Croicu and Hegre2018; Croicu & Maase, Reference Croicu and Maase2025; Maase, Reference Maase2025), INLA-SPDE’s sparse approximations enable scalable inference for large grids, enhancing applicability to high-resolution subnational analyses. Second, from an empirical perspective, applying this methodology to Nigeria, we identify significant spatial correlations between specific development factors (proximity to infrastructure, resource access, ethnic diversity) and distinct conflict typologies. These findings reveal nuanced spatial patterns of conflict risk not previously documented in the literature, offering new insights into the localized drivers of violence. Third, and finally, from a policy perspective, based on these empirical findings, we generate high-resolution conflict risk maps that provide actionable insights for policymakers, enabling geographically targeted interventions and more effective resource allocation for conflict mitigation and development initiatives.
In Section 2, we provide a comprehensive review of the existing literature, both theoretical frameworks and empirical studies explaining the relationship between development and conflict. Section 3 details our data sources and the Bayesian methodology followed. The findings of our empirical investigation, which include the estimated effects of the development factors and the conflict risk maps generated, are presented in Section 4 together with a set of model validation tests. Finally, Section 5 discusses the implications of our findings and offers related development policy recommendations.
2. Literature review
2.1. Theoretical literature review: spatial analysis in development studies
Early economic development theories largely overlooked the crucial role of space. A key limitation of modernization theory (Rostow, Reference Rostow1959), with its emphasis on linear stages of growth driven by internal factors, was its treatment of space as a non-constitutive element, assuming a uniform development process across all regions. Spatial inequality, the uneven distribution of resources and opportunities across space, is a central concern in development studies. Myrdal’s theory of cumulative causation (Myrdal, Reference Myrdal1957) explains how initial advantages in certain regions can lead to self-reinforcing cycles of growth, attracting investment and skilled labor, while other regions experience stagnation, exacerbating regional disparities. Hirschman’s concept of unbalanced growth (Hirschman, Reference Hirschman1958) suggests that strategic investments can stimulate broader growth, but also acknowledges that this can initially lead to regional imbalances. These imbalances can, in turn, contribute to social tensions and conflict. Similarly, dependency theory (Gunder Frank, Reference Gunder Frank1966), while highlighting global core-periphery dynamics, paid limited attention to spatial variations within countries. This lack of spatial awareness limited these theories’ ability to explain uneven development within nations. Spatial economics addresses these gaps by emphasizing agglomeration economies, transport costs, and increasing returns, as in New Economic Geography (NEG) models (Fujita et al., Reference Fujita, Krugman and Venables1999), which link uneven development to market access and scale economies, critiquing older theories for ignoring spatial frictions but facing limitations like assumptions of equilibrium and challenges in empirical testing on dynamic processes.
The theoretical advancements in spatial economics were accompanied by the development of spatial econometrics. Anselin (Reference Anselin1988) formally introduced key concepts like spatial autocorrelation, spatial lag models, and spatial error models. These tools provided the means to analyze spatially structured data and address the critical issue of spatial dependence, how observations in one location are influenced by those in neighboring locations. The incorporation of spatial dependence in conflict literature evolved from early aggregate models in the 1990s to disaggregated analyses by the mid-2000s, driven by recognition that ignoring geography led to biased estimates (Gleditsch and Ward, Reference Gleditsch and Ward2000). This path was shaped by advances in Geographic Information Systems (GIS) and computing, which enabled the development of subnational datasets such as PRIO-GRID (Tollefsen et al., Reference Tollefsen, Strand and Buhaug2012), as well as by theoretical shifts toward diffusion mechanisms. In real life, spatial autocorrelation arises from shared unobserved factors (terrain influencing multiple neighboring conflicts), lag models from direct spillovers (rebel movements across borders), and error models from correlated shocks (regional droughts triggering clustered violence). For example, in Bosnia, ethnic enclaves created spatial autocorrelation in violence outbreaks, modeled via lags to capture contagion effects (Weidmann and Ward, Reference Weidmann and Ward2008). This is highly relevant to development studies, where factors like infrastructure, market access, and environmental conditions exhibit strong spatial patterns, and where phenomena like conflict can have geographical spillover effects. The foundational work of Clifford and Sudbury (Reference Clifford and Sudbury1973) on spatial autocorrelation, introducing measures like Moran’s I and Geary’s C, further solidified the understanding and measurement of spatial dependence.
The mid-to-late 20th century saw a growing recognition of space’s importance in economic analysis, leading to the emergence of regional science and spatial economics. The NEG from Fujita et al. (Reference Fujita, Krugman and Venables1999) provided a more comprehensive framework. This framework emphasized the role of increasing returns, transport costs, and agglomeration economies in shaping spatial economic distributions, demonstrating how spatial concentration can lead to regional disparities. NEG highlights self-reinforcing clusters as drivers of growth, addressing gaps in older theories like modernization’s uniform assumptions, but is criticized for overemphasizing economic forces while neglecting institutions and facing limitations in handling non-stationary processes (Martin, Reference Martin1999). This work built upon earlier location theories but incorporated more rigorous mathematical and economic modeling.
However, the relationship between regional development and conflict has remained comparatively underexplored. Conflict can disrupt existing development patterns by destroying infrastructure, displacing populations, and hindering economic activity. Conversely, preexisting spatial inequalities, as described by Myrdal (Reference Myrdal1957) and Hirschman (Reference Hirschman1958), can contribute to conflict by creating grievances and fueling competition for resources. The spatial distribution of natural resources, as explored in the “resource curse” literature (Sachs and Warner, Reference Sachs and Warner1995; Ross, Reference Ross2004), can also become a source of conflict. Ungoverned spaces and porous borders can facilitate the movement of armed groups and illicit goods, further destabilizing regions. The spatial concentration of marginalized groups can also create conditions conducive to conflict, especially in the context of discrimination or exclusion. Collier’s (Reference Collier2004) work on “greed and grievance” provides a valuable framework for understanding the motivations behind conflict, which can be further enriched by considering the spatial dimensions of these motivations. These frameworks directly inform our research by guiding variable selection and expectations: the “greed” aspect (resource abundance fueling opportunistic rebellion) motivates inclusion of natural resource variables like petroleum and diamonds, expecting positive associations with rebel activity; “grievance” (inequality and exclusion) underpins socio-economic factors like wealth and ethnic fractionalization, anticipating negative wealth effects (mitigating grievances) and varying ethnic impacts by conflict type. The resource curse complements this, predicting that resource-rich areas may experience heightened violence due to weak institutions and rent-seeking, as evidenced in sub-Saharan contexts (Collier, Reference Collier2004; Ojo et al., Reference Ojo, Oyewole and Aina2023; Ajayi, Reference Ajayi2024; Animashaun and Emediegwu, Reference Animashaun and Emediegwu2025). Fearon and Laitin (Reference Fearon and Laitin2003) contribute by examining the interplay of ethnicity and insurgency, highlighting the importance of spatially relevant factors like state capacity and terrain, which critiques pure greed models and emphasizes feasibility, aligning with our spatial approach to unobserved heterogeneity, also aligned with recent research such as Narh (Reference Narh2024).
With regard to methodologies, several emerging trends are shaping the future of spatial analysis. GIS allows for the integration and analysis of diverse spatial data, providing valuable insights into spatial patterns and relationships. Remote sensing and earth observation technologies provide crucial data on environmental conditions, land use change, and other spatial phenomena. Advanced spatial econometrics and statistical methods, such as Bayesian spatial modeling using Gaussian Markov Random Fields (GMRFs) and SPDEs (Lindgren et al., Reference Lindgren, Rue and Lindström2011), implemented using INLA (Rue et al., Reference Rue, Martino and Chopin2009), are being increasingly used to analyze complex spatial relationships. GPR has also been applied in conflict research for imputing imprecise events (Croicu and Hegre, Reference Croicu and Hegre2018), forecasting dynamics with text embeddings (Croicu & Maase, Reference Croicu and Maase2025), and decomposing trends (Maase, Reference Maase2025), offering flexible non-parametric modeling but at higher computational costs for large datasets. This continuous development of tools and methodologies ensures that spatial analysis will continue to play a vital role in understanding and addressing the complex challenges of development.
2.2. Development factors related to conflict: an empirical review
The relationship between development and conflict is complex and context-dependent. Local conditions, encompassing natural resources (diamond mines, fertile arable land), infrastructure (transportation networks, energy), or socio-economic dynamics (wealth inequality, ethnic fractionalization), interact to shape development outcomes and influence conflict dynamics. For example, the developmental impact of a diamond mine may be significantly different in a region with well-developed transportation infrastructure compared to one with limited connectivity. Similarly, access to fertile land may have varying effects on conflict depending on the presence of supporting infrastructure such as irrigation systems and market access. This interaction between resource availability and infrastructure development suggests that the factors contributing to conflict, and their intensity, are contingent on a complex interplay of factors, including the specific type of conflict. Consequently, we investigate a range of factors empirically linked to both development and conflict (or the lack thereof) to identify the most pertinent variables for our model.
Regarding socio-economic factors, three variables are considered. We expect population density to positively associate with conflict risk across types, as higher density may intensify competition and grievances (Acemoglu et al., Reference Acemoglu, Fergusson and Johnson2019; Leasure et al., Reference Leasure, Jochem, Weber, Seaman and Tatem2020; Sardo et al., Reference Sardo, Epifani, D’Odorico, Galli and Rulli2023). Acemoglu et al. (Reference Acemoglu, Fergusson and Johnson2019) found that significant population increases in developing countries led to increases in internal conflicts, such as civil wars, rebel movements, and violent protests. Elevated population density, defined as the number of individuals per unit area, can exacerbate resource scarcity, intensify competition, and generate social tensions. In conflict-prone regions, Leasure et al. (Reference Leasure, Jochem, Weber, Seaman and Tatem2020) proved that densely populated areas are often associated with heightened levels of violence, displacement, and increased strain on existing infrastructure. Data were obtained from the WorldPop Research Group.
Disparities in wealth distribution are recognized as potential contributors to conflict. Chi et al. (Reference Chi, Fang, Chatterjee and Blumenstock2022) found that significant wealth differences between distinct groups can engender social unrest, resentment, and grievances (Nogales and Oldiges, Reference Nogales and Oldiges2024). An understanding of relative wealth distribution is thus crucial for assessing vulnerability and identifying potential conflict drivers.
Ethnic diversity is recognized as a factor influencing conflict dynamics (Bleaney and Dimico, Reference Bleaney and Dimico2016; Bertinelli et al., Reference Bertinelli, Cömertpay and Maystadt2025), with its impact on conflict risk and intensity varying depending on the specific context. Arbatli et al. (Reference Arbatli, Ashraf, Galor and Klemp2020) suggest that ethnic diversity exerts a causal influence on intrastate conflict outcomes. This implies that regions with high levels of ethnic fractionalization may require more nuanced due diligence, considering the potential for social fragmentation and its impact on development stability. For the present analysis, as Steele et al. (Reference Steele, Bostic, Lynch and Abdelaaty2022) propose, we distinguish between higher values of the ethnic fractionalization ratio, which indicate greater ethnic heterogeneity, often referred to as ethnic fragmentation, and lower values, which indicate greater ethnic homogeneity within a given area and thus a higher degree of similarity among ethnic groups. The relationship between ethnic fractionalization and conflict presents a nuanced picture with multiple factors relevant to development considerations.
The interplay between natural resources and conflict carries significant implications for development in resource-rich regions. Vesco et al. (Reference Vesco, Dasgupta, De Cian and Carraro2020)’s meta-analysis reveals that both resource scarcity and abundance can elevate the likelihood of conflict, depending on the specific resource. This finding underscores the need for careful assessment in developments related to natural resources, accounting for both potential resource competition and the “resource curse” phenomenon (Sachs and Warner, Reference Sachs and Warner1995; Ross, Reference Ross2004), which our variable selection engages by including petroleum and diamonds to test greed-driven expectations in rebel contexts. Furthermore, Vesco et al. (Reference Vesco, Dasgupta, De Cian and Carraro2020) emphasize the mediating role of climatic factors in the relationship between resource scarcity and conflict, particularly in agriculture.
Geographic and spatial factors offer crucial insights for geographically targeted development. Camargo et al. (Reference Camargo, Sampayo, Peña Galindo, Escobedo, Carriazo and Feged-Rivadeneira2020) analyze the complex interactions between forced migration, armed conflict, urbanization, and anthropogenic change in Colombia to assess the impact of displacement on land use. This highlights the need to consider urban areas and their associated social and economic disruptions when evaluating investments in conflict-affected areas. Linke et al. (Reference Linke, Witmer, Holland and O’Loughlin2016) investigate the influence of mountainous terrain on civil wars, demonstrating its impact on the operational costs for both insurgents and governments. This implies that development in regions with challenging terrain may face heightened security risks and logistical complexities. Bakshi and Dasgupta (Reference Bakshi and Dasgupta2019) examine identity conflict with transnational effects, emphasizing the importance of considering cross-border dynamics and their potential impact on regional stability and investment security.
Bakka et al. (Reference Bakka, Vanhatalo, Illian, Simpson and Rue2019) contribute methodological advancements with non-stationary Gaussian models incorporating physical barriers, offering valuable tools for spatial risk assessment in investment decisions.
Empirical research on conflict has increasingly adopted subnational, spatially disaggregated approaches, building on foundational tools like PRIO-GRID (Tollefsen et al., Reference Tollefsen, Strand and Buhaug2012) and contributions from various scholars (Buhaug, Reference Buhaug2010; Buhaug et al., Reference Buhaug, Gleditsch, Holtermann, Østby and Tollefsen2011; Cederman et al., Reference Cederman, Gleditsch and Buhaug2013; Østby, Reference Østby2013; Fjelde and Østby, Reference Fjelde and Østby2014; Uexkull et al., Reference Uexkull, Croicu, Fjelde and Buhaug2016; Croicu and Sundberg, Reference Croicu and Sundberg2017; Vesco et al., Reference Vesco, Dasgupta, De Cian and Carraro2020; Hegre et al., Reference Hegre, Nygård and Landsverk2021; Vestby et al., Reference Vestby, Brandsch, Larsen, Landsverk and Tollefsen2022). These studies have examined local drivers of violence, including geographic wealth dispersion, inequality, climate variability, and resource scarcity, using gridded data to reveal patterns obscured at national levels. This theme addresses the predictability of conflict and the methodologies employed in its study, providing critical information for proactive investment strategies. Over the past 15–20 years, the field has undergone a “predictive turn,” shifting from traditional in-sample significance testing to out-of-sample validation and forecasting accuracy, as critiqued in foundational works highlighting the perils of p-value-driven policy and advocating global models for instability forecasting (Goldstone et al., Reference Goldstone, Bates and Epstein2010; Ward et al., Reference Ward, Greenhill and Bakke2010; Schrodt, Reference Schrodt2013). Influential initiatives like VIEWS (Hegre et al., Reference Hegre, Allansson, Basedau, Colaresi, Croicu and Fjelde2019), ConflictForecasting.org, ACLED CAST, and PaCE exemplify this shift, employing advanced ensembles and machine learning for subnational predictions. Hegre et al. (Reference Hegre, Nygård and Landsverk2021) evaluate the predictive capacity of previous studies, finding varying levels of accuracy depending on the scale of conflict. This suggests that while broad conflict prediction can inform general investment strategies, greater precision is needed for localized risk assessment. Obukhov and Brovelli (Reference Obukhov and Brovelli2023) review the application of machine learning in predicting conflict susceptibility, identifying key conditioning factors and predictors. The increasing use of machine learning offers opportunities for investors to develop more sophisticated risk assessment models and inform investment decisions. Trinn and Wencker (Reference Trinn and Wencker2020) and Vesco et al. (Reference Vesco, Dasgupta, De Cian and Carraro2020) emphasize the importance of methodological choices and variable operationalization in conflict research. This underscores the need for development organizations to critically evaluate the data and methodologies used in conflict risk assessments and to consider the potential for bias or limitations. While our Bayesian spatial approach aligns with this predictive emphasis through risk mapping and validation (posterior predictive checks [PPCs]), it prioritizes interpretable associations over black-box forecasting, engaging the literature’s call for balanced methodological innovation without dismissing the predictive turn’s value.
3. Data and methodology
In this section, we present the data employed in the spatial analysis, including the selected development factors and conflict data, and outline the steps followed in the Bayesian methodological framework employed.
3.1. Data
3.1.1. Conflict data and descriptive analysis
The conflict data come from ACLED (Raleigh et al., Reference Raleigh, Kishi and Linke2023), covering Nigeria from 1997 to 2023. ACLED provides comprehensive subnational event-level data; known limitations regarding reporting biases and coding variability are mitigated by the Bayesian framework’s propagation of uncertainty through spatial random effects (see Supplementary Appendix A.3).
ACLED employs a six-category typology to classify conflict factions: Armed Forces, Rebel Groups, Political Militias, Identity Militias, Rioters, and Civilians. This categorization provides a valuable analytical framework for understanding the complex dynamics of conflict and differentiating between the roles of various participants. This study focuses specifically on the role of spoilers, defined as actors who actively seek to undermine or derail peace processes (Nilsson and Kovacs, Reference Nilsson and Kovacs2023).
In the context of the ACLED dataset, the spoiler groups are represented by Rebel Groups, Political Militias, Identity Militias, and Rioters. The following definitions summarize ACLED’s codebook (ACLED; Raleigh et al., Reference Raleigh, Linke, Hegre and Karlsen2010) descriptions of each spoiler group. (1) Rebel groups are organizations that aim to challenge established national regimes through violence, with a political agenda for national power, such as Boko Haram. (2) Political militias are violent militias with specific political goals, aligned with political elites, but not seeking to overthrow national power. (3) Identity militias are groups organized around shared characteristics like ethnicity or religion (includes tribal, communal, ethnic, local, clan, religious, and caste militias). Finally, (4) Rioters are defined as loosely assembled individuals or mobs engaging in spontaneous or premeditated violence during demonstrations, not classified as an organized armed group.
Events are filtered to include only fatality-reporting incidents; Armed Forces (state actors) and Civilians (victims rather than perpetrators) are excluded to focus on spoiler groups, consistent with established practice (Barnes, Reference Barnes2023; Schubiger, Reference Schubiger2023).
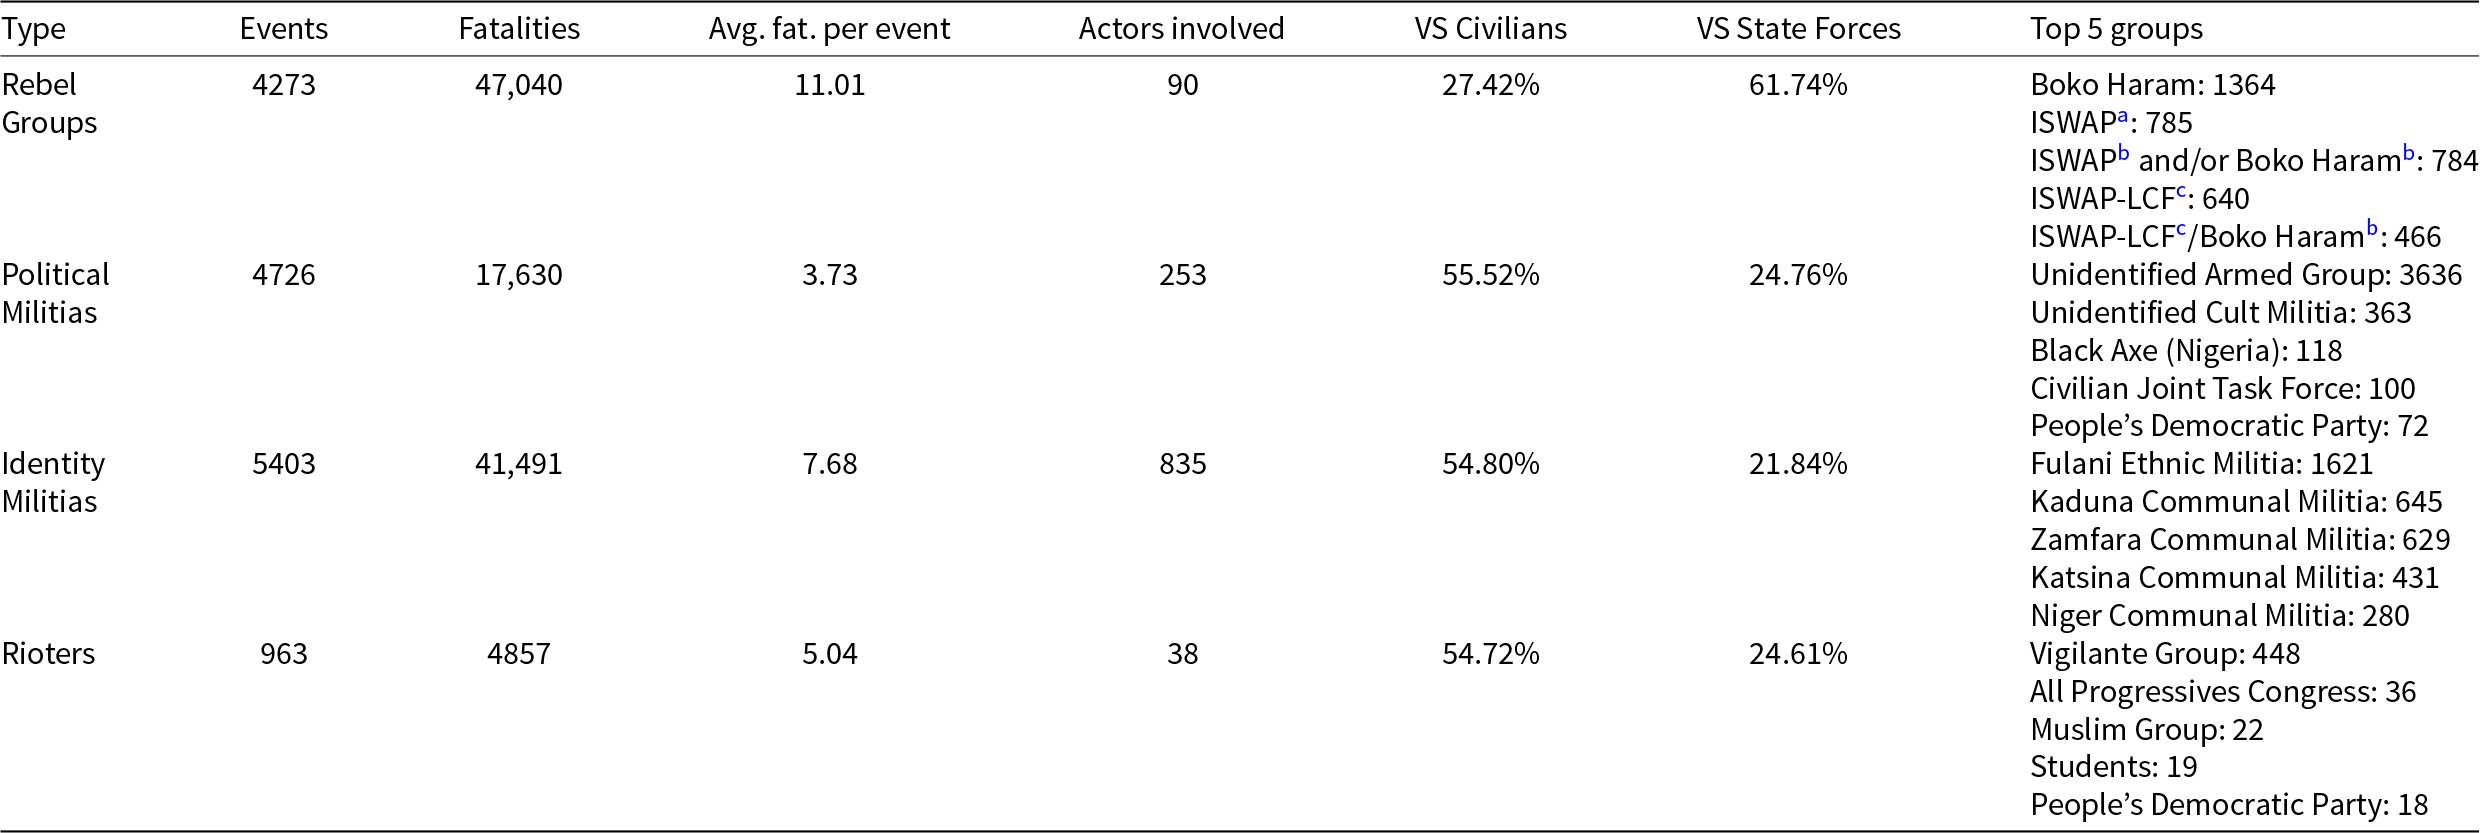
The ACLED program documented 15,509 events in Nigeria involving at least one conflicting group, resulting in a total of 108,081 fatalities from 1997 to 2023. These fatalities serve as  ${Y_i}$ in our models, aggregated spatially per typology and normalized by population ${N_i}$ for per capita risk estimation. An analysis was conducted to identify any changes in behavior in the series, but no significant breaks were identified.Footnote 1 This may be due to the complexity of conflict data, since it cannot be explained solely by the number of fatalities, and the lack of relationship between the data points makes it difficult to analyze them using traditional methods (Chadefaux, Reference Chadefaux2023). As a result, the entire data period was selected for the analysis, capturing post-democracy shifts in development (infrastructure expansion) and conflict escalation (insurgency onset), enabling assessment of long-term spatial patterns amid these junctures. This aggregation supports our purely spatial modeling, providing cumulative snapshots without temporal disaggregation, as event timestamps are not leveraged for dynamics like lags or trends. Table 1 shows that events involving Rebel Groups have the highest fatalities, fatalities per event, and confrontations with State Forces.
Descriptive statistics for ACLED spoiler groups

Table 1 Long description
The table summarizes event counts, fatalities, average fatalities per event, number of distinct actors, and the share of events targeting civilians or state forces across four ACLED actor types. Identity militias have the most events at 5,403 and high fatalities at 41,491, involving 835 actors; about 54.80 percent of their events are against civilians and 21.84 percent against state forces. Rebel groups have fewer events at 4,273 but the highest lethality, with 47,040 fatalities and about 11 fatalities per event; most of their events are against state forces at 61.74 percent, with 27.42 percent against civilians. Political militias have 4,726 events and 17,630 fatalities, lower lethality at about 3.73 per event, and the highest actor diversity at 253; they target civilians more often than state forces, 55.52 percent versus 24.76 percent. Rioters have the fewest events at 963 and 4,857 fatalities, with about 5.04 fatalities per event; their targeting pattern is similar to political militias, 54.72 percent versus civilians and 24.61 percent versus state forces. Top groups listed include Boko Haram and multiple Islamic State West Africa variants among rebel groups, Unidentified Armed Group dominating political militias with 3,636 events, Fulani Ethnic Militia leading identity militias with 1,621 events, and Vigilante Group leading rioters with 448 events. Percentages reflect shares within each actor type and the top five lists are not exhaustive, so smaller groups and other target categories are not shown.
a Islamic State (West Africa).
b Boko Haram—Jamaatu Ahli is-Sunnah lid-Dawati wal-Jihad.
c Islamic State (West Africa)—Lake Chad Faction.
A key finding is the prevalence of violence against civilians across most spoiler typologies. While Rebel Groups primarily engage State Forces (61.74% of their activities), the other three categories direct over 50% of their violence toward civilians: Political Militias (55.52%), Identity Militias (54.80%), and Rioters (54.72%). This highlights the significant civilian toll of these forms of conflict. Rebel groups account for the highest number of fatalities (47,040) and the highest average fatalities per event (11.01), likely due to their larger-scale confrontations with state forces.
The composition of these groups also varies considerably. Identity Militias involve the largest number of distinct entities (835), reflecting their often localized and fragmented nature, while Rioters involve the fewest (38), indicative of their more spontaneous or less organized character. The prevalence of unidentified armed groups (3636 events) within the Political Militias category suggests a significant challenge in attributing responsibility for these acts of violence. These findings are consistent with recent literature examining Fulani conflicts, such as George et al. (Reference George, Adelaja, Vaughan and Awokuse2022), and the recruitment of unidentified armed groups for political violence (Turnbull, Reference Turnbull2024).
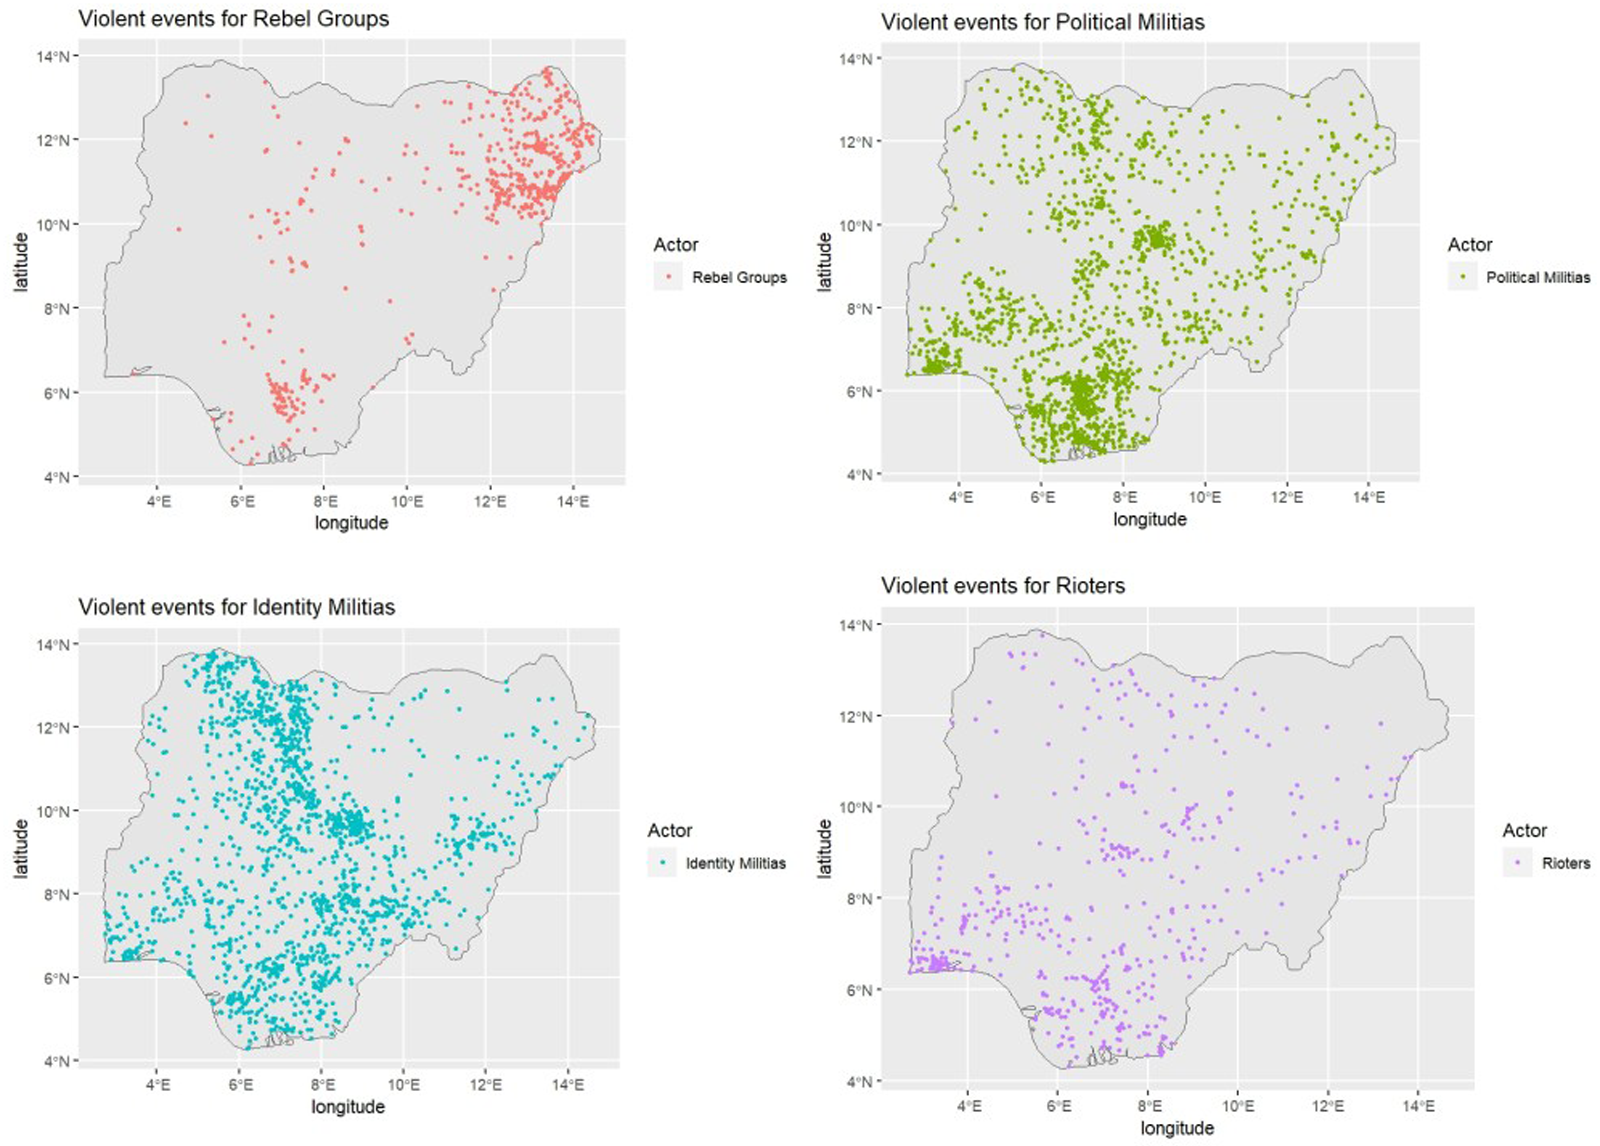
The spatial distribution of these conflict types, visualized in Figure 1, reveals distinct geographic patterns. Rebel Group activity is concentrated in the northeast, particularly Borno state, consistent with the known areas of Boko Haram and ISWAP operations, where up to 1.8 million civilians have been affected. Identity Militia activity is more prevalent in the western and central regions, often clustering around areas associated with specific ethnic groups, such as the Zamfara and Kaduna regions. Political Militias and Rioters exhibit a more dispersed pattern, reflecting their association with local grievances and political agendas. The relative absence of events in the northeast for these latter two categories may be attributed to the limited state control in that region.
Spatial distribution of spoiler group events.

Figure 1 Long description
The image A showing the title “Violent events for Rebel Groups”. A Nigeria map outline is shown with plotted point markers. The horizontal axis label is “longitude” with tick labels 4, 6, 8, 10, 12, 14. The vertical axis label is “latitude” with tick labels 4, 6, 8, 10, 12, 14. A legend at the right shows “Actor” and “Rebel Groups”. Point markers are densely clustered in the northeast area of the map, with additional scattered points across other areas. The image B showing the title “Violent events for Political Militias”. A Nigeria map outline is shown with plotted point markers. The horizontal axis label is “longitude” with tick labels 4, 6, 8, 10, 12, 14. The vertical axis label is “latitude” with tick labels 4, 6, 8, 10, 12, 14. A legend at the right shows “Actor” and “Political Militias”. Point markers are spread across much of the map, with many points in the central and southern areas and fewer points in the far northeast. The image C showing the title “Violent events for Identity Militias”. A Nigeria map outline is shown with plotted point markers. The horizontal axis label is “longitude” with tick labels 4, 6, 8, 10, 12, 14. The vertical axis label is “latitude” with tick labels 4, 6, 8, 10, 12, 14. A legend at the right shows “Actor” and “Identity Militias”. Point markers are numerous across the map, with dense concentrations in the western and central areas and additional clusters in the south. The image D showing the title “Violent events for Rioters”. A Nigeria map outline is shown with plotted point markers. The horizontal axis label is “longitude” with tick labels 4, 6, 8, 10, 12, 14. The vertical axis label is “latitude” with tick labels 4, 6, 8, 10, 12, 14. A legend at the right shows “Actor” and “Rioters”. Point markers are more dispersed than in the other maps, with many points in the southern half and central areas and fewer points in the far northeast. Across the four maps, each actor category is shown as a separate set of point markers on the same Nigeria outline with the same longitude and latitude axes, allowing comparison of where point clusters are concentrated for each category.
These distinct spatial patterns underscore the importance of considering geographic, economic, and social factors in understanding the emergence and dynamics of different conflict typologies. The selection of appropriate explanatory variables is, therefore, crucial for effectively addressing the root causes of conflict and promoting sustainable development.
3.1.2. Development factors
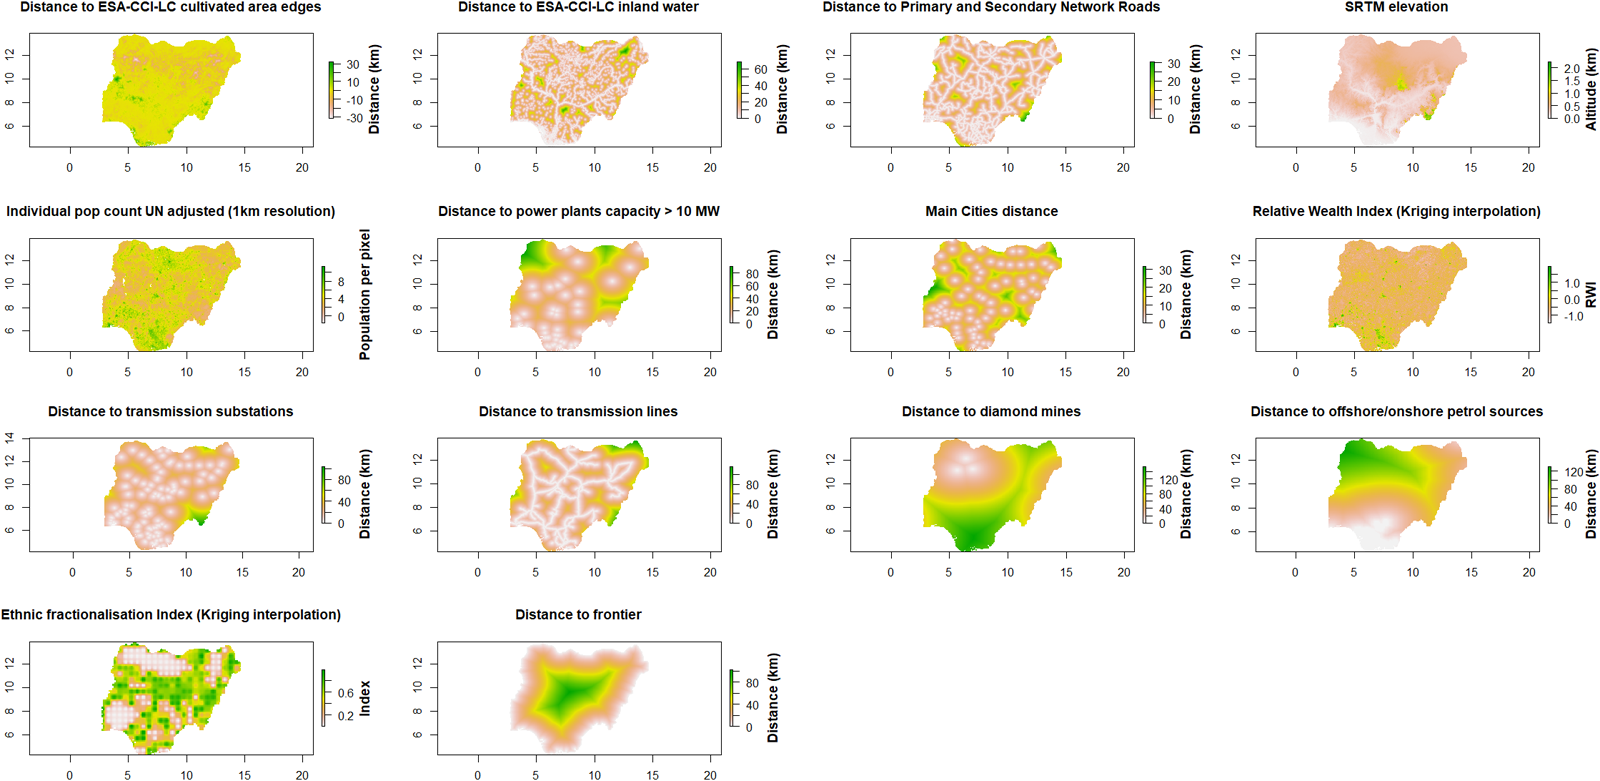
Fourteen covariates grouped into three domains capture the multidimensional drivers of conflict (see Supplementary Appendix A.2 for detailed descriptions). Socio-economic factors—population density, relative wealth, and ethnic fractionalization—serve as grievance proxies, expected to reduce conflict risk where living standards are higher. Geospatial/infrastructure factors (altitude, distances to cities, roads, frontiers, power plants, substations, and transmission lines) shape armed group operations by enabling movements or creating strategic vulnerabilities; resource factors (distances to diamond mines, petroleum, cultivated areas, and inland water bodies) are expected to drive greed-based violence for rebels and communal competition for militias (Fearon and Laitin, Reference Fearon and Laitin2003; Raleigh, Reference Raleigh2010). Covariate rasters are shown in Figure 2.
Raster data for all the selected factors (covariates).

Figure 2 Long description
The composite figure contains fourteen thematic raster maps arranged in a grid layout. Each map covers the same geographic region and shares coordinate axes with latitude on the vertical axis and longitude on the horizontal axis. Each map represents a distinct covariate factor. The maps are described in sequence as follows. Map 1 is titled Distance to Sentinel-2 cultivated area edges. The legend shows distance values along a continuous scale. Map 2 is titled Distance to Sentinel-2 inland water. The legend shows distance values along a continuous scale. Map 3 is titled Distance to Primary and Secondary Network Roads. The legend shows distance values. Map 4 is titled Shuttle Radar Topography Mission elevation. The legend shows elevation values. Map 5 is titled Individual population count fin adjusted 1 kilometer resolution. The legend shows population density values. Map 6 is titled Distance to power plants greater than or equal to 10 megawatt. The legend shows distance values. Map 7 is titled Main Cities Distance. The legend shows distance values. Map 8 is titled Relative Wealth Index all rights plus predictions. The legend shows index values ranging from lower to higher wealth levels. Map 9 is titled Distance to transmission substations. The legend shows distance values. Map 10 is titled Distance to transmission lines. The legend shows distance values. Map 11 is titled Distance to diamond mines. The legend shows distance values. Map 12 is titled Distance to Ultrapetroleum petroleum sources. The legend shows distance values. Map 13 is titled Ethnic fractionalization index all rights plus interpolation. The legend shows index values. Map 14 is titled Distance to frontier. The legend shows distance values. Each map uses a continuous gradient scale on its legend. Spatial variation is visible across all maps, with certain areas showing higher or lower values depending on the proximity or density of the respective feature. All fourteen maps share the same regional boundary outline.
3.2. Methodology
This analysis employs a Bayesian framework with latent Gaussian models to account for spatial autocorrelation and unobserved heterogeneity in conflict data; technical justification for this choice is provided in Supplementary Appendix B.
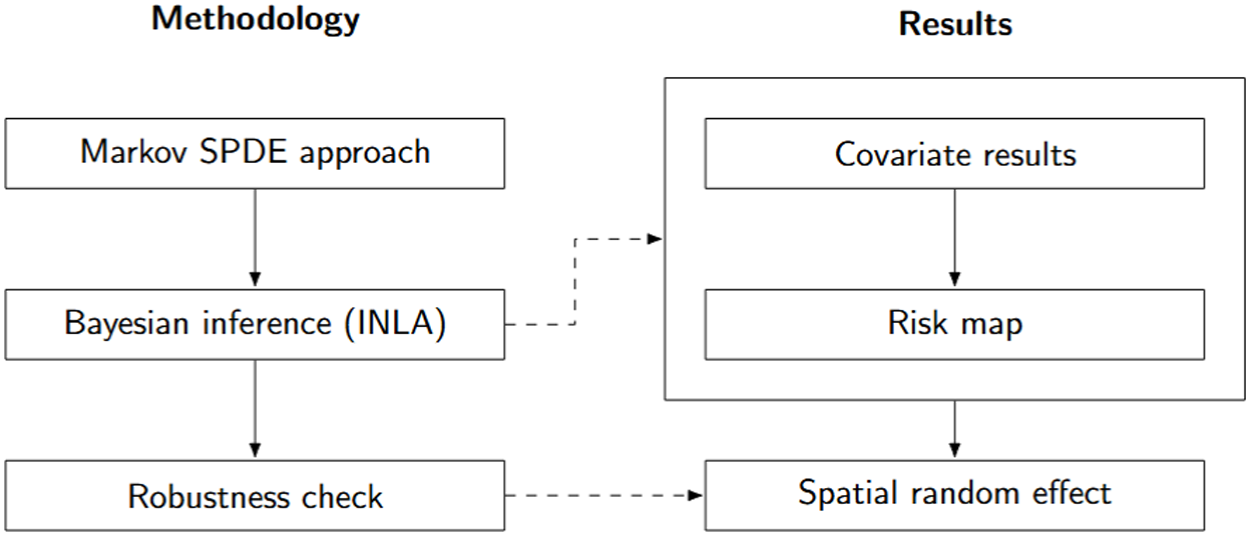
This methodology employs a Bayesian spatial analysis framework integrating three components (Figure 3): spatial dependence modeled via SPDEs and Gaussian Markov random fields (Lindgren et al., Reference Lindgren, Rue and Lindström2011; Simpson et al., Reference Simpson, Lindgren and Rue2011, Reference Simpson, Lindgren and Rue2012; Lindgren and Rue, Reference Lindgren and Rue2015); a conflict rate as the outcome variable (Halkia et al., Reference Halkia, Ferri, Schellens, Papazoglou and Thomakos2020; Rodehau-Noack, Reference Rodehau-Noack2023); and Bayesian inference via INLA (Rue et al., Reference Rue, Martino and Chopin2009) to estimate covariate effects and generate risk maps. Algebraic and computational details are given in Supplementary Appendix B.
Simplified diagram for the SPDE-INLA methodology used and the results for each step.

Figure 3 Long description
The flowchart is divided into two main sections: Methodology and Results. Under Methodology, the process begins with the 'Markov SPDE approach,' which leads to 'Bayesian inference (INLA).' This is followed by a 'Robustness check.' The Results section includes 'Covariate results,' 'Risk map,' and 'Spatial random effect.' The flow from Methodology to Results is indicated by arrows, showing the progression from the methodological steps to the outcomes.
3.2.1. Spatial model (Markov SPDE approach)
Hierarchical models with latent random fields, as discussed in the literature review (Section 2), utilize latent fields representing inherently existing phenomena, irrespective of observation. Therefore, our models are not just for discretely observed data but for approximations of entire processes defined on continuous domains. For a spatial field  $\left( s \right)$, while the data likelihood typically depends only on values at a finite set of locations ${s_1}, \ldots ,{s_m}$, the model itself defines the joint behavior for all locations. This is often approximated by pointwise evaluation, but other observation models can be used, limited only by computational challenges. Temporal dependencies, such as lagged features or spatio-temporal autocorrelation, are not explicitly modeled here, as our focus is on cross-sectional spatial patterns aggregated over the 1997–2023 period; this static approach aligns with our interpretative goals, though future extensions could incorporate dynamic SPDE formulations for time-varying risks (Lindgren and Rue, Reference Lindgren and Rue2015). Thus, the models provide purely spatial snapshots of cumulative risk, treating the data as atemporal aggregates to emphasize geospatial associations over temporal evolution, with no lags or time dependencies included to maintain computational tractability and focus on subnational patterns (Blangiardo et al., Reference Blangiardo, Cameletti, Baio and Rue2013).
Following Lindgren et al. (Reference Lindgren, Rue and Lindström2011), we developed a Bayesian spatial model to evaluate the influence of various development factors on conflict occurrence and to predict conflict risk in areas where data are unavailable or not reported.
For each spatial data point, we assume an underlying conflict risk ( $C\left( {{x_i}} \right)$). We then model the observed conflict risk ( ${Y_i}$) as a binary variable, determined by the ratio of casualties ( ${N_i}$) to the average population within a defined radius around ${x_i}$:
 \begin{equation*}{Y_{_{\text{i}}}}|C\left( {{x_{\text{i}}}} \right) \sim Binomial{\text{ }}\left( {{N_{\text{i}}},{\text{ }}C\left( {{x_{\text{i}}}} \right)} \right)\end{equation*}
The binomial specification propagates uncertainty in ACLED fatality counts through the Bayesian hierarchy via spatial random effects; assumptions, limitations (zero-inflation, overdispersion), and measurement error handling are detailed in Supplementary Appendix B. The conflict risk is linked to its linear predictor using the logit link function:
 \begin{equation*}{\text{logit}}\left( {{\text{C}}\left( {{{\text{x}}_{\text{i}}}} \right)} \right){\text{ }} = {\text{ }}{{{\beta }}_0}{\text{ }} + {{ D\beta }} + {\text{ S}}\left( {{{\text{x}}_{\text{i}}}} \right)\end{equation*}
The intercept, denoted as β₀, represents the baseline value when all covariates are zero. The design matrix (D) is constructed such that each row corresponds to the covariate data for a specific location, extracted from the data rasters. The vector of covariate coefficients then scales these covariates, with each coefficient corresponding to a specific variable as detailed in Section 3.1.2:
 \begin{equation*}\beta = \left( {{\beta _{pop}},{\text{ }}{\beta _{wealth}}, \ldots ,{\text{ }}{\beta _{tlin}}} \right)\end{equation*}
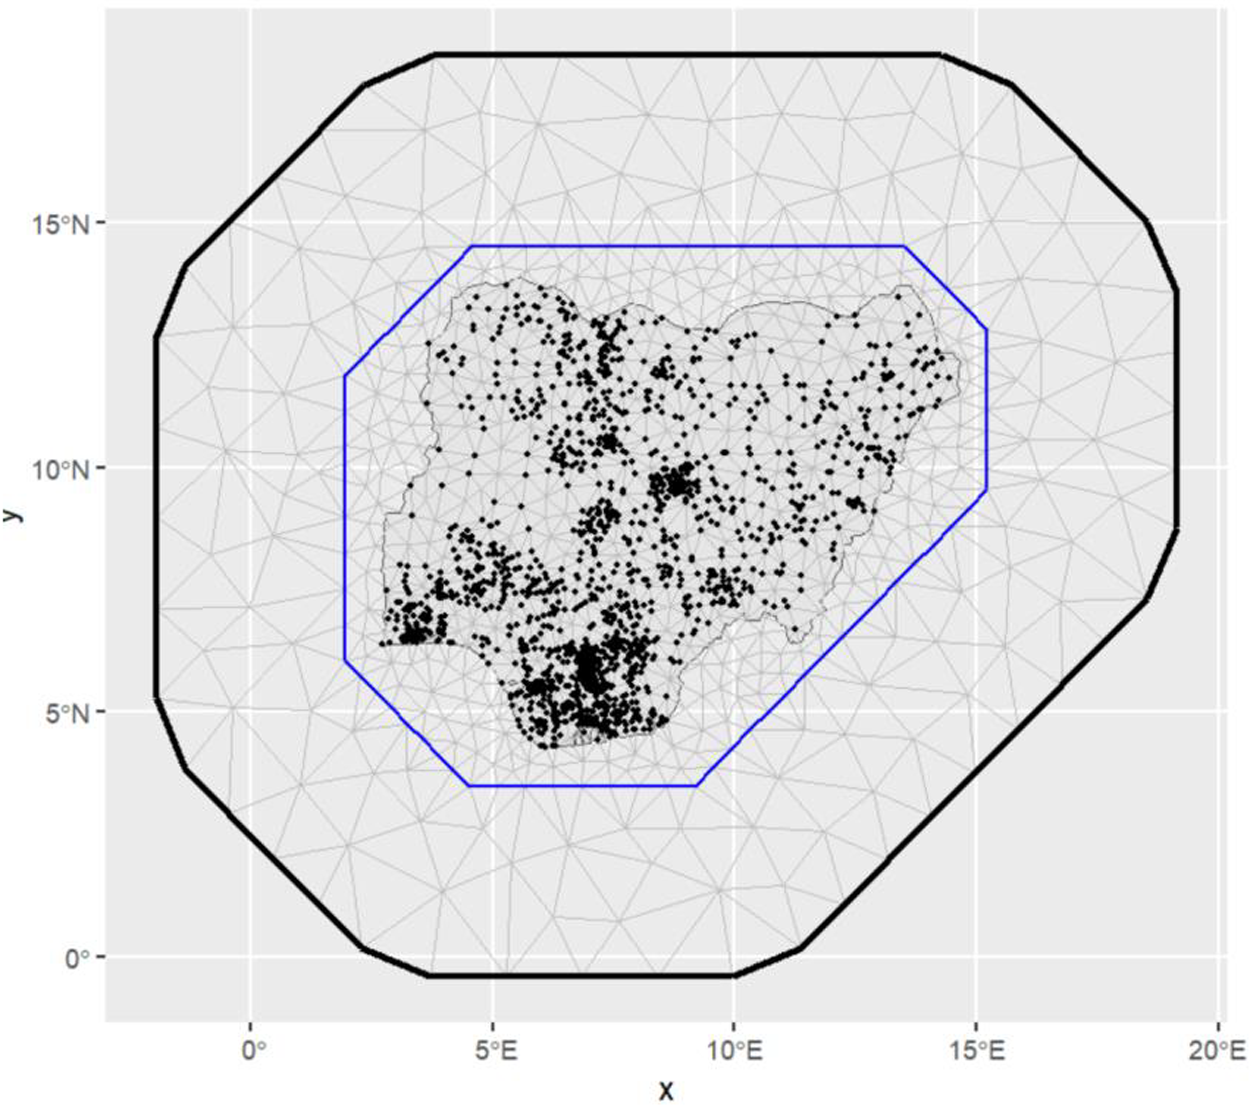
To discretize the study area (Nigeria), a triangular mesh was generated using Delaunay triangulation based on ACLED event coordinates (Figure 4). This mesh, representing the underlying continuous spatial process (Lindgren et al., Reference Lindgren, Rue and Lindström2011), facilitates the computation of spatial autocorrelation and extends beyond the national borders to mitigate boundary effects (Righetto et al., Reference Righetto, Faes, Vandendijck and Ribeiro2018).
Delauney triangulation mesh for ACLED political militias events.

Figure 4 Long description
The map is a thematic representation of Nigeria, displaying a Delaunay triangulation mesh based on ACLED political militias events. Black dots mark event locations, densely clustered in certain areas, indicating higher activity. The map features a blue outline defining the central area of interest and a thick black boundary extending beyond Nigeria to mitigate boundary effects. The triangulation mesh, shown in gray, facilitates spatial analysis. The map is oriented with north at the top. Latitude and longitude axes are present, but no specific place labels are shown. The purpose of the map is to analyze spatial patterns of militia events in Nigeria.
The methodology employed to construct the mesh is critical for the validity of subsequent analyses. It is, therefore, key to design a mesh that yields robust results, minimizing the influence of its inherent properties. The choice of spatial frontiers as barriers is of particular importance (Bakka et al., Reference Bakka, Vanhatalo, Illian, Simpson and Rue2019). Given the documented spillover effects of violence across porous African borders (Bakshi and Dasgupta, Reference Bakshi and Dasgupta2019), incorporating these frontiers as spatial barriers is essential to avoid obscuring underlying drivers and hindering pattern identification.
To mitigate the influence of spatial autocorrelation from neighboring countries (Bakka et al., Reference Bakka, Vanhatalo, Illian, Simpson and Rue2019), we employed two distinct approaches. First, a Delaunay triangulation was constructed, incorporating the entirety of Nigeria within a larger mesh exhibiting higher triangle density within the country and decreasing density beyond a defined distance from its frontiers (Figure 4). Second, we introduced a specific covariate (fron) to explicitly model border effects and investigate the relationship between distance to the frontier and conflict risk for each group. Spatial diffusion, where conflict in one location spills into neighbors, is inherently captured by the SPDE’s Matérn covariance, which models local dependencies through the Gaussian Markov random field approximation, allowing spillover via correlated random effects (Lindgren et al., Reference Lindgren, Rue and Lindström2011). The fron covariate complements this by directly incorporating border proximity as a fixed effect, reflecting potential cross-border diffusion mechanisms like arms flows or refugee movements, thus integrating spillover into both latent and observed structures without additional features (Bakshi and Dasgupta, Reference Bakshi and Dasgupta2019).
The SPDE approach (Lindgren et al., Reference Lindgren, Rue and Lindström2011) links Gaussian random fields to sparse Gaussian Markov random fields via a Matérn covariance structure, enabling scalable Bayesian inference; parameterization, prior specifications, and algebraic details are reported in Supplementary Appendix B.
3.2.2. Robustness check: analysis of spatial random effects
To assess model robustness, we analyze the posterior spatial random effects  $x$ for each conflict typology, examining mean and standard deviation to identify unobserved spatial heterogeneity not captured by the included covariates $\left( {{c_{ij}}} \right)$.
Covariate signs align with theoretical expectations: wealth is negative across all typologies ( $ - $0.52 to $ - $1.49), ethnic fractionalization is positive for militias and rebels but negative for rioters, and petroleum proximity drives rebel activity consistent with greed mechanisms (Arbatli et al., Reference Arbatli, Ashraf, Galor and Klemp2020; Udoh, Reference Udoh2020; Chi et al., Reference Chi, Fang, Chatterjee and Blumenstock2022). Model stability is confirmed by a 15% Deviance Information Criterion (DIC) increase when spatial components are removed and less than 5% coefficient change under alternative mesh configurations.
4. Results
4.1. Significance of development factors across conflict types
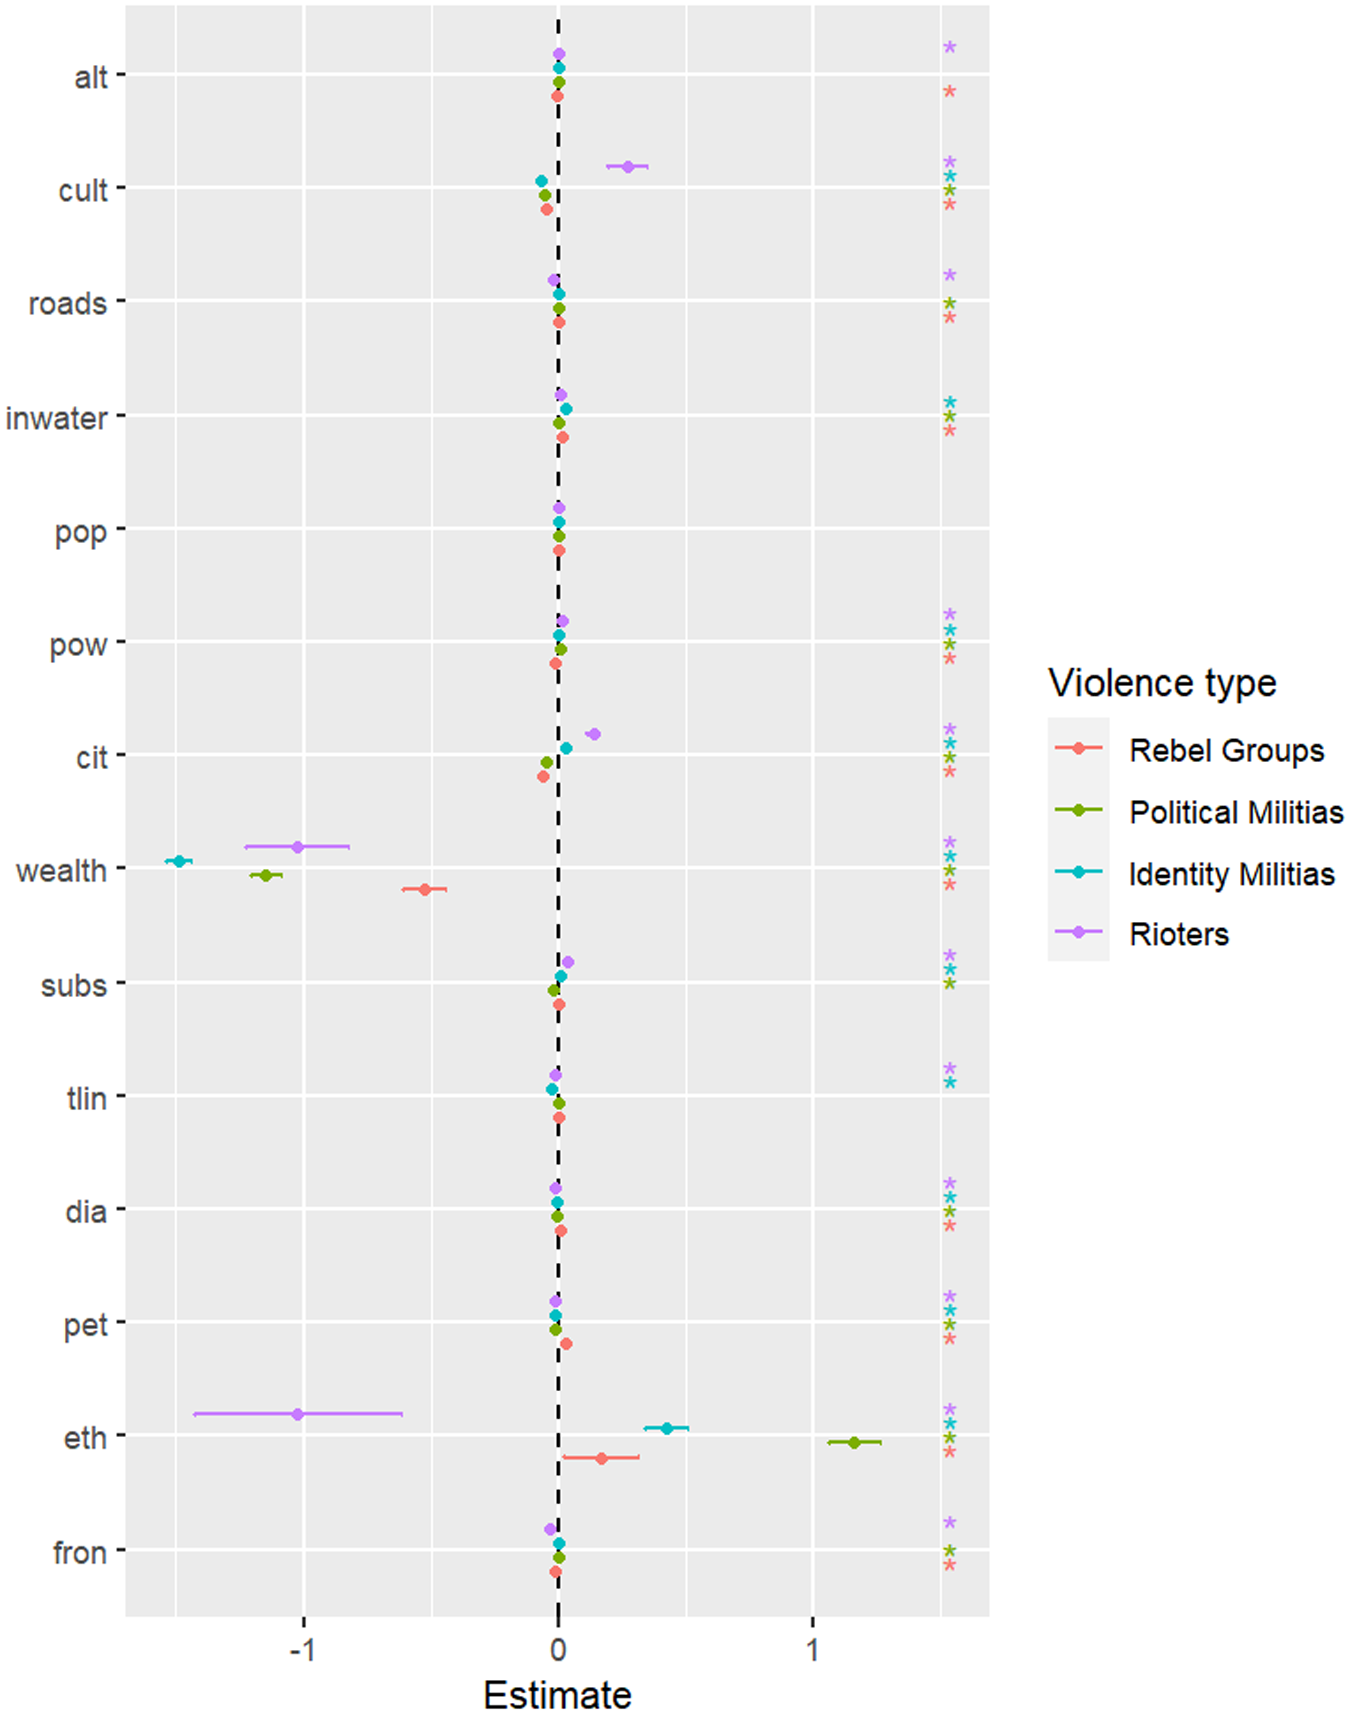
This section presents the results of the Bayesian model estimation, including summary statistics of the posterior marginal distributions  $p({\beta _i}|y)$ for each parameter. Our interpretative focus (X-focused) prioritizes understanding covariate associations through credible intervals and posterior means, while the generated risk maps extend this to spatial predictions (Y-focused), validated via spatial random effect analysis. A key aspect of this analysis is the individual examination of each of the four ACLED-defined conflict typologies and their respective relationships with the development factors $x$. Consistent with our hypothesis, variables show varying directionality: wealth negatively associates across types (mitigating grievances), while ethnic fractionalization positively correlates with militias but negatively with rioters. By examining these relationships, this approach reveals how the impact of development variables differs across conflict types, offering deeper insight into their underlying dynamics. The results are visually captured in Figure 5, with a more comprehensive and detailed discussion of each violent typology provided later in this section. While tables summarize posterior marginals (Tables C1–C4 in the Supplementary Appendix), our analysis extends beyond associations via spatial visualizations and validation, engaging the predictive turn by prioritizing model generalizability over isolated covariate effects (Ward et al., Reference Ward, Greenhill and Bakke2010).
Visual representation of the model outcomes of the covariates results.

Figure 5 Long description
The vertical axis lists covariates: alt, cult, roads, inwater, pop, pow, cit, wealth, subs, tin, dia, pet, eth, fron. The horizontal axis label is Estimate, with tick labels negative 1, 0 and 1. A vertical dashed reference line is drawn at 0. A legend titled Violence type lists four categories: Rebel Groups, Political Militias, Identity Militias, Rioters. Points for each covariate appear as small markers in the four legend categories. Most points across covariates are positioned close to the 0 reference line. Larger horizontal intervals are visible for wealth and eth, extending farther from 0 than most other covariates. A short horizontal interval is visible for cult to the right of 0. A short horizontal interval is visible for cit near 0.
For Rebel Groups, wealth is the strongest protective factor (mean:  $ - $0.524), while ethnic fractionalization (0.169), border proximity, and petroleum distance are positively associated with risk; proximity to cities, cultivated areas, and power plants reduces it, while Political Militias have the largest ethnic fractionalization effect (mean: 1.164) and a strong negative wealth effect (mean: $ - $1.149); proximity to cities, diamonds, petroleum, and substations increases risk, while distance from roads, frontiers, water, and power plants does too.
Identity Militia risk is driven by ethnic fractionalization (0.425) and strongly reduced by wealth ( $ - $1.490); areas distant from urban infrastructure are more vulnerable, while proximity to cultivated areas, diamonds, petroleum, and transmission lines increases risk. For Rioters, both wealth ( $ - $1.023) and ethnic fractionalization ( $ - $1.022) reduce risk, while greater distance from cities (0.138) and cultivated lands (0.276) increases it, pointing to rural and peri-urban marginalization as the main driver.
Across typologies, wealth consistently reduces risk ( $ - $0.52 to $ - $1.49), confirming the grievance-mitigation hypothesis. Ethnic fractionalization is positive for militias and rebels but negative for rioters, reflecting distinct social dynamics; petroleum proximity drives rebel activity (greed), while cultivated-area proximity matters more for communal violence. Cross-typology patterns are detailed in Supplementary Appendix C.
4.2. Conflict risk maps by violence type
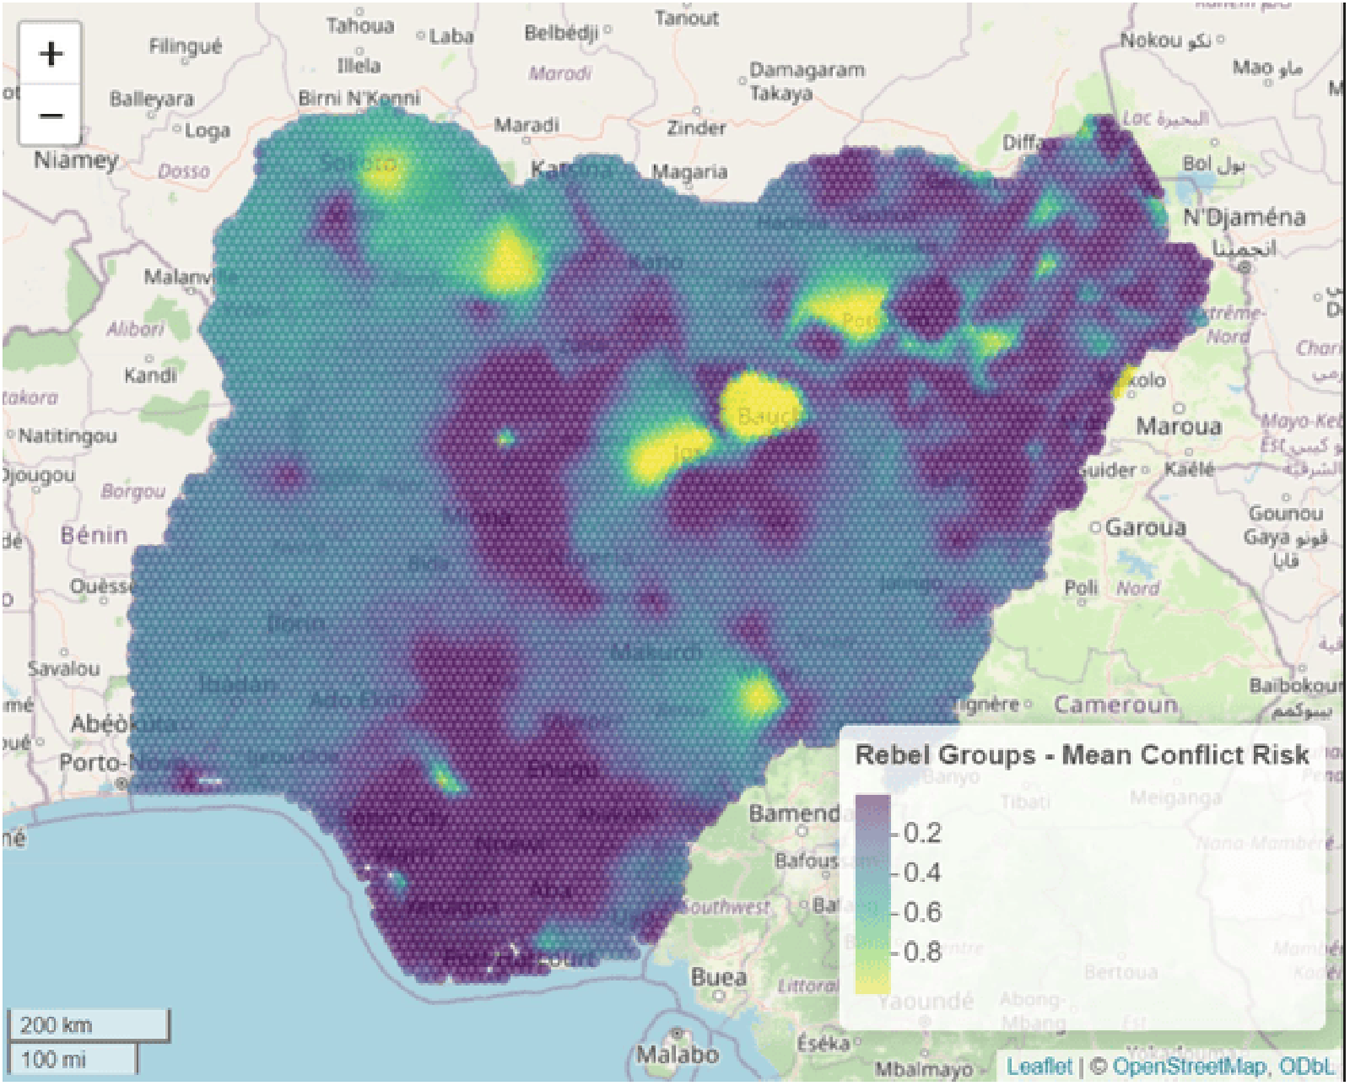
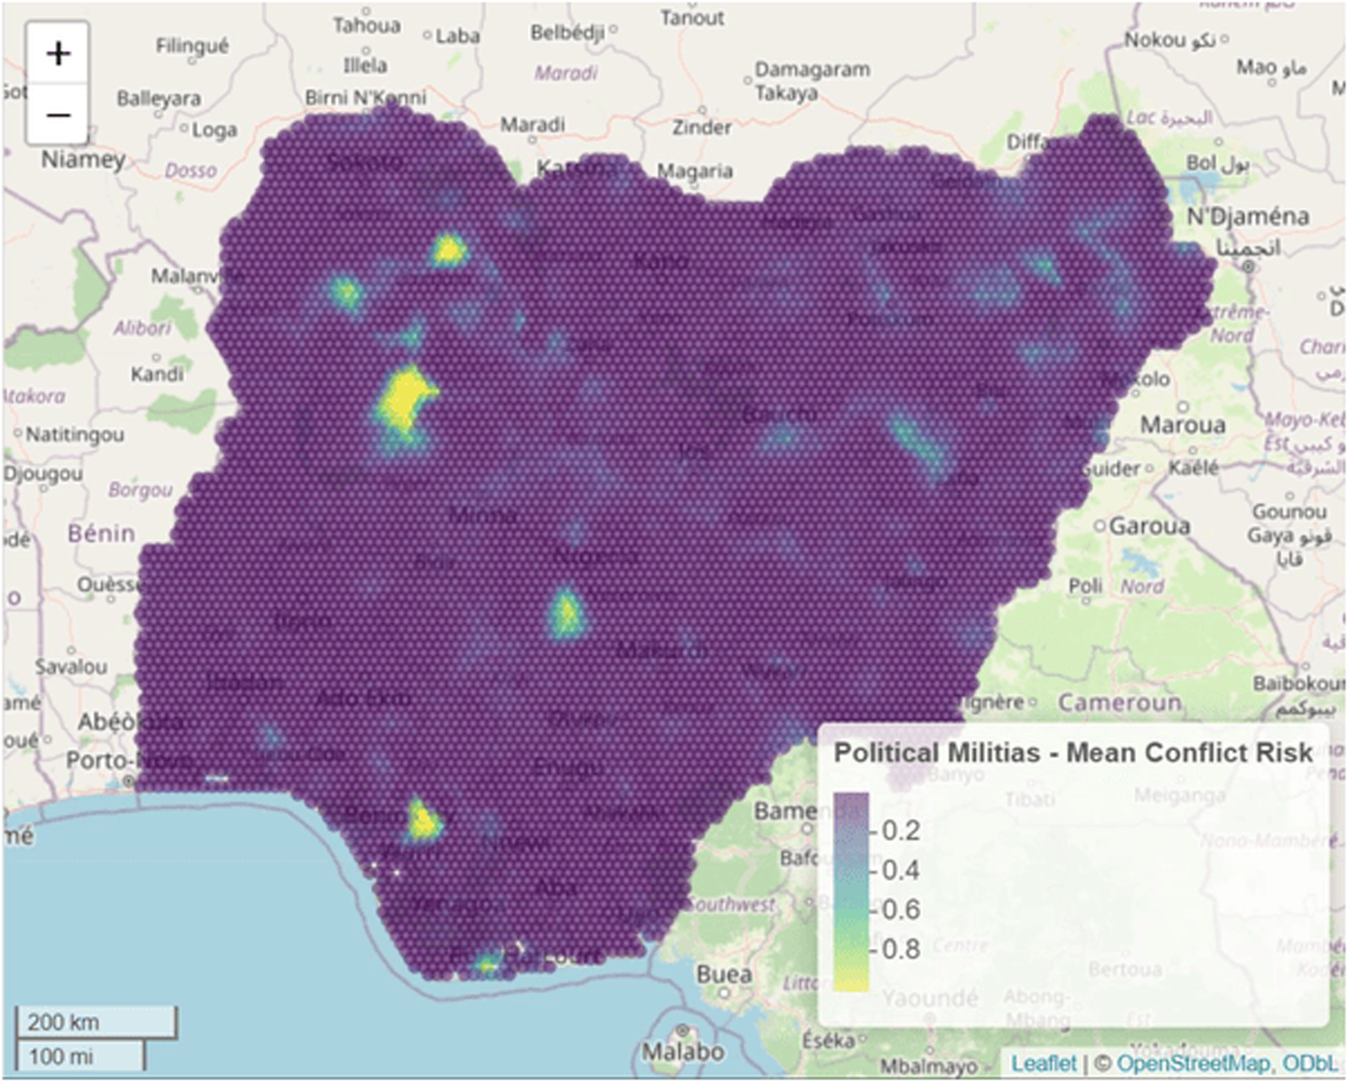
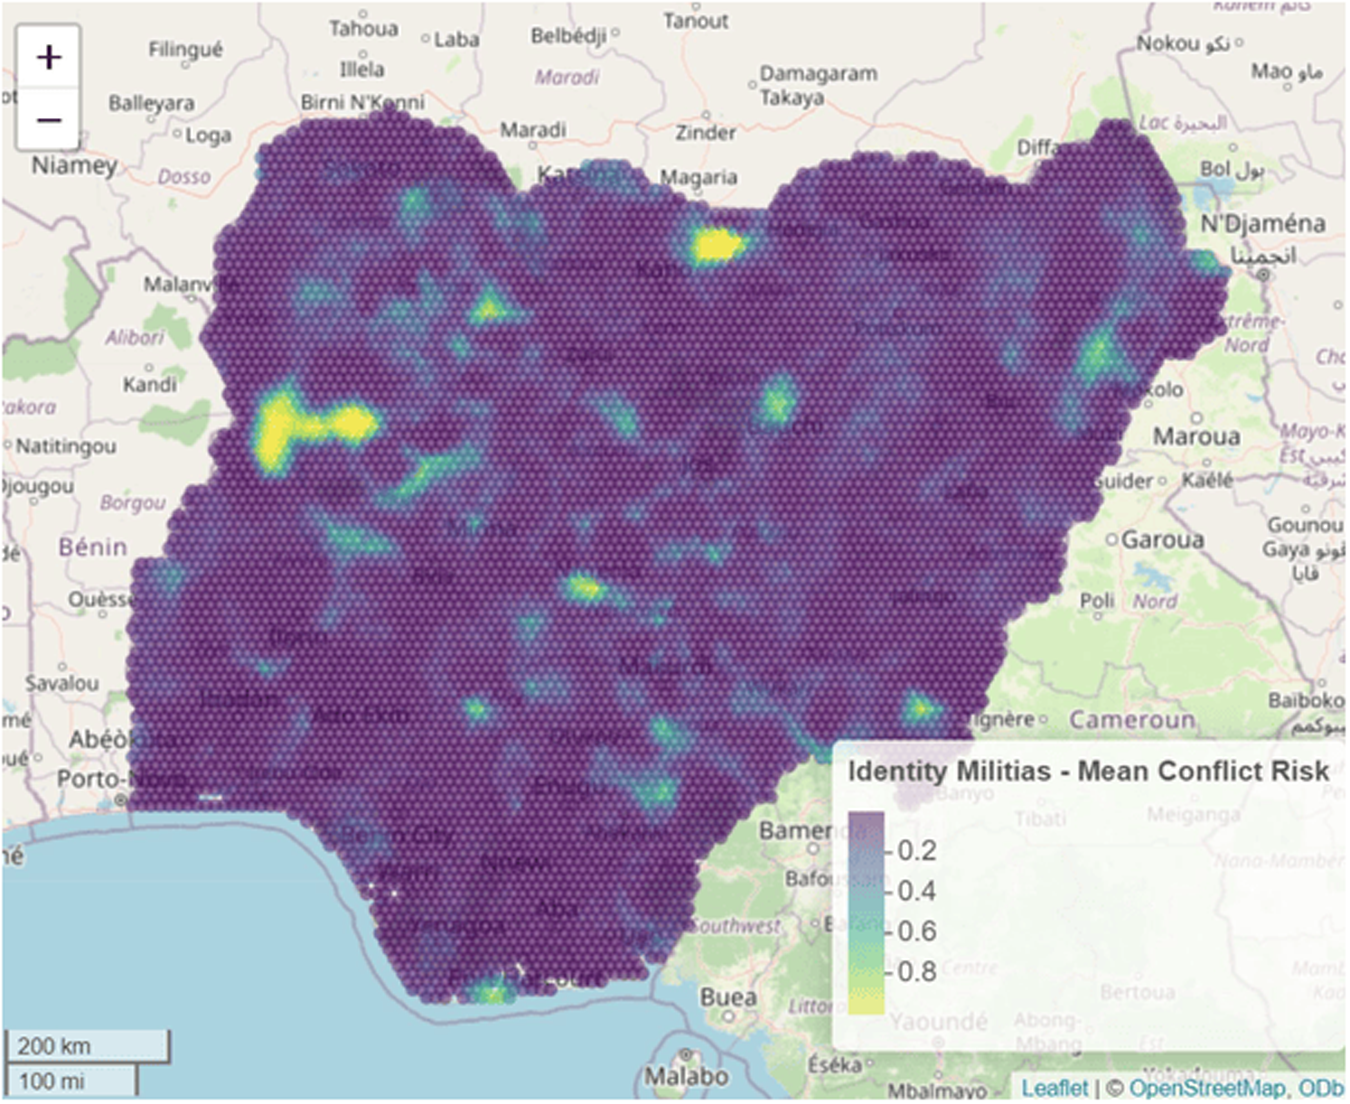
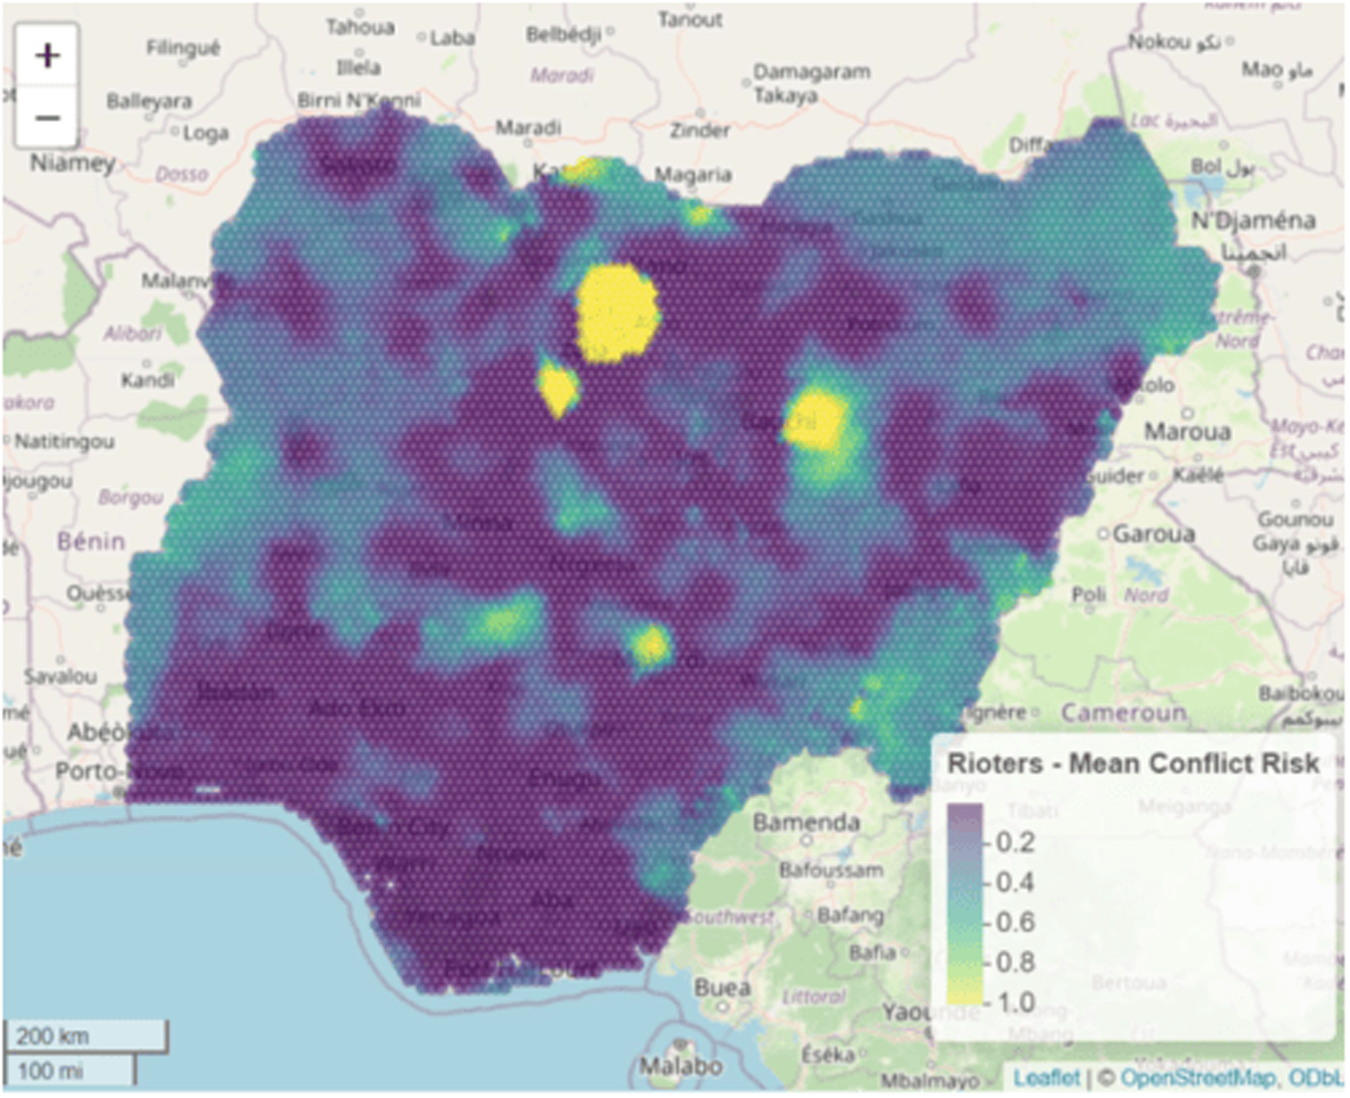
Figures 6–9 map estimated average conflict risk from the Bayesian spatial model across Nigeria, one for each violence typology analyzed separately. Risk surfaces are accompanied by posterior standard deviations as 95% credible regions, enabling uncertainty-aware interpretation for policy applications (Vehtari et al., Reference Vehtari, Gelman and Gabry2017).
Mean conflict risk map for rebel groups.

Figure 6 Long description
The map of Nigeria displays the mean conflict risk associated with rebel groups. The legend categorizes risk levels into four ranges: 0 to 0.2, 0.2 to 0.4, 0.4 to 0.6 and 0.6 to 1. Areas with higher risk are concentrated in the central and northeastern regions, while lower risk areas are more prevalent in the southern and coastal regions. The map includes a scale bar indicating distances of 200 km and 100 mi and is overlaid with geographic labels for cities and regions such as Lagos, Abuja and Maiduguri. The spatial distribution of risk is visually represented with varying intensities, highlighting regions with significant conflict potential.
Rebel factions: Figure 6 shows the spatial distribution of risk for rebel factions. In northeastern Nigeria, proximity to metropolitan areas such as Potiskum and Bauchi is negatively correlated with conflict risk, indicating an increased possibility of violence closer to these cities. This finding is consistent with the model findings (Supplementary Appendix Table C1), which reveal a substantial negative mean effect of wealth (−0.524) on rebel groups, implying that wealthier, typically urbanized regions see less rebel activity. However, the localized dynamics surrounding Potiskum and Bauchi imply a different pattern, which might be attributed to the specialized operational techniques of Boko Haram groups like JAS and ISWAP, whose internal disputes destabilize the region and override the overall tendency. The map highlights elevated risk in Bauchi, aligning with early Boko Haram activity like the 2010 prison break, and around Jos (Plateau), where attacks occurred 2010–2015 amid urban grievances; Maiduguri shows moderated risk due to model smoothing via negative urban and wealth effects and latent factors capturing unobserved military presence, though events are concentrated there as Boko Haram’s origin. This contextualizes the northeast/Lake Chad focus in events (Figure 1), with Bayesian estimation revealing broader potential risk from factor clusters like low wealth + border proximity. Furthermore, the model demonstrates a positive mean effect of closeness to oil supplies (0.0326) on rebel groupings. This is consistent with the observed conflict patterns in the Northwest, where Sokoto has been a site of ongoing confrontation between the Nigerian military and Boko Haram/ISWAP since 2014, likely driven by competition for resources and strategic control of the region, as proximity to petroleum sources can exacerbate conflicts due to resource competition (Udoh, Reference Udoh2020). However, Sokoto’s risk also reflects religious legacy from Usman dan Fodio’s jihad (Sokoto Caliphate), inspiring Boko’s ideology, beyond oil, modeled via latent fields capturing such unobserved historical clusters. Zamfara also experiences heightened violence due to internal conflicts, including the involvement of Ansaru, further emphasizing the resource-driven nature of rebel activity in these areas. Additionally, the model shows a negative mean effect of distance to frontiers (−0.0128), which is consistent with the literature indicating that proximity to borders can increase conflict intensity due to cross-border movement of combatants (Bakshi and Dasgupta, Reference Bakshi and Dasgupta2019).
Political militias: The political militia geographical risk map is shown in Figure 7. Despite having less open source documentation, the Kontagora area poses a potentially unstable scenario. It may be deduced that political militias, which are frequently associated with local political leaders, function similarly to those seen in other parts of Nigeria. These organizations pose a danger to regional stability because they take advantage of local concerns, especially during election seasons, to exert influence or further the goals of their donors. The model results (Supplementary Appendix Table C2), which show a substantial positive mean effect of ethnic fractionalization (1.1637) for political militias, reflect this dynamic. This supports the corpus of evidence suggesting ethnic disputes might be a significant contributor to political violence. Similar to rebel groups, money also exhibits a substantial negative mean effect (−1.1485), but in the case of political militias, especially when local political competition is present, the role of ethnic fractionalization seems to be a bigger driver. The map contextualizes high central risk as clusters of ethnic diversity and low wealth combined with resource proximity, implying grievance amplification in politically contested areas like Niger state, where militias exploit elections. Additionally, the model indicates that political militias have a positive mean impact of distance to main highways (0.004), indicating that locations farther away from major roadways would be more suitable for their operations.
Mean conflict risk map for political militias.

Figure 7 Long description
The heatmap displays political militias mean conflict risk across Nigeria. The legend indicates risk levels with numerical values ranging from 0.0 to 0.8, representing low to high risk. Areas with higher risk are concentrated in specific regions, suggesting notable hotspots. The map includes place names such as Nigeria, Cameroon, Benin and Niger. The scale bar shows distances of 200 kilometers and 100 miles. The heatmap provides insights into spatial patterns of conflict risk, highlighting regions with elevated values.
Identity militias: The risk map for identity militias is shown in Figure 8. Religious tensions and identity-based militias taking advantage of intercommunal disputes are the main causes of violence in Kano. Conflicts over resources and territory engage the Fulani group as both offenders and victims. When these militias participate in protection rackets or show preference for one community over another, the likelihood of violence increases. Ethnic conflicts, political manipulation, rivalry for resources, and the availability of small guns are some of the reasons that increase the risk of violence around Kainiji Lake. These findings are supported by the model results (Supplementary Appendix Table C3), which indicate that for identity militias, the mean effect of wealth was significantly negative (−1.4899) while the mean effect of ethnic fractionalization was positive (0.4252). This is in line with the understanding that competitiveness for resources and ethnic tensions are key contributors to this type of violence. One of the main causes of conflict may be disputes over resources, such as water (Ide et al., Reference Ide, Kristensen and Bartusevičius2020; Unfried et al., Reference Unfried, Kis-Katos and Poser2022). Additionally, the model shows that identity militias have a positive mean effect of distance to inland water bodies (0.0276).
Mean conflict risk map for identity militias.

Figure 8 Long description
The map of Nigeria illustrates the mean conflict risk associated with identity militias. The legend indicates risk levels ranging from 0 to 1, with higher values representing greater risk. Areas with higher risk are concentrated in the central and northern regions, while lower risk areas are more prevalent in the southern regions. The map uses a gradient to depict these variations, with specific locations like Kano showing elevated risk levels. The map includes a scale bar indicating distances of 200 km and 100 mi.
Rioters: The risk map for rioters is shown in Figure 9. In Bauchi, vigilante organizations aggressively fight against terrorism and banditry with financial assistance from the governor and the local administration. Their increasing numbers, nevertheless, might result in conflicts with other armed groups or local dissension. Rioter activity can intensify in a volatile atmosphere created by the confluence of political interests, security issues, and armed group operations. The situation is made more difficult by socio-economic problems like unemployment and poverty, which exacerbate dissatisfaction and make people more susceptible to recruitment by these organizations. A distinct pattern for rioters is shown by the model findings (Supplementary Appendix Table C4), which show a significant negative mean effect for both wealth (−1.0229) and ethnic fractionalization (−1.0217). In contrast, other conflict types showed a positive connection with ethnic fractionalization, indicating that riots are more prevalent in poorer areas with lower ethnic diversity. This suggests that, contrary to the positive correlation of ethnic fractionalization shown for other conflict types, rioting is more prevalent in areas of poverty with less ethnic diversity. Additionally, rioting is more prevalent in rural or peri-urban regions, which are distant from both urban centers and cultivated fields, according to the large positive mean effects of distance to main cities (0.1378) and distance to cultivated lands (0.2756). This may be due to factors including unemployment and social marginalization. This is supported by recent research on urban unrest (Gizelis et al., Reference Gizelis, Pickering and Urdal2021).
Mean conflict risk map for rioters.

Figure 9 Long description
A map with an overlaid heatmap titled Rioters - Mean Conflict Risk. Geographic labels visible on the map include Nigeria, Benin, Cameroon and Chad. City labels visible include Abuja, Lagos, Ibadan, Benin City, Port Harcourt, Enugu and Maiduguri. Additional place labels visible include N Djamena, Garoua and Bamenda. A legend labeled Rioters - Mean Conflict Risk shows tick labels 0.0, 0.2, 0.4, 0.6, 0.8 and 1.0. The heatmap overlay covers most of Nigeria. Several small, distinct hotspot areas appear within Nigeria, including one large hotspot in the northern part of Nigeria and multiple smaller hotspots across central and northeastern areas. Lower-intensity areas appear broadly across much of the remaining covered area. A scale bar at the lower left shows 200 kilometers and 100 miles. Text at the lower right includes Leaflet and OpenStreetMap.
4.3. Spatial random effect values
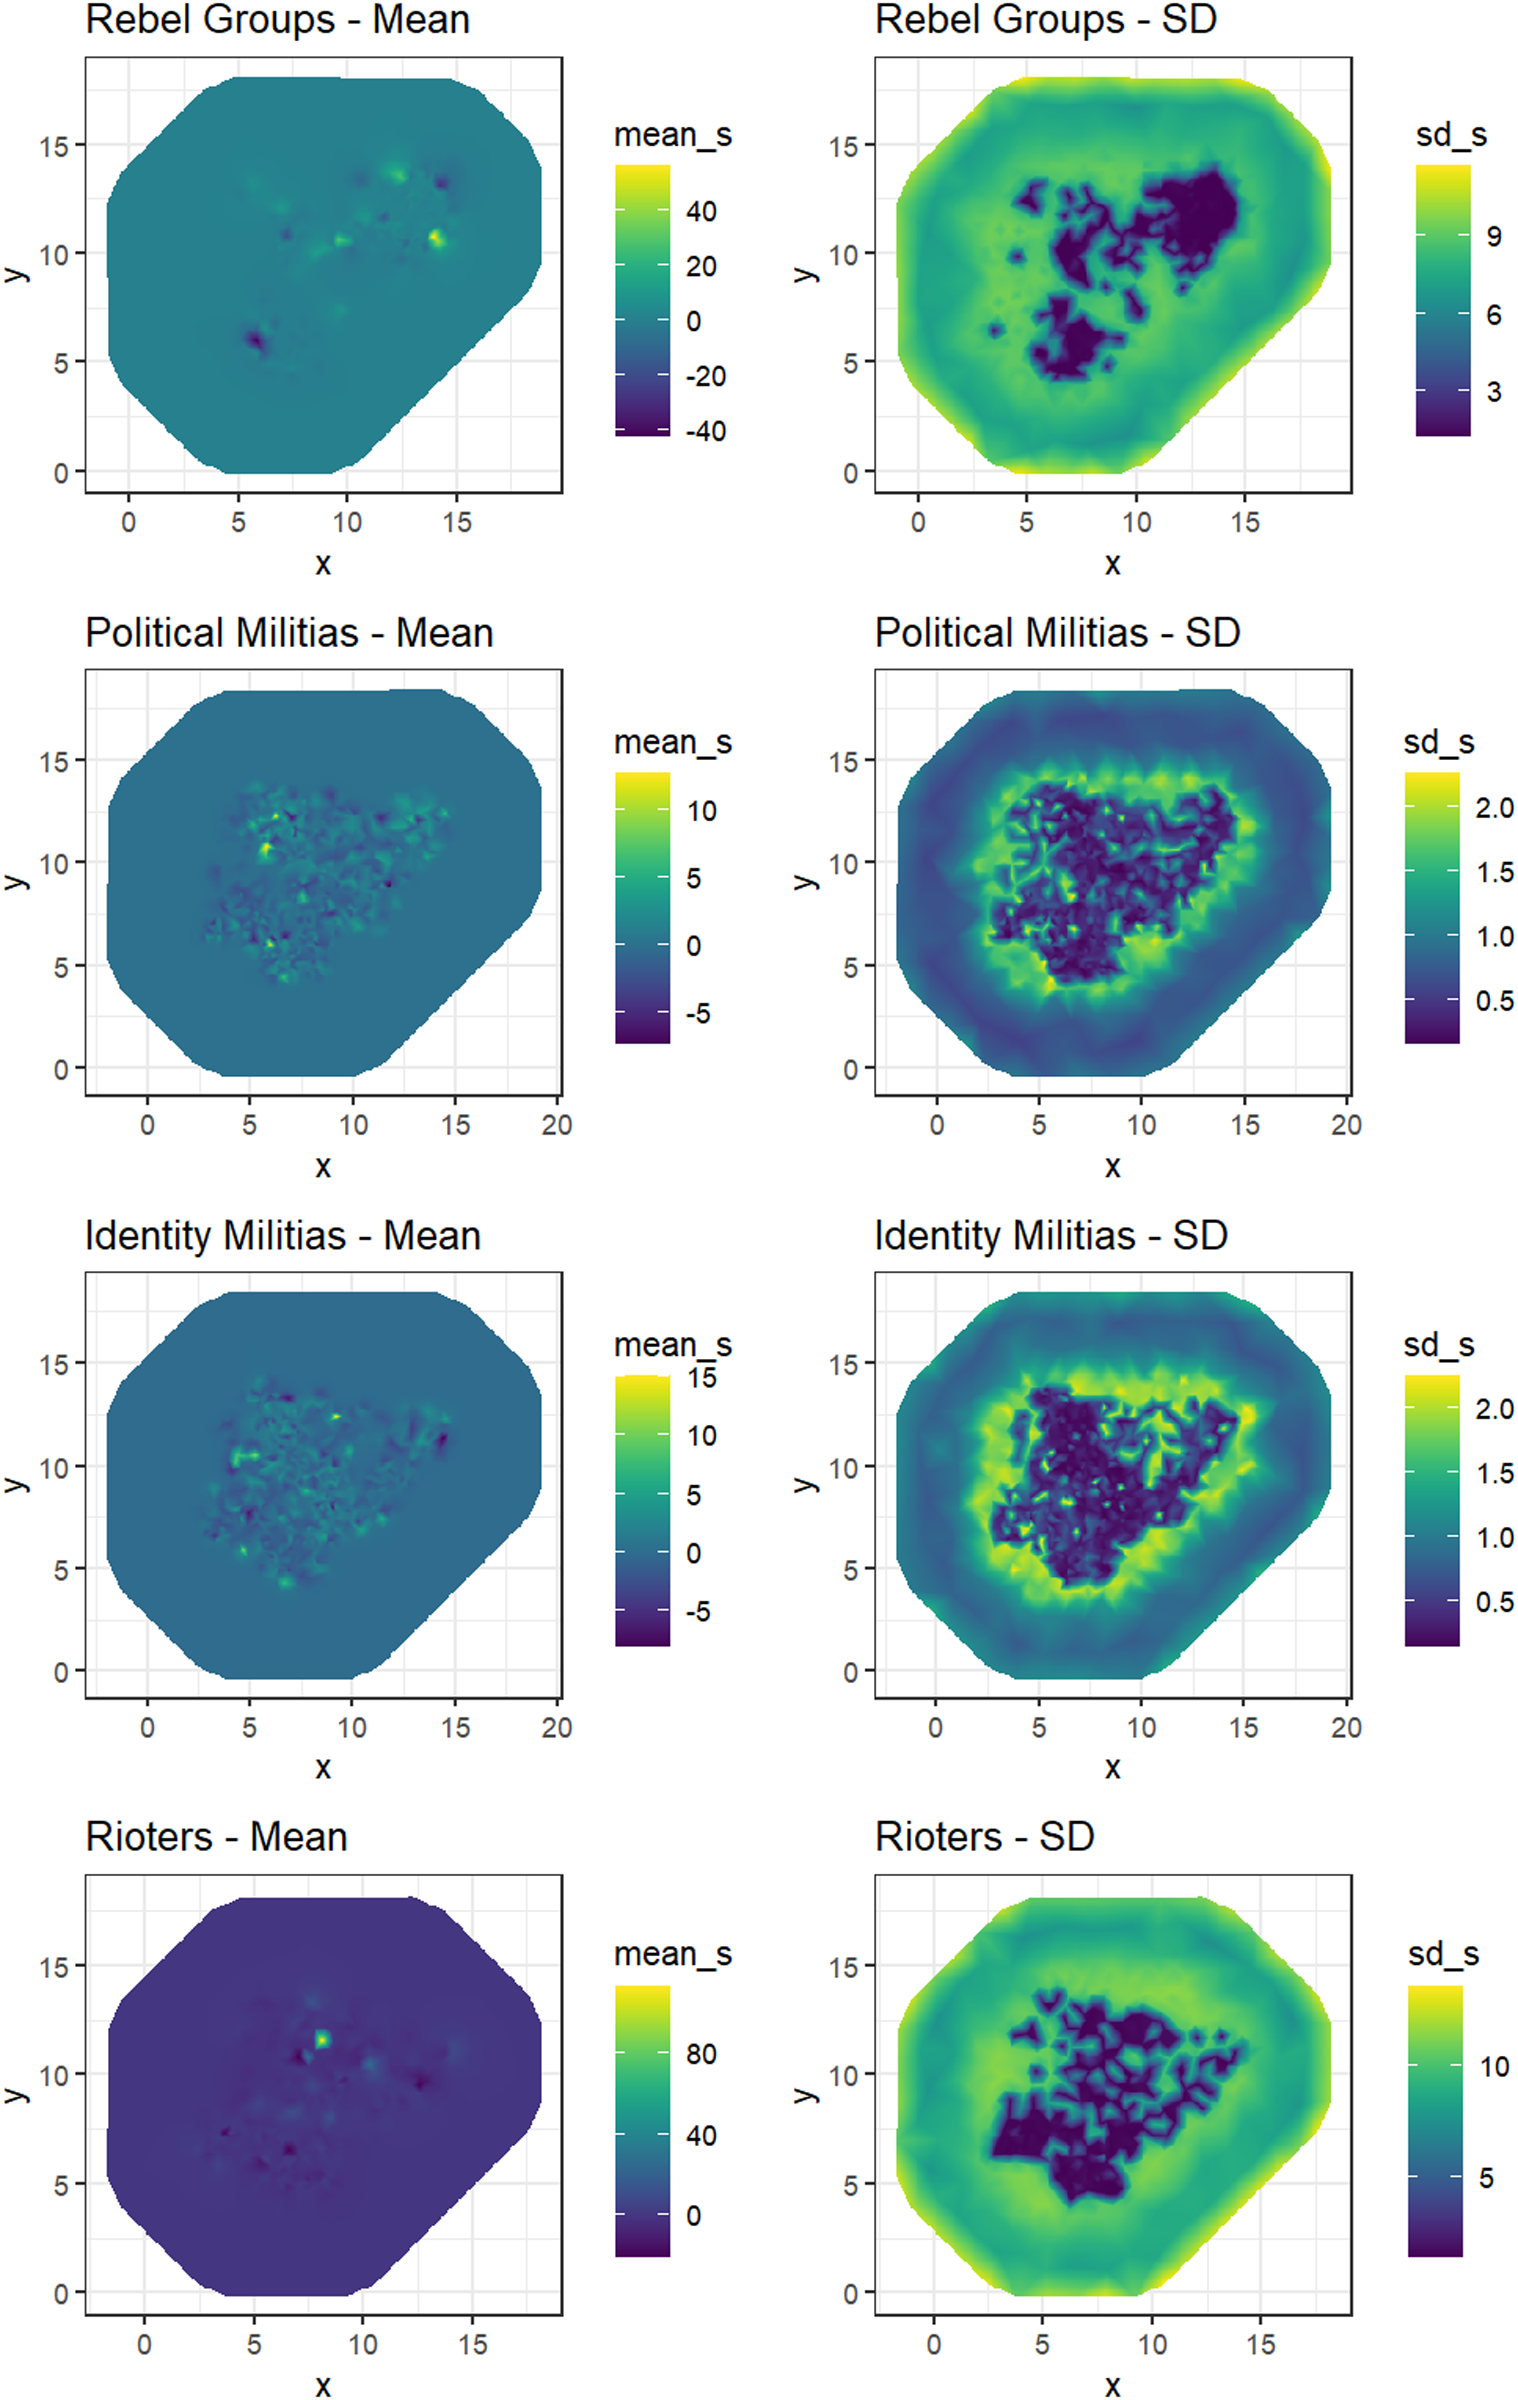
For a more comprehensive understanding of spatial patterns that our covariate data alone may not reveal, we examine the average and variability of spatial fields for each type of violence across the grid. In doing so, our objective is to determine the sufficiency of our data to make accurate predictions for each type of violence and to identify the need for additional factors to fully understand the patterns of each type of violence.
As shown in Figure 10, events involving Political and Identity Militias demonstrate a similar random effects distribution and magnitude. In contrast, Rebel Groups and Rioters exhibit comparable but distinct patterns from those of the Political and Identity Militias.
Spatial random effect.

Figure 10 Long description
The heatmaps illustrate spatial random effects for four groups: Rebel Groups, Political Militias, Identity Militias and Rioters. Each group has two panels: one for Mean and one for Standard Deviation. The x and y axes represent spatial coordinates. The Mean panels show variations in spatial effects, with legends indicating values diverging around zero. Positive values suggest higher intensity, while negative values indicate lower intensity. The Standard Deviation panels reflect the uncertainty or variability of these effects, with higher values indicating greater variability. Key patterns include clustering of high mean values in central areas for Rebel Groups and Political Militias, while Identity Militias and Rioters show more dispersed patterns. Standard Deviation is highest in the central regions for Political Militias and Rioters, suggesting greater variability. The color gradient in Mean panels ranges from low to high values, while in Standard Deviation panels, it indicates variability levels. These patterns highlight differences in spatial effects and variability among the groups.
Political and Identity Militias show spatial field standard deviations proportional to distance from data points and significant mean variation across the study area, suggesting unmodeled spatially structured factors for these typologies. Rebel Group and Rioter fields are more consistent, indicating the covariates adequately capture their spatial patterns.
4.4. Model validation
Model validation results are reported in Supplementary Appendix D. Using Watanabe–Akaike Information Criterion (WAIC), hold-out log pointwise predictive density, and PPCs, the spatial model outperforms the non-spatial baseline on all probabilistic metrics, confirming that accounting for spatial dependence substantially improves predictive accuracy (see Supplementary Appendix Table D1 and Figures D1–D3).
5. Discussion
This study aimed to understand the complex associations and spatial patterns underlying different types of violence by examining the relationship between development factors and conflict through a Bayesian spatial analysis. Nigeria was selected as the unit of analysis, leveraging publicly available covariate data to construct a comprehensive analytical framework. By incorporating a diverse set of socio-economic and geospatial variables, this framework provides a holistic perspective on the intricate interactions contributing to conflict formation, specifically addressing how development deficits might influence conflict risk.
Our research presents theoretical arguments: mechanisms of greed drive rebel violence (proximity to resources, high casualty rates/territorial strategies), grievance primarily influences militias (ethnic diversity, communal targeting in overlapping areas), and marginalization fuels spontaneous unrest for rioters (low casualties). These interactions manifest as spatial combinations that heighten risk through underlying fields, such as resources interacting with ethnicity for militias. Methodologically, the study employed a conflict incidence rate as the dependent variable, normalizing fatality numbers by population density to provide a more contextually relevant measure of conflict intensity and account for varying population distributions. A Bayesian spatial model was implemented using INLA, treating covariates as fixed effects to estimate their impact on conflict risk. To account for residual spatial autocorrelation, a spatial Gaussian process model, parameterized using SPDEs and a Matérn covariance function, was incorporated.
Existing conflict research has often prioritized national-level and temporal analyses, frequently neglecting the valuable insights afforded by geospatial data and advanced analytical techniques. This lacuna is attributable, in part, to limitations in the availability of spatially granular data and the technical challenges associated with advanced geospatial analysis tools, such as Quantum Geographic Information System (QGIS) and the INLA-SPDE Bayesian framework employed. However, this study demonstrates the significant potential of geospatial analysis for elucidating the complex spatial dynamics of conflict. By explicitly incorporating spatial information and advanced statistical modeling, this research contributes to a more nuanced understanding of conflict drivers and paves the way for future research to further explore the rich insights offered by this methodological approach.
Based on this analysis, several interconnected development and security policy recommendations for Nigeria emerge, emphasizing economic and resource allocation strategies while recognizing the critical need to address each conflict typology distinctly, guided by theories specific to actors, such as resource management for rebels motivated by greed and inter-ethnic communication for militias driven by grievances.
The robust negative correlation between wealth and all forms of conflict, particularly pronounced for Identity Militias, underscores the paramount importance of targeted poverty reduction programs. These programs, potentially implemented in partnership with international organizations like the World Bank and the IMF, should be context-specific, focusing on income generation, skills development, and improved access to essential services (Makinde et al., Reference Makinde, Olamijuwon, Mgbachi and Sato2023) like education and healthcare for the most vulnerable populations, especially in areas identified as high risk for Identity Militia activity. Recognizing the role of resource competition, especially concerning petroleum and potentially diamonds, transparent and equitable resource management policies are crucial. This requires the implementation of revenue-sharing mechanisms benefiting local communities, particularly in resource-rich regions experiencing rebel activity, robust environmental protection to mitigate resource-related grievances, and clear legal frameworks for resource extraction (Asiegbu et al., Reference Asiegbu, Ikeanyibe, Abang, Ezeibe, Nwonu and Nwafor2024). Given the strong positive association between rioting and distance to cultivated lands, rural development initiatives and investment in agricultural infrastructure, improved farming techniques, and market access can enhance rural livelihoods and reduce social marginalization, thus mitigating rioting risk, especially in areas further from cultivated lands.
From a security standpoint, the application of INLA-SPDE Bayesian analysis coupled with geospatial data empowers authorities to create detailed maps of conflict risks. Such proactive measures enable them to identify and address potential hotspots before they escalate. This strategic approach not only aids in informing counterinsurgency operations but also enhances the effectiveness of responses. Ultimately, it fosters long-term stability by guiding strategic interventions and fostering community development initiatives aimed at mitigating conflict. To maximize policy relevance, uncertainty is visualized accessibly, aiding non-technical users in weighing risks reliably. This interpretability ensures outputs inform equitable resource allocation and targeted interventions, bridging technical rigor with practical utility (Spiegelhalter et al., Reference Spiegelhalter, Pearson and Short2011).
Because different conflict typologies have distinct drivers, security strategies must be tailored accordingly. For Rebel Groups, this means focusing on counter-insurgency, border security to control cross-border movements, and addressing grievances related to resource control and political marginalization, particularly in the Northeast, where conflicts with groups like Boko Haram and ISWAP are prevalent (as documented in numerous studies on the insurgency in Northeast Nigeria). For Political Militias, where ethnic fractionalization is a strong driver, strengthening law enforcement, promoting inter-party dialogue, and addressing ethnic tensions are crucial, especially in areas identified as high risk. For Identity Militias, community-based conflict resolution, inter-group dialogue, and collaborative resource management are key, particularly in areas with high ethnic fractionalization and low wealth, such as those affected by intercommunal violence related to resource access and land disputes, often involving pastoralist groups. For Rioters, focusing on social service provision in marginalized areas, addressing unemployment and poverty, and promoting community policing are essential, particularly in rural or peri-urban settings far from cities and cultivated lands.
Decentralization and empowering local communities in decision-making and resource management can further address local grievances and reduce the appeal of armed groups. Continued investment in data collection and analysis is essential for monitoring conflict trends and evaluating interventions. Finally, effective policy implementation requires strong coordination among government agencies, civil society, and international organizations. This Nigerian case study, exhibiting a complex mix of all four conflict typologies, provides a unique opportunity to study these interplays. While the findings are specific to Nigeria, the analytical framework and emphasis on disaggregated analysis are replicable in other contexts where these conflict types are present, enabling more effective and targeted interventions globally.
Our study overlooks the impact of external security forces, particularly the Multinational Joint Task Force (MNJTF), on violence manifestation. Due to limited accessible data, the MNJTF’s presence or absence in different regions remains unaccounted for. Additionally, the analysis assumes uniform behavior across violent groups within the same category, neglecting distinct motivations and methods. Recognizing this diversity is crucial for targeted interventions. Future work could create specific models for each group based on identified covariates.
The economic cost of conflict is substantial, affecting not only the immediate areas of violence but also the broader national economy. Conflict disrupts trade, deters investment, and diverts public funds from development projects to security measures. By using the insights gained from this study, development organizations and governments can better allocate resources to prevent conflict and promote sustainable economic growth. This proactive approach not only saves lives but also preserves economic assets and promotes long-term prosperity. Ultimately, integrating economic strategies with conflict prevention measures can create a more prosperous Nigeria.
Supplementary material
The supplementary material for this article can be found at https://doi.org/10.1017/psrm.2026.10107. To obtain replication material for this article, https://doi.org/10.7910/DVN/XSSP5K.
CRediT authorship contribution statement
Juan J. Villar-Roldán: Data curation, conceptualization, methodology, software, visualization, writing—original draft preparation, writing—reviewing and editing; Aida Galiano: Investigation, supervision; and Juan M. Martín-Álvarez: Investigation, supervision.
Declaration of generative AI and AI-assisted technologies in the writing process
During the preparation of this work, the authors used Grammarly in order to assist with various aspects of language refinement, including grammar, style, and clarity. After using this tool/service, the authors reviewed and edited the content as needed and take full responsibility for the content of the published article.
Declaration of interest statement
The authors declare that they have no known competing financial interests or personal relationships that could have appeared to influence the work reported in this paper.


 Open access

