

Studying the consequences of problem indicators is imperative in a world that has seen an explosion in the sheer number of problem indicators available. Examples include indicators on unemployment, waiting lists for hospital treatments, pesticide pollution, and students’ well-being in schools. Furthermore, in an increasingly globalised world, international organisations such as the Organization for Economic Co-operation and Development (OECD) and the International Monetary Fund publish more and more international ratings and rankings that provide policymakers with information about domestic policy problems, with the Programme for International Student Assessment (PISA) as a prominent example. Consequently, there is more information available to political decisionmakers than ever before (Walgrave and Dejaeghere Reference Walgrave and Dejaeghere2017).
However, not much research has investigated whether decisionmakers – parties and politicians – devote attention to information from problem indicators. The lack of interest in the topic is problematic, as even the most well-recognised problem indicator is “just” a number that does not speak or generate attention for itself. Although indicators are powerful constructs on their own, even the most stubborn fact depends on political actors carrying it onto the policy agenda (Stone Reference Stone1998).
The aim of this article is to improve our understanding of the relationship between problem indicators and the attention of political parties. We focus on political parties because, in parliamentary democracies, they continue to be the most important political actors that organise political interest and drive the policy process through the parliamentary system (Dalton et al. Reference Dalton, Darrell and McAllister2011). In other words, in such systems, parties must devote attention to problem indicators in order for those indicators to have consequences.
More particularly, we systematically examine how the information contained in 17 different problem indicators causes parliamentary activity as measured by a content coding of more than 220,000 parliamentary questions asked in parliament by government and opposition MPs in seven western countries, covering up to six decades. Hence, in line with previous research (Vliegenthart and Walgrave Reference Vliegenthart and Walgrave2011), we use parliamentary questions as an indicator of the policy agenda. This large-scale, comparative dataset makes it possible to draw conclusions that generalise across countries, issues, and time. Furthermore, the dataset makes it possible to extend our knowledge of how and when problem indicators generate political attention. In particular, we theorise and study empirically if negative information from a problem indicator about its level generates more political attention than a change in the information. We also study how the relative performance compared to other countries affects the parliamentary attention to the given problem and explore if negative information from a problem indicator matters more than positive information. Such questions on the effect of problem indicators on political attention have been impossible to address before because of a very limited number of countries and issues to compare in previous research (e.g. Vliegenthart and Mena Montes Reference Vliegenthart and Mena Montes2014; Van Noije et al. Reference Van Noije, Kleinnijenhuis and Oegema2008; Soroka Reference Soroka2002; Valenzuela and Arriagada Reference Valenzuela and Arriagada2011).
An important pathway of democratic responsiveness is to put worsening societal problems on the agenda (Manin et al. Reference Manin, Przeworski, Stokes, Przeworski, Stokes and Manin1999; Mansbridge Reference Mansbridge2003, 516). While, from a neutral, nonpolitical position, we cannot claim how a given problem should be tackled, we can claim that our elected representatives should attend to and deliberate worsening societal problems. Studying the agenda-setting effects of problem indicators is one way to assess this important aspect of politics. Indicators provide numerical simplifications of complex social phenomena and, as argued by Davis et al. (Reference Davis, Fisher, Kingsbury and Merry2012), bring transparent and impartial information that often also has a great deal of scientific authority. Thus, even though indicators will never provide a full picture of a given problem, they often carry important information about how policy problems develop (Kelley and Simmons Reference Kelley and Simmons2015), so when studying responsiveness to problem indicators, we also learn about political responsiveness to policy problems.
Relatively little scholarly attention has been directed at the relationship between problem indicators and political attention compared to the massive interest in, for instance, the relationship between media coverage and political attention (Vliegenthart et al. Reference Vliegenthart, Walgrave, Baumgartner, Bevan, Breunig, Brouard, Bonafont, Grossman, Jennings, Mortensen, Palau, Sciarini and Tresch2016; Green-Pedersen and Stubager Reference Green-Pedersen and Stubager2010) or public opinion and political attention (Jennings and John Reference Jennings and John2009; Jones et al. Reference Jones, Larsen-Price and Wilkerson2009). The interest in the role of the media or of public saliency is understandable, but in this study, we focus on the effect of problem indicators on political attention. Of course, media – and interest groups, think tanks, policy entrepreneurs, the public opinion, and so on – play a role in directing attention to certain problem indicators, but if one is interested in the effect of problem indicators, the natural place to begin is to look at the direct relationship between problem indicators and the attention of politicians. Then, in later research, we may begin to disentangle the details of why and how politicians draw attention to problem indicators (see also Alexandrova et al. Reference Alexandrova, Rasmussen and Toshkov2016). We return to these prospects in the concluding section of the article.
Problem indicators and the policy agenda
Problem indicators are powerful constructs in politics that are attractive from the position of political parties because they provide simple and scientific information about problems that work as the perfect ammunition for setting the policy agenda. This means that they are likely to have important consequences for political attention. Furthermore, although many problem indicators have some kind of political bias, this political bias is often lost or forgotten over time. As Mügge (Reference Mügge2016, 412) argues, “indicators specify what counts as, for example, growth. When policy-makers and citizens accept these particular constructions of macroeconomic concepts, the ideas that inform them solidify power relations by legitimizing some courses of action and delegitimizing others.” When politicians or the media cite indicators such as unemployment rates or crime rates, these numbers are rarely questioned and are used without disclaimers: “Unemployment becomes an objective property of people, not a politically loaded ascription” (Kingdon Reference Kingdon1984, 412). In a similar vein, Kingdon (Reference Kingdon1984, 93) argued that “the countable problem sometimes acquires a power of its own that is unmatched by problems that are less countable.” Or, as one of Kingdon’s interviewees stated, “it helps for a problem to be countable.” This is not to say that problems that have no well-established indicators cannot attract substantial political attention. Our argument is more modest, namely that the information provided by problem indicators systematically affects the policy agenda.
It follows from this that our research endeavour deviates from research on “problem definition” (Cobb and Elder Reference Cobb and Elder1983; Rochefort and Cobb Reference Rochefort and Cobb1994). Problem definition scholars study the political process in which politicians compete to decide the definition of a problem – that is, how politicians and the public should interpret a problem indicator. The literature on problem definition is relevant in the sense that we share an interest in how facts become political. That said, there is a clear difference between our inquiry and the focus of problem definition research. We study indicators such as the unemployment rate from authorities such as the OECD, and these indicators are therefore rarely questioned in terms of validity or reliability. There is simply little room for a problem definition conflict. Politicians and the public take them to be evidence that politicians need to address if an indicator conveys information about a problem.
Only few empirical studies have looked at how problem indicators affect the policy agenda (see e.g. Liu et al. Reference Liu, Lindquist and Vedlitz2009; Jenner Reference Jenner2012; Van Noije et al. Reference Van Noije, Kleinnijenhuis and Oegema2008; Vliegenthart and Mena Montes Reference Vliegenthart and Mena Montes2014; Mortensen et al. Reference Mortensen, Loftis and Seeberg2022). Those policy agenda studies that do take problem indicators into account tend to find some effect, although it varies across issues, countries, and time (Jones and Baumgartner Reference Jones and Baumgartner2005; Vliegenthart and Mena Montes Reference Vliegenthart and Mena Montes2014). One possible explanation for the somewhat mixed findings is that scholars have theorised little about what kind of information politicians consider relevant to devote attention to. Moreover, empirically it varies whether scholars focus on absolute levels (Jones and Baumgartner Reference Jones and Baumgartner2005; Van Noije et al. Reference Van Noije, Kleinnijenhuis and Oegema2008; Jenner Reference Jenner2012), changes (Soroka Reference Soroka2002; Delshad Reference Delshad2012), or relative changes (Seeberg Reference Seeberg2017) of indicators. As argued below, this is unfortunate because each focus has different implications for how parties or politicians to respond to problem indicators. Moreover, investigating what kind of information matters to political attention is not just important because of a theoretical research deficit. If politicians mostly focus on changes in problem indicators but systematically disregard levels – that is, if a high but unchanging unemployment rate fails to attract attention – it would suggest that problems with severe impacts on the welfare of citizens fail to attract attention at the expense of other, less severe but changing problems. We refer to “the development over time” to describe changes in a problem indicator and “the (absolute) severity of the problem” to describe the level in a problem indicator.
To better understand how problem indicators affect the policy agenda, we make the uncontroversial starting assumption that political parties care about votes and re-election. It then follows that societal problems and their indicators must be centre stage, since research suggests that parties must be responsive to problems in order to win elections. This is evident from the economic voting literature, which has shown that economic performance is a strong predictor of election outcomes (Abramowitz Reference Abramowitz1988; Lewis-Beck and Paldam Reference Lewis-Beck and Paldam2000; Lewis-Beck and Stegmaier Reference Lewis-Beck, Stegmaier, Dalton and Klingemann2007; Marsh and Tilley Reference Marsh and Tilley2009). Voters tend to reward positive economic performance and sanction negative performance. This kind of economic voting behaviour is a well-established finding identified in many different countries and elections (Lewis-Beck and Paldam Reference Lewis-Beck and Paldam2000). Moreover, recent research suggests that the connection between problems and the re-election chances of parties is not only limited to economic voting. Seeberg (Reference Seeberg2017, Reference Seeberg2018) shows that problem indicators related to issues such as health care, crime, and immigration affect voters’ competency evaluations of government parties on those issues. In sum, there is strong evidence that parties’ electoral prospects depend on the development of problem indicators, creating a strong incentive for parties to pay attention to the information provided by these indicators.
Absolute severity, development, and benchmarks
Building on these basic assumptions about political parties, we expect political parties and the actors within them to respond to comparisons of performances, both over time and across comparable political systems, to assess the overall severity of problems. More particularly, parties are likely to make three kinds of comparisons of information in order to decide whether to pay attention to the indicator. First, it is likely to matter whether a problem indicator is worrisome compared to its historic (i.e. previous) levels, as parties come under pressure to say and do something when the absolute severity in a problem indicator (i.e. the level) is worrying. For instance, politicians will consider an inflation rate at a historically high level, say 10 per cent, more problematic than if it is two per cent. In the former case, prices rise much faster, which is likely to generate widespread dissatisfaction amongst voters and demands for action. Similarly, politicians are likely to view a large number of burglaries or assaults as more worrisome than if there are few. This is our first hypothesis.
Hypothesis 1: An indicator is more likely to generate attention the more severe a problem is (level of the indicator).
However, our contention is that it can be difficult to evaluate whether a performance is good or bad solely by looking at national numbers. One needs someone to compare oneself against. For instance, a country may have a historically low unemployment rate, but if neighbouring countries fare much better, the national numbers may seem less impressive. At the same time, even very problematic numbers may not look as bad if the international context is much worse. Therefore, a country’s performance relative to other countries is a second type of information that is likely to affect the assessment of problems (Kayser and Peress Reference Kayser and Peress2012; Hansen et al. Reference Hansen, Olsen and Bech2015; Traber et al. Reference Traber, Schoonvelde and Schumacher2019). If the numbers look bad in comparison to other countries that are normally used as benchmarks (“similar others”) – the absolute severity is reinforced – it is likely to be a hot topic on the policy agenda. For instance, research suggests that one explanation for why the student PISA tests generated so much attention in Denmark despite an average performance was that Denmark was outperformed by some of its closest neighbours, namely Sweden and Finland (Breakspear Reference Breakspear2012). This is our second hypothesis.
Hypothesis 2: The worse a country performs on an indicator relative to other countries, the more attention it generates (benchmarking).
The individual-level mechanism underlying this behaviour has been hinted at by social comparison theory, which suggests that people have an urge to compare their abilities with others (Festinger Reference Festinger1954). This tendency to benchmark has been reinforced by the fact that, in an increasingly globalised world, there are more and more international problem indicators that enable comparable scoring across countries.
Based on this logic in social comparison theory, a third type of information that is likely to affect political attention is over time changes in the problem indicator score. Building on literature that has looked at how the media and voters respond to problem indicators, we make the argument that political parties have an incentive to focus on the development over time – the current numbers compared to the previous year, quarter, or month – in a problem indicator. For instance, research shows that the media tend to tune in on changes in problem indicators (Soroka et al. Reference Soroka, Stecula and Wlezien2015) because novelty is a key criterion of newsworthiness. Moreover, the economic voting literature has shown that voters tend to cast their votes depending on how the economy develops (Abramowitz Reference Abramowitz1988; Bartels and Zaller Reference Bartels and Zaller2001). At the individual level, social psychology scholars explain this behaviour by referring to the fact that people are averse to change because of the uncertainty that comes with it (Bailey and Raelin Reference Bailey and Raelin2015). Considering that parties have to accommodate the pressure to attend to changes in problems from the public and that politicians within parties are themselves constrained by such aversion to change, it seems likely that changes in problem indicators will generate political attention. This is our third hypothesis.
Hypothesis 3: The worse a development in an indicator is, the more attention it generates (change in the indicator).
Finally, the policy agenda may be more responsive to negative than to positive information (i.e. negative and positive changes and performances relative to other countries). Psychological literature suggests that there may be an asymmetrical response to negative and positive information. According to work on the negativity bias, negative events stand out as more salient, potent, and efficacious than positive events (Rozin and Royzman Reference Rozin and Royzman2001). Evidence of a negativity bias has also been found in studies of public opinion (Nannestad and Paldam Reference Nannestad and Paldam1997) and the media (Soroka Reference Soroka2006), which have shown a greater importance of negative information to vote choice and media attention. Yet, whether the negativity bias also extends to policy agenda setting is something that has not previously been studied. This leads to our final set of hypotheses.
Hypothesis 4: Negative changes in an indicator generate attention, but positive changes are unrelated to attention.
Hypothesis 5: Negative deviations from other countries on an indicator generate attention, but positive deviations are unrelated to attention.
We have no a priori argument for which type of comparison (Hypotheses 1–5) is most important.
Data and research design
We examine our hypotheses using a new comparative dataset on political attention to 17 different issues that all have well-established problem indicators. The list spans a wide array of issue areas and includes indicators related to unemployment, inflation, healthcare facilities, water pollution, global warming, immigration, traffic accidents, and so on. The data cover seven countries over six decades from 1960 to 2015, although the periods vary from country to country depending on data availability. The countries included are Australia (1980–2013), France (1988–2007), Belgium (1988–2010), Denmark (1960–2012), Germany (1978–2013), Italy (1996–2014), and Spain (1977–2015). These country-specific periods vary across issues according to the availability of indicators’ accessibility over time. The online supporting information provides a full overview of the years covered across the different indicators and countries.
The selected countries represent a variety of different western political systems, including parliamentary systems with few and many parties. Furthermore, Australia and Spain have single-party governments, whereas Belgium, Germany, France, and Italy have majority governments consisting of several parties. Denmark most often has multi-party minority governments. On this background, the results should generalise to a broad range of other western parliamentary systems that share these institutional characteristics. Moreover, this variation is important because it assures us that our results do not only apply in certain types of parliaments. Furthermore, the group of countries are all OECD countries, making the detection of possible benchmark effects more likely, as elaborated below.
Measuring the policy agenda
In this study, we use parliamentary questions as a measure of the policy agenda. Questions are a nonlegislative parliamentary activity that is institutionalised in most parliaments (Borghetto and Chaques-Bonafont Reference Borghetto, Chaqués-Bonafont, Baumgartner, Breunig and Grossman2019). They are asked by individual MPs, who can raise questions about any issue that they consider relevant. Although formal rules vary from country to country, raising a question is a quick and relatively easy process in contrast to other parliamentary activities. Therefore, we expect that the questions will provide some of the first signs of political activity when politicians encounter new worrisome information from indicators.
Previous studies demonstrate that parliamentary questioning is an important tool that politicians, parties, or party groups use to influence the policy agenda (Vliegenthart et al. Reference Vliegenthart, Walgrave and Zicha2013; Green-Pedersen and Mortensen Reference Green-Pedersen and Mortensen2010). In some countries, such as Denmark, the questions are primarily used by MPs from opposition parties. However, in Belgium and Italy, MPs from government parties ask almost the same number of questions as MPs from opposition parties (Vliegenthart et al. Reference Vliegenthart, Walgrave, Baumgartner, Bevan, Breunig, Brouard, Bonafont, Grossman, Jennings, Mortensen, Palau, Sciarini and Tresch2016; Borghetto and Chaques-Bonafont Reference Borghetto, Chaqués-Bonafont, Baumgartner, Breunig and Grossman2019). In Spain, the difference between government and opposition parties varies over time depending on varying formal rules governing the questioning. Although the use of questions varies across countries, it is an institution that is found in all of the countries included in this study, and it is an often-used measure of the policy agenda (Soroka Reference Soroka2002; Vliegenthart et al. Reference Vliegenthart, Walgrave, Baumgartner, Bevan, Breunig, Brouard, Bonafont, Grossman, Jennings, Mortensen, Palau, Sciarini and Tresch2016). Furthermore, as shown in the empirical analysis, our main results can be reproduced when using only the countries where MPs from government parties frequently ask questions.
Issue selection
To identify problem attention in the parliamentary questions, we rely on the Comparative Agenda Project’s (CAP) codebook. It includes detailed coding of political attention to 21 major issue categories, which are further divided into 213 subcategories (Bevan Reference Bevan, Baumgartner, Breunig and Grossman2019). The CAP codebook offers the most detailed issue coding of policy agendas available and provides a great opportunity to examine political attention to issues where a single indicator can reasonably be expected to represent the problem development, such as traffic accidents, unemployment, or waste production. This level of detail is a great advantage of our study since it allows us to make a more precise, and therefore stronger, test of our argument. To take an example, a change in inflation surely influences economic attention. Yet, economic attention is concerned with many other parts of the economy, too (unemployment, export, industries, competitiveness, wages, etc.), and therefore, this most likely leaves little indication of an impact of inflation in itself on the broader issue of the economy. If we want to know to what extent politicians attend more to inflation when inflation changes, we need to measure attention to inflation (as we do; see Table 1) rather than attention to the economy as such. Furthermore, it has been verified that the use of the CAP codebook has been applied consistently across the country members of the CAP project (Bevan Reference Bevan, Baumgartner, Breunig and Grossman2019).
Problem indicators and issue attention categories
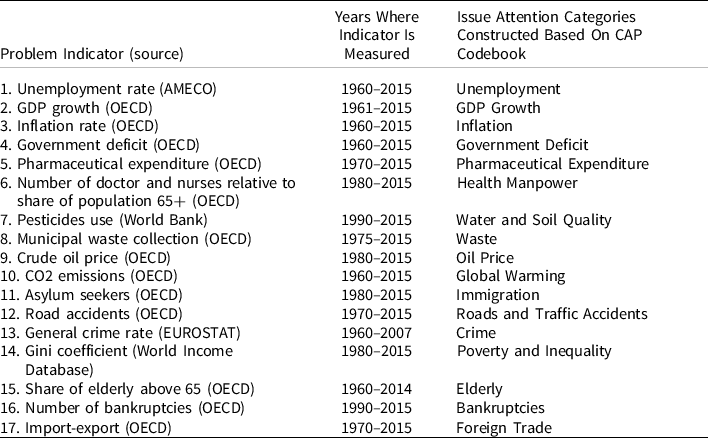
Note: A full list of issue attention categories and the CAP subcategories to which each of these is matched is provided in the supporting information.
Our first step was to identify the issue categories in the CAP master codebook that could be matched with a single indicator of the problem development on the issue domain. In addition, the indicators had to be available across the seven countries and over time.Footnote 1 Some CAP issues, such as “709 Species and forest,” have well-established indicators (e.g. IUCN’s Red List of endangered species) but could not be included, because they are only available for a very limited number of years or countries. In addition, the indicator had to be attributable to one specific country. For instance, for some issues, such as “710 Protection of coastal wetlands and quality of marine waters,” it is difficult to say which country is responsible – in this example, for polluting shared waters. Furthermore, a few CAP issue categories by definition relate to many indicators. One example is “331: Disease prevention,” which encompasses attention to several potential indicators of diseases, such as cancer, diabetes, and obesity. Not including these indicators does not mean that they are not valid or important. However, the issues included were those where CAP issue categories could be matched with a single problem indicator available across countries and time, allowing for a time-series cross-sectional study.
Table 1 provides an overview of problem indicators and the attention issue categories to which each of the indicators is matched.Footnote 2 The list of included issues provides important variation in problem characteristics. It includes indicators related to problems that are both obtrusive, meaning that most citizens experience them first-hand on a regular basis, such as inflation and unemployment, and unobtrusive, meaning that they are more remote and distant from the everyday lives of most citizens, such as immigration (Soroka Reference Soroka2002). This distinction matters to the analysis because politicians might mainly respond to obtrusive issues that affect citizens more immediately. Furthermore, issues such as unemployment, climate change, and social inequality are typically associated with left-of-centre parties, while immigration and crime belong to right-of-centre parties (Seeberg Reference Seeberg2016). Finally, health manpower and unemployment are valence issues, whereas immigration and social inequality are positional issues (Stokes Reference Stokes1963; Pardos-Prado Reference Pardos-Prado2012). The broad range of issues with different characteristics covered enables us to investigate whether the results are generalisable to most types of problem indicators, and we look into this in the last section of the empirical analysis.
The dependent and independent variables
As a measure of the dependent variable, we calculate for each issue and in each country the annual number of parliamentary questions asked about that issue as a percentage of the total number of parliamentary questions asked across all issues. Using percentages instead of the absolute number of questions increases comparability across years and countries given that the absolute number of questions that parties can and do ask varies across countries.Footnote 3 Furthermore, it also adheres to the key assumption underlying all agenda research, namely that attention is scarce and that issues therefore receive attention at the expense of other issues. The unit of analysis is each year on each of the 17 issues in each of the seven countries. Summarising across years, instead of, for instance, months or quarters, reflects that most problem indicators are only available yearly.Footnote 4
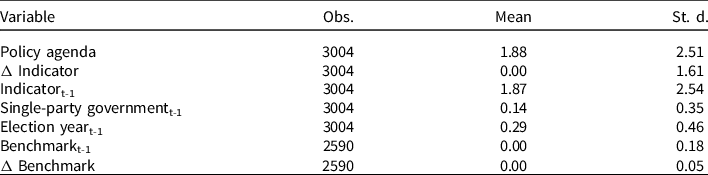
To ensure comparability across countries and over time, all of the indicators were collected from international organisations such as the OECD or the World Bank (details on the data sources in Table 1). The problem indicators have different scales, with some measured in the third decimal and others in 1000s. This poses a challenge for the cross-issue analysis. We therefore rescale each of them to a 0–1 scale so that they vary from the most positive level (0) in any one of the countries to the most negative level (+1) (see descriptive statistics in Table 2). We rescale each indicator across all countries instead of rescaling each indicator within each country in order to maintain comparability across countries when rescaling and to avoid inflating indicators that vary little in some countries.Footnote 5
Summary statistics
To measure how a country performs relative to other countries, we calculate each country’s deviation from the other countries’ mean in a year. We only include years in which data are available for all countries that have data on the specific indicator. We expect that it is realistic to assume that the countries in the data – especially the six West European countries – perform some kind of comparison with each other since the list of countries includes much of the core of the EU and all of them are western industrialised countries. Australia is perhaps the odd one out in the Southern hemisphere. Yet, including Australia should not be a concern to our analysis since it should only make it harder to confirm our hypothesis. Reassuringly for our conclusions, excluding Australia from our analysis does not change our conclusions. Furthermore, analysing Australia only does also not change our findings (see analysis for more information).
Ideally, a larger number of countries would serve as the comparison group, such as all the EU countries and the United States (US) (Traber et al. Reference Traber, Schoonvelde and Schumacher2019). However, data on many of the indicators are unavailable in several EU countries and the US, and in many countries, we do not find consistent CAP codings of the parliamentary questions. We therefore opted to work with the seven countries, which, as argued above, are closely integrated western democracies that should compare themselves to each other if our benchmark argument is valid.
Finally, we include two important control variables in the empirical analysis. First, government strength may matter to the influence of problems on parliamentary questions because opposition parties may have strong incentives to highlight unhandled problems when the clarity of responsibility is high. Hence, a strong government (i.e. with a solid majority) might generate more questions from the opposition based on the argument that the opposition parties have a clearer outsider status in that case. At the same time, strong governments can more easily respond to problems when they hold a majority because they do not depend on the agreement from coalition partners (Seeberg Reference Seeberg2017). This might invite more questions from government MPs who want a problem solved. To control for government strength, we include a dummy variable that takes the value 1 if a country has a single-party majority government.Footnote 6
Second, to account for variation in problem responsiveness over the election cycle, we include a dummy variable that takes the value 1 in election years. Recent research shows that parties are more responsive to salient problems in periods distant from an election (Pardos-Prado and Sagarzazu Reference Pardos-Prado and Sagarzazu2019). Closer to an election, parties become occupied with responding and outmanoeuvring each other while forgetting all about salient problems.
Modelling strategy
We test our argument by estimating an error correction model (ECM) in which the dependent variable is first-differenced and a lagged dependent variable is included on the right-hand side of the equation. De Boef and Keele (Reference De Boef and Keele2008) recommend that political scientists analysing data on several countries and long periods should employ general models in which the dynamic structure of the data is not specified beforehand. ECMs are suitable for both stationary and integrated data (De Boef and Keele Reference De Boef and Keele2008, 199). Moreover, this dynamic estimation adheres to state-of-the-art research in the field (e.g. Bevan et al. Reference Bevan, Jennings and Pickup2018; Jennings and John Reference Jennings and John2009). In the ECM, each explanatory variable is included with both its first-differenced and lagged value:
 $$\Delta {\rm{AGEND}}{{\rm{A}}_{\rm{t}}} = {a_0} + {a_1}{\rm{AGEND}}{{\rm{A}}_{{\rm{t}} - 1}}$$
 $$ + {\rm{ }}{\beta _0}\Delta {\rm{INDICATO}}{{\rm{R}}_{\rm{t}}} + {\beta _1}{\rm{INDICATO}}{{\rm{R}}_{\rm{t}}}_{ - 1}$$
 $$ + {\beta _2}\Delta {\rm{BENCHMARK}} + {\beta _3}{\rm{BENCHMAR}}{{\rm{K}}_{{\rm{t}} - 1}}$$
 $$ + {\beta _4}\Delta {\rm{CONTROLS}} + {\beta _5}{\rm{CONTROL}}{{\rm{S}}_{{\rm{t}} - 1}} + \varepsilon $$
Where we expect that β0ΔINDICATORt > 0 (Hypothesis 3 on the problem development), β1INDICATORt−1 > 0 (Hypothesis 1 on the absolute severity of the problem), and β3BENCHMARKt−1 > 0 (Hypothesis 2 on comparison to other countries). To test whether the policy agenda effects are driven by negative changes in the problem indicators, we interact the first differences of each indicator with a dummy variable that takes the value 0 for years with positive changes in a problem indicator and 1 for years with negative changes. Similarly, we interact the benchmark variable with a dummy variable with the value 1 in years where a country performs worse than the others.
To isolate the within-country variation from the cross-sectional variation, we estimate the ECM using fixed effects with panels across countries and issues. Fixed effects are appropriate to control for any time-invariant omitted variables that vary across countries and issues. This is especially important in this case because countries have different institutions and long-standing political traditions that may influence how much political attention issues attract. Issues such as crime or immigration may attract more attention in one country than another for many other reasons than how indicators develop. Similarly, an issue such as unemployment tends to receive more attention than the budget deficit in a country for other reasons than how the unemployment rate and budget deficit develop. Controlling for these differences across countries and issues helps to isolate the conditional effect of indicators on the policy agenda from other potential causes. Furthermore, a Hausman test confirms that a fixed effects specification is most suitable in this case (p-value < 0.000).
The use of time-series cross-sectional data also raises concerns of autocorrelation as well as panel heteroscedasticity. To uncover the presence of these problems, a series of statistical testing have been conducted (see supporting information for details). The tests show that these problems are present. To deal with the issue of panel heteroscedasticity, the analyses follow the recommendation of Beck and Katz (Reference Beck and Katz1995, Reference Beck and Katz2011) and use panel robust standard errors. Autocorrelation is handled by the inclusion of a lagged dependent variable (Beck and Katz Reference Beck and Katz1995).
Empirical findings
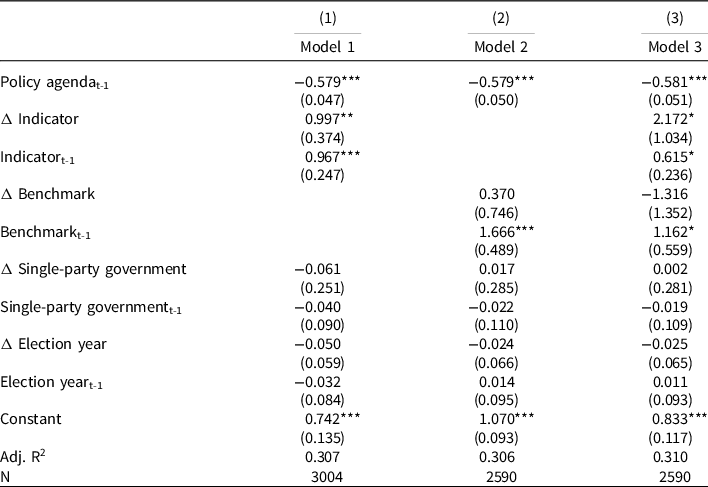
Table 3 presents the results from the ECM. Model 1 in Table 3 regresses changes in the policy agenda on lagged levels of the policy agenda, current changes, and lagged levels of the indicators. First, the results in Model 1 show that the policy agenda responds to changes in the information provided by the problem indicators. A one-unit worsening from the least worrisome level (0) to the most worrisome (1) leads to approximately one per cent more attention in the current year. Model 1 also confirms that the policy agenda relates to the lagged levels of indicators. The results thus provide evidence in support of both Hypotheses 1 and 3. In fact, the policy agenda is equally responsive to changes and to levels. The coefficient for lagged levels and changes are almost identical in size and both obtain statistical significance at the p < 0.01 level.Footnote 7
The influence of indicators on the parliamentary questioning
Cluster robust standard errors in parentheses. +p < 0.10, * p < 0.05, **p < 0.01, ***p < 0.001.
Model 2 in Table 3 introduces the benchmark variable. Recall that the variable attains a positive value if a country performs worse than the other countries and negative if it is doing better. Therefore, the sign of the coefficient should be positive to support Hypothesis 2. The results confirm the expectation that countries that are outperformed by other countries devote more attention to that problem indicator. Furthermore, this effect is driven by the lagged level of the benchmark and not by the current changes in the benchmark indicator. Thus, politicians seem to use indicators to compare the level of a problem with other countries, but they are unlikely to respond to how that difference has developed since the year before. The latter would probably also be a more complex task than just comparing the levels.
Model 3 in Table 3 includes both the national and the benchmark indicators. The coefficients in Model 3 have to be interpreted with some caution because of correlation between the first-differenced and lagged levels of the national indicator and benchmark variables (corr: 0.68–0.71), but the results nevertheless suggest that both national indicators and benchmarks have a policy agenda effect independently of each other. All the indicator variables that were statistically significant in Models 1 and 2 remain positive and statistically significant in Model 3 at the <0.05 level. In sum, this is strong evidence that politicians also benchmark with other countries when they evaluate the severity of a problem. This supports Hypothesis 2.
To ease the interpretation of these results, we provide a few examples of the effect of indicators on the parliamentary questioning. For instance, a one-person increase in the number of asylum seekers per 10,000 citizens leads to around 0.02 percentage point more questions. Because the standard deviation of the number of asylum seekers per 10,000 citizens is 8.1, a typical effect equals to approximately 0.15 percentage point more attention (differences due to rounding). The effect of a typical deviation from the group mean (the benchmark) equals to 0.28 percentage point more attention. With regard to the unemployment rate, a 1-percentage point increase in the unemployment rate equals to 0.04 percentage point more questions related to fighting unemployment. The standard deviation of the unemployment rate is 4.57 per cent, so a typical effect amounts to 0.18 percentage point more attention. The effect of a typical deviation from the group mean equals to 0.30 percentage point more attention. Although these effects may appear relatively small, they are in fact sizeable considering that the average level of attention to each issue in data is 1.88 per cent.
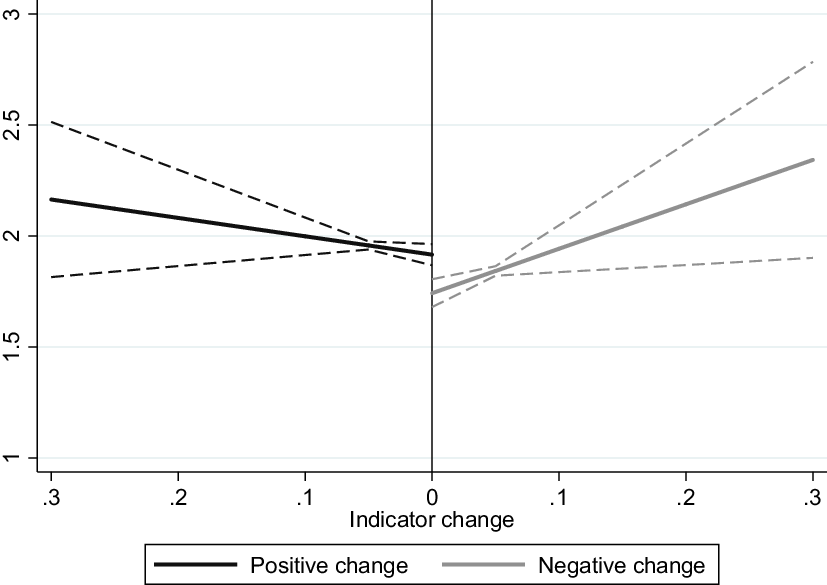
Hypotheses 4 and 5 both stated that the policy agenda is more responsive to negative information than positive information. To test whether the policy agenda effects are driven by negative changes in the problem indicators, we interact the first differences of each indicator with a dummy variable that takes the value 0 for years with positive changes in a problem indicator and 1 for years with negative changes. To illustrate the results, Figure 1 plots the predicted levels of attention for negative (right-hand side) and positive (left-hand side) changes. If negative changes have a stronger effect on the policy agenda than positive changes, the line on the right-hand side of Figure 1 should have a steeper slope than the left-hand side. If, as expected, positive changes are unrelated to the policy agenda, the slope on the left-hand side should be flat and statistically insignificant. The results provide strong support of Hypothesis 4. In fact, whereas the slope is steep and statistically significant for negative changes (b = 2.602, p = 0.003), there is no relationship between positive changes and the policy agenda (b = −0.036, p = 0.622). The 2.964 difference between the slopes is statistically significant at the <0.05 level. Thus, the policy agenda is responsive to changes in indicators, but this is driven by a strong responsiveness to negative changes. However, results also show that there is no variation in the effects of negative and positive deviations from the other countries (see the supporting information for results). Thereby, the analyses provide no empirical support of Hypothesis 5.
The influence of negative and positive changes in indicators.
Notes: The regression table used to create Figure 1 can be found in the supporting information.
In the supporting information, we present a series of further robustness tests of the main results reported in Table 3. First, the article focuses on parliamentary questions of which opposition parties ask the majority, and since opposition parties may have a stronger incentive to politicise poor numbers than government parties, we replicate Table 3 only with the countries where government actors frequently ask questions (Belgium, Italy, and Spain).Footnote 8
Second, because Australia may not compare itself to European countries as much as it compares itself with the US or nearby countries such as New Zealand, we replicate Table 3 only with Australia. The results remain the same.
Third, we test whether the results are robust to an alternative model specification. More specifically, we check if the error correction modelling with a lagged dependent variable influences the results by rerunning the analyses using a model that, without a lagged dependent variable, predicts current levels of attention with lagged levels and current changes of the indicator and benchmark variables. This alternative model estimation does not change the conclusions derived based on Table 3.
Fourth, to test whether the results are robust to an alternative approach to ensure comparability across the indicators, we re-estimate Table 3 taking the natural log of each indicator’s original scale. Across the models, the main conclusions remain substantially unchanged. Hence, arriving at similar results with an alternative operationalisation of the independent variables is reassuring for the conclusions that we draw.
Fifth, we performed a Jack-knife analysis with respect to the main analysis in Table 3 to check whether the results are robust to the exclusion of certain issues or countries. Although coefficients in a few cases fall just outside conventional levels of statistical significance (no more than one would expect by chance), the main results remain substantially the same across these analysis.
Finally, we examine variation in indicator responsiveness across six different problem characteristics that the literature has hinted at as important moderators of the relationship between problem indicators and the policy agenda (e.g. Van Noije et al. Reference Van Noije, Kleinnijenhuis and Oegema2008; Green-Pedersen and Jensen Reference Green-Pedersen and Jensen2019; Soroka Reference Soroka2002). Table 4 provides an overview of the problem characteristics explored in this additional robustness analysis. In the supporting information, we introduce the six problem characteristics and document the groupings of the 17 problem indicators. Having identified each indicator’s six types of problem characteristics, we interact the lagged levels and first-differenced predictor variables with dummies for each of the six problem characteristics. The dummies take the value 1 on indicators on which we should expect increased agenda responsiveness (0 otherwise). Thus, we use the dummy for each characteristic to split the indicators into two groups. If the positive relationship between indicators and the policy agenda is limited to certain types of special problems, the coefficients should be small and statistically insignificant for indicators that do not possess each characteristic (0) and positive and statistically significant for those that do (1).
Problems characteristics
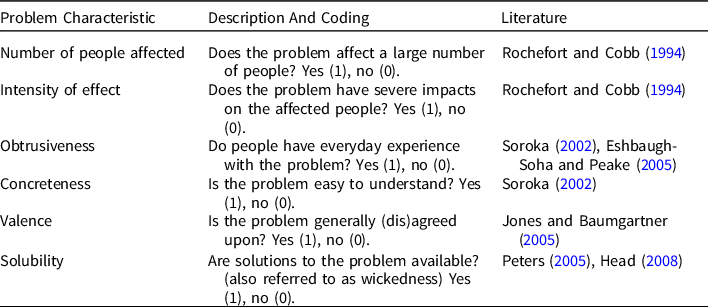
Note: Each problem characteristic variable is a dummy that takes the value 1 if the characteristic is present (e.g. obtrusiveness), otherwise 0 (see column 2).
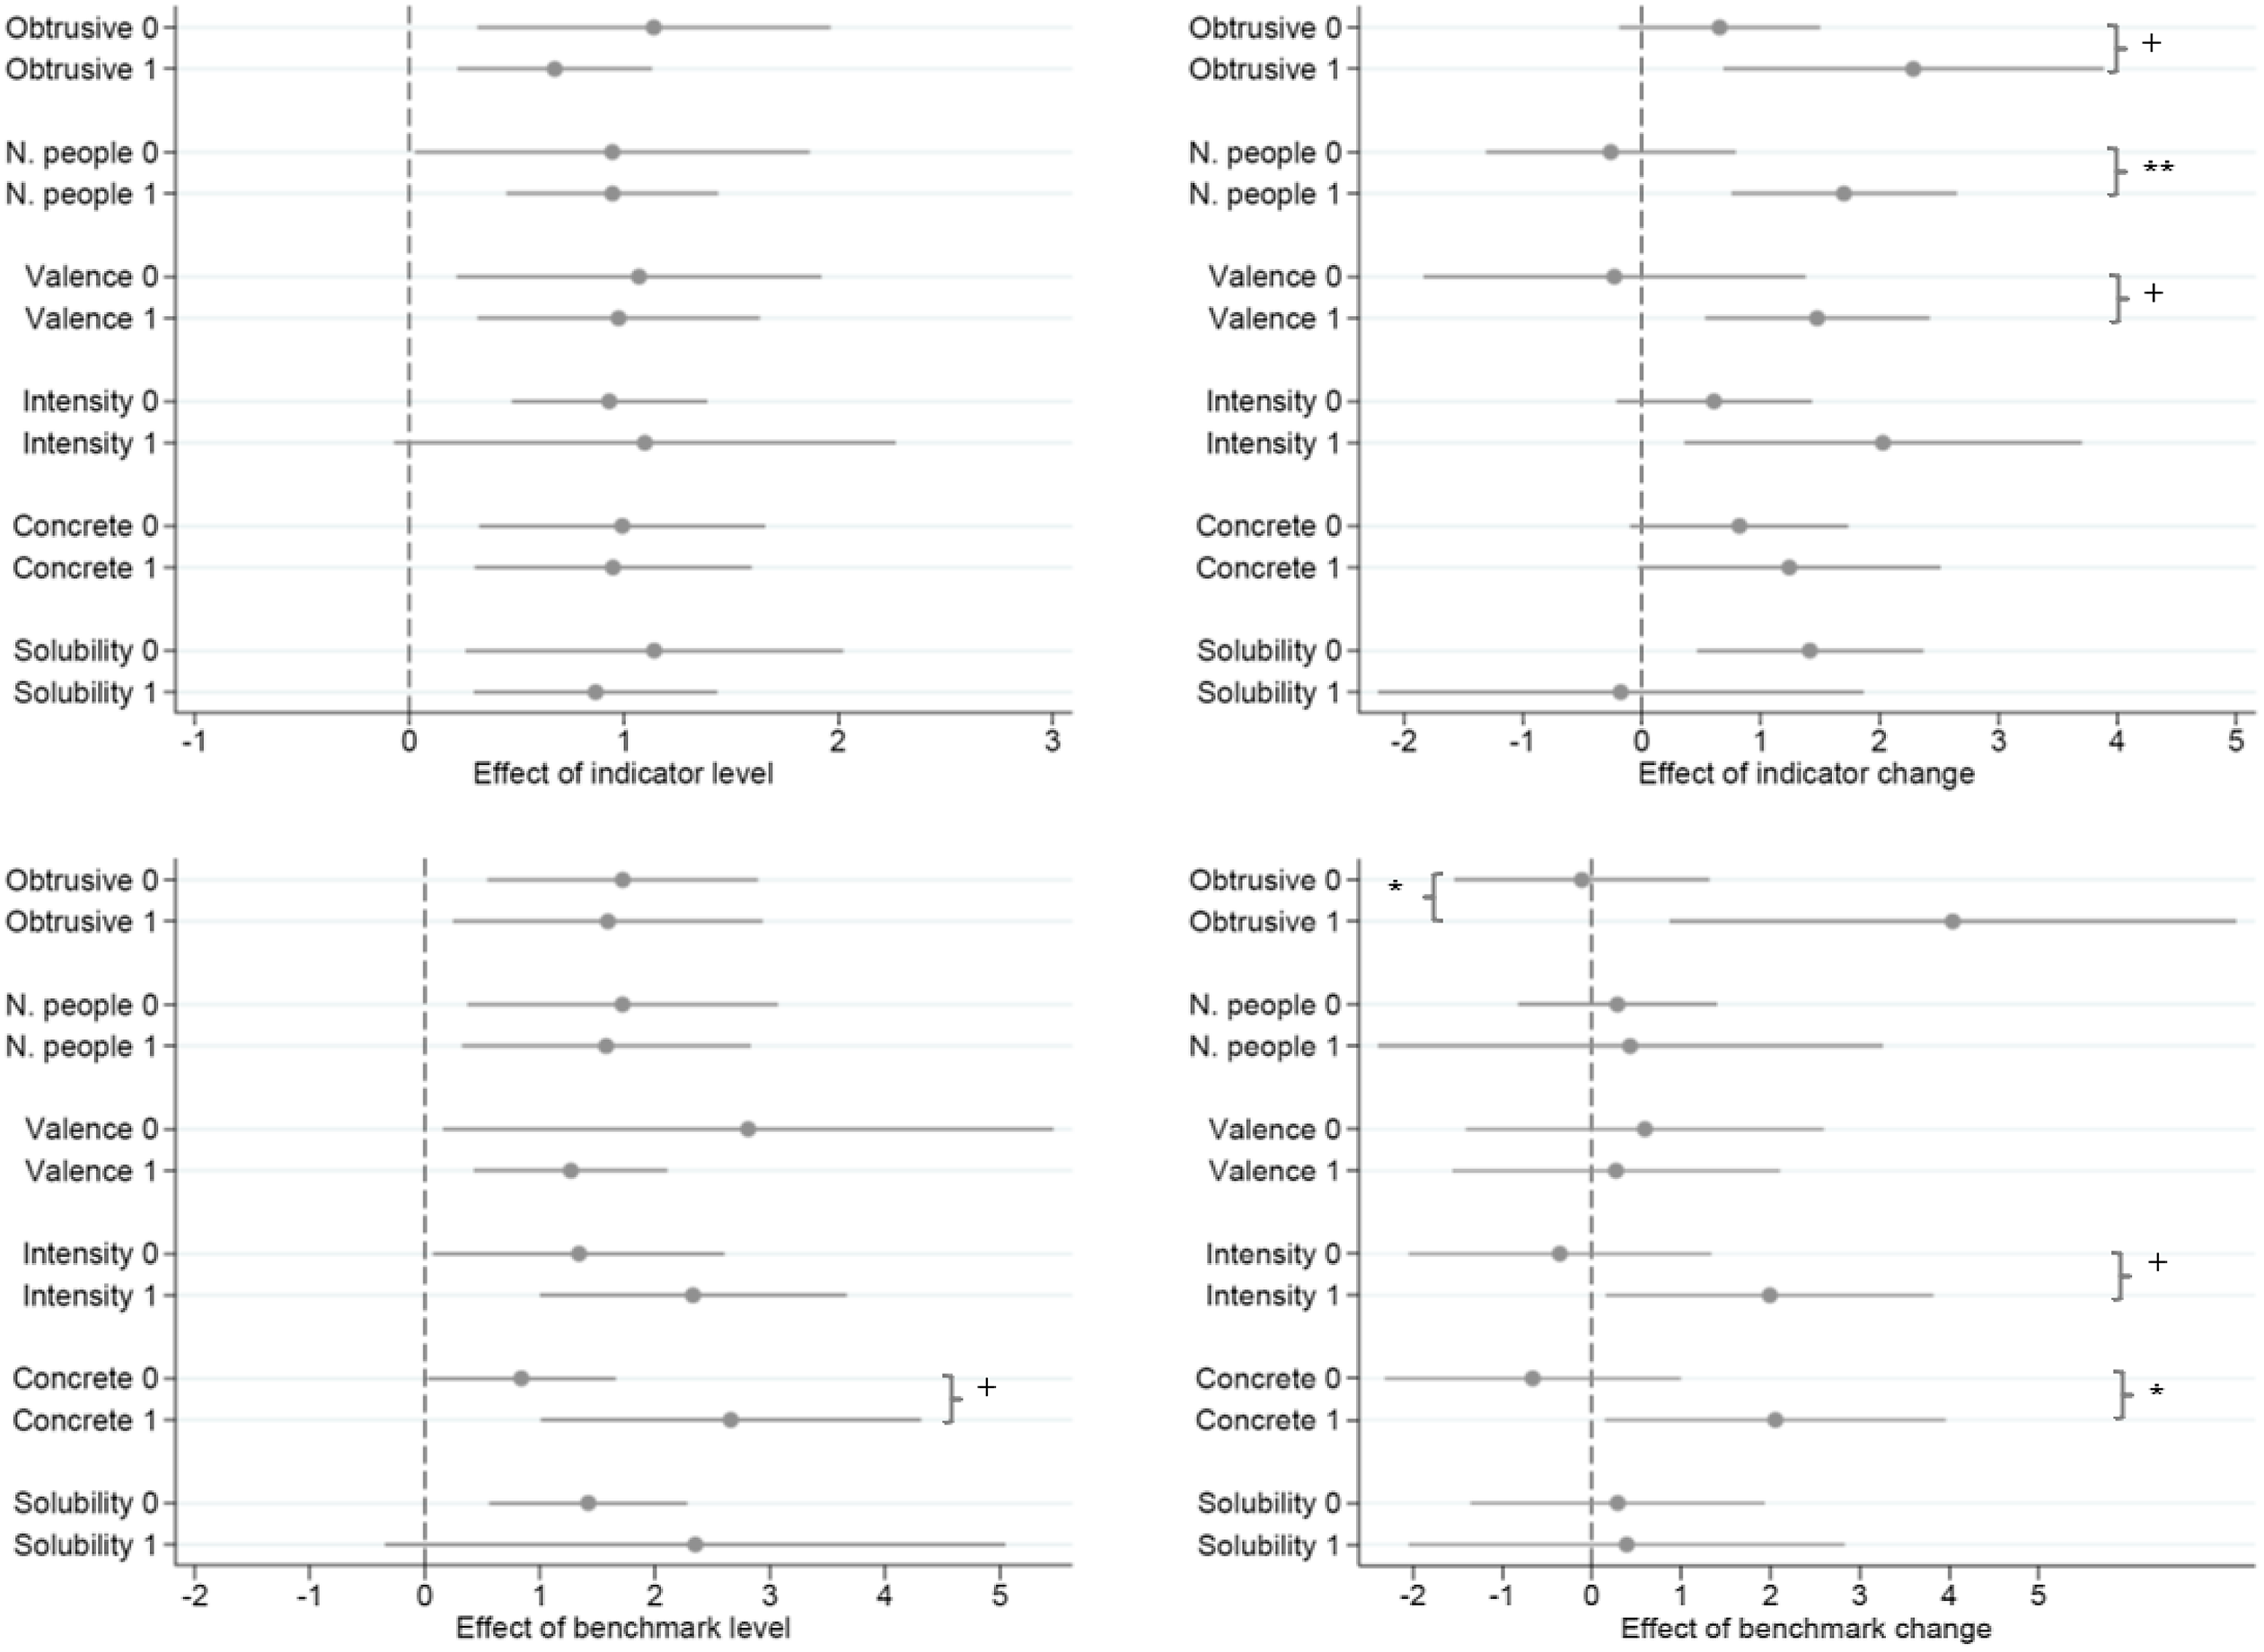
Figure 2 shows the coefficient estimates from a series of ECMs. Regarding levels, the results suggest that politicians devote some attention to the indicators regardless of the character of the problem at stake. Although there is variation for some of the characteristics, the lagged level of indicators and the benchmark have a statistically significant effect at the <0.10 level for all types of problems. In comparison, the character of problems matters more to politicians’ responsiveness to changes in problem indicators. Although the coefficient for current changes in the indicators is statistically significant for indicators that measure problems that are obtrusive, agreed upon, affect a large number of people, and have intense effects, it is statistically insignificant for those that do not possess these characteristics. For the changes in the benchmark variables, the effect varies according to the intensity of the effects as well as the obtrusiveness and concreteness. The robustness checks reveal some variation in the results across different model assumptions, and such variation naturally invites further theorising and testing. However, in the context of this article the main conclusion on the robustness analyses is that the main results apply across a large set of different model specifications.
The effect of indicators across six different issue characteristics.
Notes: This Figure reports the regression coefficients (the dots) with 95% confidence intervals (the horizontal lines through the dots) from Table 3 in which we test our hypotheses. Yet, in this table, we do the regression on a reduced sample of our data because we run the regression on a group/category of our problems that fulfils a certain characteristic (“Obtrusiveness,” “Solubility,” etc.). These groups are on the y-axis, where 0 and 1 tell us if the analysis covers problems that belong to the category (1) or not (0). The categories on the y-axis are reported in the text. The regression tables used to create Figure 2 can be found in the supporting information
Conclusion
Based on data from 17 problem indicators in seven countries between 1960 and 2015, we find evidence that the policy agenda of national politicians does respond to information carried by problem indicators. The national policy agenda is affected by the development in the indicators (changes) and the current problem severity according to the indicators (levels), both over time and in comparison to other countries. The positive effect of the current severity in the indicators applies regardless of how many people a problem affects, how intense those effects are, and several other problem characteristics. Regarding the over time development in indicators, the effect varies according to the character of the problem at stake. Furthermore, the effect of the development in the indicators is entirely driven by a strong responsiveness to negative changes, which have a much stronger effect than positive changes. This finding suggests that the negativity bias extends to policy agenda dynamics.
Regarding the literature on problems and their indicators, the study thus demonstrates that indicators do receive attention from politicians who use them to track the severity and development of problems. This means that the information that indicators bring into politics has important political consequences.
The fact that politicians respond to indicators is important for a well-functioning political system, which requires some degree of problem detection and problem responsiveness (Manin et al. Reference Manin, Przeworski, Stokes, Przeworski, Stokes and Manin1999). Although the connection between indicators and problems is far from simple considering that indicators are also subject to political disagreement, they are one of the main sources for politicians to receive systematic information about problems. Thus, to the extent that indicators provide important information about problems, our empirical results are encouraging in the sense that they suggest that politicians react when they receive troubling information about the severity and development of problems that threaten the welfare of citizens.
We interpret the negativity effects in a similarly optimistic view. If detecting and responding to problems is a main obligation of responsive politicians, we would expect them to focus on negative rather than positive changes because negative changes provide information about potential problems, whereas positive changes show successes. Focusing on negative information may thus be quite reasonable for good governance. In this way, a negativity bias may be an important feature of a well-functioning political system that at least attempts to tackle citizens’ problems (Soroka Reference Soroka2006; Geer Reference Geer2006).
We anticipate a number of interesting avenues of future research. Problem indicators from international organisations are only one type of evidence that decisionmakers can use to set the policy agenda. We want to know if problem indicators are more important than other sources of evidence, such as reports from think tanks, civil organisations, or corporations. In a related vein, after we have established the influence of problem indicators on the policy agenda, we need to open up the mechanism. Do politicians themselves track problem indicators and respond directly to them, or do politicians rely on messengers that filter the problem information? This could be the case if they mainly respond during heightened public concern with an issue or during a hike in media attention to a problem area (Alexandrova et al. Reference Alexandrova, Rasmussen and Toshkov2016). Heightening public concern about or media coverage of deteriorating numbers may send a strong signal to politicians that they should attend to a problem. Therefore, public opinion and the media may play an important role in structuring and strengthening the effect of indicators. This is, however, a complex mechanism of problem responsiveness to disentangle theoretically as well as empirically. It would require not only integrating diverse literatures on public and media agenda setting but also collecting new, comparative data on several variables, most notably media data. Nevertheless, integrating the public and the media in the model would strengthen the causal identification of the influence of problem indicators on the policy agenda, and future studies should embark on this important endeavour.
In this article, we provide first-hand evidence on the importance of benchmarking for politicians’ attention to problem indicators. We theorise that such benchmarking – besides comparing to past severity on the problem area – involves comparison to other countries with which decisionmakers tend to compare themselves. We line up an array of countries for our analysis – seven in total. Yet, we need even more countries in order to gain a better and more nuanced understanding of the degrees of benchmarking. Some countries are probably just more important (Neumayer et al. Reference Neumayer, Plümper and Epifanio2014). It could be that countries are mostly concerned about the performance of neighbouring, comparable countries or it could be that European countries are primarily concerned with the EU average, as a simple heuristic, more than particular countries within the EU. While this study has shown that benchmarking across countries matters also when it comes to policy agenda setting, much future research is needed to learn more about this important benchmarking effect.
Supplementary material
To view supplementary material for this article, please visit https://doi.org/10.1017/S0143814X22000307
Data availability
The data that support the findings of this study are openly available in the Journal of Public Policy Dataverse at doi:10.7910/DVN/A7UTBC.
Acknowledgements
We would like to thank the editor and the reviewers for providing extensive comments that improved the paper a lot. Earlier versions of this manuscript has also benefitted greatly from comments by James Stimson, Reimut Zohlnhöfer, Frank Baumgartner and participants at a workshop at the Department of Political Science at University of North Carolina. We also want to thank Christian Breunig and Emiliano Grossman for providing access to data on German and French parliamentary questions.
Conflict of interests
The authors declare no competing interests.



