


1. Introduction
Impact evaluation of health intervention policies has been a growing concern because donors over time have been interested in linking health aid with performance. Despite the clarity of this, evidence on the effectiveness of targeted health interventions in promoting children's health outcomes in developing countries is still insufficient. We contribute to aid literature by evaluating the impact of Global Alliance for Vaccines and Immunization (GAVI) support on children's health outcomes in developing countries. GAVI is one of the health interventions that provide vaccines and immunization assistance to the world's poorest countries.Footnote 1
Despite the many interventions from governments and international organizations to improve children's health, available statistics show that children's health continues to be poor. For example, in 2015, the global population of children who died before their fifth birthday stood at 5.9 million. This situation was more severe in low- and middle-income countries. In sub-Saharan Africa, for example, children are about 14 times more likely to die before their fifth birthday (World Health Organisation Price Report, 2016a, 2016b). During the same year, the total number of stunted, wasted, and overweight children were 156, 50 and 42 million, respectively (World Health Organisation Price Report, 2016a, 2016b). The World Health Organization (WHO) reports that the main causes of neonatal and under-five mortalities are pneumonia, diarrhoea and malaria. Pneumonia alone contributed to 16% of under-five mortality in 2015. Furthermore, pneumonia which is caused by a virus, bacteria or fungi, can be prevented by adequate immunization intervention that can significantly eliminate haemophilus influenzae type b (Hi)b, pneumococcus, measles and whooping cough (pertussis) (World Health Organisation Price Report, 2016a, 2016b).
This study evaluates the impact of GAVI support on children's health, an intervention that provides vaccines and immunization assistance to developing countries with the aim of improving children's health among recipient countries. Our identification strategy utilizes a difference-in-difference approach by comparing health outcomes before and after the intervention among GAVI support recipient countries (hereafter recipient) and non-recipient (hereafter non-recipient) countries. Our findings show that GAVI support has been effective in improving children's health outcomes. Specifically, we find that GAVI reduces neonatal, infant and under-five mortality rates in recipient countries. Also, we find that the impact of GAVI on health outcomes reduces as the level of per capita income of a recipient country increases; a finding which justifies the co-financing model of GAVI.
This study is within the spirit of the effectiveness of health aid on health outcomes and contributes to the longstanding debate about the effectiveness of aid in general. Since, health aid and health outcomes are more closely linked, the relationship between the two may be easier to detect statistically (see Mishra and Newhouse, Reference Mishra and Newhouse2009). Aid for health is broadly believed to promote health outcomes in developing countries. It is often credited with saving lives by providing vaccines, eliminating communicable and non-communicable diseases, and promoting medical services. This belief can be associated, in part, with successful large-scale health interventions funded by international development agencies. For example, health aid is successful in eliminating measles in southern Africa, eradicating smallpox globally, preventing sexually transmitted diseases in Thailand, reducing child mortality through vitamin A in Nepal, successfully implementing rehydration therapies and reducing diarrhoeal deaths in Egypt and many others (see Levine, Reference Levine2007). In China, Liang et al. (Reference Liang, Bi, Yang, Wang, Cui, Cui, Zhang, Liu, Gong, Chen and Wang2009) found that over the period of 1990–2005, the prevalence of hepatitis B among children who receive timely vaccines reduced by 2.1%. The efficacy of the vaccine was estimated to be 88.3%.
Some studies have shown that health aid has a positive impact on health outcomes in recipient countries. Mishra and Newhouse (Reference Mishra and Newhouse2009) show the impact of overall health aid on infant mortality and conclude that overall aid significantly reduces infant mortality in the recipient countries. Also, Feeny and Ouattara (Reference Feeny and Ouattara2013) examine the effect of overall health aid on child health as measured by the two proxies: (a) immunization against measles and (b) immunization against diphtheria–tetanus–pertussis (DTP). The authors find that health aid reduces such health promotion proxies. Afridi and Ventelou (Reference Afridi and Ventelou2013) also found that overall health aid significantly reduces adult mortality in selected developing countries. Other studies have shown that aggregate health aid improves public health delivery in developing countries (Wolf, Reference Wolf2007). On the contrary, some studies have shown that health aid does not have any significant impact on the health outcome in recipient countries. Bendavid and Bhattacharya (Reference Bendavid and Bhattacharya2014) show that total health aid has an insignificant impact on health outcomes. Similarly, findings on the effect of health aid on life expectancy have found no or almost zero impact on life expectancy in developing countries (Wilson, Reference Wilson2011).
Other studies suggest that total health aid effectiveness is contingent on some preconditions. By applying quantile regression, for example, Gomanee et al. (Reference Gomanee, Girma and Morrissey2005) find that the income of the recipient countries determines the effectiveness of health aid showing that health aid is more effective in low-income countries. They further suggest that donors need to consider the income of the recipient countries before they deliver health-targeted aid. Moullan (Reference Moullan2013) finds health aid, particularly technical aid, reduces the emigration of highly educated individuals, mainly doctors from the recipient countries, and this in turn significantly enhances health outcomes. Some studies have examined the effect of a specific type of aid on particular health outcomes. For example, a recent study by Jaupart et al. (Reference Jaupart, Dipple and Dercon2019) examines the role of GAVI in promoting DTP3 and measles immunization coverage in recipient countries. Similarly, a study by Lu et al. (Reference Lu, Michaud, Gakidou, Khan and Murray2006) shows that GAVI increases DTP3 coverage in recipient countries, although the effect varied by the recipient countries' baseline DTP3 coverage levels.
Although the literature on health aid and health outcome suggests a mixed finding, little is known of the impact of a specific health intervention from international development agencies on health outcomes. However, such evidence is important because it helps aid-financing institutions to initiate new aid-modalities which involve analysing aid effectiveness in a much-disaggregated approach which in turn enables them to identify the most productive channels of transferring aid to a specific sector. It is important to note that previous studies on the effectiveness of health aid have focused on aggregated aid without looking at targeted aid. Hence, our contribution to the literature comes from the evaluation of a specific form of health aid (vaccine and immunization) on children's health outcomes. To the best of our knowledge, no study has conducted a nuanced analysis of the impact of GAVI on children's health in the manner we do.
The rest of the paper is organized as follows. Section 2 presents an overview of the GAVI initiative and its co-financing model. Section 3 discusses the empirical identification strategy and data sources. In Section 4, we present the main results which are followed by robustness checks in Section 5. Section 6 discusses the main findings from the study and concludes the study.
2. The GAVI initiative
GAVI, created in 2000, is an international organization that aims to bring together public and private sectors with the shared goal of creating equal access to new and underused vaccines for children living in the world's poorest countries. GAVI is mainly funded through contributions by government donors, the Bill and Melinda Gates Foundation, International Finance Facility for Immunization, GAVI Matching Fund and Pneumococcal AMC (Godal, Reference Godal2000). Eligibility for GAVI support is determined by a country's per capita Gross National Income (GNI) based on the World Bank data. Countries become eligible for GAVI support if their average GNI per capita has been less than or equal to US$ 1630 over the past 3 years (according to World Bank data published in July each year). Once a country crosses the eligibility threshold, it enters the accelerated transition phase and starts to phase out of the GAVI financial support. GAVI also sets specific criteria for each type of support, as outlined in the application guidelines. All country applications are reviewed by a group of independent experts in routine immunization, health system strengthening, epidemiology and disease control, cold chain and logistics, financial and budget analysis and gender and equity. In 2020, 57 countries are eligible to apply for new vaccine support from GAVI.Footnote 2
The scale and nature of GAVI's support change as per capita GNI increase over time (see Figure 1). From the beginning of GAVI support, governments are expected to co-finance vaccines by financing a fraction of the needed doses. Gradually, as per capita GNI grows, co-financing levels for governments increase.

Figure 1 shows that once countries have surpassed GAVI's eligibility threshold, they enter an accelerated transition process. This means that they phase out GAVI support at a faster pace than before, by taking on an increasing share of their vaccine costs. During this period, GAVI intensified its efforts to help transitioning countries be in a good position to financially sustain their immunization programmes and new vaccines.
GAVI is expected to improve children's health in recipient countries through the following potential direct and indirect channels. First, it makes a direct investment in vaccines and immunization in recipient countries. GAVI routinely immunizes children against hepatitis B, Hib and pertussis (whooping cough) as well as its one-off immunization of children against measles, polio and yellow fever (GAVI, 2015). For example, in 2008, GAVI reached out to about 79% of children in low-income countries with three doses of DTP3 (GAVI, 2015). In Africa, the coverage of DTP3 increased from 49% in 2000 to 74% in 2004 (Arevshatian et al., Reference Arevshatian, Clements, Lwanga, Misore, Ndumbe, Seward and Taylor2007). As shown in Figure A1, the Africa and South-East Asia regions have witnessed a significant increase in the percentage of children who had received DTP3 immunization.
Second, GAVI indirectly creates a competition for the demand for vaccines which reduces vaccine prices. As a major player in the vaccine market, GAVI creates economies of scale for manufacturers to expand their production capacity while opening the door for suppliers to enter the vaccine market and eventually reducing prices (GAVI, 2015). For example, the price of the DTP–HepB–Hib vaccine in a two-dose lyophilized presentation which is mainly supplied by GlaxoSmithKline Biologicals S.A. has dropped from US$ 3.5 in 2001 to US$ 2.95 in 2014. Similarly, the price of the DTP–HepB–Hib vaccine in a single dose liquid presentation has significantly dropped from US$ 3.63 in 2006 to US$ 0.80 (UNICEF, 2016). Also in 2015, the weighted average price of pneumococcal conjugate vaccine (PCV) was significantly lower for GAVI-funded countries compared to all other countries including non-GAVI-funded lower- and middle-income countries as shown in Figure A2. The fall in the price of vaccines makes it affordable for developing countries to patronize them which leads to improved children's health outcomes.
The final channel is the improvement in global standards for safe injection. GAVI offers an injection safety support programme to developing countries by providing them with national immunization programmes with 3 years of funds for auto-disable syringes. This support indirectly ensures the safety and improves the coverage rate of vaccines. In Madagascar, Drain et al. (Reference Drain, Ralaivao, Rakotonandrasana and Carnell2003) found that the use of auto-disable syringes significantly increased the administration of vaccines on non-routine immunization days by 4.3%. Thus, improvement in the standards for safe injection leads to a larger coverage of vaccines among countries, thereby improving children's health. In this study, we focus on the impact of GAVI on three key children's health outcomes: neonatal mortality, infant mortality and under-five mortality.
3. Empirical strategy
We utilize a difference-in-difference approach and specify the main equation as:

$Child\_health_{it}\;$ is child health outcome of the country i in year t. We consider three key children's health outcomes: neonatal mortality rate, infant mortality rate and under-five mortality rate. These variables are logarithm transformed. These variables are broadly accepted as important indicators of improvements of the health sector in an economy (Thomas et al., Reference Thomas, Lavy and Strauss1996). Infant mortality rate indicates the number of infants dying before reaching 1 year of age, per 1000 live births in a given year. Neonatal mortality rate indicates the number of neonates dying before reaching 28 days of age, per 1000 live births in a given year. Finally, the under-five mortality rate shows the number of children dying before reaching age 5, per 1000 new-born babies in a given year. α i represents country-fixed effects, γ t shows the year-fixed effects. $Health\_aid_{it-1}$
 is lagged log health aid per capita and PCI it is log per capita income. The most important coefficient of interest in this study is β. If β is significant and negative, then GAVI support is effective in promoting children's health outcomes in the recipient countries, particularly after 1999. $X_{it}^{\prime}$
 indicates a vector of time-varying country-level characteristics, and ɛit denotes a random idiosyncratic error term.
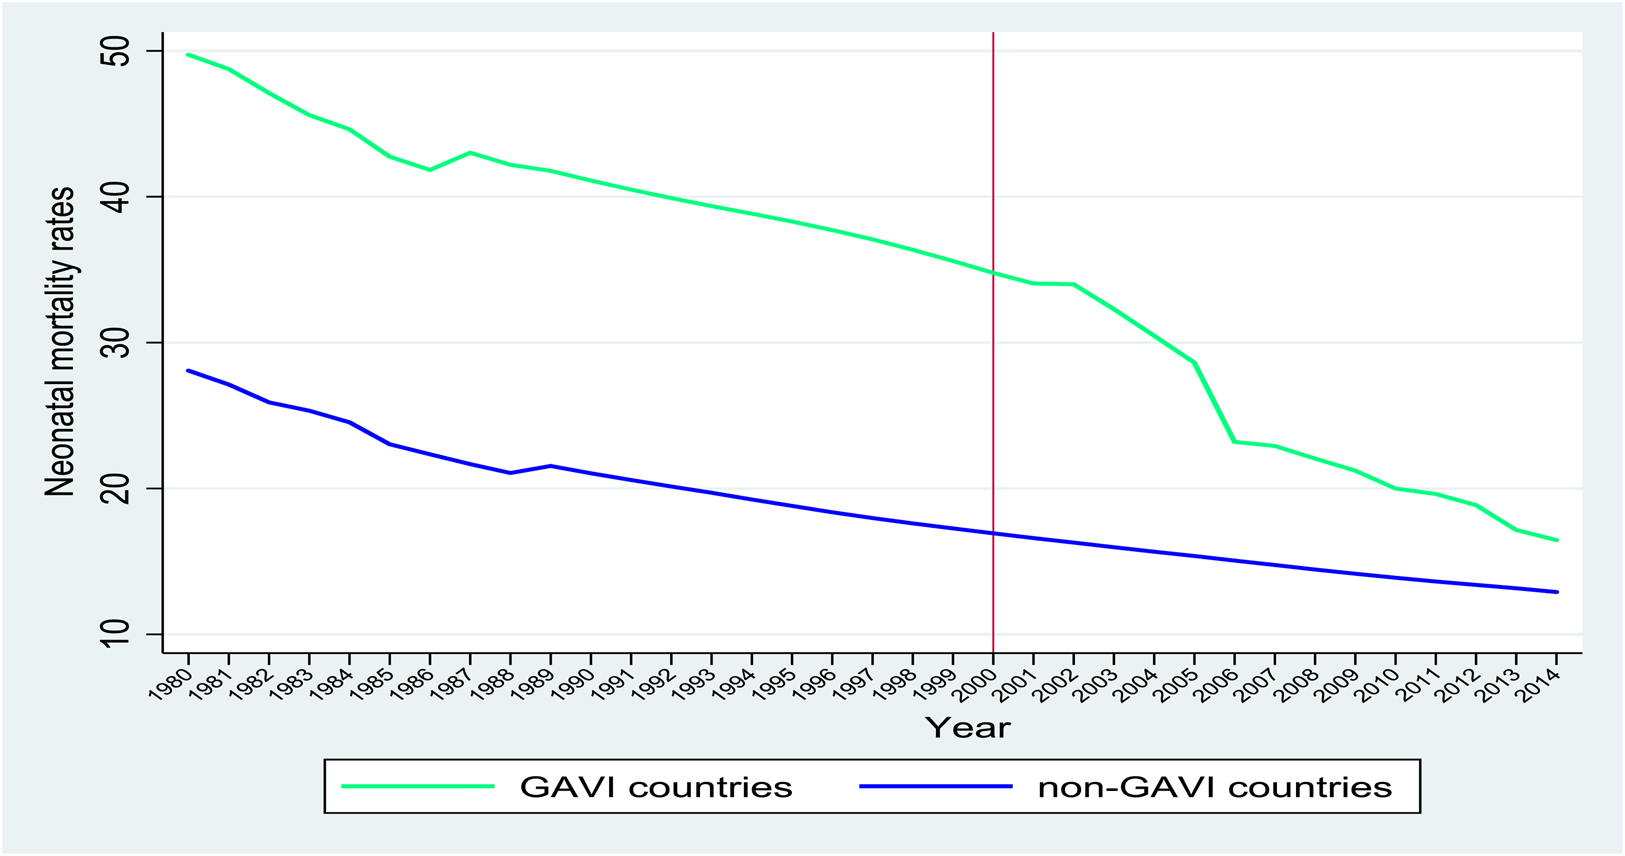
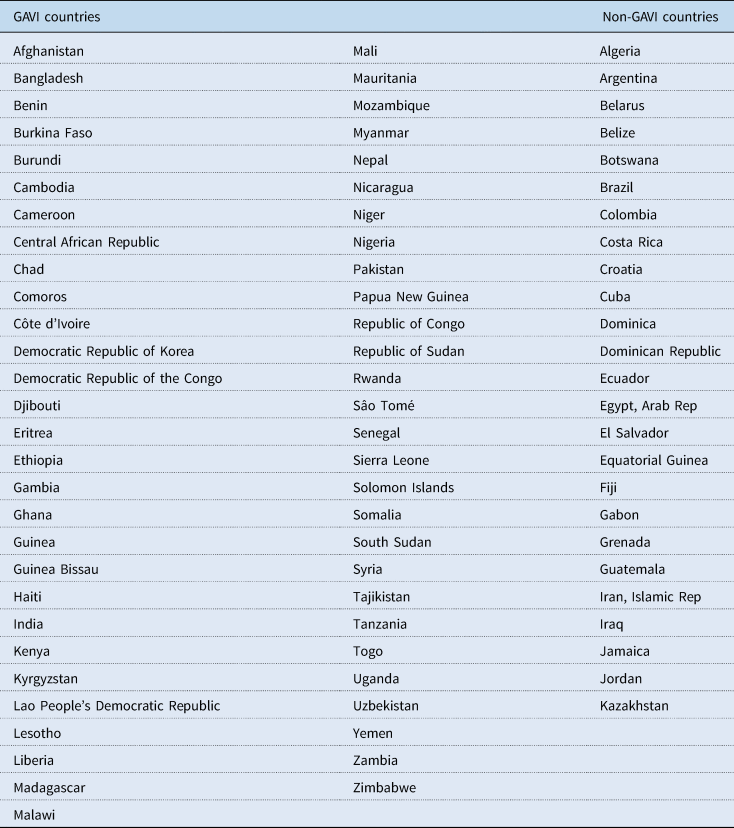
Our empirical identification strategy relies on a comparison of health outcomes of the recipient and non-recipient countries before and after the GAVI initiative in 2000. The implicit assumption is that the differences across countries in average health outcomes would be consistent over time across recipient and non-recipient countries in the absence of GAVI intervention. We define the pre-GAVI period as 1985–1999 while post-GAVI is defined as 2000–2014. Table 1 shows the mean differences in children's health outcomes before and after the GAVI intervention. It shows significant differences in all three health outcomes (neonatal, infant and under-five mortality rates) before 2000 among recipient and non-recipient countries. Moreover, the magnitude of the differences reduces after GAVI support was introduced. This evidence is consistent with Figures 2–4 showing that the gaps in children's health outcomes between the recipient and non-recipient countries seem to have narrowed after 2000. The statistics in Table 1 suggest that in the absence of GAVI support, children in the recipient countries would have exhibited significantly poorer health on average. The kernel density plots in Figures 5–7 show the distribution of neonatal mortality, infant mortality and under-five mortality among GAVI and non-GAVI countries before and after 2000 (Table A1 provides the list of GAVI and non-GAVI countries considered in this study). There is a significant difference in the gap in the distribution of all children's health outcomes between GAVI and non-GAVI countries before 2000. However, after 2000 the gaps have significantly narrowed across all indicators, although the incidence of neonatal mortality, infant mortality and under-five mortality remains higher in GAVI countries than in non-GAVI countries.
Neonatal mortality rates among GAVI and non-GAVI countries over the period 1980–2014.
Source: World Development Indicators.
Infant mortality rates among GAVI and non-GAVI countries over the period 1980–2014.
Source: World Development Indicators.

Under-five mortality rate among GAVI and non-GAVI countries over the period 1980–2014.
Source: World Development Indicator.

Kernel density distribution of neonatal mortality among GAVI and non-GAVI countries before and after 2000.

Kernel density distribution of infant mortality among GAVI and non-GAVI countries before and after 2000.

Kernel density distribution of under-five mortality among GAVI and non-GAVI countries before and after 2000.

Summary statistics of outcome variables by time and GAVI status

Source: Authors' own computation from World Development Indicators.
*, **, *** Significant at 10, 5 and 1%, respectively.
One potential threat to our identification strategy is that the improvement in health could be due to increased total aid committed to the health sector of recipient countries but not due to the GAVI intervention. To isolate the effect of health aid from the GAVI support, we control for total health aid received by both recipient and non-recipient countries.
Another potential threat is that there could be other unobservable factors that might be correlated with GAVI and children's health outcomes. Such factors can be time-variant or invariant. To address this problem, we follow two things: first, because per capita income is a major decision criterion to become a GAVI member, we present specifications with and without per capita income. As shown in Figure 1, recipient countries become fully self-financing and exit GAVI after an accelerated increase in per capita income. Second, we control country-fixed effects in all specifications. By controlling for country-fixed effects, we allow for unobservable characteristics to vary during the study period with the assumption that such characteristics are fixed over time and are uncorrelated with children's health outcomes.
We further control for a set of variables in our models to capture the effects of other factors influencing health outcomes. The following controls are included: fertility rate, log of population, and CO2 emissions in metric tonnes per capita, sanitation and immunization, adult female literacy and births attended by skilled health staff. It is evident that access to improved sanitation and immunization, adult female literacy and births attended by skilled health staff, have significant negative impacts on health. Following Woodcock et al. (Reference Woodcock, Edwards, Tonne, Armstrong, Ashiru, Banister, Beevers, Chalabi, Chowdhury, Cohen and Franco2009) we also include CO2 emissions in metric tonnes per capita to capture the effect of climate change on health outcomes. Data for these variables are sourced from the World Development Indicators (WDI) as well as the AidData database.
4. Empirical results
4.1 Difference-in-difference estimation
As discussed in the introductory section, we analyse the effects of the GAVI intervention on children's health outcomes. We proxy children's health outcomes by neonatal mortality rate, infant mortality rate and under-five mortality rate. Table 2 reports our baseline results. All regressions include country- and year-fixed effects as well as the control variables. In specifications 1, 4 and 7, we do not include health aid and per capita income. Health aid is included in specifications 2, 5 and 8, but without per capita income. Specifications 3, 6 and 9 present the full model with health aid and per capita income. This method enables us to isolate the impact of GAVI support from general health aid received by recipient countries and improvement in per capita income. We first examine the effect of GAVI intervention on the pooled group of countries irrespective of their level of per capita income.
Effect of GAVI on neonatal, infant and under-five mortality rates in developing countries
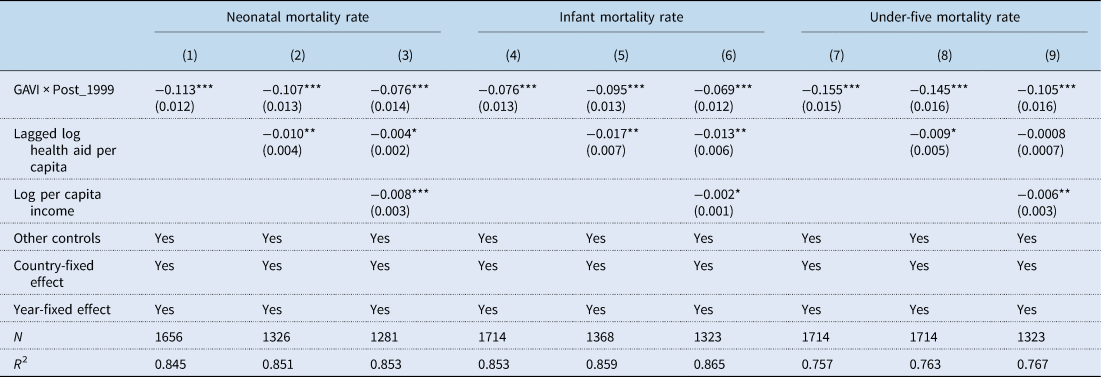
Source: Authors' own computation using data from WDI and AidData database. All specifications include control variables: fertility rate, log of population, and CO2 emissions in metric tonnes per capita, sanitation and immunization, adult female literacy and births attended by skilled health staff. Robust standard errors adjusted for heteroscedasticity are in parentheses.
*, **, *** Significant at 10, 5 and 1%, respectively.
In Table 2, we find that countries that received GAVI support experience an average reduction of 11.3 percentage points in neonatal mortality rate (see specification 1). In specification 2, we find that the effect reduces to 10.7 percentage points, which shows that in the presence of general health aid, recipient countries gain extra percentage points reduction in neonatal mortality. In specification 3, this reduces to 7.6 percentage points in neonatal mortality. Specifications 2 and 3 show that adding general health aid and per capita income does not affect the standard errors or the R 2. This suggests that omitted-variable bias might not be a serious threat to our identification strategy. This is consistent across all health outcomes. Relying on estimates from specification 3, we conclude that the GAVI initiative has significantly reduced neonatal mortality by 7.6 percentage points in recipient countries.
In addition, Table 2 shows the effect of GAVI support on infant and under-five mortality rates. We find that countries that received GAVI support experience an average reduction of 7.6 percentage points in infant mortality rate as shown in specification 4. In specification 6, this effect is reduced to 6.9 percentage points due to the inclusion of health aid and per capita income. The largest impact of GAVI is found for under-five mortality. Specification 7 of Table 2 shows that GAVI countries witnessed a significant reduction in the under-five mortality rate by 15.5 percentage points. The impact reduces to 10.5 percentage points as shown in specification 9 of Table 2.
4.2 Heterogeneous impacts of GAVI based on per capita income of recipient country
In this section, we bifurcate recipient countries based on their per capita income and then examine and compare the effects of GAVI support on children's health outcomes among the recipient countries. We do so by putting countries into three categories; those below the 25th percentile value of per capita income; those between the 25th and 75th percentile values of per capita income and those above the 75th percentile value of per capita income. This analysis is important because as part of GAVI's co-financing strategy, countries will exit and become self-financing when recipient countries' per capita income grows significantly over time. These estimates are based on specifications 3, 6 and 9 of Table 2. Table 3 reports the difference-in-difference results for all our proxies for children's health outcomes (neonatal, infant and under-five mortality rates).
Effect of GAVI on neonatal, infant and under-five mortality rates by per capita income of recipient countries
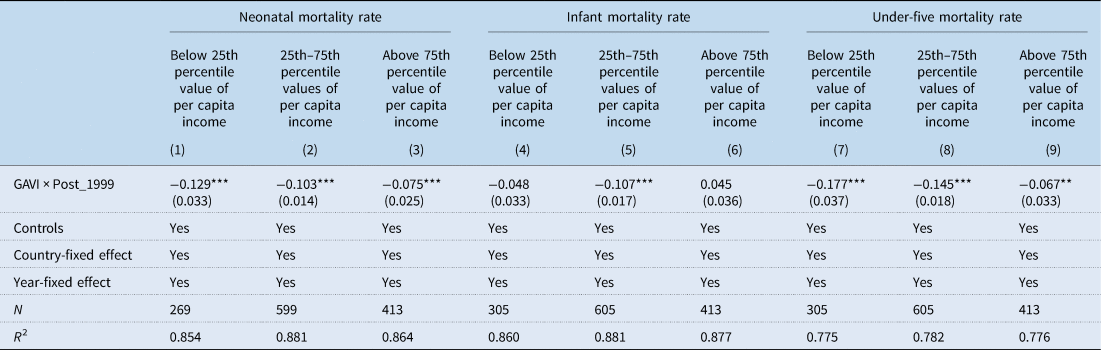
Source: Authors' own computation using data from WDI and AidData database. All specifications include control variables: fertility rate, log of population, and CO2 emissions in metric tonnes per capita, sanitation and immunization, adult female literacy and births attended by skilled health staff. Robust standard errors adjusted for heteroscedasticity are in parentheses.
*, **, *** Significant at 10, 5 and 1%, respectively.
Table 3 shows that the impact of GAVI support on neonatal mortality rate reduces as per capita income increases. Specification 1 of Table 3 shows that for countries below the 25th percentile value of per capita income, GAVI support reduces neonatal mortality rate by 12.9 percentage points. Similarly, specifications 2 and 3 show that among those between the 25th and 75th percentile values of per capita income, the corresponding reduction in neonatal mortality is 10.3 percentage points while for those above the 75th percentile per capita income value, GAVI leads to 7.5 percentage point reduction in neonatal mortality.
Moreover, specification 5 of Table 3 reports the impact of GAVI on infant mortality and shows that GAVI support is effective in reducing infant mortality rate among countries with per capita income between the 25th and 75th percentile values per capita income range. Intriguingly, no significant effect is found for countries whose per capita income is below the 25th percentile value of per capita income, although negative (see specification 4 of Table 3).
Consistent with the findings on neonatal mortality, the impact of GAVI support on under-five mortality rate is largest among countries whose per capita income is below the 25th percentile. The impact ranges from 17.7 to 6.7 percentage point reduction in under-five mortality (see specifications 7, 8 and 9 of Table 3).
5. Robustness checks
5.1 Falsification test
In order to provide validity of our analysis, we perform a falsification test. A major threat to our empirical analyses is the fact that countries' health outcomes might improve over time as the economy expands. Although we have isolated such effects by controlling for per capita income and time fixed effects, it is important to perform a falsification analysis to demonstrate that the estimated impact indeed, occurred after 1999. We, therefore, redefined the pre-GAVI time period as 1960–1979 and the post-GAVI time period as 1980–1999. The argument is that if GAVI has no significant impact on children's health outcomes post-1999, then in equation (1) should be negative and significant. Table 4 reports results from all specifications. The results show that over the falsified control period, GAVI has insignificant effects on children's health outcomes. The interpretation is that the vaccine and immunization support from GAVI since 2000 has played a significant role in reducing neonatal mortality, infant mortality and under-five mortality.
Effect of GAVI on children's health outcomes between 1960 and 1999
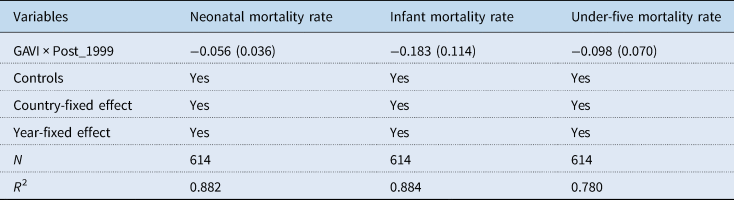
Source: Authors' own computation using data from WDI and AidData database. All specifications include control variables: fertility rate, log of population, and CO2 emissions in metric tonnes per capita, sanitation and immunization, adult female literacy and births attended by skilled health staff. Robust standard errors adjusted for heteroscedasticity are in parentheses.
*, **, *** Significant at 10, 5, and 1%, respectively
5.2 Testing for omitted-variable bias
Another possible threat to establishing the causal effect of GAVI on children's health is omitted-variable bias. There may be time-variant unobservable factors associated with GAVI such as health governance, institutional development and health systems factors in child health. Omitting these time-variant factors may bias our estimates. Given the absence of variables to capture these unobservable factors, we test our model for the absence of any omitted variable using the approach by Oster (Reference Oster2019). This approach exploits the movement in the coefficient and the R 2 to compute bounding values for GAVI. The Oster (Reference Oster2019) approach works under the assumption that the selection of the observed controls is proportional to the selection of the unobserved controls. To perform this exercise, we estimate delta (δ) to determine the relevance of unobserved covariates relative to the observed variables. δ = 1 means that unobservable variables are equally as important as the observables, whereas δ > 1 suggests that unobservable variables are more important than observables in our model. To correct any bias in our estimate, we set δ = 1. We further use the R 2 from the full model to compute R max, which is the maximum R 2 that can be obtained assuming all possible control variables are captured in the model. An R max = 1 means the model has no errors. This is an extreme assumption given the incompleteness of any model. We follow the recommendation of Oster (Reference Oster2019) and set R max = 1.3R 2 (see Oster (Reference Oster2019) for detailed description of this procedure). Nonetheless, we test the extreme scenario by setting R max = 1.
The results in Table 5 show that the unobservable variables are not of more importance than the observed variables given δ < 1. That is, the included covariates have sufficient explanatory power to balance any potential bias due to omitted variables in our model. It is also evident from the corrected effects that the economic significance of GAVI is not compromised by omitted-variable bias.
Testing for omitted-variable bias following Oster (Reference Oster2019)
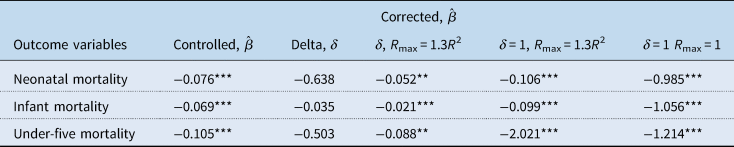
Note: Baseline effects are results from specification 1 whereas controlled effects are results from specification 3. Delta is computed using psacalc in STATA and shows how important unobservable variables are relative to the observed covariates. Controlled $\hat{\beta }$ are the estimated coefficients in columns 3 in Tables 2 and 3 while corrected $\hat{\beta }$
 show the impact of GAVI on health outcomes after accounting for omitted variables.
*, **, *** Significant at 10, 5 and 1%, respectively.
5.3 Non-randomness of GAVI inclusion
The final potential threat to our identification is the possible endogeneity coming from the non-randomness of GAVI inclusion. Recipient countries may be selected by donors (private foundations, in part) mainly because such countries are seen as favourable fields to implement the programme. If this holds, then GAVI would be endogenous, and our estimates are potentially biased. Ideally, using exogenous variations to establish the link between GAVI inclusion and health outcomes in recipients' countries is the best approach to handle this form of endogeneity. However, such an instrumental variable (IV) is hard to find within the context of this study. We, therefore, employ Lewbel's (Reference Lewbel2012) heteroscedasticity identification techniques to unravel this bias. This approach has the advantage of handling endogeneity when an IV is difficult to find and has been used in many studies (see Sabia, Reference Sabia2007; Huang et al., Reference Huang, Lin and Yeh2009; Denny and Oppedisano, Reference Denny and Oppedisano2013; Emran and Hou, Reference Emran and Hou2013; Kelly et al., Reference Kelly, Dave, Sindelar and Gallo2014; Zhao, Reference Zhao2015; Xue, Reference Xue2018). Lewbel's identification strategy comes from obtaining regressors that are uncorrelated with the product of the heteroscedastic error, which in our case comes from unobserved factors for GAVI inclusion.Footnote 3
Table 6 shows the results for Lewbel's estimation as well as the Kleibergen–Paap F-statistic for the weak identification test and the Breusch–Pagan heteroscedasticity test. The p-value from the heteroscedasticity test shows that we cannot fail to reject the null hypothesis that the endogenous variable is homoscedastic. Similarly, the Kleibergen–Paap F-statistic shows that we have a strong instrument and hence, Lewbel's method is appropriate. The findings show that GAVI has significantly reduced the prevalence of negative health outcomes among recipient countries. The largest reduction is noticed for under-five mortality, which is consistent with our difference-in-difference estimates. Comparing these estimates to our main findings from the difference-in-difference approach, we can conclude that our main findings are the lower bound of the impact of GAVI on children's health outcomes.
IV estimates for the effect of GAVI on children's health outcomes

Source: Authors' own computation using data from WDI and AidData database. All specifications include control variables: fertility rate, log of population, and CO2 emissions in metric tonnes per capita, sanitation and immunization, adult female literacy and births attended by skilled health staff. Robust standard errors adjusted for heteroscedasticity are in parentheses.
*, **, *** Significant at 10, 5 and 1%, respectively.
6. Discussion and concluding remarks
This study has evaluated the impact of GAVI on children's health outcomes. More specifically, we have estimated the counter-factual of the GAVI initiative on neonatal, infant and under-five mortality rates. Our identification strategy utilized exogenous variation in increased access to vaccines and immunization, and the timing of the vaccines and immunization. We find that GAVI has a large negative impact on neonatal, infant and under-five mortality rates. The effect is significantly larger for recipient countries with per capita income below the 25th percentile. Our main results show that the impact of GAVI is 7.6, 6.9 and 10.5 percentage point reduction in neonatal, infant and under-five mortality rates, respectively. Our unique contribution stems from the evaluation of a specific form of health aid (vaccines and immunization) that targets improving children's health outcomes.
Although previous studies on GAVI have largely focused on vaccine coverage, the study by Jaupart et al. (Reference Jaupart, Dipple and Dercon2019) is quite similar to ours. While our findings on under-five and infant mortality rates are qualitatively similar to theirs, we have further estimated the impact of GAVI on neonates, who are the most vulnerable group of children. In fact, the 5-year survivorship of children largely depends on how well they can survive their first 4 weeks of birth when changes occur rapidly when they are exposed to environmental provocations. In addition to examining the effect of GAVI on neonatal mortality rates, our study is the first to examine the heterogeneous impact of GAVI among recipient countries. Specifically, unlike the study by Jaupart et al. (Reference Jaupart, Dipple and Dercon2019), we further conducted a nuanced analysis of how the impact of GAVI changes based on the per capita income of the recipient country. This analysis is critical because recipient countries are required to exit GAVI and become self-financing at some stage and per capita income is one of the key metrics for determining self-financing. This finding aligns with the finding by Lu et al. (Reference Lu, Michaud, Gakidou, Khan and Murray2006) that the positive impact of GAVI on DTP3 coverage was insignificant for countries that had baseline coverage levels, between 65 and 80%. That is, GAVI's contribution to vaccines in developing countries that had more than 65% coverage was insignificant.
In conclusion, our study has found significant evidence that GAVI improves children's health outcomes, especially in poorer countries. Although this finding suggests that the impact of GAVI is less relevant as economies grow, more research is needed to determine the optimal level of income that will ensure the gains from GAVI after countries have transitioned.
Acknowledgement
We are grateful to participants of the 2019 ABCDE “Multilateralism: Past, Present, and Future” conference presented at World Bank Headquarters in Washington, D.C.
Data
The data that support the findings of this study are available from the corresponding author upon reasonable request.
Author contributions
AAM collected and analysed data and reviewed related literature. CA ran regression and interpreted the results.
Financial support
The authors received no financial support for the research, authorship and/or publication of this article.
Conflict of interest
We have no conflicts of interest to disclose.
Ethical standards
The study does not involve human participants, human data or human tissue.
Consent for publication
The study does not contain any individual person's data in any form.
Appendix
Trends in DTP3 immunization coverage among 1-year-olds (%) among WHO regions.
Source: WHO Global Health Observatory (GHO) database.


List of countries considered in the study


 Open access