


Pneumonia is an inflammatory condition of the lungs that usually stems from an infection. The World Health Organization estimates 450 million cases of pneumonia occur every year, affecting mostly young children and older adults (Ruuskanen et al., Reference Ruuskanen, Lahti, Jennings and Murdoch2011). Although distinct subtypes exist, pneumonia is characterized by alveolar filling with fluid, microorganisms and immune response cells, preventing the lungs from working properly (National Institute for Health and Care Excellence [NICE], 2016). Diagnosis is confirmed with chest radiography showing abnormalities, and other pieces of evidence such as laboratory tests identifying the causal pathogen and increases in antibody count (Szalados, Reference Szalados, Papadokos and Szalados2005). Pneumonia is associated with increased morbidity and mortality (Lim et al, Reference Lim, Baudouin, George, Hill, Jamieson, Le Jeune, Macfarlane, Read, Roberts, Levy, Wani and Woodhead2009); in fact, mortality estimates range between 5% and 14% for hospitalized patients. Risk factors for pneumonia include smoking (Farr et al., Reference Farr, Bartlett, Wadsworth and Miller2000), alcoholism (Ruiz et al., Reference Ruiz, Ewig, Torres, Arancibia, Marco, Mensa, Sanchez and Martinez1999), heart disease and advanced age (Koivula et al., Reference Koivula, Sten and Makela1994). Furthermore, mortality among pneumonia cases is associated with factors such as hypertension and smoking (Guo et al., Reference Guo, Wei, Zhang, Wu, Li, Zhou and Qu2019). Nonetheless, individuals considered ‘at low risk’ of pneumonia can still develop the condition, which highlights its complexity and clinical heterogeneity.
Since the emergence of the 2020 COVID-19 pandemic, there has been an increase in pneumonia incidence and mortality (Shi et al., Reference Shi, Han, Jiang, Cao, Alwalid, Gu, Fan and Zheng2020). Its relatively high infectivity and mortality even among low-risk groups calls for the investigation of genetic mechanisms underlying pathogenesis and prognosis. A recent study on 2633 British twins (728 complete pairs, 537 monozygotic and 191 dizygotic, 86.9% female) investigated the susceptibility to infection by SARS-CoV-2 (Williams et al., Reference Williams, Freydin, Mangino, Couvreur, Visconti, Bowyer, Le Roy, Falchi, Sudre, Davies, Hammond, Menni, Steves and Spector2020). The researchers used a symptom-based algorithm to predict true infection in participants tested for SARS-CoV-2 and estimated heritability for symptoms, including fever, 0.41 (95% CI [0.12, 0.70]); anosmia, 0.47 (95% CI [0.27, 0.67]); and delirium, 0.49 (95% CI [0.24, 0.75]). Overall predicted heritability of COVID-19 status was 0.50 (95% CI [0.29, 0.70]), suggesting that symptomatic infection with SARS-CoV-2 is under host genetic influence to some extent, and reflecting interindividual variation in the host immune response. Thus, host-specific genetic susceptibility is an emerging area of research interest (Tanigawa & Rivas, Reference Tanigawa and Rivas2020) as it could facilitate the systematic stratification of patients by genetic risk and aid in the design of more efficient treatments (Salnikova et al., Reference Salnikova, Smelaya, Vesnina, Golubev and Moroz2014).
In fact, evidence from other infectious diseases points to an important role for host genetics in influencing the development of symptomatic infection (Cooke & Hill, Reference Cooke and Hill2001). Twin studies have shown higher concordance rates of tuberculosis, leprosy, poliomyelitis and hepatitis B in identical versus nonidentical twins, suggesting a genetic component in susceptibility to these infectious diseases (Cooke & Hill, Reference Cooke and Hill2001). Moreover, clinical trials for drugs targeting genes with evidence of disease association are more likely to lead to useful therapies (King et al., Reference King, Davis and Degner2019; Nelson et al., Reference Nelson, Tipney, Painter, Shen, Nicoletti, Shen, Floratos, Sham, Li, Wang, Cardon, Whittaker and Sanseau2015). Thus, identification of genes and pathways that confer increased susceptibility to pneumonia could reveal new therapeutic targets and inform the design of prevention and treatment strategies.
Here, we report a genomewide association study (GWAS) meta-analysis of pneumonia history in adults using data from two large datasets, the UK Biobank and FinnGen. We identify genetic variants and genes associated with pneumonia risk, an essential step for understanding interindividual differences in susceptibility. We characterize the genetic etiology of pneumonia by assessing its genetic correlations and genetic evidence for causality against ∼1500 traits with publicly available GWAS data. Finally, we demonstrate the external validity of our findings by performing polygenic prediction of self-reported pneumonia in an independent Australian sample.
Methods
Samples and Phenotypic Information
For this study, we meta-analyzed GWAS for pneumonia in two independent samples: the UK Biobank and FinnGen. For the UK Biobank, we conducted a GWAS of pneumonia using individual-level genetic and phenotypic data from the UK Biobank. International Classification of Diseases (ICD10) codes are used to store information on participants’ health conditions. Raw ICD10 data were extracted from the UK Biobank under Application Number 25,331. In this study, we excluded participants of non-European ancestry to avoid potential genetic associations emerging from population stratification. Participants with a history of pneumonia were defined as those presenting any ICD10 code related to infectious pneumonia (N = 14,780; see Supplementary Table 1). For FinnGen, we leveraged publicly available summary statistics on the phenotype ICD10-J10 pneumonia, which comprised 9980 cases and 86,519 controls. Information on sample phenotyping, genotyping and GWAS in the FinnGen sample is available elsewhere (FinnGen, 2020). Both the UK Biobank and the FinnGen resource were approved by their corresponding research ethics committees.
Pneumonia GWAS in the UK Biobank
The GWAS was performed using BOLT-LMM, which implements a linear mixed-model association analysis and fits a genetic relationship matrix as a random effect to account for cryptic relatedness and population stratification. Age, sex, genotyping array and the first 20 genetic principal components were adjusted for in the analysis. We used a stringent quality control procedure corresponding to minor allele frequency (MAF ≥ 0.01) and imputation quality (INFO ≥ 0.60).
GWAS Meta-Analysis
A z-score meta-analysis of pneumonia summary statistics was conducted between the UK Biobank and Finngen samples using METAL v (2011–03–25). The final meta-analysis comprised 24,760 cases and 525,615 controls. Only variants passing quality control in both cohorts were included in the meta-analysis. Furthermore, variants with inconsistent allele frequencies in both cohorts (difference > 0.15) were removed. The final number of variants meta-analyzed and included in this study was 7,831,927. Independent genetic signals were identified by clumping (r2 < .05, and 1Mb window) using the complex traits genomics virtual lab (CTG-VL) web-platform (Cuellar-Partida et al., Reference Cuellar-Partida, Lundberg, Kho, D’Urso, Gutierrez-Mondragon and Hwang2019). A sensitivity analysis was performed by adjusting the GWAS results using multitrait conditional and joint analysis (mtCOJO) to simultaneously adjust for two smoking phenotypes: smoking history and cigarettes per day.
Gene-Based Analysis
Gene-based analysis was conducted on both the main and smoking adjusted GWAS using the ‘set-based association analysis for human complex traits’ fastBAT method (Bakshi et al., Reference Bakshi, Zhu, Vinkhuyzen, Hill, McRae, Visscher and Yang2016) available on CTG-VL (https://genoma.io). fastBAT performs a set-based enrichment analysis based on the GWAS summary statistics while accounting for linkage disequilibrium (LD) between single-nucleotide polymorphisms (SNPs). We tested the association between 24,443 genes and pneumonia using this method. Statistical significance was defined using Benjamini-Hochberg false discovery rate (FDR) 5% for multiple testing correction. Genes identified as statistically significant were further assessed for expression quantitative trait loci (eQTLs) colocalization with pneumonia.
Colocalization and eQTL
To assess the co-occurrence of signals in GWAS data and cis-eQTL data, we performed a summary-based colocalization analysis. We integrated our GWAS data and cis-eQTL data from lung tissue and whole blood in GTEx V7. We used GWAS and eQTL summary statistics of SNPs within 1Mb window around each fastBAT-identified gene to estimate the posterior probability that GWAS signals co-occur with eQTL signals while accounting for LD structure. This method estimates the posterior probabilities for five different scenarios: no association with either trait (PP0), association with the disease only (PP1), association with gene expression only (PP2), associations with both traits but distinct SNPs (PP3) and associations with both traits in same SNPs (PP4). A threshold of PP4 > 0.8 was considered the statistical cutoff for co-occurrence of GWAS signals and eQTL signals at the region of interest. Colocalization analysis was performed using the COLOC package in R.
Heritability and Genetic Correlations
We used LD-score regression (LDSC) to estimate the SNP-based heritability (hSNP2) for pneumonia on the liability scale, assuming prevalence estimates of UK Biobank (3.3%) as both sample and population prevalence. Genetic correlations (rG) between pneumonia and 1522 phenotypes were estimated using bivariate LDSC regression in CTG-VL based on a common set of HapMap3 variants. Benjamini-Hochberg FDR at 5% was used to assess statistical significance.
Genetic Causal Proportion
To assess whether significant genetic correlations observed could be explained by an underlying causal relationship between traits, we used the latent causal variable (LCV) method (O’Connor & Price, Reference O’Connor and Price2018) as implemented in CTG-VL. LCV uses GWAS summary statistics to estimate the genetic causal proportion (GCP) between two traits. The GCP’s absolute value ranges from 0 (no genetic causality) to 1 (full genetic causality). In our study, a high GCP value (GCP > 0.60) indicates that pneumonia is likely to affect the trait of interest. In contrast, a robust negative value (GCP < −0.60) provides evidence that the trait of interest is likely to affect pneumonia. For traits of interest (deep vein thrombosis [DVT], low-density lipoproteins [LDL] and cholesterol) with significant evidence of a causal effect on pneumonia, generalized summary data-based Mendelian randomization (GSMR) was used as a secondary assessment of the existence of a causal relationship.
Target Sample and Polygenic Risk Scoring
To assess the external validity of the GWAS, we performed polygenic based prediction on an independent target sample of 5595 unrelated Australian adults from the Australian Genetics of Depression Study (AGDS) with complete data (Byrne et al., Reference Byrne, Kirk, Medland, McGrath, Parker, Cross, Sullivan, Statham, Levinson, Licinio, Wray, Hickie and Martin2019). Pneumonia cases were identified through self-reported medical history in AGDS. Polygenic risk score (PRS) analysis was further adjusted for smoking by: (1) additionally including smoking history as a covariate and (2) performing PRS calculation using the summary statistics adjusted for smoking history and cigarettes per day. Smoking history was assessed with the item: ‘Have you smoked more than 100 cigarettes in your lifetime?’ We employed a recently developed method, SBayesR, to obtain the conditional effects of the studied variants, thus avoiding inflation arising from using correlated SNPs due to LD. Pneumonia PRSs were calculated using PLINK 1.9 in the AGDS sample. Briefly, a PRS is calculated by multiplying the effect size of a given risk allele (obtained from the discovery GWAS summary statistics) by the imputed number of risk alleles (using dosage probabilities) present in each individual. A weighted average was then obtained across all loci. To assess the association between pneumonia PRS and self-reported pneumonia history in AGDS, we used a logistic regression model (python statsmodels). Pneumonia PRS was the predictive variable of interest, with age, sex and the first 20 genetic ancestry principal components included as covariates.
Results
Prevalence of Pneumonia and Sample Demographics
The prevalence of lifetime pneumonia in the UK Biobank was 3.3%. Sex was associated with pneumonia, where females were less likely to have experienced the condition (female OR = 0.713 95% CI [0.69, 0.737]). Furthermore, participants with a history of pneumonia were on average older than controls (OR = 1.06; 95% CI [1.06, 1.07]). Smoking history was also associated with an increased pneumonia risk (OR = 1.74; 95% CI [1.68, 1.68]; see Table 1).
Genomewide association study (GWAS) UK Biobank sample composition

Note: Data for participants of European ancestry included in the GWAS.
Pneumonia GWAS
Our GWAS meta-analysis identified two independent genomewide significant variants on 15q25.1 (index SNPs rs2009746 and rs76474922; p < 5e−8; Figure 1a). The significant locus was located in a gene-rich region near IREB2, CHRNA3/5 and HYKK (Supplementary Figure 1). In addition, 18 independent loci showed suggestive association with pneumonia (Table 2). The amount of variance on the liability of pneumonia explained by this GWAS in the UK Biobank, also called the SNP heritability of the trait, for the whole meta-analysis was estimated at 0.03 (SE = 0.006) using LDSC regression. A sensitivity analysis using mtCOJO to adjust for smoking history and cigarettes per day revealed the hits on chromosome 15, but not other signals, to be mediated by smoking. A near genomewide signal in chromosome 3 became significant after conditioning on smoking phenotypes (Figure 1b). Notably, the genetic correlation between the unconditional and smoking conditional GWAS was high (rg = 0.9371, SE = 0.015).
Pneumonia genomewide association study (GWAS) meta-analysis (a) Manhattan plot shows the results of the GWAS meta-analysis. Each dot represents a genetic variant. The x-axis is the genomic location ordered by chromosome. The y-axis represents the statistical evidence of the association (−log10 transformed p value). The solid-red and dashed-blue lines represent the genomewide and suggestive association significance thresholds. (b) Manhattan plot shows the results of a sensitivity analysis using multitrait conditional and joint analysis to condition on smoking history and cigarettes per day. Note: the hit on chromosome 15 is no longer significant after this adjustment, while other signals remain largely unchanged.

Pneumonia GWAS meta-analysis and sensitivity results
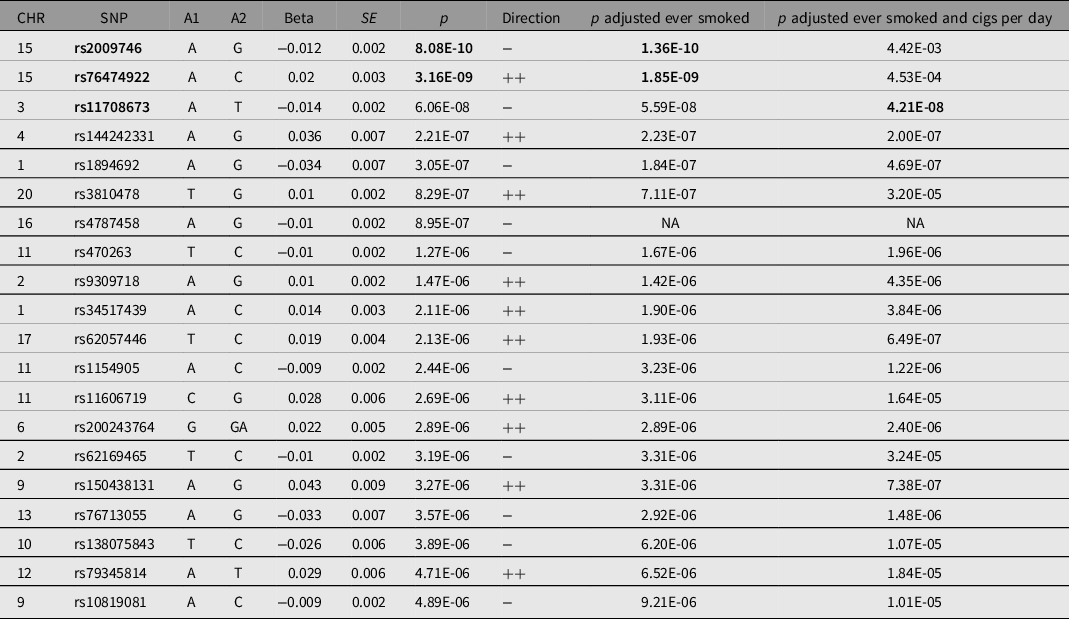
Note: Table shows all single single-nucleotide polymorphisms (SNPs) with at least suggestive evidence of association with pneumonia (p < 1e−5). *SNPs with genomewide significant evidence of association (p < 5e−8) are in bold. A1 = effect allele; A2 = noneffect allele; Beta = effect allele effect size; CHR = chromosome; Direction = direction of effect on UK Biobank and Finngen; SE = effect size standard error; SNP = variant identifier.
Gene-Based Analysis and Colocalization
We performed gene-based association testing followed by colocalization analysis to identify genes likely associated with pneumonia. fastBAT analysis revealed 18 genes in chromosomes 9,15 and 16 to be potentially associated with pneumonia risk (Supplementary Table 2). Sensitivity gene-based tests suggested the association of genes in chromosome 15, but not those in chromosomes 9 and 16, to be mediated by smoking (Figure 2). Three genes, HYKK, EIF3C and PBX3, showed some evidence of colocalization in lung tissue (Table 3). EIF3C also showed evidence of colocalization in whole blood (Supplementary Table 3). Nonetheless, none of these results satisfied the strict threshold of posterior probability of colocalization > 0.8. While IL27, CHRNA3 and CHRNA5 have eQTL signals in the vicinity of pneumonia hits, our analysis suggests that the relationship between their expression and pneumonia is better explained by two neighboring independent causal variants.
Gene-based test association results. Each dot represents a gene and its position on the y-axis corresponds to the p value for association with pneumonia adjusted for multiple testing. Genes in bold (black) were robust to adjustment for smoking phenotypes, whereas genes in nonbold (red) font were not. Genes above the red line are significantly associated with pneumonia, and were assessed for expression quantitative trait locus colocalization.

Colocalization of lung expression quantitative trait loci with pneumonia GWAS loci
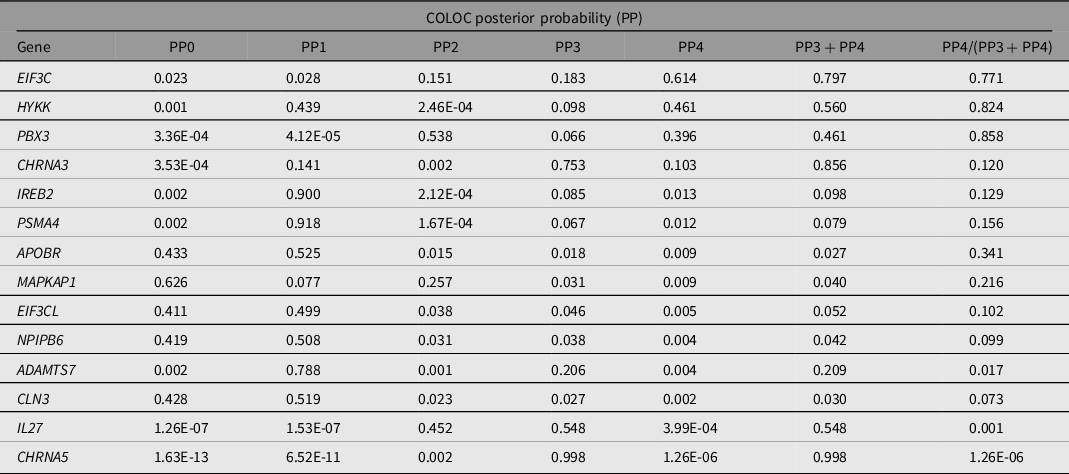
Note: PP0, no association with gene expression and pneumonia risk; PP1, association with gene expression only; PP2, association with pneumonia GWAS only; PP3, association with gene expression and pneumonia GWAS, but two distinct SNP; PP4, association with gene expression and pneumonia GWAS, shared SNP; NA, Not assessed. PP4 > 0.8 is considered evidence of colocalization.
LD-Score Genetic Correlations
Across 1522 traits studied, 552 traits displayed a genetic overlap with pneumonia at FDR < 5%. Traits with the strongest evidence of a genetic correlation with pneumonia included chronic obstructive pulmonary disease (COPD), ‘Wheeze or whistling in the chest in last year,’ blood clot in the leg and myocardial infarction (Figure 3). Lifestyle factors such as current smoking showed a positive genetic correlation with pneumonia, indicating that variants that increase smoking behavior also increase pneumonia risk. Genetic correlation between alcohol intake and pneumonia was conflicting, as the variable ‘Alcohol usually taken with meals’ and ‘Alcohol drinker status: current’ had a negative genetic correlation with pneumonia. In contrast, the variable ‘Alcohol drinker status: previous’ displayed a positive genetic correlation with pneumonia. Traits related to mood or psychiatric disorders (such as depression and irritability), lifestyle variables (such as cycling to work and educational attainment) and biomarkers (such as immune cell count and C Reactive Protein [CRP]), among others, also showed significant genetic correlations with pneumonia (Figure 3).
Pneumonia is genetically correlated with respiratory, circulatory, metabolic and lifestyle traits. Forest plot showing genetic correlations (rG) between pneumonia and traits of interest. Genetic correlations were estimated using bivariate linkage disequilibrium-score regression. All of the results shown are statistically significant. Due to space restrictions, the full results are available as Supplementary Data 1. Error bars represent standard errors of the genetic correlations.

GCPs
To assess whether the genetic correlations observed could be explained by a causal relationship, we performed an LCV analysis. Forty-four of the 552 traits with a significant (FDR < 5%) genetic overlap with pneumonia showed evidence of a causal association (see Methods). LCV provided genetic evidence on several traits causally associated with pneumonia, including DVT, LDL (decreased), cholesterol (decreased) among other traits closely related to cardiovascular health, such as heart failure, arrhythmias and fibrillation. Evidence for DVT, hypertension, LDL and the cholesterol causal associations were further assessed using GSMR. This analysis showed a consistent result for DVT and hypertension, but no evidence of causality for LDL or cholesterol (Supplementary Figure 2). Traits highlighted as potential consequences of pneumonia included long-standing illness, lower forced vital capacity, anhedonia, pain and taking omeprazole and co-codamol (Figure 4 and Supplementary Data 1).
Pneumonia causal association analysis. Causal architecture plot showing the results of a phenomewide latent causal variable analysis assessing the evidence for a causal association between pneumonia and other traits (see Methods). Each point represents a trait that showed a significant genetic correlation with pneumonia. The x-axis represents the genetic causal proportion; high values indicate evidence for a causal association between pneumonia and the trait of interest. Positive values indicate that pneumonia is likely to act as a risk factor for the trait (i.e., it causes the other trait). In contrast, negative values would highlight risk factors for pneumonia. Traits are colored based on their genetic correlation with pneumonia and indicate the direction of the causal association (i.e., increasing risk or decreasing risk). Trait or trait category labels with a color indicating the direction of the causal association have been added.

Polygenic Prediction of Pneumonia
We performed polygenic prediction of pneumonia on the AGDS sample to assess the validity of our pneumonia GWAS. The prevalence of self-reported pneumonia history (∼2000 cases, ∼20%) in the AGDS sample was higher than pneumonia diagnosis in the UK Biobank (∼15,000 cases, ∼3%) and FinnGen (∼10,000 cases, ∼10%). Furthermore, the AGDS sample had a different age and sex composition from the UK Biobank (Table 4). We assessed whether PRS derived from the pneumonia GWAS meta-analysis was associated with pneumonia in the AGDS cohort using a multivariate logistic regression (see Methods) and identified a statistically significant, but small in effect, association between pneumonia PRS and self-reported pneumonia OR = 1.06 (95% CI [1.01–1.12]; p = 0.02) per standard deviation increase of pneumonia PRS.
Target sample (Australian Genetics of Depression Study) composition and demographics

Note: Data for unrelated participants of European ancestry used for the replication and polygenic risk score (PRS).
* p < 0.05, two sample t test.
Sensitivity Analyses
The genomewide significant locus overlaps, and is in LD, with a set of well-established smoking-associated variants including rs16969968 (Saccone et al., Reference Saccone, Culverhouse, Schwantes-An, Cannon, Chen, Cichon, Giegling, Han, Han, Keskitalo-Vuokko, Kong, Landi, Ma, Short, Stephens, Stevens, Sun, Wang, Wenzlaff and Bierut2010). To assess whether the genetic associations for pneumonia are mediated by smoking, we performed several sensitivity analyses. A conditional association test showed that our top hit (rs2009746) evidence of association was reduced after adjusting for three independent smoking associated variants (prs2009746 = 0.002; Supplementary Table 4). Nonetheless, an mtCOJO analysis suggested the associations between pneumonia and genes in chromosomes 16 and 9 to be independent from smoking (Figures 1 and 2). Finally, the association between pneumonia PRS and self-reported pneumonia remained statistically significant after adjustment for smoking history both on the genetic and phenotypic level (Supplementary Table 5).
Discussion
Our findings highlighted 18 genes across chromosomes 6, 15 and 16 to be potentially associated with pneumonia risk. We identified genes involved in general gene regulation (PBX3, EIF3C), iron regulation (IREB2), nicotine signaling (CHRNA3/5) and inflammatory processes (IL27, APOBR). Here, we integrated eQTL data with our GWAS results and performed colocalization analysis to identify which genes have more robust evidence of association with pneumonia. Our analyses suggested EIF3C, HYKK and PBX3 gene expression to potentially colocalize with pneumonia. Nonetheless the evidence for colocalization was not sufficient (see Methods). Notably, PBX3 encodes a transcription factor whose deficiency has been linked to respiratory failure in mice (Rhee et al., Reference Rhee, Arata, Selleri, Jacobs, Arata, Onimaru and Cleary2004). HYKK is an enzyme involved in lysine catabolism and was recently linked to nicotine metabolism (Buchwald et al., Reference Buchwald, Chenoweth, Palviainen, Zhu, Benner, Gordon, Korhonen, Ripatti, Madden, Lehtimäki, Raitakari, Salomaa, Rose, George, Lerman, Pirinen, Martin, Kaprio, Loukola and Tyndale2020).
Genetic variants in 15q25.1 have been extensively linked with smoking (Bierut & Cesarini, Reference Bierut and Cesarini2015). This complex region has also been previously associated with COPD (Hardin et al., Reference Hardin, Zielinski, Wan, Hersh, Castaldi, Schwinder, Hawrylkiewicz, Sliwinski, Cho and Silverman2012) and lung cancer (McKay et al., Reference McKay, Hung, Han, Zong, Carreras-Torres, Christiani, Caporaso, Johansson, Xiao, Li, Byun, Dunning, Pooley, Qian, Ji, Liu, Timofeeva, Bojesen, Wu and Amos2017), and contains several compelling genes associated with nicotine addiction (CHRNA3, CHRNB4, CHRNA5, HYKK) and iron regulation (IREB2). We performed a sensitivity analysis and showed that 15q25.1 was not associated with pneumonia after adjusting for smoking history and cigarettes per day. Nonetheless, genes in other regions remained associated with pneumonia after adjusting for smoking. This is consistent with the observed high genetic correlation between the smoking-adjusted and unadjusted summary statistics. Moreover, polygenic prediction was also robust to adjustment for smoking history. Future efforts could leverage analyses such as pairwise GWAS or genomic structural equation modelling to further deconvolute the effects of smoking and respiratory disease. We consider this beyond the scope of the present study.
We discovered genetic correlations between pneumonia and biomarkers such as immune cell counts, cystatin C and sodium in urine. Consistently, cystatin C and CRP levels have been linked to community-acquired pneumonia (CAP; García Vázquez et al., Reference García Vázquez, Martínez, Mensa, Sánchez, Marcos, de Roux and Torres2003; Holloway et al., Reference Holloway, Yu, Arulanandam, Hoskinson and Eaves-Pyles2018). Furthermore, lifestyle factors such as smoking and lower socioeconomic status (as measured by the Townsend deprivation index) were genetically correlated with pneumonia. Finally, traits requiring healthy respiratory function such as cycling to work and maximum workload during a fitness test displayed a negative genetic correlation with pneumonia.
A genetic correlation between two traits could reflect causality between traits, or horizontal pleiotropy (genes acting on both traits independently of each other). Here, we performed LCV analyses to identify traits causally associated with pneumonia. Our results suggest that DVT may causally increase risk of pneumonia. This result was further confirmed using GSMR. Previous studies have noted an association between these two diseases (Rae et al., Reference Rae, Finch and Chalmers2016). Most studies suggest or assume that pneumonia causes DVT due to immobilization, hypoxia and inflammation. Hypoxia is one of the strongest predictors of pneumonia (Rae et al., Reference Rae, Finch and Chalmers2016) and has been shown to increase the incidence of thrombosis through the downregulation of protein S, a natural anticoagulant (Pilli et al., Reference Pilli, Datta, Afreen, Catalano, Szabo and Majumder2018). Furthermore, tissue factor, along with coagulation-related pathways, are known to be upregulated upon inflammation (Esmon, Reference Esmon2003). Future studies should focus on further understanding of the intricate relationship between cardiovascular and respiratory diseases.
LCV also highlighted the potential involvement of cholesterol levels and specifically LDL in the risk for pneumonia. Nonetheless, these results did not replicate in our GSMR analyses. Cholesterol is essential for cellular integrity and metabolism, and its dysregulation has been linked to a variety of diseases, including cardiovascular and pulmonary disease (Ravnskov, Reference Ravnskov2003). Previous studies show that LDL and high-density lipoproteins (HDL) trafficking influences multiple cell types in the lung (Gowdy & Fessler, Reference Gowdy and Fessler2013). Class A scavenger receptors on alveolar macrophages uptake HDL as a source of vitamin E (Kolleck et al., Reference Kolleck, Schlame, Fechner, Looman, Wissel and Rüstow1999), which is an antioxidant that plays an essential role in the clearance of oxidized lipids that would otherwise result in cytotoxic and pro-inflammatory responses (Fessler, Reference Fessler2017). Furthermore, cholesterol plays an essential role in protecting and covering the alveoli, which prevents several pathological conditions (Andersson et al., Reference Andersson, Grey, Larsson, Ferreira and Sparr2017). Thus, total cholesterol might protect from developing pneumonia through the relationship between cholesterol and immune homeostasis in the lung. Nevertheless, low levels of LDL have been associated with better lung function (Barochia et al., Reference Barochia, Kaler, Cuento, Gordon, Weir, Sampson, Fontana, MacDonald, Moss, Manganiello, Remaley and Levine2015), and low HDL levels have been proposed as a poor prognosis marker for CAP (Chien et al., Reference Chien, Chen, Hsu, Chen and Yu2015). Moreover, a recent proteomic study in patients with sepsis secondary to pneumonia were found to have an impairment in lipid metabolism (lower total cholesterol, LDL cholesterol, as well as major apolipoprotein of LDL, ApoB; Sharma et al., Reference Sharma, Ferreira, Tashima, Brunialti, Torquato, Bafi, Assuncao, Azevedo and Salomao2019) This is consistent with our gene-based tests identifying the APOBR as a potential pneumonia risk mediating gene. Overall our findings and the literature suggest that a dyslipidemic state, rather than specific levels of LDL influence pneumonia risk.
Some limitations of the present study must be acknowledged. Pneumonia was ascertained through ICD10 codes, which might contain biases implicit in health records (Dueñas et al., Reference Dueñas, Seah, Johnson and Huckins2020). Thus, genetic signals will include a range of underlying factors such as smoking or socioeconomic status and disorders such as asthma and COPD. Future studies would benefit from performing within case analyses to identify genetic factors that modify disease outcomes such as pneumonia. This will be increasingly challenging as our results suggest pneumonia to be rather complex and polygenic, thus requiring a sufficient number of cases to perform genetic analyses. We excluded participants of non-European ancestry to avoid biases due to population stratification. This limits the generalizability of our findings to populations of non-European ancestry. Furthermore, our results suggest that the genetic risk for pneumonia is highly complex, and several variants remain to be identified by more powered studies. Further evidence of this is the low polygenic prediction in an independent sample, which is still far from other traits where clinical relevance is starting to be considered. This could be explained by the differences the AGDS cohort has with the UK Biobank and Finngen. For example. ADGS is a depression-enriched sample, and pneumonia was ascertained through self-reported rather than ICD10 diagnosis. We replicated LCV findings using GSMR. Nonetheless, we could not attempt to replicate any of the causal associations where pneumonia was the exposure because our pneumonia GWAS was underpowered to be accurately used as an exposure. Finally, experimental approaches along with powered analyses considering not only smoking history but also smoking exposure and quantitative smoking measures are needed to claim, beyond any doubt, 15q25.1 to be associated with pneumonia over and above smoking.
In summary, pneumonia GWAS meta-analysis identified a region in 15q25.1 which has been previously linked to smoking, lung cancer and COPD. Gene-based tests association identified 18 genes implicated in pneumonia risk in chromosomes 9, 15 and 16. Sensitivity analyses suggested the locus in chromosome 15 to be driven by smoking, but other associations were robust to adjustment for smoking-related traits. We identified traits with a significant genetic correlation and highlighted potential causally associated traits, including DVT and lipid homeostasis. Finally, validation of our GWAS was obtained by polygenic prediction of self-reported history of pneumonia in an independent sample. Polygenic prediction was robust to adjustment for smoking history either at the PRS level, phenotypic level or both, thus suggesting some independence of our GWAS signals from smoking history. Increasing statistical power could help identify additional genetic targets which will, in turn, enable the development of new therapeutics and patient risk stratification based on genetic risk.
Data availability
Individual level data for UK Biobank participants are available to eligible researchers through the UK Biobank (www.biobank.ac.UK). Results for the GWAS downstream analyses have been made available in CTG-VIEW (https://view.genoma.io). Code used for this study is available upon request.
Acknowledgments
This research was conducted using data from the UK Biobank resource under Application Number 25331. The authors want to acknowledge the participants and investigators of the FinnGen study. Data collection for the Australian Genetics of Depression Study was possible, thanks to funding from the Australian National Health & Medical Research Council (NHMRC) to N.G.M. (GNT1086683). A.I.C. and K.X.V.P. are both supported by The University of Queensland (UQ) Research Training Scholarships from UQ. P.F.K. is supported by an Australian Government Research Training Program Scholarship from Queensland University of Technology (QUT). M.E.R. thanks support of the NHMRC and Australian Research Council (GNT1102821).
Author contributions
AIC conceived the study. AIC and PFK performed the analyses with aid and input from NGM, GCP and MER. KXVP and LGM helped interpreting the results. NGM designed and directed the AGDS. All authors collaboratively wrote the manuscript.
Supplementary material
To view supplementary material for this article, please visit https://doi.org/10.1017/thg.2021.27.



