


Introduction
Infrastructures associated with wind energy production have been an important focus of biodiversity conservation (Katzner et al. Reference Katzner, Nelson, Diffendorfer, Duerr, Campbell and Leslie2019). Wind turbines generate approximately 8% of the total energy produced worldwide (https://www.iea.org/energy-system/renewables), but are also known to impact species and ecosystems. Wind turbines decrease the quality of natural habitats (Diffendorfer et al. Reference Diffendorfer, Dorning, Keen, Kramer and Taylor2019), affect animal behavioural patterns (Tolvanen et al. Reference Tolvanen, Routavaara, Jokikokko and Rana2023), and increase wildlife mortality through collisions with rotating blades (Marques et al. Reference Marques, Batalha, Rodrigues, Costa, Pereira and Fonseca2014; Thaxter et al. Reference Thaxter, Buchanan, Carr, Butchart, Newbold and Green2017; Voigt Reference Voigt2021). These impacts are particularly concerning for those areas of the world where terrestrial ecosystems are already characterised by a high human footprint, such as Europe (Venter et al. Reference Venter, Sanderson, Magrach, Allan, Beher and Jones2016). In fact, in these areas human activities already negatively affect wildlife populations and habitats due to a variety of mechanisms and long-term cumulative impacts (DeFries et al. Reference DeFries, Foley and Asner2004; McKee et al. Reference McKee, Chambers and Guseman2013), thereby increasing their vulnerability to the development of additional infrastructures, such as wind turbines.
The ecological impacts of wind power development could also indirectly affect human well-being, by disrupting crucial ecosystem services through increased mortality in keystone taxonomic groups (e.g. bats; Ramírez-Fráncel et al. Reference Ramírez-Fráncel, García-Herrera, Losada-Prado, Reinoso-Flórez, Sánchez-Hernández and Estrada-Villegas2022; raptors; Donázar et al. Reference Donázar, Cortés-Avizanda, Fargallo, Margalida, Moleón and Morales-Reyes2016; Estellés-Domingo and López-López Reference Estellés‐Domingo and López‐López2025; Monteagudo et al. Reference Monteagudo, Benayas, Andivia and Rebollo2023; Whelan et al. Reference Whelan, Wenny and Marquis2008). In this sense, the impact of wind power development on vultures is of particular concern (Santangeli et al. Reference Santangeli, Girardello, Buechley, Botha, Minin and Moilanen2019). Vultures are apex scavengers delivering irreplaceable ecosystem services, such as the mitigation of greenhouse gas emissions, the disposal of organic materials, and the containment of zoonotic diseases (Carucci et al. Reference Carucci, Whitehouse-Tedd, Yarnell, Collins, Fitzpatrick and Botha2022; Santangeli et al. Reference Santangeli, Lambertucci, Margalida, Carucci, Botha and Whitehouse-Tedd2024). However, because of their low flight manoeuvrability and foraging behaviour, involving low-altitude flight while looking at the ground in search of carcasses (Martin et al. Reference Martin, Portugal and Murn2012), vultures are particularly exposed to collision risk. Griffon Vulture Gyps fulvus is reported as the most frequently killed raptor species on wind farms (0.41 deaths/turbine/year; de Lucas et al. Reference De Lucas, Ferrer, Bechard and Muñoz2012). This high mortality rate, combined with their low annual productivity, slow maturity, and density-dependent processes (Margalida et al. Reference Margalida, Jiménez, Martínez, Sesé, García‐Ferré and Llamas2020) is thought to undermine the population viability of this species and vultures in general (Thaxter et al. Reference Thaxter, Buchanan, Carr, Butchart, Newbold and Green2017). The foreseen global expansion of onshore wind farms and their associated electricity grid, particularly near vulture colonies and foraging grounds (Carrete et al. Reference Carrete, Sánchez-Zapata, Benítez, Lobón, Montoya and Donázar2012), is therefore expected to increase mortality in many vulture populations (Bounas et al. Reference Bounas, Vasilakis, Kret, Zakkak, Chatzinikolaou and Kapsalis2025; Serrano et al. Reference Serrano, Margalida, Pérez-García, Juste, Traba and Valera2020), with consequences on their long-term viability (Carrete et al. Reference Carrete, Sánchez-Zapata, Benítez, Lobón and Donázar2009). This risk is particularly concerning for the conservation of European vulture populations, as Europe emerged as a stronghold for the guild (Terraube et al. Reference Terraube, Andevski, Loercher and Tavares2022) after the large declines of Asian and African vulture populations that pushed some species to the brink of extinction (Ogada and Buij Reference Ogada and Buij2011).
Maps of existing and planned wind turbines represent the first crucial information needed to identify areas of high collision risk and thus to design conservation strategies and mitigation measures for vultures as well as any other species (Morant et al. Reference Morant, Arrondo, Sánchez-Zapata, Donázar, Margalida and Carrete2024). Nevertheless, while several studies have already tested different methods for fine-scale risk assessment (Khosravifard et al. Reference Khosravifard, Skidmore, Naimi, Venus, Muñoz and Toxopeus2020; Péron et al. Reference Péron, Fleming, Duriez, Fluhr, Itty and Lambertucci2017), or to generate risk maps for vultures at large spatial scales (Cervantes et al. Reference Cervantes, Murgatroyd, Allan, Farwig, Kemp and Krüger2023; Gauld et al. Reference Gauld, Silva, Atkinson, Record, Acácio and Arkumarev2022; Morant et al. Reference Morant, Arrondo, Sánchez-Zapata, Donázar, Margalida and Carrete2024), no study has considered to what extent differences between available data sources on wind turbine locations can affect the identification of areas of high collision risk. This gap is considerable because in many countries the proliferation of wind turbines has not been coupled with the implementation, by local authorities, of official wind turbines data sets complying with well-established standards of quality (Sequeira et al. Reference Sequeira, O’Toole, Keates, McDonnell, Braun and Hoenner2021). In the rare cases where official wind turbines data sets are provided by local authorities, these are not regularly updated (Balotari-Chiebao et al. Reference Balotari-Chiebao, Santangeli, Piirainen and Byholm2023), causing risk assessment estimates to ignore newly constructed turbines.
Therefore, risk assessments have to rely on non-validated or outdated wind turbines data sets (e.g. Gauld et al. Reference Gauld, Silva, Atkinson, Record, Acácio and Arkumarev2022; Morant et al. Reference Morant, Arrondo, Sánchez-Zapata, Donázar, Margalida and Carrete2024), or often even on maps of wind energy ‘potential’, i.e. areas with the most suitable wind conditions for the construction of wind farms (Santangeli et al. Reference Santangeli, Girardello, Buechley, Botha, Minin and Moilanen2019). This heterogeneity in the accuracy and type of data sources is expected to hinder the comparability of risk assessments and challenge their reliability. Recently, Cerri et al. (Reference Cerri, Costantino, De Rosa, Banič, Urgeghe and Fozzi2024) found that non-validated and outdated data sources severely underestimated the number of wind turbines that are effectively present in the environment, at least in areas of intensive wind energy development, both due to incomplete spatial coverage and temporal lags. While it might seem trivial that using non-validated and/or outdated wind turbine data results in the underestimation of areas with a potentially high risk of collision, the magnitude of this underestimation is yet to be investigated.
In this study, we quantified this underestimation on a population of Griffon Vultures in Sardinia. Sardinia is the second largest island in the Mediterranean Sea and it hosts a stable population of Griffon Vultures, while at the same time facing large-scale wind energy development (Cerri et al. Reference Cerri, Costantino, De Rosa, Banič, Urgeghe and Fozzi2024). Here we used movement data (GPS and accelerometer) from six adult Griffon Vultures to identify feeding events on the island. For vultures, foraging is regarded as the behaviour that is most sensitive to the presence of wind turbines (Martin et al. Reference Martin, Portugal and Murn2012), and while in Sardinia sensitive areas around the main colonies (Cerri et al. Reference Cerri, Fozzi, De Rosa, Aresu, Apollonio and Berlinguer2023) are already protected by landscape regulations from the Natura 2000 network, foraging grounds also extend into areas with no restrictions on wind energy development. There is therefore a need to quantify the present and future collision risk in these low protection areas. To do so, we used the overlap between the intensity of foraging ground utilisation and wind turbine locations as a proxy for collision risk. As a reference data set representing the locations of wind turbines that are effectively present in the environment, we used the map provided by Cerri et al. (Reference Cerri, Costantino, De Rosa, Banič, Urgeghe and Fozzi2024). To the best of our knowledge, this data set represents the most complete and updated wind turbine data set available for the island of Sardinia, as official data sets from local authorities are not available. In order to quantify how the use of incomplete or outdated data affected our proxy for collision risk, we compared the proxy obtained using the data set from Cerri et al. (Reference Cerri, Costantino, De Rosa, Banič, Urgeghe and Fozzi2024) with that obtained using two other commonly used wind turbine data sets: (1) OpenStreetMap (OSM), an incomplete data set which underestimates the number of turbines in the study area; (2) a map available from Smeraldo et al. (Reference Smeraldo, Bosso, Fraissinet, Bordignon, Brunelli and Ancillotto2020), which at the time of this study was three years out of date. Moreover, considering that Sardinia is highly suitable for wind power development and is facing an increase in onshore wind farms, we used information obtained from projects submitted to the Ministry of the Environment (n = 102) (Supplementary material Figure S1) to appreciate how future wind farms could increase areas of high collision risk.
Methods
Study area
The study area included the north-western portion of Sardinia (Figure 1). Sardinia hosts a population of approximately 420–470 Griffon Vultures, which concentrate their movements between two main colonies in the north-western part of the island (Cerri et al. Reference Cerri, Fozzi, De Rosa, Aresu, Apollonio and Berlinguer2023).
Left: location of wind turbines in Sardinia in 2023 (blue dots) and planned turbines (red dots), according to Cerri et al. (Reference Cerri, Costantino, De Rosa, Banič, Urgeghe and Fozzi2024). Right: foraging intensity and foraging grounds of Griffon Vultures in Sardinia resulting from the analysis of accelerometers. Darker areas correspond to those portions of the foraging grounds with the highest foraging intensity. The location of the colony is represented by a triangle in Punta Cristallo and a star in Bosa.

In Italy, planned wind farms are subjected to a preliminary environmental impact assessment, but there is no mandatory standard on the design of monitoring protocols (Christie et al. Reference Christie, Amano, Martin, Shackelford, Simmons and Sutherland2019). Moreover, a post-construction impact assessment is not mandatory and, even if carried out, there is no standard protocol for an accurate estimation of the number of animals killed by the turbines. Therefore, best practices, such as the use of trained dogs (Nilsson et al. Reference Nilsson, Molværsmyr, Breistøl and Systad2023), or the estimation of carcass removal by scavengers (Ravache et al. Reference Ravache, Barré, Normand, Goislot, Besnard and Kerbiriou2024), are not implemented. Finally, in case an impact is highlighted by non-mandatory assessment, there is no legal obligation to implement mitigation measurements, such as selective turbine stopping (Ferrer et al. Reference Ferrer, Alloing, Baumbush and Morandini2022). Despite the lack of monitoring schemes at wind farms, in the study area, at least three Griffon Vultures mortality events due to collision with wind turbines have been documented since 2014.
Wind turbine data sources
To our knowledge, no officially recognised map of wind turbines is publicly available for the study area. We therefore relied on three unofficial but publicly available data sets of wind energy infrastructures in Sardinia: (1) OSM https://www.openstreetmap.org), an open-source GIS where infrastructures are georeferred by volunteers, and is widely used in ecology and conservation (Assandri et al. Reference Assandri, Bazzi, Bermejo-Bermejo, Bounas, Calvario and Catoni2024; Boggie et al. Reference Boggie, Butler, Sesnie, Millsap, Stewart and Harris2023; Dunnett et al. Reference Dunnett, Sorichetta, Taylor and Eigenbrod2020, Reference Dunnett, Holland, Taylor and Eigenbrod2022; Gauld et al. Reference Gauld, Silva, Atkinson, Record, Acácio and Arkumarev2022; Ibisch et al. Reference Ibisch, Hoffmann, Kreft, Pe’er, Kati and Biber-Freudenberger2016; Marques et al. Reference Marques, Palma, Lourenço, Cangarato, Leitão and Mascarenhas2022; Palacín et al. Reference Palacín, Farias and Alonso2023); (2) a map published by Smeraldo et al. (Reference Smeraldo, Bosso, Fraissinet, Bordignon, Brunelli and Ancillotto2020), who validated multiple pre-existing data sets through satellite images and created a map of wind turbines operating in Italy in 2019–2020; (3) a map recently published by Cerri et al. (Reference Cerri, Costantino, De Rosa, Banič, Urgeghe and Fozzi2024), representing wind turbines that were effectively present in the study area in September/October 2023, according to the most recent high-resolution aerial images available on Google Satellite.
Finally, to appreciate the potential increase in wind turbines in the study area, across the next few years, we used another data set from Cerri et al. (Reference Cerri, Costantino, De Rosa, Banič, Urgeghe and Fozzi2024). This data set was constructed by querying projects that, in March 2024, were undergoing the mandatory preliminary impact assessment procedure by the Italian Ministry for the Environment (https://va.mite.gov.it/it-IT/Ricerca/ViaTipologia). For each project, the authors of the study downloaded the impact assessment report and manually georeferenced each wind turbine. Although several years could pass from project submission to the construction of a wind farm, this data set contains the maximum number of turbines which could be built in the study area in the near future, assuming all wind farm projects are approved (n = 1,026). Collision risk estimates obtained from this data set therefore represent a worst-case scenario.
Identification of feeding events and foraging grounds
Griffon Vultures are more prone to collide with wind turbines while foraging (Martin et al. Reference Martin, Portugal and Murn2012). Therefore, we assumed that, within areas where vulture regularly forage (hereinafter ‘foraging grounds’), those sectors with the highest density of feeding events are those where collision risk is the greatest.
As a first step, we identified feeding events using a combination of GPS and accelerometer data. We used GPS–accelerometer data from six Griffon Vultures (see Table 1) that had been translocated within the LIFE Under Griffon Wings (LIFE14 NAT/IT/000484) and LIFE Safe for Vultures (LIFE19 NAT/IT/000732) projects.
Characteristics of released Griffon Vultures

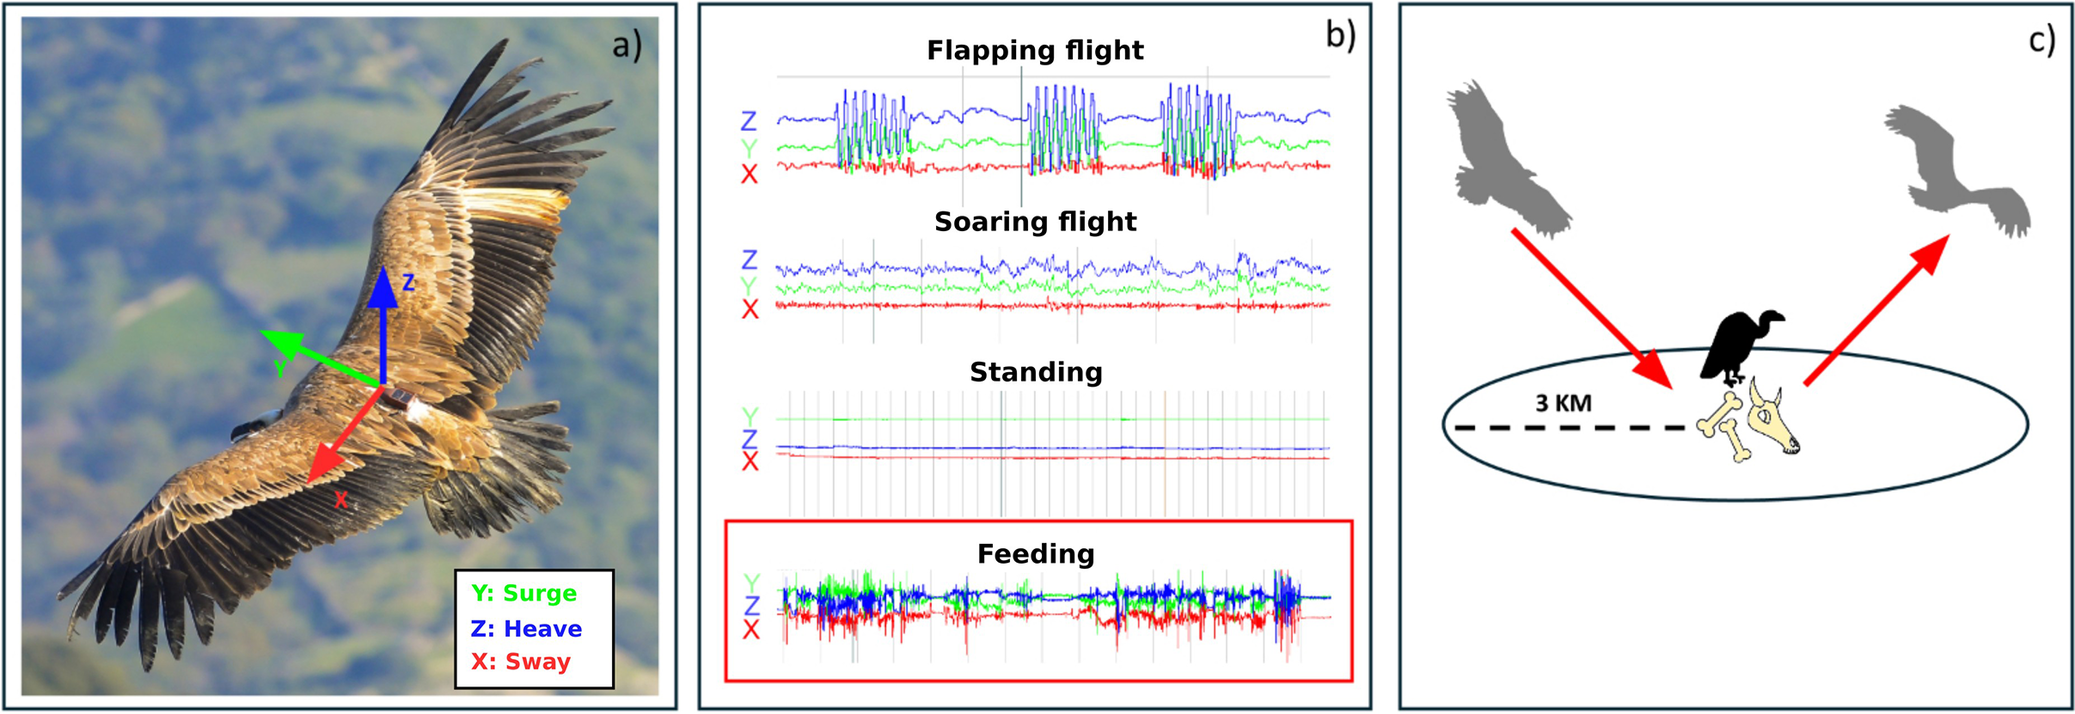
Griffon Vultures were equipped with Ornitela 3G_50 g GPS/GSM devices with accelerometers, attached with a Teflon leg-loop harness consisting of three assembled strings (round silicone cord 2 mm + tubular teflon ribbon 0.2500 and 0.4400) as recommended by Hegglin et al. (Reference Hegglin, Wehrle and Aebischer2004). Transmitters and rings did not exceed 3% of the birds’ body mass (Bodey et al. Reference Bodey, Cleasby, Bell, Parr, Schultz and Votier2018). GPS–accelerometer devices were fitted by following best practice in animal welfare – the heads of the birds were covered to guarantee minimal stress, and the transmitter placement time was reduced to less than 10 minutes. Accelerometers recorded gravitational and inertial acceleration in three axes, corresponding to the anterior–posterior (surge), dorso–ventral (heave), and lateral (sway) axis (Figure 2). When the battery level was higher than 70%, accelerometer data were collected every minute, in bursts of 10 consecutive seconds, at a frequency of 20 Hz.
Overview on how collision risk was calculated: accelerometers recorded triaxial acceleration of Griffon Vultures (a), whose patterns were visually analysed with the software Firetail to identify feeding events (b). Finally, by combining GPS, flight altitude values, and accelerometer patterns, a 3-km radius around feeding events was identified, corresponding to the distance at which Griffon Vultures landed, fed, and left again (c). In this 3-km radius, Griffon Vultures were deemed to be susceptible to intercepting and colliding with rotating blades.
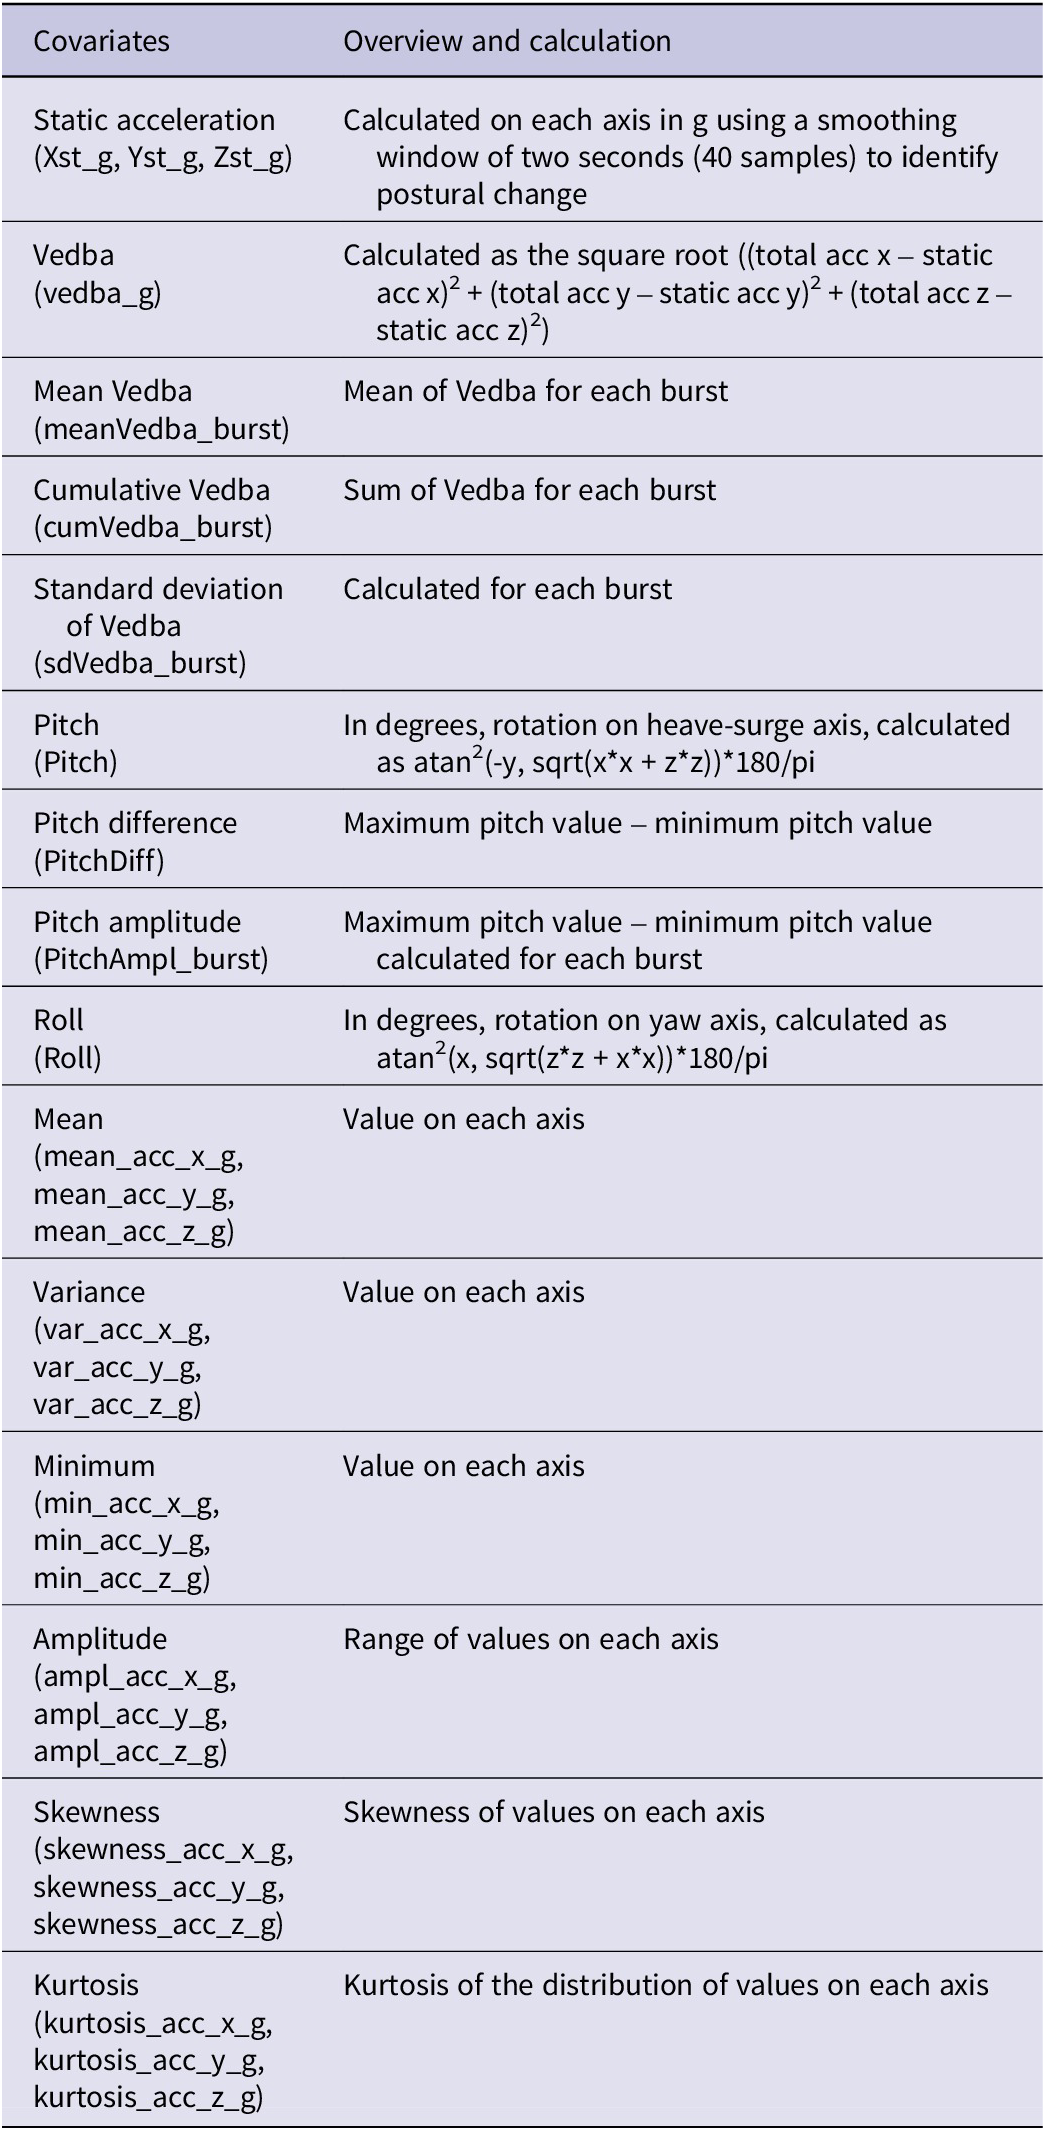
We obtained evidence of feeding events both in the wild with camera traps and direct observations of a captive individual in the aviary of a wildlife recovery centre that had been equipped temporarily with an Ornitela tag with accelerometer. We also collected direct observations in the wild of other behaviours. We examined the exact time of feeding events and other behaviours and then visually inspected the acceleration patterns of four different behaviours (feeding, soaring flight, flapping flight, standing) with the software Firetail (Berger et al. Reference Berger2023). Since the pattern of every behaviour is recognisable on Firetail, starting from the validated behaviour we performed a visual classification of feeding events, also using information on speed and altitude. We then constructed a labelled data set of feeding events that we used to train a classification random forest (Breiman Reference Breiman2001), calculating summary statistics from the accelerometer data for each burst (Table 2) and using them as predictors for the model. Random forests were tuned with 10-fold cross validation, by using 80% of the data set as training set for the model and 20% as test set. Random forests and their cross-validation were fitted through the randomForest (Breiman et al. Reference Breiman, Cutler, Liaw, Wiener and Liaw2018) and caret R (Kuhn et al. Reference Kuhn2008) packages. Once trained on our labelled data set, we used the random forest model to classify new data and identify feeding activity. We defined a feeding event as a sequence of consecutive acceleration bursts classified as feeding, and to minimise classification errors we retained only those events lasting at least five minutes (i.e. ≥five consecutive bursts, given our settings of accelerometer data collected every minute in bursts of 10 consecutive seconds at a frequency of 20 Hz). Each burst was associated with the closest GPS fix in time (maximum tolerance 300 seconds). For each event, we then calculated the mean of the GPS coordinates of its constituent bursts to obtain a single centroid. This centroid represents the spatial location of the feeding event while accounting for natural GPS error.
Summary statistics used in the random forest analysis as predictors for the classification of acceleration data
In order to identify foraging grounds from the feeding events identified above, we used kernel density estimation (KDE) to estimate the density of feeding events. Given the high spatial overlap in the location of feeding events, both across individuals and across years, we applied KDE on all feeding event centroids. Considering the gregarious habits of Griffon Vultures while foraging (Cortés-Avizanda et al. Reference Cortés-Avizanda, Jovani, Donázar and Grimm2014), and the fact that only two colonies occur in north-west Sardinia, as well as the fact that feeding events were stable across years and between individuals (Figures S2 and S3), we assumed that the density of feeding events for our six Griffon Vultures represents the foraging grounds of the entire population of Griffon Vultures in Sardinia. KDE was made using the ‘hr_kde’ function of the amt R package (Signer et al. Reference Signer, Fieberg and Avgar2019), which computes the reference bandwidth calculation according to Worton (Reference Worton1989).
From the spatial distribution of the density of feeding events, we identified foraging grounds by removing those cells whose density was lower than the 95% isopleth. These included mainland areas where Griffon Vultures were extremely unlikely to forage, as well as the sea, where foraging events cannot take place.
Identification of areas of high collision risk
We identified areas of high collision risk in our four wind turbines data sets by calculating the percentage of the total density of feeding events located within a radius of 3 km around wind turbines.
We assumed that Griffon Vultures were prone to collide with wind turbines when descending or departing from the ground, as they would fly at the same height as the rotors of most wind turbines (15–210 m; Morant et al. Reference Morant, Arrondo, Sánchez-Zapata, Donázar, Margalida and Carrete2024). We checked existing literature on the biomechanics of flight in vultures but could not find any clear information on the distance that Griffon Vultures need to land and take off, relative to their food source. To estimate these distances, we conducted a visual analysis of acceleration patterns using the software Firetail.
For each identified landing and take-off event, we extracted the altitude, speed, and GPS coordinates of two key locations: (1) the last position where the bird was airborne, and (2) the first position where the bird was on the ground. For take-off events, the same procedure was applied in reverse. To approximate flight altitude, we obtained the ground elevation at each GPS position using Google Earth and subtracted it from the GPS-recorded altitude provided by the tag. Finally, we estimated the linear ground distance required for landing and take-off by measuring the linear distance between the last airborne location and the first on-ground location.
This allowed us to estimate the distance required for both landing and take-off. Due to the GPS settings and accelerometer data configuration, which provided a two-minute fix rate only when the battery level exceeded 70%, we were limited in the number of individuals analysed. We manually identified a total of 29 landings and 28 take-offs. Griffon Vultures required 2,355 ± 561 m (mean ± standard deviation) for their landings and 2,524 ± 527 m to take-off.
Therefore, we chose a radius of 3 km around each turbine, and by aggregating the area around all the wind turbines in a certain data set, we estimated the total area where Griffon Vultures were at risk of collision while foraging (hereinafter named ‘area at risk’). However, the density of feeding events was not constant across foraging grounds (see Results), and considering the whole area as having the same level of risk would have been misleading. Therefore, to obtain a more realistic proxy of collision risk, we calculated the percentage of the density of feeding events included in the area at risk. In practice, we (1) summed the values of those cells from the spatial distribution of the density of feeding events that were included in the area at risk, (2) divided this value by the total of all cells from the spatial distribution, and (3) multiplied this ratio by 100. By doing so, 1 ha of area at risk resulting from wind turbines occurring in the areas with the highest density of feeding events, led to a much higher risk of collision than 1 ha of area at risk at the borders of foraging grounds, where the density of feeding events was low. We calculated this value according to wind turbines from OSM (Smeraldo et al. Reference Smeraldo, Bosso, Fraissinet, Bordignon, Brunelli and Ancillotto2020) and from the two data sets in Cerri et al. (Reference Cerri, Costantino, De Rosa, Banič, Urgeghe and Fozzi2024).
To enhance readability, we will henceforth refer to the ‘density of feeding events’ simply as ‘foraging intensity’.
Statistical analyses were carried out using the statistical software R (R Core Team 2024).
Results
The random forest model based on acceleration summary statistics identified 1,563 feeding events across the six vultures between May 2020 and March 2024 (random forest accuracy = 0.99, precision = 0.99, recall = 0.99; Figure S4).
When considering predictors that affected model accuracy, if excluded, the most important ones were the mean acceleration value on the x axis (mean_acc_x_g), the skewness of acceleration value on the y axis (skewness_acc_y_g), and the difference between the maximum and minimum pitch value calculated for each burst (PitchAmpl_burst). When considering predictors that contributed to the homogeneity of nodes and leaves in the random forest, the most important variables were the maximum acceleration value on the y axis (max_acc_y_g), the range of ACC value on the y axis (ampl_acc_y_g), and the variance of ACC values on the x axis (var_acc_x_g; Figure S5).
Foraging grounds covered an area of approximately 2,286 km2. Areas with the highest foraging intensity were located in the backcountry of the main colony in Bosa, but also in the backcountry of the secondary colony, in Punta Cristallo (Figure 1).
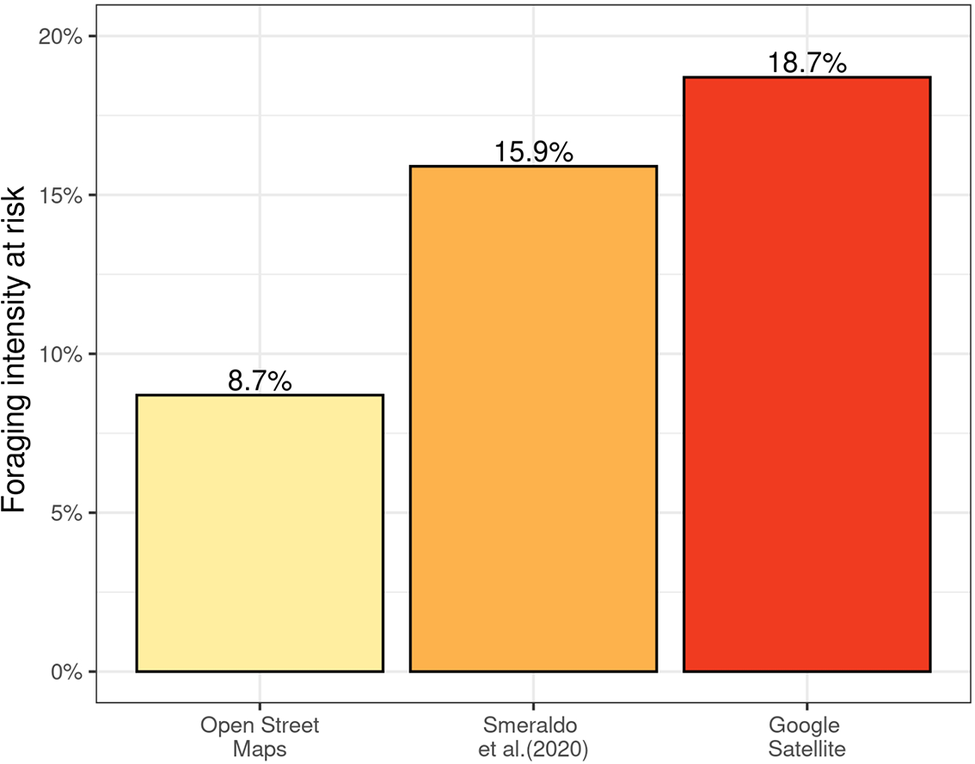
The three data sources showed different numbers of turbines, with Cerri et al. (Reference Cerri, Costantino, De Rosa, Banič, Urgeghe and Fozzi2024) having the highest number (n = 1,155), followed by Smeraldo et al. (Reference Smeraldo, Bosso, Fraissinet, Bordignon, Brunelli and Ancillotto2020) (n = 914), and by OSM (n = 744). Therefore, buffers applied on the wind turbines obtained from these different data sets resulted in very different percentages of foraging grounds having a high risk of collisions (Figures 3 and S6). The buffers around the turbines from OSM encompassed approximately 8.7% of foraging intensity, while turbines that were effectively present in 2023, according to aerial pictures, encompassed 18.7% of it. As for turbines mapped from satellite imagery by Smeraldo et al. (Reference Smeraldo, Bosso, Fraissinet, Bordignon, Brunelli and Ancillotto2020), only four years before this study, these underestimated collision risk by encompassing only 15.3% of foraging intensity.
Percentage of foraging intensity where Griffon Vultures can be at risk of collision with wind turbines, when considering wind turbines mapped on OpenStreetMap (OSM), turbines mapped by Smeraldo et al. (Reference Smeraldo, Bosso, Fraissinet, Bordignon, Brunelli and Ancillotto2020), and turbines detected through aerial images on Google Satellite by Cerri et al. (Reference Cerri, Costantino, De Rosa, Banič, Urgeghe and Fozzi2024). See Figure S2 for a map of the three different data sets.

When pooling turbines present in the study area in late 2023, with those contained in the wind farms projects under evaluation by the Ministry for the Environment (representing the worst-case scenario of wind energy development in the study area), we found that, should all projects be approved, 31.4% of foraging intensity would be at risk of collision. Under this scenario, the area with the highest foraging intensity, in the backcountry of the main colony in Bosa, would be completely surrounded by wind turbines (Figure 4).
Percentage of foraging intensity where Griffon Vultures can be at risk of collision with wind turbines. (a) Comparison between existing wind turbines and turbines that will be built in the next few years, according to Cerri et al. (Reference Cerri, Costantino, De Rosa, Banič, Urgeghe and Fozzi2024). (b) Portion of foraging grounds where vultures are currently at risk of collision, when considering existing turbines (highlighted). (c) Portion of foraging grounds where vultures will be at risk of collision in the next few years (highlighted). Darker areas in (b) and (c) represent those sections of the foraging grounds with the highest foraging intensity. Projections about future wind turbines consider the worst-case scenario, where all wind farm projects that have been submitted to the Italian Ministry for the Environment are approved (see Methods).

Discussion
We found that the data source used to estimate and map the potential collision risk generated by wind farms significantly impacts the resulting risk assessment, and potentially the decision-making process governing the implementation of new energy infrastructures. Although our findings were limited to Griffon Vultures, we believe that they have broader implications for risk assessment involving other vulnerable flying vertebrates.
Estimates of areas of high collision risk, obtained by considering wind turbines from OSM, a frequently used data set, can substantially diverge from, and in particular, underestimate, those obtained from data sets that objectively quantify wind turbines in the environment (e.g. from aerial images, as in Cerri et al. Reference Cerri, Costantino, De Rosa, Banič, Urgeghe and Fozzi2024). Therefore, studies relying on data sets whose accuracy is not verified can seriously underestimate collision risk, sometimes across large spatial scales (Morant et al. Reference Morant, Arrondo, Sánchez-Zapata, Donázar, Margalida and Carrete2024) or in critical conservation areas such as migratory routes (Assandri et al. Reference Assandri, Bazzi, Bermejo-Bermejo, Bounas, Calvario and Catoni2024; Gauld et al. Reference Gauld, Silva, Atkinson, Record, Acácio and Arkumarev2022). Moreover, our estimates are conservative. In fact, we only considered single wind turbines, without including the associated electricity grid, which itself constitutes a major source of mortality for vultures (Ives et al. Reference Ives, Brenn-White, Buckley, Kendall, Wilton and Deem2022; Serratosa et al. Reference Serratosa, Oppel, Rotics, Santangeli, Butchart and Cano-Alonso2024) and other raptors (Guil and Pérez-García Reference Guil and Pérez-García2022).
Due to global differences in digitalisation (Billon et al. Reference Billon, Lera-Lopez and Marco2010), this underestimation can vary across countries, and it is expected to be highest in developing countries with good potential for wind energy production. Some of these countries are considered conservation hotspots for sensitive species, such as African vultures (Buechley et al. 2021; Santangeli et al. Reference Santangeli, Girardello, Buechley, Botha, Minin and Moilanen2019) or bustards (Collar and Wacher Reference Collar and Wacher2023; Dolman et al. Reference Dolman, Burnside, Scotland and Collar2021; Palacín et al. Reference Palacín, Martín, Onrubia and Alonso2016), while others intersect major migratory routes, e.g. the Afro-Palearctic route (Briedis et al. Reference Briedis, Bauer, Adamík, Alves, Costa and Emmenegger2020), or even represent migration bottlenecks (Panuccio et al. Reference Panuccio, Mellone and Agostini2021).
At the policy-making level the underestimation of areas of high collision risk can mislead spatial planning and zonation, as well as bias population viability analyses. If authorities underestimate the number of turbines in the environment, they can potentially authorise the construction of new wind farms in areas where turbines are already abundant. For vultures this could increase the already high mortality rate from collisions with turbines (Arrondo et al. Reference Arrondo, Sanz-Aguilar, Pérez-García, Cortés-Avizanda, Sánchez-Zapata and Donázar2020; Pérez-García and Serrano 2024; Serratosa et al. Reference Serratosa, Oppel, Rotics, Santangeli, Butchart and Cano-Alonso2024), potentially beyond critical ‘tipping points’. This could for instance disrupt density-dependent foraging strategies (Cortés-Avizanda et al. Reference Cortés-Avizanda, Jovani, Donázar and Grimm2014) and lead to widespread numerical declines, especially in regions where vultures are already facing other important threats, such as electrocution or poisoning (Serratosa et al. Reference Serratosa, Oppel, Rotics, Santangeli, Butchart and Cano-Alonso2024). However, the authorisation of new wind farms in areas already having a high density of wind turbines will likely also impact populations of other vulnerable taxa, whose behaviour and/or life-history traits make them incapable of compensating for increased large-scale mortality (e.g. bats; Leroux et al. Reference Leroux, Le Viol, Valet, Kerbiriou and Barré2023; raptors; Duriez et al. Reference Duriez, Pilard, Saulnier, Boudarel and Besnard2023; Estellés-Domingo and López-López Reference Estellés‐Domingo and López‐López2025).
From an analytical perspective, if researchers underestimate the number of turbines, flawed mortality estimates might bias demographic models and population viability analyses (Schippers et al. Reference Schippers, Buij, Schotman, Verboom, van der Jeugd and Jongejans2020), a critical tool in the conservation of vultures (Bounas et al. Reference Bounas, Vasilakis, Kret, Zakkak, Chatzinikolaou and Kapsalis2025; Carrete et al. Reference Carrete, Sánchez-Zapata, Benítez, Lobón and Donázar2009; Vasilakis et al. Reference Vasilakis, Whitfield and Kati2017) and other vulnerable taxa (Diffendorfer et al. Reference Diffendorfer, Stanton, Beston, Thogmartin, Loss and Katzner2021; Duriez et al. Reference Duriez, Pilard, Saulnier, Boudarel and Besnard2023; Frick et al. Reference Frick, Baerwald, Pollock, Barclay, Szymanski and Weller2017). Although it is possible that the long-term mortality from collisions might be reduced by the avoidance of wind farms (Estellés-Domingo and López-López Reference Estellés‐Domingo and López‐López2025), recent studies raised considerable doubts about this behaviour (Sassi et al. Reference Sassi, Ziletti, Duriez and Robira2024) and avoidance can still have nuanced effects on individuals and their fitness (May et al. Reference May2015). It is also worth mentioning that biased maps of wind turbines could also affect movement ecology research: by ignoring the presence of wind turbines and their resulting avoidance by birds or bats, studies about resource selection could be severely biased. This will limit our understanding of how these species could cope with landscape change through behavioural modifications.
At the meta-population level, our results also raise serious concerns about how current wind energy development in the Mediterranean Basin can affect the viability of insular populations of vultures and large raptors. All the largest Mediterranean islands host small populations with a limited exchange of individuals with mainland Europe, which might not compensate for increased mortality. As in the case of Sardinia, by adding the turbines that are planned in the next few years to the number of turbines that were present in our study area in 2023, our risk estimates increased by 63%, involving around one third of total foraging intensity, since their development is planned in an area where Griffon Vultures forage on a daily basis. In the absence of adequate mitigation measures, which are currently lacking, this increase could lead to a mortality rate which would undermine the viability of this population. Increased collisions can also have important cumulative effects on the populations of other vulnerable large raptors in the islands, which live in the same areas as Griffon Vulture and have a precarious conservation status, such as the Golden Eagle Aquila chrysaetos (Di Vittorio et al. Reference Di Vittorio, Medda, Sirigu, Luiselli, Manca and Nissardi2020), Bonelli’s Eagle Aquila fasciata (AQUILA a-LIFE Project 2022), Red Kite Milvus milvus (De Rosa et al. Reference De Rosa, Fozzi, Fozzi, Sanna, Škrábal and Raab2021), and the endemic Corsican–Sardinian Goshawk Accipiter gentilis arrigonii (Londi et al. Reference Londi, Cutini, Campedelli and Florenzano2013).
Our findings bear two clear implications for policy. First, the creation of high-quality and publicly available data sets of wind turbine locations is a priority for environmental agencies. While maps with the exact location of each turbine can be developed only for small high-risk areas, such as migration bottlenecks (Gauld et al. Reference Gauld, Silva, Atkinson, Record, Acácio and Arkumarev2022) or vulture colonies (Carrete et al., Reference Carrete, Sánchez-Zapata, Benítez, Lobón, Montoya and Donázar2012), statistical inference could allow large-scale estimates to be obtained. Namely, conservationists could divide large areas into a 1-km grid and then use spatially balanced sampling schemes (Kermorvant et al. Reference Kermorvant, D’amico, Bru, Caill-Milly and Robertson2019) to extract a sample of cells, manually count turbines from aerial images, and finally estimate and interpolate their density in the whole study area. These estimates could be useful to identify overlaps between wind energy development and biodiversity hotspots or strongholds of sensitive species, with a potentially significant improvement from current estimates, based on untested data. Their creation and periodic update could be further facilitated by automatically identifying turbines from satellite images through machine-learning algorithms (Li et al. Reference Li, Qi, Song and Wang2025). Periodically updating maps is also crucial, as our findings showed that even high-quality maps (Smeraldo et al. Reference Smeraldo, Bosso, Fraissinet, Bordignon, Brunelli and Ancillotto2020) accumulate significant bias in the span of a few years, due to the rate of wind energy development.
Finally, we emphasise the need to rapidly implement post-construction impact assessment schemes and mitigation measures, such as selective turbine stopping (Ferrer et al. Reference Ferrer, Alloing, Baumbush and Morandini2022) and periodic field surveys to detect and remove undisposed livestock carrion around wind turbines. Practical evidence indicates that in most Mediterranean countries, outside the Iberian Peninsula, rigorous post-construction impact assessment and mitigation measures are seldom implemented. The availability of reliable maps of wind turbines will be crucial for effectively designing monitoring schemes for post-construction assessments and implementing mitigation measures in the areas with the highest risk of collision. Only by designing interventions based on accurate real-world data will it be possible to assess the large-scale impact of wind energy development and reduce its impacts on vulnerable species. Without accurate zonation policies and effective mitigation strategies, the current magnitude of wind energy development will likely result in the large-scale proliferation of ecological traps and increased mortality for many populations of vultures and other vulnerable birds and bats.
Supplementary material
The supplementary material for this article can be found at https://doi.org/10.1017/S0959270926100410.
Acknowledgements
The study was co-financed by the European Commission through the LIFE ‘Under Griffon Wings’ (LIFE14 NAT/IT/000484) and the LIFE ‘Safe for Vultures’ (LIFE19 NAT/IT/000732) projects. Chiara Costantino was supported by the Italian Ministry of Education, University and Research, through the National Recovery and Resilience Plan (PNRR) – ‘Budget di ricerca borse 118 – Pianificazione territoriale integrata, finalizzata a massimizzare la compatibilità tra lo sviluppo delle energie rinnovabili e le comunità faunistiche della Regione Sardegna’, Grant number: UA2003DOTTRIC39_118. Ilaria Fozzi was supported by the Italian Ministry of Education, University and Research – PON ricerca innovazione 2014-2020, Azione IV.5 ‘Dottorati su tematiche Green’, Grant number: DOT1629893-2. Author contributions CRediT taxonomy: conceptualization: FB, DDR, DS, IF, JC; methodology: CC, FB, IF, JC, MM, MS; software: CC, IF, JC, MS; validation: CC, DAB, DDR, IF, JE, LP, MS; formal analysis: CC, DAB, IF, JC, JE, LP, MS; investigation: CC, DAB, IF, JC, JE, LP; resources: DS, FB, MM; data curation: CC, DAB, DDR, IF, JE, LP; writing – original draft: IF, JC, MS; writing – review and editing: CC, DDR, FB, IF, JC, MS; visualisation: CC, DDR, FB, IF, JC; supervision: DDR, DS, FB, MM; project administration: DS, FB, MM; funding acquisition: DS, FB. The reproducible data and software code are available at: https://osf.io/v9pdt/. Our study included stakeholders from different institutions working on biodiversity conservation in Sardinia and dealing with wind energy development and its impacts. We acknowledge that we could have included authors from the Global South, as well as from other Italian regions. However, this study aimed to provide first evidence on the impact of different wind energy data on collision risk estimates and its limitations could be addressed in the future.


 Open access