


1. Introduction
COVID-19 is an unprecedented pandemic by the speed and global scope of its dissemination. Most countries on the planet were not prepared to face this disease and were surprised by its spread across their territories, especially for low- and middle-income countries, like most island countries (Ma & Vervoort, Reference Ma and Vervoort2020). Thus, in addition to the advice given by national and international colleges of scientists specializing in biology and medicine, simulation and forecasting tools make it possible to manage the crisis in the short, medium, and long term and to curb the infection (Currie et al., Reference Currie, Fowler, Kotiadis, Monks and Onggo2020). Many of these tools come from mathematical modeling, using for example, the SIR model and its extensions (see for instance Wu et al., Reference Wu, Leung, Bushman, Kishore, Niehus, de Salazar, Cowling, Lipsitch and Leung2020; Roda et al., Reference Roda, Varughese, Han and Li2020; Giordano et al., Reference Giordano, Blanchini, Bruno, Colaneri, Filippo, Matteo and Colaneri2020; Ivorra et al., Reference Ivorra, Ferrández, Vela-Pérez and Ramos2020) or linear regression (Rustam et al., Reference Rustam, Reshi, Mehmood, Ullah, On, Aslam and Choi2020). Some come from the fields of artificial intelligence like neural networks for instance: deep learning (Chimmula & Zhang, 2020) or fuzzy neural networks (Al-qaness et al., Reference Al-qaness, Ewees, Fan, Abualigah and Elaziz2020). Others are mixed approach using both mathematical and computer sciences tools (Fong et al., Reference Fong, Li, Crespo and Herrera-Viedma2020). Simulations focusing on the effect of lockdown or the effects of its absence or its reduction, are based on similar approaches: SIR model (Roux et al., Reference Roux, Massonnaud and Crépey2020; Ali et al., Reference Ali, Shah, Lmran and Khan2020), Bayesian approaches (Nouvellet et al., Reference Nouvellet, Bhatia, Cori, Ainslie, Baguelin, Bhatt, Boonyasiri, Brazeau, Cattarino, Cooper, Coupland, Cucunuba, Cuomo-Dannenburg, Dighe, Djaafara, Dorigatti, Eales, van Elsland, Nascimento, FitzJohn, Gaythorpe, Geidelberg, Green, Hamlet, Hauck, Hinsley, Imai, Jeffrey, Knock, Laydon, Lees, Mangal, Mellan, Nedjati-Gilani, Parag, Pons-Salort, Ragonnet-Cronin, Riley, Unwin, Verity, Vollmer, Volz, Walker, Walters, Wang, Watson, Whittaker, Whittles, Xi, Ferguson and Donnelly2020) or multi-agent system (MAS) (Bouchnita & Jebrane, Reference Bouchnita and Jebrane2020). In this paper, we try to answer the following question:
What would have happened if, after the end of a confinement of an entire region, no one respects barrier gestures, nor social distancing?
This kind of simulation provides, among other things, to local decision-makers elements of better anticipation of health needs (Mahmood et al., Reference Mahmood, Arabnejad, Suleimenova, Sassoon, Marshan, Serrano-Rico, Louvieris, Anagnostou, Taylor, Bell and Groen2020; Das et al., Reference Das, Khatua, Kar and Jana2021) or of communication on the interest of barrier gestures aimed at the population (see for example Steven, Reference Steven2020 and Bayette & Monticelli, Reference Bayette and Monticelli2020 as popular science articles, or Régis et al., Reference Régis, Manicom, Doncescu, Park, Cho, Hu, Yoo, Woo, Wang, Facelli, Nam and Kang2020a,Reference Régis, Manicom and Doncescub used by local media in Radio Caraibes Internationale, 2021). In this work, we propose to use fuzzy sets, aggregation operators, and MAS to simulate the effect of non-compliance with barrier gestures by the entire population, after the lockdown has been lifted. The main contribution of this approach is methodological: it is the combination of fuzzy sets, aggregation operators and MAS to simulate the effect of COVID-19: on the one hand, the fuzzy subsets make it possible to model notably the people who are on the border between two categories (e.g., adult/old people, overweight/obesity). On the other hand, aggregation operators make it possible to model the worsening of the disease and the severe or critical forms. In addition to this main contribution, the introduction of a simplified modeling of COVID-19 variants to assess their transmission as well as the use of a socioeconomic factor to assess mortality in the group of the elderly are also relevant elements of this simulation. The method has been tested in an island context by taking the example of the archipelago of the islands of Guadeloupe, in the Caribbean. The simulation focus on the level of severity of disease (mild, severe or critical) for infected people. A special feature of this simulation is the fact that we have focused on two real risk factors which are essential to assess the severity of infected people: age and body mass index (BMI). These two factors are introduced into the MAS using fuzzy sets, and the worsening of disease caused by these risk factors is modeled by fuzzy aggregation operators.The paper is organized as follows. We present our approach in the next section. Then, the data used for the simulation are presented. In the next section, we present the experimental results. Finally, a short discussion is made before concluding.
2. Simulations on the effects of no lockdown
2.1. Related works
Simulations on the effects of lockdown mainly estimate the number of deaths if there had been no lockdown or very few barrier measures (Roux et al., Reference Roux, Massonnaud and Crépey2020; Flaxman et al., Reference Flaxman, Mishra, Gandy, Unwin, Coupland, Mellan, Zhu, Berah, Eaton, Guzman, Schmit, Cilloni, Ainslie, Baguelin, Blake, Boonyasiri, Boyd, Cattarino, Ciavarella, Cooper, Perez, Cuomo-Dannenburg, Dighe, Djaafara, Dorigatti, Elsland, Fitzjohn, Fu, Gaythorpe, Geidelberg, Grassly, Green, Hallett, Hamlet, Hinsley, Jeffrey, Jorgensen, Knock, Laydon, Gilani, Nouvellet, Parag, Siveroni, Thompson, Verity, Volz, Walters, Wang, Wang, Watson, Winskill, Xi, Whittaker, Walker, Ghani, Donnelly, Riley, Okell, Vollmer, Ferguson and Bhatt2020). These approaches generally have a global approach and do not take account of risk factors. For instance, the Bayesian approach in Flaxman et al. (Reference Flaxman, Mishra, Gandy, Unwin, Coupland, Mellan, Zhu, Berah, Eaton, Guzman, Schmit, Cilloni, Ainslie, Baguelin, Blake, Boonyasiri, Boyd, Cattarino, Ciavarella, Cooper, Perez, Cuomo-Dannenburg, Dighe, Djaafara, Dorigatti, Elsland, Fitzjohn, Fu, Gaythorpe, Geidelberg, Grassly, Green, Hallett, Hamlet, Hinsley, Jeffrey, Jorgensen, Knock, Laydon, Gilani, Nouvellet, Parag, Siveroni, Thompson, Verity, Volz, Walters, Wang, Wang, Watson, Winskill, Xi, Whittaker, Walker, Ghani, Donnelly, Riley, Okell, Vollmer, Ferguson and Bhatt2020) is global and have no particular risk factor, and the SIR approach in Al-qaness et al. (Reference Al-qaness, Ewees, Fan, Abualigah and Elaziz2020) only considers age as risk factor. In Mahmood et al. (Reference Mahmood, Arabnejad, Suleimenova, Sassoon, Marshan, Serrano-Rico, Louvieris, Anagnostou, Taylor, Bell and Groen2020), Bouchnita and Jebrane (Reference Bouchnita and Jebrane2020), Cuevas (Reference Cuevas2020), Silva et al. (Reference Silva, Batista, Lima, Alves, Guimaraes and Silva2020), Tatapudi et al. (Reference Tatapudi, Das and Das2020), Vyklyuk et al. (Reference Vyklyuk, Manylich, Skoda, Radovanovic and Petrovic2021), MAS are used to simulate the diffusion of COVID-19, with or without lockdown. As underlined in most of these approaches using MAS, the mathematical models proposed above present a global vision of the pandemic with uniform behavior of the population considered. Methods based on complex systems, and MAS in particular, make it possible to model individual behaviors and characteristics with detailed vision and at a microscopic scale. These articles are particularly interested in the modeling of the movements (professional and personal displacements) of agents and their social interactions. Neither approach really emphasizes taking risk factors into account. Indeed, in all of these methods using MAS, the risk factors for worsening COVID-19 are modeled by probabilities or rates. These probabilities are mainly related to age, and sometimes to comorbidities. For instance, in Bouchnita and Jebrane (Reference Bouchnita and Jebrane2020) which is one of the studies which models the risk factors in the most detail, a MAS is proposed to simulate the effects of lockdown, by introducing age and comorbidity (cardiovascular diseases, diabetes…) as two risk factors; these risk factors are introduced in the form of probabilities. Bouchnita and Jebrane (Reference Bouchnita and Jebrane2020) used these risk factors to have a number of deaths due to COVID-19 in their simulation, but they were not interested in the different levels of severity of the disease and their consequences on the health system, which is our case. Our approach also uses risk factors and MAS, but the risk factors are introduced with fuzzy sets in order to be closer to reality, taking into account nuances and imprecision often found in real data (Zadeh, Reference Zadeh2011).
2.2. General presentation of the approach
In this paper, we propose to focus on two risk factors linked to COVID-19 by introducing them as fuzzy subsets in a MAS, namely age and BMI. The choice of these two risk factors is guided by medical and statistical knowledge derived from real data. Older age is the main risk factor for the severe or critical case of infected people (Zhou et al., Reference Zhou, Yu, Du, Fan, Liu, Liu, Xiang, Wang, Song, Gu, Guan, Wei, Li, Wu, Xu, Tu, Zhang, Chen and Cao2020; Wu & McGoogan, Reference Wu and McGoogan2020; Williamson et al., Reference Williamson, Walker, Bhaskaran, Bacon, Bates, Morton, Curtis, Mehrkar, Evans, Inglesby, Cockburn, McDonald, MacKenna, Tomlinson, Douglas, Rentsch, Mathur, Wong, Grieve, Harrison, Forbes, Schultze, Croker, Parry, Hester, Harper, Perera, Evans, Smeeth and Goldacre2020; Haut Conseil de la santé publique (France), 2020) and obesity (measured by BMI) seems to be the second main risk factor (Haut Conseil de la santé publique (France), 2020; Muscogiuri et al., Reference Muscogiuri, Pugliese, Barrea, Savastano and Colao2020; Kass et al., Reference Kass, Duggal and Cingolani2020; Lighter et al., Reference Lighter, Phillips, Hochman, Sterling, Johnson, Francois and Stachel2020).
The main objective of the approach in our work is to assess the level of severity of people who would be infected in the event that, after the lifting of a containment of a region (or a country), no one complies with barrier gestures or social distancing. In our approach, infected people are assigned to one of three groups corresponding to levels of disease severity: mild, severe, or critical. We focus on the distribution of infected people in one of these three groups, and we are not interested in the evolution of the disease toward recovery. Indeed, people with a severe form or a critical form require hospitalization in conventional rooms (medical observations, oxygenation, and medication) for the severe form and in intensive care units (ICU) for the critical form. It is these last two levels of severity that place the greatest burden on the hospital system of the regions and countries. We are especially interested in the number of critical cases, particularly in a context where many countries do not have enough ICU to manage the crisis (Ma & Vervoort, Reference Ma and Vervoort2020). Indeed, regardless of a country’s level of development, it appears that government decisions related to the implementation of restrictions (containment, curfew, etc.) are directly related to the capacity of the hospitalization system to accommodate COVID-19-infected individuals with severe or serious forms (Shamasunder et al., Reference Shamasunder, Holmes, Goronga, Carrasco, Katz, Frankfurter and Keshavjee2020; Jensen et al., Reference Jensen, Kelly and Avendano2021). The objective for government remains not to blow up the country’s health system and to avoid as many deaths as possible.
Thus, we use a MAS to modelize the population of a region. The demographic (age), geographic, and BMI characteristics of each agent were not chosen randomly, but according to statistical data from the region, in order to compare the simulation results with the actual data. In addition, we modeled membership in the three COVID-19 severity level groups by age or obesity (BMI) using fuzzy subsets. This fuzzy modeling had at least two advantages. First, it allows to be more realistic at the borders between different classes. For example for BMI, if we keep classic subsets, an individual with a BMI equal to 24 is in the group of thin people, while an individual with a BMI equal to 25 is in the group of overweight people even though the difference between the two is only 1 (for more details see Miyahira & Araujo, Reference Miyahira and Araujo2008; Miyahira et al., Reference Miyahira, de Azevedo and Araujo2011). Second, it allows the values of the risk factors (age and BMI) to be combined using fuzzy aggregation operators that reflect medical reality. For example, if an infected person is of advanced age and obese, we know that both are aggravating factors, and there is a high chance that this person will develop a severe or even fatal form of COVID-19 (see Mahase, Reference Mahase2020). For such values of the two factors (advanced age and obesity), a fully reinforced (or at least positively reinforced) operator will represent this aspect of aggravation of the disease. Thus, modeling of age and BMI imprecision by fuzzy subsets in an SMA approach and modeling of aggravation by fuzzy aggregation operators are the major contributions of the approach proposed in this paper. These elements allow us to provide results on the three levels of disease severity for infected individuals. In addition to these main contributions, our approach proposes a simple modeling of the variants through their contagiousness, which is stronger than that of COVID-19. Finally, although the study of disease outcome is not the main objective of this work, we propose to use a social factor to determine the number of deaths among the infected elderly. Figure 1 summarizes the proposed approach.
Diagram representing the proposed approach.

The tests were made with real demographic and medical data from an archipelago, the islands of Guadeloupe, French West Indies, where the number of ICU is limited and the proportion of obesity is growing like for a lot of island regions (McLennan Ulijaszek, Reference McLennan and Ulijaszek2015; Food and Agriculture Organization of the United Nations Regional Office for Latin America and the Caribbean, 2019).
2.3. The used model in MAS
For the MAS, we used and modified a model implemented in NetLogo plaform (Wilensky, Reference Wilensky1999) called epiDEM Travel and Control (Yang & Wilensky, Reference Yang and Wilensky2011a). epiDEM Travel and Control is based on epiDEM basic (Yang & Wilensky, Reference Yang and Wilensky2011b) (see also Wang et al., Reference Wang, Zhao, Lai and Qin2016; Smith & Broniatowski, Reference Smith, Broniatowski, Xu, Reitter, Lee and Osgood2016), an epidemic model developed on NetLogo. The choice of the well-known NetLogo platform and an open-access multi-agent epidemiological model is justified by the ease of adapting and redoing the simulation, especially for countries with low resources. The epiDEM Travel and Control model focuses on the spread of a disease on agents who can travel (or not) between different regions while observing infected, healed, and possibly quarantined people. We put the emphasis on infected people by classifying them into three groups (mild, severe, and critical) according to their age and their BMI (although epiDEM Travel and Control model proposes to evaluate people who are cured after their infection, we recall that we focused on characterizing the severity levels of infected people). In our modified version, each agent represents a group of persons in the same age range according to the demographic data. We fit the parameters of the original model to allow free movement of people whether or not they are infected (no social distancing or quarantine). Details are given in the section on experimental results.
2.4. Fuzzyfication of age and BMI
Let us recall that a classical subset A of X is defined by a characteristic function which takes the value 0 for the elements of X not belonging to A and 1 for those which belong to A (see Equation (1)):
 \begin{equation}\chi_{A}\; :\; X \rightarrow \{0, 1\}\end{equation}
A fuzzy subset B of X is defined by a membership function which associates with each element x of X a degree f(x) between 0 and 1, with which x belongs to B (see Equation (2)):
 \begin{equation}f_{B}\; :\; X \rightarrow [0, 1]\end{equation}
Let us recall that we search to cluster infected people in three groups (or classes): mild, severe, or critical. The characteristics of these groups are as follows:
-
the mild group brings together people with mild symptoms and asymptomatic cases.
-
the severe group brings together people with more serious conditions may possibly require hospitalization for observation but without going into intensive care.
-
the critical group represents all those whose condition requires hospitalization in intensive care with possibly a vital prognosis.
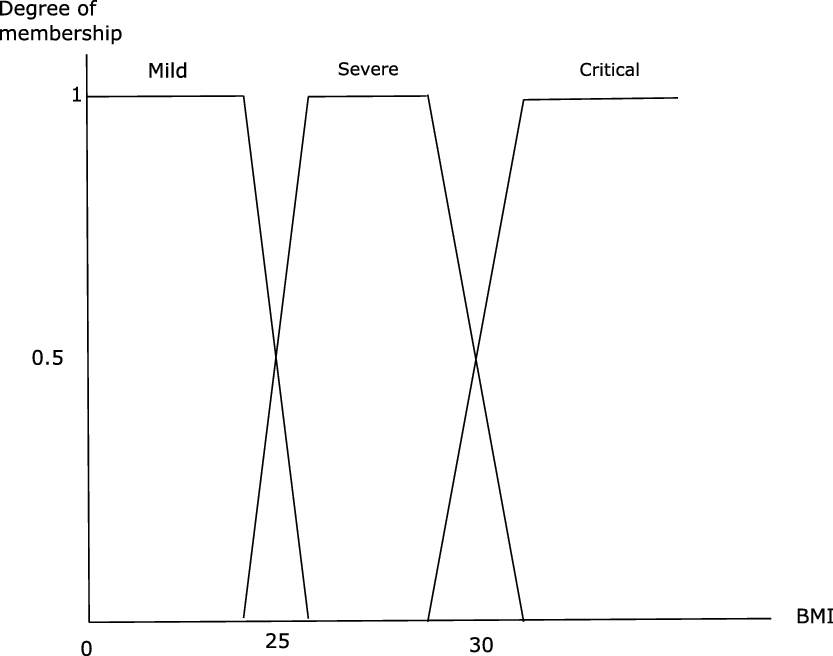
In order to classify the level of the severity of COVID-19 for infected people in three groups, we use a fuzzyfication of the two risk factors which are age and obesity. As stated above, older age is the main risk factor for the severe or critical case and obesity is the second main risk factor. Generally, in demographic data, the population is divided into three age groups: young people, adults, and the elderly. The severity of COVID-19 disease roughly corresponds to these three groups (Zhou et al., Reference Zhou, Yu, Du, Fan, Liu, Liu, Xiang, Wang, Song, Gu, Guan, Wei, Li, Wu, Xu, Tu, Zhang, Chen and Cao2020; Wu & McGoogan, Reference Wu and McGoogan2020; Williamson et al., Reference Williamson, Walker, Bhaskaran, Bacon, Bates, Morton, Curtis, Mehrkar, Evans, Inglesby, Cockburn, McDonald, MacKenna, Tomlinson, Douglas, Rentsch, Mathur, Wong, Grieve, Harrison, Forbes, Schultze, Croker, Parry, Hester, Harper, Perera, Evans, Smeeth and Goldacre2020; Haut Conseil de la santé publique (France), 2020): young people who are infected often have a mild form of the disease, adults generally have a more serious form and correspond to the group of severe patients, and elderly people represent the majority of critical cases. Obviously, this classification does not take into account other factors (illness, physical form, genetic heritage…). Thus, we propose to use a fuzzyfication of the three groups of level of severity of the disease (in function of the age), which corresponds substantially to a classic fuzzyfication of the three age groups (see Escabí, Reference Escabí2012 for instance), as illustrated in Figure 2. Regarding the risk associated with obesity, work has mainly observed that this obesity has led to a form of criticism of the disease, even for people who are not old (Haut Conseil de la santé publique (France), 2020; Muscogiuri et al., Reference Muscogiuri, Pugliese, Barrea, Savastano and Colao2020; Kass et al., Reference Kass, Duggal and Cingolani2020; Lighter et al., Reference Lighter, Phillips, Hochman, Sterling, Johnson, Francois and Stachel2020). BMI makes it easy to characterize obesity (see Table 1).
Membership functions of the three classes in function of age (in years).

Nutritional status according to BMI (Source: WHO—World Health Organization)

However, it is more difficult to characterize mild and severe cases compared to the BMI corresponding to overweight people. Indeed, in some studies (Gao et al., Reference Gao, Zheng, Wang, Sun, Pan, Wang, Chen, Targher, Byrne, George and Zheng2020), overweight (also called pre-obesity) is considered to be a form of obesity and poses a risk of a critical case, while in other studies (Lighter et al., Reference Lighter, Phillips, Hochman, Sterling, Johnson, Francois and Stachel2020; Pettit et al., Reference Pettit, MacKenzie, Ridgway, Pursell, Ash, Patel and Pho2020), the emphasis is placed on strict obesity as a critical form factor of disease. This imprecision further justifies the use of fuzzy subsets. Anyway, in the fuzzification of the BMI that we used, the values of the BMI corresponding to the overweight are placed in the group of severe forms. The fuzzification that we offer is based on the work of a medical team (Miyahira & Araujo, Reference Miyahira and Araujo2008; Miyahira et al., Reference Miyahira, de Azevedo and Araujo2011) who proposed a first fuzzification of BMI (see Figure 3).
Membership functions of BMI (UW = Underweight, T = Thin, OW = Overweight, OI = Obesity of grade I, OII = Obesity of grade II, OIII = Obesity of grade III also called morbid Obesity); for details, see Miyahira and Araujo (Reference Miyahira and Araujo2008), Miyahira et al. (Reference Miyahira, de Azevedo and Araujo2011).

From this fuzzyfication of BMIs proposed by Miyahira and Araujo (Reference Miyahira and Araujo2008) and Miyahira et al. (Reference Miyahira, de Azevedo and Araujo2011), we perform our fuzzification of the severity level of COVID-19 following the following procedure: for the mild, respectively severe, respectively critical form, we merge the membership functions of nutritional status Underweight (UW), Thin (T), respectively Overweight (OW), Obesity of grade I (OI), respectively Obesity of grade II (OII), Obesity of grade III (OIII). For the mild form (respectively the severe form, respectively the critical form), we modify the intersection of UW and T by making it equal to 1, (respectively the intersection of OW and OI, respectively OII and OIII). Our fuzzification of the three groups of level of severity of the disease according to BMI is presented in Figure 4.
Membership function of the three classes in function of BMI.
2.5. Fuzzy aggregation operators for the evaluation of level of severity
The combination of risk factor values is a crucial step in assessing the severity of the disease. In Bouchnita and Jebrane (Reference Bouchnita and Jebrane2020), where MAS is proposed to simulate the diffusion of COVID-19, two risk factors are introduced in the form of ‘death probability’. In this approach, the authors systematically choose the maximum between the two death probabilities to characterize an agent.
In our approach, we use fuzzy aggregation operators (Bloch & Hunter, Reference Bloch and Hunter2001; Dubois & Prade, Reference Dubois and Prade2004) to combine the degrees of membership for each of the groups (mild, severe, and critical). We propose an adaptive approach with several fuzzy fusion operators according to the values of the membership functions of the three classes (mild, severe, and critical). The level of disease worsening caused by risk factors is modeled by different types of fuzzy aggregation operators. When an agent is infected, the main task of this approach is to determine the degree of severity of the disease by computing the membership degree to each of the three classes and placing the agent in the class with the highest membership degree. The process is described in the following Algorithm 1.
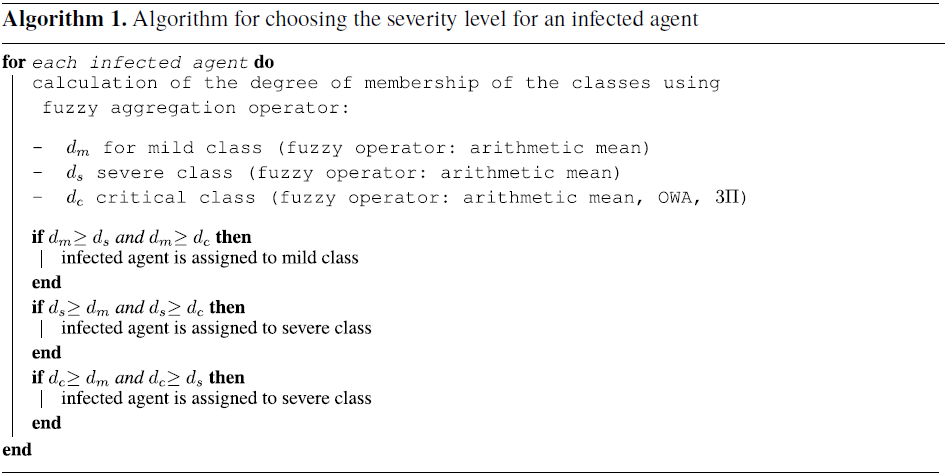
For the two classes mild and severe, the degrees of belonging are combined with an arithmetic mean (see Equation (3)):
 \begin{equation}(f_{age}(x) + f_{BMI}(x))/2\end{equation}
where $f_{age}$
is the membership degree in relation to the age and where
$f_{age}$
is the membership degree in relation to the age and where $f_{BMI}$
is the membership degree in relation to the BMI for the considered class.
$f_{BMI}$
is the membership degree in relation to the BMI for the considered class.
The critical class is treated in a special way because of the risk factors and comorbidities that strongly influence this class. With regard to the critical class, several cases are differentiated according to the value of the degrees of membership, taking 0.5 as the pivotal value. Indeed, whatever the class, if the value of the degree of membership is strictly less than 0.5, then the insertion of the agent in this class is unlikely to take place. If the value of the degree of membership is greater than 0.5, then integration into this class will be very likely to take place. Thus, for the critical class, the considered cases are as follows.
-
– if the two values of the membership degrees for the critical class are strictly less than 0.5, then the data fusion is done using the arithmetic mean (see Equation (3)), similarly to the mild and severe classes
-
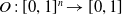
– if only one of the two values of membership degree for the critical class is greater than or equal to 0.5, then the combination of the data is done using a mean type aggregation operators called OWA, Ordered Weighted Averaging (Yager, Reference Yager1988). An OWA is an operator $O\;:\; [0, 1]^{n} \rightarrow [0, 1]$
with an associated collection of weights
$W=\{w_{1},\dots,w_{n} \}$
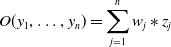
lying in the unit interval and summing to one and with:(4)where
\begin{equation}O(y_{1},\dots, y_{n})=\sum_{j=1}^{n} w_{j} * z_{j}\end{equation}
$z_{j}$
is the
$j{\rm th}$
largest of the
$y_{j}$
.
$O\;:\; [0, 1]^{n} \rightarrow [0, 1]$
with an associated collection of weights
$W=\{w_{1},\dots,w_{n} \}$
lying in the unit interval and summing to one and with:(4)where
\begin{equation}O(y_{1},\dots, y_{n})=\sum_{j=1}^{n} w_{j} * z_{j}\end{equation}
$z_{j}$
is the
$j{\rm th}$
largest of the
$y_{j}$
.
The use of the OWA operator for the fusion of the two membership degree gives the following Equation (5):
(5)where
\begin{equation}w_{1}*f_{i}(x) + w_{2}*f_{j}(x)\end{equation}
$i, j = \{age, BMI\}$
and
$f_{i}(x) \geq 0.5 \gt f_{j}(x)$
.
For our model, we have deliberately fixed the following values for the two weights:
$w_{1}=0.7$
and
$w_{2}=0.3$
. The Equation (5) thus becomes the Equation (6):(6)
\begin{equation}0.7*f_{i}(x) + 0.3*f_{j}(x)\end{equation}
The value
$0.7$
is the weight for the membership degree greater than or equal to
$0.5$
, and the value
$0.3$
is the weight for the membership degree for the membership degree is strictly less than
$0.5$
. The choice of these weights is leaded by medical observations, as explained as follows. Actually, for older persons, the proportion, or frequency of occurrence, or the risk of being a critical case is at least two times higher than for other age groups (Petrilli et al., Reference Petrilli, Jones, Yang, Rajagopalan, O’Donnell, Chernyak, Tobin, Cerfolio, Francois and Horwitz2020; Verity et al., Reference Verity, Okell, Dorigatti, Winskill, Whittaker, Imai, Cuomo-Dannenburg, Thompson, Walker, Fu, Dighe, Griffin, Baguelin, Bhatia, Boonyasiri, Cori, Cucunubá, FitzJohn, Gaythorpe, Green, Hamlet, Hinsley, Laydon, Nedjati-Gilani, Riley, van Elsland, Volz, Wang, Wang, Xi, Donnelly, Ghani and Ferguson2020; Banerjee et al.,
Reference Banerjee, Pasea, Harris, Gonzalez-Izquierdo, Torralbo, Shallcross, Noursadeghi, Pillay, Sebire, Holmes, Pagel, Wong, Langenberg, Williams, Denaxas and Hemingway2020). Likewise for obese people, the proportion or frequency of occurrence or the risk of being a critical case is at least twice as high as for non-obese people (Cai et al., Reference Cai, Chen, Wang, Luo, Liu, Wu, He, Wang, Liu, Liu, Chen and Xu2020; Caussy et al., Reference Caussy, Pattou, Wallet, Simon, Chalopin, Telliam, Mathieu, Subtil, Frobert, Alligier, Delaunay, Vanhems, Laville, Jourdain and Disse2020). The value
$0.7$
is being more than twice as great as
$0.3$
, and these weights represent the risks caused by old age or obesity. Thereby, the most important weight (
$0.7$
) assigned to the degree of belonging greater than or equal to
$0.5$
implies, for example, that biologically, a comorbidity or immunosuppression linked to age or BMI can worsen the patient’s condition. -
− if the degrees of membership are both greater than or equal to
$0.5$
, then the aggregation is done using a fully reinforced operator (Yager & Rybalov, 1998), reflecting the fact that the two risk factors (age and BMI) greatly worsen the patient’s condition. An operator L is fully reinforced if it is positively reinforced and negatively reinforced (Yager & Rybalov, 1998). Let L be a fuzzy aggregation operator on
$[0,1]^{n}$
:(7)
\begin{equation}L \;:\; [0, 1]^{n} \rightarrow [0, 1]\end{equation}
This aggregation operator L whose arguments
$y_{i}$
are in the interval [0, 1], has the property of positive reinforcement if when all its attributes are affirmative (i.e., greater than or equal to
$0.5$
) it verifies:(8)
\begin{equation}L(y_{1},...,y_{n})\geq \max_{i}(L(y_{i}))\end{equation}
Similarly, an aggregation operator L whose arguments
$y_{i}$
are in the range [0, 1] has the property of negative reinforcement if when all its attributes are non-affirmative (i.e., less than or equal to
$0.5$
), it verifies:(9)
\begin{equation}L(y_{1},...,y_{n})\leq \min_{i}(L(y_{i}))\end{equation}
We propose to use the triple
$\Pi$
operator presented in Yager & Rybalov Yager & Rybalov (1998) which is a full reinforced operator (see Equation (10)):(10)where
\begin{equation}\frac{\Pi_{i=1}^{n}y_{i}}{\Pi_{i=1}^{n}y_{i} + \Pi_{i=1}^{n}(1 - y_{i})}\end{equation}
$\Pi$
is the multiplication operator. The use of the triple
$\Pi$
operator for the fusion of the two membership degree gives the following equation:(11)Such a reinforced operator translates the excess morbidity caused by obesity and aging.
\begin{equation}\frac{f_{age}(x)*f_{BMI}(x)}{f_{age}(x)*f_{BMI}(x) + (1 - f_{age}(x))*(1 - f_{BMI}(x))}\end{equation}


This adaptive approach to data fusion for belonging to the critical class enables to target in detail the patients with this level of severity of the disease.
Once the aggregations have been computed, the class with the highest global membership degree is assigned to the infected patient. If several classes have the same global membership degree, then the order of priority of classification is as follows: (1) class of critical cases, (2) classes of severe cases, and (3) class of mild cases. From a methodological point of view, this choice allows us to manage agents with values on the boundaries of the fuzzy membership functions and to assign them to the highest severity class. However, one might wonder whether this choice is not overly pessimistic. Actually, some studies (Jagodnik et al., Reference Jagodnik, Ray, Giorgi and Lachmann2020; Shuja et al., Reference Shuja, Alanazi, Alasmary and Alashaikh2020; Angulo et al., Reference Angulo, Finelli and Swerdlow2021; Rahmandad et al., Reference Rahmandad, Lim and Sterman2021; Shen et al., Reference Shen, Loomer, Abrams, Grabowski and Gandhi2021) show that the estimates of the total number of cases and of the number of deaths (therefore from critical cases) are underestimated (especially because of the limited number of tests). Thus, the approach that we propose can take into account cases not counted.
2.6. Modelization of COVID-19 variants
In addition to modeling the aggravating factors of the COVID-19 disease, we have sought to model the variants of this virus since they now represent an increasingly large proportion of those affected. Several variants have appeared, and others still seem to develop; obviously, it is not realistic to want to represent them all. However, what seems to characterize most of these variants is their stronger transmissibility than SARS-Cov-2 COVID-19. Thus, for example, the alpha variants $1.1.7$
, 501Y variant and delta variants
$1.1.7$
, 501Y variant and delta variants $1.617.2$
appear to be at least
$1.617.2$
appear to be at least $50 \%$
more contagious than the ‘classic’ COVID-19 (see Volz et al., Reference Volz, Mishra, Chand, Barrett, Johnson, Geidelberg, Hinsley, Laydon, Dabrera and O’Toole2021; Davies et al., Reference Davies, Abbott, Barnard, Jarvis, Kucharski, Munday, Pearson, Russell, Tully and Washburne2021; Korber et al., Reference Korber, Fischer, Gnanakaran, Yoon, Theiler, Abfalterer, Hengartner, Giorgi, Bhattacharya and Foley2020; Pearson et al., Reference Pearson, Russell, Davies, Kucharski and Eggo2021; Duong Reference Duong2021). More recently, the first studies (Rao & Singh, Reference Rao and Singh2021) show that the Omicron
$50 \%$
more contagious than the ‘classic’ COVID-19 (see Volz et al., Reference Volz, Mishra, Chand, Barrett, Johnson, Geidelberg, Hinsley, Laydon, Dabrera and O’Toole2021; Davies et al., Reference Davies, Abbott, Barnard, Jarvis, Kucharski, Munday, Pearson, Russell, Tully and Washburne2021; Korber et al., Reference Korber, Fischer, Gnanakaran, Yoon, Theiler, Abfalterer, Hengartner, Giorgi, Bhattacharya and Foley2020; Pearson et al., Reference Pearson, Russell, Davies, Kucharski and Eggo2021; Duong Reference Duong2021). More recently, the first studies (Rao & Singh, Reference Rao and Singh2021) show that the Omicron $B.1.1.529$
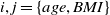
variant is at least five times more contagious than the delta variant.We therefore propose to focus on this main characteristic of variants by modeling it in relation to the zone of transmissibility of the virus. This transmissibility zone is represented by a grid centered on the infected agent in the simulation. Thus, for the variants, the area of this grid will be greater than the area of the grid of the ‘classic’ virus, as indicated in Figure 5. Even if this modeling of virus variants is very simplified, it will still make it possible to compare the diffusion of virus strains in MAS.
$B.1.1.529$
variant is at least five times more contagious than the delta variant.We therefore propose to focus on this main characteristic of variants by modeling it in relation to the zone of transmissibility of the virus. This transmissibility zone is represented by a grid centered on the infected agent in the simulation. Thus, for the variants, the area of this grid will be greater than the area of the grid of the ‘classic’ virus, as indicated in Figure 5. Even if this modeling of virus variants is very simplified, it will still make it possible to compare the diffusion of virus strains in MAS.
The transmissibility grid for the ‘classic’ COVID-19 in (a) and the transmissibility grid for a variant in (b). The black square represents the infected agent.
2.7. Integration of the socioeconomic fragility factor for estimating potential deaths from COVID-19
The use of a socioeconomic parameter may appear surprising in a simulation modeling a pandemic such as COVID-19, especially to estimate the number of deaths from this pandemic. In fact, this parameter is not of a biological or physiological nature. However, the definition of this parameter helps to understand how it makes it possible to estimate the number of deaths from a pandemic. This fragility index (FI) (or factor) has been defined by the French national social security system. According to this institution, fragility is a state characterized by a limitation of the functional capacities of a person, made vulnerable, beyond the state of health by social, economic, and environmental factors. More precisely, this index (which only concerns people aged 55 years and over) enables to characterize the most vulnerable people and the most remote from access to rights, care, and preventive measures; the objective of this index is to provide these people with tailored, individualized, or collective service offers to avoid a risk of disruption (for more details, see Observatoire des fragilités (Fragility Observatory), 2020). Thus, the stronger this FI is in an area (region, city, etc.), the more the elderly are socially and economically isolated and do not systematically go to health professionals in the event of illness. Hence, the idea of using this index to assess mortality in the elderly, which represents the largest proportion of people infected with COVID-19 who have developed a critical form and are in intensive care. If an elderly person with a high FI and aggravating factors contracts COVID-19 while developing a critical form, he or she will not have the reflex to contact medical services immediately and risk being taken care of too late. Unfortunately, this late treatment risks ending in the death of the patient.
3. Application of the proposed approach
3.1. Fitting of the existing MAS epiDEM model
Before we present the results, the adaptation of the NetLogo epiDEM Travel and Control model (Yang & Wilensky, Reference Yang and Wilensky2011a) is presented for the simulation. It should be remembered that the simulation represents a situation of end of lockdown, without respect for social distancing or barrier gestures. As a result, agents can circulate freely, and infected people transmit the disease to everyone with whom it comes into contact. In the epiDEM Travel and Control model, several parameters are used to manage the isolation, hospitalization, and vaccination of infected people: parameters average-isolation-tendency, average-hospital-going-tendency, initial-ambulance, and inoculation-chance are all set to 0. The parameters relating to the mobility of agents are all set to 1 so as not to restrict the movements of these agents: travel-tendency, intra-mobility are set to 0 and the parameter travel (considered as boolean) is set to 1. Agents move in in random directions. There is also an option to create a network of random links between agents, but this parameter has not been activated (for more details, see Yang & Wilensky, Reference Yang and Wilensky2011a). Regarding the characteristics of COVID-19, the parameters are adapted to be directly linked to the disease. The parameter average-recovery-time which represents the average duration of the disease was put to 30 days. The value of 30 days is close to the duration of the corona pandemic according to some medical data (Zhou et al., Reference Zhou, Yu, Du, Fan, Liu, Liu, Xiang, Wang, Song, Gu, Guan, Wei, Li, Wu, Xu, Tu, Zhang, Chen and Cao2020). Thirty days is a value close to the duration of viral shedding observed in Zhou et al. (Reference Zhou, Yu, Du, Fan, Liu, Liu, Xiang, Wang, Song, Gu, Guan, Wei, Li, Wu, Xu, Tu, Zhang, Chen and Cao2020). Viral shedding is a biological parameter that shows whether a person is recovered and not contagious (Badu et al., Reference Badu, Oyebola, Zahouli, Fagbamigbe, de Souza, Dukhi, Amankwaa, Tolba, Sylverken and Mosi2021). Infection-chance (probability of disease transmission from one individual to another) has been set to 1, since the virus is very contagious. Finally, recovery-chance (probability of an individual’s recovery once the infection has lasted longer than the person’s recovery time) was set to $0.8$
according to medical data (Wu & McGoogan, Reference Wu and McGoogan2020). Indeed, Wu and McGoogan (Reference Wu and McGoogan2020) indicates that a large proportion of the population (80
$0.8$
according to medical data (Wu & McGoogan, Reference Wu and McGoogan2020). Indeed, Wu and McGoogan (Reference Wu and McGoogan2020) indicates that a large proportion of the population (80 $\%$
) develops a benign form (benign form which implies that the individual recovers, whatever the healing time attributed to him), the parameter recovery-chance was therefore set to 0.8.
$\%$
) develops a benign form (benign form which implies that the individual recovers, whatever the healing time attributed to him), the parameter recovery-chance was therefore set to 0.8.
However, these two parameters (average-recovery-time and recovery-chance) only serve to initialize the epiDEM model but do not intervene in our model, in particular, with regard to the transmission of the virus, nor in the evaluation of the gravity of the disease.
3.2. Modeling and introducing the real data from Guadeloupe in the simulation
The real data used in spread simulation are coming from statistics concerning the population of Guadeloupe (FWI). For demographic information regarding age, data from the Guadeloupe archipelago in the Caribbean were recovered from data from the National Institute of Statistics and Economic Studies of France (I. N. S. E. E. National Institute of Statistics & Economic Studies of France, 2015) and the National Observatory of Fragility (Observatoire des fragilités (Fragility Observatory), 2020) (data from 2015 and 2017). All of this age data is public and available on the web. For demographic information concerning BMI, the data come from a medical thesis dealing with obesity in Guadeloupe (Carrere, Reference Carrere2010). The age and BMI data (Carrere, Reference Carrere2010) were not distributed over the same age intervals, and we gathered the data and organized it to harmonize according to the age groups presented in Table 2. The $393\,000$
inhabitants of the Guadeloupe archipelago were modeled by 3924 agents. Each agent represents a group of around 100 people. These agents were distributed in four zones representing the different islands of the archipelago: three rectangular zones for the smallest islands (Les Saintes, Marie-Galante, and Désirade) and the rest for Guadeloupe (composed of two very close islands). The distribution was made respecting the demography of each island, according to age. More specifically, an agent represents a group of 100 people of the same age range. The age ranges used for the population distribution that we used to harmonize the age and BMI data are as follows: [0–24 years], [25–54 years], [55–64 years], and [65 years and over].
$393\,000$
inhabitants of the Guadeloupe archipelago were modeled by 3924 agents. Each agent represents a group of around 100 people. These agents were distributed in four zones representing the different islands of the archipelago: three rectangular zones for the smallest islands (Les Saintes, Marie-Galante, and Désirade) and the rest for Guadeloupe (composed of two very close islands). The distribution was made respecting the demography of each island, according to age. More specifically, an agent represents a group of 100 people of the same age range. The age ranges used for the population distribution that we used to harmonize the age and BMI data are as follows: [0–24 years], [25–54 years], [55–64 years], and [65 years and over].
Percentage distribution of different nutritional status (from BMI) according to age ranges

For all the islands of the archipelago, the distribution of the BMI by age group is given in Table 2.
The distribution of nutritional status of the agents of each island is computed according to the distribution of age groups presented above. Note that data for the 0–24 years interval was not available: for this particular age group, the distribution of nutritional status of the agents was done at random. To simulate the conditions for the end of confinement on the Guadeloupe archipelago, we have introduced the number of suspected cases rather than confirmed cases on these islands. Indeed, the number of tests available on this territory being very limited, the 155 confirmed cases did not seem to correspond to reality. The feedback from the town doctors (Amor, Reference Amor2020, Séné & Pétrine, Reference Séné and Pétrine2020) and the mathematical models (Salje et al., Reference Salje, Kiem, Lefrancq, Courtejoie, Bosetti, Paireau, Andronico, Hozé, Richet, Dubost, Strat, Lessler, Levy-Bruhl, Fontanet, Opatowski, Boelle and Cauchemez2020; Roques et al., Reference Roques, Klein, Papax, Sara and Soubeyrand2020) allow us to estimate the number of suspected real cases around 2000. We therefore introduced 20 infected agents into the simulation, and we evaluated the number of sick agents after 30 days.
3.3. Experimental results
3.3.1. Number of runs of simulations
Before presenting the results of the simulations, let’s take a look at the number of runs of simulations to perform. Indeed, the execution of several simulations makes it possible to avoid falling into a local optimum. The number of runs for a simulation often varies, depending on the discipline and experience. For example, Carbo et al. (Reference Carbo, Sanchez-Pi and Molina2018) performed a MAS simulation which simulates the passenger journey through an airport (not linked to COVID-19) using NetLogo and did 30 runs of simulation. The finding is the same in the field of COVID-19 simulation using MAS: the number of runs for a simulation often varies from one research paper to another. In works using MAS for the simulation of COVID-19, Cuevas (Reference Cuevas2020) and Tatapudi et al. (Reference Tatapudi, Das and Das2020), both run five simulations for four different scenarios. Bouchnita and Jebrane (Reference Bouchnita and Jebrane2020) did three runs of simulation, Silva et al. (Reference Silva, Batista, Lima, Alves, Guimaraes and Silva2020) did seven runs of simulations per scenarios for seven various scenarios, and Vyklyuk et al. (Reference Vyklyuk, Manylich, Skoda, Radovanovic and Petrovic2021) did nine simulations or seven per scenarios for nine various scenarios.
First, we started by running 1000 simulation experiments (of the same scenario including random initialization). For these 1000 simulation runs, we consider than the pandemic spread during 30 days, on a computer cluster (without parallelism). This computer cluster has 35 nodes (32 Intel(R) Xeon(R) Gold 6240 at 2.60 GHz dual-processor ‘compute’ nodes, 12 or 16 cores per node, 64 GB or 128 GB of RAM per node, and three ‘graphics’ nodes of the same type as the compute nodes but with an NVidia graphics). The goal of this large number of simulations is to build up a statistical model and above all to have a sufficient statistic. The CPU time for the 1000 numerical simulations of the disease transmission in 30 days is around $4.5$
hours on the computer cluster. From these 1000 runs, we estimated the link between the number of critical cases and the total number of patients, using a simple linear regression. In Figure 6, we see that the model is linear and that it is robust, since it does not depend on the number of experiments. Note that the value of the slope coefficient of the straight line (0.2422) indicates that in the simulation the number of critical cases represents about a quarter of the total number of infected people; this proportion is close to certain real data (Zhou et al., Reference Zhou, Yu, Du, Fan, Liu, Liu, Xiang, Wang, Song, Gu, Guan, Wei, Li, Wu, Xu, Tu, Zhang, Chen and Cao2020).
$4.5$
hours on the computer cluster. From these 1000 runs, we estimated the link between the number of critical cases and the total number of patients, using a simple linear regression. In Figure 6, we see that the model is linear and that it is robust, since it does not depend on the number of experiments. Note that the value of the slope coefficient of the straight line (0.2422) indicates that in the simulation the number of critical cases represents about a quarter of the total number of infected people; this proportion is close to certain real data (Zhou et al., Reference Zhou, Yu, Du, Fan, Liu, Liu, Xiang, Wang, Song, Gu, Guan, Wei, Li, Wu, Xu, Tu, Zhang, Chen and Cao2020).
Linear regression of critical cases on total cases (for the 1000 runs). The abscissa axis represents the total number of cases and the ordinate axis represents the number of critical cases. The linearity indicates that the model is robust since it does not depend on the number of experiment.

3.3.2. Results of simulations
These first results from the 1000 runs were presented in Régis et al. (Reference Régis, Manicom, Doncescu, Park, Cho, Hu, Yoo, Woo, Wang, Facelli, Nam and Kang2020a) and (Reference Régis, Manicom and Doncescu2020b). We present here the numerical results for the simulations of transmission of COVID-19 during 37 days, in the Guadeloupe islands, after then end of the lockdown, without social distancing, nor barrier gesture, with an initial number of 20 infected agents for a total population of 3924 agents. As an example, the percentage of cumulative infected agent for one of the 1000 runs is given in Figure 7. The first results we present are the average values (from 1000 experiments) of the number of people infected and the different levels of severity of COVID-19. In Table 3, we can see that without barrier measures and social distancing, the number of people infected would be around 15,900 people (159 agents), or around 4% of the total population of Guadeloupe. But it is especially the number of critical cases which is alarming since 4000 people would be in a critical state requiring care in the ICU, while Guadeloupe currently has only about sixty resuscitation units.
Example of percentage of cumulative infected agent during one among the 1000 runs of the simulations during 37 days. It can be seen that the cumulative percentage (and therefore the number) of infected people increases gradually over the days of the simulation. Here, in this run, the final percentage is about 7%.

Mean number of infected people on the 1000 runs of simulation

We also compute the mean and the standard deviation of each level of severity for the two risk factors, age and BMI. The results are given in Table 4 and provide interesting results.
Mean and standard deviation of each level of severity for the two factor risks, age and BMI
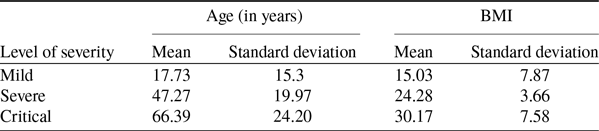
For instance, the mean age for the critical cases is 66.39 years, with a standard deviation of 24.20 that means a person of 40 years old can be in critical case because of he is obese.
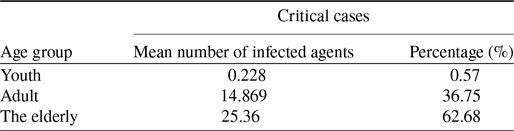
Moreover, if we look at the proportion of age groups at the level of the critical cases presented in the following Table 5, we see that the vast majority of these critical cases are elderly (which is consistent with the mean age of critical cases found in Table 4). However, it should be noted that more than 30% of these critical cases are people in the adult age group (25–55 years). Again, although this proportion of adults among critical cases seems high, it is very similar to some medical data observed in reality from Guadeloupe (see Table 7) and from urban areas where the percentage of obese people is significant (see Petrilli et al., Reference Petrilli, Jones, Yang, Rajagopalan, O’Donnell, Chernyak, Tobin, Cerfolio, Francois and Horwitz2020).
Mean number of infected people on the 1000 runs of simulation
Besides, we were interested in the way in which the critical cases had been calculated on all the runs. The distribution of critical cases over the 1000 simulation runs on the histogram is presented in Figure 8. In this figure, we can see that the values of the numbers of critical cases are of the order of 40 agents, for 4000 cases. The distribution of values may seem surprising, but it is mainly due to the fact that NetLogo’s random methods (Wilensky, Reference Wilensky1999) are based on Mersenne Twister (Matsumoto & Nishimura, Reference Matsumoto and Nishimura1998) which is a well-known pseudo-random number generator.
Histogram of critical cases over the 1000 runs of the simulation.

In order to better assess the relevance of this approach, we sought to compare it with existing simulation methods taking into account the same type of factors and providing at least a number of infected cases using data from Guadeloupe, French West Indies. We looked for available SIR method using both age and obesity, but as far as we know, existing and available SIR methods only use age as a risk factor. So we have used and configured an online SIR method which takes age as a risk factor. This method presented in Noll et al. (Reference Noll, Aksamentov, Druelle, Badenhorst, Ronzani, Jefferies, Albert and Neher2020a,Reference Noll, Aksamentov, Druelle, Badenhorst, Ronzani, Jefferies, Albert and Neherb) uses demographic age data for a given region or country (from United Nations data). estimation of the risk factor is done based on Chinese CDC (Reference Chinese2020) (for more details, see Noll et al., Reference Noll, Aksamentov, Druelle, Badenhorst, Ronzani, Jefferies, Albert and Neher2020a). We tested this method with the figures we had for Guadeloupe (number of inhabitants, number of suspected cases at initialization, simulation for about 1 month, etc.), and we configured the parameters to simulate the absence of barrier gestures and social distancing in this SIR approach. We remind that this SIR method only takes age as a risk factor. It provides a number of critical cases but this number is limited by the number of ICU beds. This means that for Guadeloupe, the number of critical cases cannot exceed 60. However, this approach provides a number of cases called ‘overflow’ which are critical cases, not taken care of in ICU beds. Thus, when we talk about critical cases in the results for this SIR method, we systematically sum the critical cases and the overflow cases. We mainly present the results from this SIR method for critical cases. The results for the critical cases are given in Table 6.
Number and percentage of critical cases by age group for the SIR simulation (for more details, see Noll et al., Reference Noll, Aksamentov, Druelle, Badenhorst, Ronzani, Jefferies, Albert and Neher2020a)

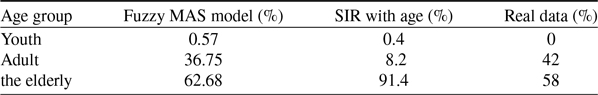
It is clear that the number of critical cases is much lower in the SIR method than in our approach. Indeed, our model provides five times more critical cases than this SIR method (respectively 4000 for our approach and 719 for this SIR method). Moreover, if we compare the percentages of adults in critical cases for example, the percentage for the SIR method is less than 10% (see Table 6) while in our method, this percentage is greater than 30% (see Table 5). These large differences can be explained mainly by the fact that the SIR method takes into account only age as a risk factor, whereas our approach takes into account both age and obesity. However, for a population like that of Guadeloupe, which has a large number of overweight or obese people, this obesity factor can strongly influence the results. Results from the United States (where obese or overweight people are in large numbers) tend to prove this strong influence of obesity as a factor. In Pettit et al. (Reference Pettit, MacKenzie, Ridgway, Pursell, Ash, Patel and Pho2020), a set of 238 critically infected people was separated into five groups according to their BMI. Among these five groups, the three groups corresponding to the obesity grades (respectively grade I, II, and III) represent 61% of the total group of patients (respectively composed of 63, 29, and 54 people). In particular, the last group (grade III) represents 22.6% of the total number of patients. And this group has an average age of 51.1 years, which means that most of the people in this group are adults, not the elderly. And when we analyze the average age of these three groups (respectively 57.1, 56.9, and 51.1 years), it is clear that these three groups are a priori more composed of adults than of elderly people. Thus, around 61% of all these patients are rather made up of adults (and not old people). These real data are closer to the results of our approach (using age and obesity as risk factors) than to those of the SIR model (taking into account only age as a risk factor). Furthermore, in Table 7, by comparing the percentages of age groups having contracted critical forms, we can see that our approach provides proportions similar to those observed in Guadeloupe (the critical cases of Guadeloupe were estimated by counting infected persons placed in intensive care during one of the weeks of the 2nd wave of COVID-19 in August–September 2020 Agence régionale de Santé de Guadeloupe (Regional Health Agency of Guadeloupe), 2020).Thus, our approach therefore makes it possible to take into account the reality of certain real data such as obesity which is an aggravating factor for COVID-19 and provides relevant results at this level.
Comparison of percentage of critical cases by age group by simulations methods with real data from Guadeloupe (the critical cases of Guadeloupe were estimated by counting infected persons placed in intensive care during one of the weeks of the 2nd wave of COVID-19 in August–September 2020 (Agence régionale de Santé de Guadeloupe (Regional Health Agency of Guadeloupe), 2020)
Let’s recall that the results of this fuzzy MAS model show that 15,900 people (159 agents), or around 4% of the total population of Guadeloupe can be infected, and especially the number of critical cases can be alarming since 4000 people would be in a critical state requiring care in the ICUs. The results of the simulation presented in this paper are above the results measured in Guadeloupe. But we must first remember that the model simulated a situation where there was no respect for barrier gestures or social distancing. However, even if the values do not correspond to reality, it should be noted that the proportions are in line with observed facts: thus the proportion of critical cases compared to the total number of infected cases is close to certain medical data (Zhou et al., Reference Zhou, Yu, Du, Fan, Liu, Liu, Xiang, Wang, Song, Gu, Guan, Wei, Li, Wu, Xu, Tu, Zhang, Chen and Cao2020). Likewise, the proportion of adults in a situation of obesity who are in a critical state is close to medical data (Petrilli et al., Reference Petrilli, Jones, Yang, Rajagopalan, O’Donnell, Chernyak, Tobin, Cerfolio, Francois and Horwitz2020). One could say that this approach is exaggerated, very pessimistic and unrealistic. However the statistics of the pandemic on this archipelago during the last weeks, show that this simulation is more and more close to reality.
After this step of simulation robustness tests and first results, the experiments which are presented in the following paragraphs were carried out with series of 10 runs of simulations. These series of 10 runs of simulations were carried out on a computer with four cores and 7 GB of RAM.
We continued the comparison by looking at the numbers for the second wave of COVID-19 in Guadeloupe. This second wave started during the holidays, at the end of July 2020. This period from July to the beginning of September 2020 corresponded to the summer holidays in France and Guadeloupe, and it seems that during the summer holidays, people relax in terms of respecting barrier gestures and social distancing (see Roussel, Reference Roussel2021). We initialized our model by summing the actual number of infected for the last two weeks of August 2020. By comparing the curves of the real data and the simulation (our fuzzy MAS simulation and the SIR approach), we can see that the values of the curves are not so distant in the first few weeks, but the difference is in the last weeks where the SIR approach moves away from the real data while our fuzzy MAS simulation stays quite close to real data (see Figure 9). The significant difference especially in the last few weeks between the SIR model (with age) and the real data comes a priori from the fact that there are no restrictions and that this strongly impacts this SIR model. Our approach based on a Fuzzy MAS model is closer to real data than the SIR model, and this, under the same conditions (same initial values, same conditions of absence of barrier gestures).
Comparison of the cumulative number of actual infected with the cumulative number of infected calculated by the fuzzy MAS simulation and with the SIR approach.(real data source: see (Agence régionale de Santé de Guadeloupe (Regional Health Agency of Guadeloupe), 2020).

This is confirmed in the Euclidean Distance (ED) Data Similarity Measures table (see Table 8). The difference is almost three times greater between the real data and the SIR model (with age) than between the real data and the fuzzy MAS model.
ED between the real data and the two simulations (Fuzzy MAS model and SIR model)

Restrictive measures were taken by local and national authorities but if they had not been followed, the average of the total number of cases in our simulation ( $15\,900$
) could have been reached in a few weeks. The approach proposed in this paper therefore seems to be relevant. This would explain why our model, which considers that no one respects barrier gestures, approaches the real data during this holiday period of 2020, which in Guadeloupe corresponded to the second epidemic wave.
$15\,900$
) could have been reached in a few weeks. The approach proposed in this paper therefore seems to be relevant. This would explain why our model, which considers that no one respects barrier gestures, approaches the real data during this holiday period of 2020, which in Guadeloupe corresponded to the second epidemic wave.
3.3.3. Simulations of COVID-19 with variants
As noted in section 2.6, we sought to simulate the COVID-19 variants. We therefore carried out 10 runs of simulations with the same parameterization of the section above (especially at the level of the initial number of people infected with the ‘classic’ COVID-19) by introducing only two agents infected with a (more contagious) variant of COVID-19 (let us recall that 20 infected agents with the classic COVID-19 are introduced at the start of the simulation). In addition, the introduction of these two infected agents with variant, is done halfway through the experiment, that is to say after 15 days.
The results of these simulations are given in Figure 10. It is obviously to remark that over 30 days, the classic virus remains in the majority, with the variant arriving half of the time. However, one can wonder about the trends of these viruses in the longer term. We therefore carried out a new series of 10 simulation runs, with an introduction of a variant after 15 days. But this time, each experiment lasted 200 days and not 30 days. In Figure 11, the results are totally different since the variant supplants the classical virus, being its greater transmissibility.
Curves of the number of agents infected per day (daily average of 10 tests) over 30 days, respectively, for classic COVID-19 and for a variant.

The variant supplants the classic virus in around 2 months (Figure 11). The time obviously remains relative, but the simulation conforms to reality since currently, wherever they are present, the variants more contagious than the classic virus represent the majority of infected people. Either way, this simple modeling of virus variants based on increasing the transmissibility grid makes it possible to simulate the spread of these new forms of COVID-19 and to differentiate them from the classic virus.
Representations of the number of agents infected per day (daily average of 10 tests) respectively for classic COVID-19 and for a variant over 200 days. The number of agents infected with the variant greatly exceeds that of the classical virus. The overtaking is done roughly around 67 days.

Once again, we sought to compare our simulation to the real data. The 4th wave, which recently hit Guadeloupe during the months of July and August 2021, was the strongest and the deadliest. This is mainly because it is linked to variants of the virus (Agence régionale de Santé de Guadeloupe (Regional Health Agency of Guadeloupe August 2021), 2021), which are more contagious. We also initialized the simulations (Fuzzy MAS on the one hand, and SIR with age on the other hand) with the actual number of infected for the two weeks preceding the start of these simulations.
Here again, the Fuzzy SMA approach gives results that are closer to reality than the SIR method (see Figure 12). This is confirmed by the calculation of the ED Data Similarity Measures in Table 9, although this time the difference from the actual data is smaller (twice as large for the SIR method). We can therefore see that the simple modeling of the variant makes it possible to have results quite close to reality.
Comparison of the cumulative number of actual infected with the cumulative number of infected calculated by the fuzzy MAS simulation and with the SIR approach in summer 2021. (real data source: see (Agence régionale de Santé de Guadeloupe (Regional Health Agency of Guadeloupe August 2021), 2021).

ED between the real data and the two simulations (Fuzzy MAS model and SIR model) for summer 2021

3.3.4. Estimated number of deaths from FI
As explained in the Section 2.7, considering the FI, it is possible to estimate the number of death. The FI is an open scale starting at the value 0. The highest value for Guadeloupe are the values exceeding $5.4$
. People with this score have significant fragility. 10 simulation runs were performed. For this run of 10 simulations, the elderly person having a strong frailty index with a critical form of COVID-19 are supposed to die. The average number of deaths for 10 simulations was calculated considering an time interval of 37 days. Simulations show that around
$5.4$
. People with this score have significant fragility. 10 simulation runs were performed. For this run of 10 simulations, the elderly person having a strong frailty index with a critical form of COVID-19 are supposed to die. The average number of deaths for 10 simulations was calculated considering an time interval of 37 days. Simulations show that around $3.4$
agents or 340 people with COVID-19 would die after contracting a critical form. By comparing the number of deaths to the number of people who have had a critical form of COVID-19, namely 4000 people, we see that almost 10% of those seriously ill could die. This is close to certain studies which have estimated the number of deaths by age group (see O’Driscoll et al., Reference O’Driscoll, Santos, Wang, Cummings, Azman, Paireau, Fontanet, Cauchemez and Salje2021). If we compare this results from simulation with real data, we can say that a great gap as after more than one year of pandemic in Guadeloupe. The total number of deaths is 236 (see Dong et al., Reference Dong, Du and Gardner2020), while we get more than 300 deaths in 37 days in the simulation. However, we must recall that the simulation models a situation where no lockdown neither barrier gestures are respected. Otherwise, the use of this FI in this particular context, seems to be relevant at least for a relative comparison. Indeed, if we compare the number of people with a high FI (greater than
$3.4$
agents or 340 people with COVID-19 would die after contracting a critical form. By comparing the number of deaths to the number of people who have had a critical form of COVID-19, namely 4000 people, we see that almost 10% of those seriously ill could die. This is close to certain studies which have estimated the number of deaths by age group (see O’Driscoll et al., Reference O’Driscoll, Santos, Wang, Cummings, Azman, Paireau, Fontanet, Cauchemez and Salje2021). If we compare this results from simulation with real data, we can say that a great gap as after more than one year of pandemic in Guadeloupe. The total number of deaths is 236 (see Dong et al., Reference Dong, Du and Gardner2020), while we get more than 300 deaths in 37 days in the simulation. However, we must recall that the simulation models a situation where no lockdown neither barrier gestures are respected. Otherwise, the use of this FI in this particular context, seems to be relevant at least for a relative comparison. Indeed, if we compare the number of people with a high FI (greater than $5.4$
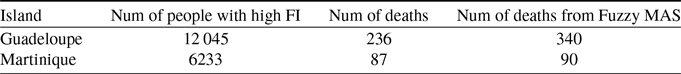
) in two equivalent regions, we can see certain correlations. So, by comparing Guadeloupe with Martinique, another French West Indies, which has a similar number of inhabitants, a comparable level of wealth and a very similar distribution of the population by age group, we remark a strong correlation between the index fragility and the number of deaths due to COVID-19. The number of deaths is a little more than double in Guadeloupe compared to Martinique. This important difference is difficult to explain from a medical viewpoint. However, in Table 10, we see that the number of people with a high FI is almost double in Guadeloupe compared to Martinique. We therefore performed a simulation of the number of deaths due to the pandemic in Martinique (in particular respecting the number of inhabitants and the FI) and the number of simulated deaths is much lower than in Guadeloupe, since is 90 death (
$5.4$
) in two equivalent regions, we can see certain correlations. So, by comparing Guadeloupe with Martinique, another French West Indies, which has a similar number of inhabitants, a comparable level of wealth and a very similar distribution of the population by age group, we remark a strong correlation between the index fragility and the number of deaths due to COVID-19. The number of deaths is a little more than double in Guadeloupe compared to Martinique. This important difference is difficult to explain from a medical viewpoint. However, in Table 10, we see that the number of people with a high FI is almost double in Guadeloupe compared to Martinique. We therefore performed a simulation of the number of deaths due to the pandemic in Martinique (in particular respecting the number of inhabitants and the FI) and the number of simulated deaths is much lower than in Guadeloupe, since is 90 death ( $0.9$
dead agents). A comparison of the results is given in Table 10. The number of deaths estimated by this method based on the fragililty index remains very partial since the index only concerns the elderly. But it still allows to have an idea in terms of relative value. Once again, the values provided by our approach are not necessarily relevant in absolute value but they are close to reality in relative value. This index could therefore be correlated at least in a relative way to the number of deaths from COVID-19.
$0.9$
dead agents). A comparison of the results is given in Table 10. The number of deaths estimated by this method based on the fragililty index remains very partial since the index only concerns the elderly. But it still allows to have an idea in terms of relative value. Once again, the values provided by our approach are not necessarily relevant in absolute value but they are close to reality in relative value. This index could therefore be correlated at least in a relative way to the number of deaths from COVID-19.
Comparison between Guadeloupe and Martinique. Data on the number (Num) of deaths from COVID 19 come from Dong et al. (Reference Dong, Du and Gardner2020), fragility data come from Observatoire des fragilités (Fragility Observatory) (2020)
Although this FI is a national index for France, taking into account socioeconomic factors would make it possible to better model the current pandemic and its consequences on health systems.
4. Discussion
The simulation presented here uses a model based on SMA and fuzzy sets in which we consider that no one respects barrier gestures or social distancing. The tests were performed on data from the Guadeloupe archipelago, an overseas region of France. Taking into account two aggravating factors (age and obesity), the presenting results show that $15\,900$
people (159 agents), or around 4% of the total population of Guadeloupe can be infected, and especially the number of critical cases can be alarming since 4000 people would be in a critical state requiring care in the ICUs. An estimate of the death toll based on a socioeconomic factor establishes the death toll as 340. Furthermore, the modeling of a more contagious variant has been also presented, and it shows that this variant supplants the classic virus. The results of our model are superior to the real data measured in Guadeloupe. This is not so surprising since the model simulates the failure of respecting barrier gestures and social distancing. However, it should be emphasized that the proportions estimated in this simulation are close to reality. As stated above, the proportion of critical cases in relation to the total number of infected cases is close to medical data (Zhou et al., Reference Zhou, Yu, Du, Fan, Liu, Liu, Xiang, Wang, Song, Gu, Guan, Wei, Li, Wu, Xu, Tu, Zhang, Chen and Cao2020), and the proportion of adults (especially obese adults who are in a critical state is also close to medical data from Guadeloupe (Agence régionale de Santé de Guadeloupe (Regional Health Agency of Guadeloupe), 2020) and from other region (Petrilli et al., Reference Petrilli, Jones, Yang, Rajagopalan, O’Donnell, Chernyak, Tobin, Cerfolio, Francois and Horwitz2020). Our model fit the reality concerning the variant, when we compare the evolutions of the variants with that of the classic virus. Currently, the variants take over almost every where in the world. And estimating the number of deaths based on socioeconomic factors can at least be used to compare regions or countries at the same level. To summarize the contribution of this approach, we could say that the results of this simulation are relevant to reality, especially if we consider them in their relative values, rather than in their absolute values. These results further emphasize the importance of respecting barrier gestures and social distancing. Another strong point of this model is both its specificity for a particular region (in the case presented, the archipelago of Guadeloupe, the French Antilles) and the ease of adaptation to a particular area given demographic data and medical conditions in this area.
$15\,900$
people (159 agents), or around 4% of the total population of Guadeloupe can be infected, and especially the number of critical cases can be alarming since 4000 people would be in a critical state requiring care in the ICUs. An estimate of the death toll based on a socioeconomic factor establishes the death toll as 340. Furthermore, the modeling of a more contagious variant has been also presented, and it shows that this variant supplants the classic virus. The results of our model are superior to the real data measured in Guadeloupe. This is not so surprising since the model simulates the failure of respecting barrier gestures and social distancing. However, it should be emphasized that the proportions estimated in this simulation are close to reality. As stated above, the proportion of critical cases in relation to the total number of infected cases is close to medical data (Zhou et al., Reference Zhou, Yu, Du, Fan, Liu, Liu, Xiang, Wang, Song, Gu, Guan, Wei, Li, Wu, Xu, Tu, Zhang, Chen and Cao2020), and the proportion of adults (especially obese adults who are in a critical state is also close to medical data from Guadeloupe (Agence régionale de Santé de Guadeloupe (Regional Health Agency of Guadeloupe), 2020) and from other region (Petrilli et al., Reference Petrilli, Jones, Yang, Rajagopalan, O’Donnell, Chernyak, Tobin, Cerfolio, Francois and Horwitz2020). Our model fit the reality concerning the variant, when we compare the evolutions of the variants with that of the classic virus. Currently, the variants take over almost every where in the world. And estimating the number of deaths based on socioeconomic factors can at least be used to compare regions or countries at the same level. To summarize the contribution of this approach, we could say that the results of this simulation are relevant to reality, especially if we consider them in their relative values, rather than in their absolute values. These results further emphasize the importance of respecting barrier gestures and social distancing. Another strong point of this model is both its specificity for a particular region (in the case presented, the archipelago of Guadeloupe, the French Antilles) and the ease of adaptation to a particular area given demographic data and medical conditions in this area.
5. Conclusion
In this paper, we have presented an approach allowing to model and simulate the diffusion of COVID-19 in an insular context, considering a non-respect of social distancing and barrier gestures. The model of the spread of the COVID-19 pandemic used a MAS and was based on demographic data and medical knowledge related to two risk factors: age and obesity. These two aggravating risk factors were introduced into the MAS using fuzzy sets. The worsening of disease caused by these risk factors was modeled by fuzzy aggregation operators. This model focuses on the level of severity of disease (mild, severe or critical) for infected people and two real risk factors (age and BMI) which are essential to assess the severity of infected people. The estimation of the number of death based on a socioeconomic factor, the FI, has also been presented and a simplified modeling of the diffusion of virus variants has been proposed.
All these factors, whether they are medical (BMI), demographic (age), socioeconomic (FI) or biological (variant modeling) risk factors, make it possible to get closer to reality, even if this proximity between simulation and reality remain on relative values and not on absolute values.The question of simulation taking into account barrier gestures remains topical. More specifically, a hybrid approach (compliance/non-compliance with barrier gestures with or without vaccination, and depending on the circumstances and periods) could bring even closer results, especially in an absolute way and not only in a relative way. The study of the impact of these barrier gestures is an element that will have to be deepened. Further modeling of movement and social relations between agents will be considered. In addition, the inclusion of one-off or frequent events (public holidays, school vacations) could also be considered as parameters of the model. The question of infected cases located at the borders of fuzzy sets is also an avenue to explore. Therefore, the prediction of COVID-19 spreading will be more accurate and might even predict certain trends.
Conflicts of interest
The author(s) declare none.


 Open access