


Key findings
-
• Housing inadequacy and population density were key vaccination barrier variables.
-
• Driving distance notably affected vaccine uptake early in the rollout phases.
-
• Rural/northern Clark County had consistently high barrier index scores and low vaccination rates.
-
• Booster vaccinations showed fewer vulnerable census tracts overall.
Introduction
Early in the COVID-19 pandemic in the United States (US), biotechnological companies worldwide were challenged to develop effective COVID-19 vaccines, with over 150 potential vaccines proposed by July 2020 [Reference Kaur and Gupta1]. Subsequently, the first mRNA-based vaccines became available in late 2020 [Reference Fortner and Schumacher2], and the US Food and Drug Administration (FDA) approved their emergency use for individuals over 17 years old in December 2020 [Reference Bailey and Wilson3]. By June 2022, approximately 67% of the total US population had been fully vaccinated for COVID-19 (with either two doses of mRNA vaccines like Pfizer-BioNTech or Moderna, or one dose of the Johnson & Johnson vaccine). About 47% of those fully vaccinated had received at least one booster dose.
However, vaccination rates have varied by state and county due to various vaccination barriers, such as vaccine hesitancy [Reference Yasmin4] that is influenced by personal beliefs, peer pressure, preconceptions, perceptions, healthcare knowledge, and political tendencies [Reference Brannen5–Reference Nawas7]. In June 2020, a survey showed that only 34% of the US public would consider taking the COVID-19 vaccines once they became available, indicating widespread vaccine hesitancy at that time [Reference Bolsen and Palm8]. Another national survey reported a 10.8% longitudinal decline in vaccination hesitancy between October 2020 and March 2021 [Reference Daly, Jones and Robinson9]. Although the percentage of individuals receiving at least one dose of the COVID-19 vaccine increased from 67.2% in 2021 to 74.7% in 2022, reported vaccine hesitancy also rose during the same period, from 40.7% to 44.6% [Reference Nguyen10]. Beyond hesitancy, vaccination barriers may arise from socioeconomic and community factors that influence populations’ mobility and vaccine accessibility [Reference Caspi11–Reference Qi13].
The distribution of COVID-19 vaccines to vaccination sites, pharmacies, and medical facilities requires a coordinated effort involving government agencies, pharmaceutical companies, distribution partners, and healthcare providers [Reference Burgos14, Reference Herlitz15]. Given the large territory of the US, disproportions or disparities in vaccination distribution are often inevitable. A literature review study revealed that individuals from rural areas often faced limited access to COVID-19 vaccines due to a lack of transportation to remote vaccine sites [Reference Kuehn16]. An evaluation of health equity in COVID-19 vaccine distribution plans in the US highlighted the disadvantage experienced by underserved populations (e.g., racial and ethnic minority groups) who lack access to healthcare and found that most COVID-19 vaccination plans were created without advice from a health equity committee [Reference Hardeman17].
There are diverse metrics for quantifying inequity in vaccine accessibility, such as the travel time or distance to the closest vaccine sites [Reference Mazar18, 19], clinic-to-population ratio [Reference Xu and Jiang20], supply and demand for vaccines [Reference Liu21], and the number of sites per population within a certain walkshed [Reference Mullachery22]. Researchers have explored advanced analytic approaches to quantify vaccination accessibility. For example, the two-step floating catchment area method has become popular for evaluating spatial accessibility to COVID-19 vaccine resources in the US, accounting for travel distance/time and vaccination supplies [Reference Qi13, Reference Kang23, Reference Tao24]. However, those analyses typically do not factor in temporal variations caused by changing demands, supplies, and infrastructures over time.
Creating a composite index that amalgamates various community indicators emerged as an effective strategy to assess COVID-19 health outcomes [Reference Freese25–Reference Nayak, Islam, Mehta, Ko, Patel, Goyal, Sullivan, Lewis, Vaccarino, Morris and Quyyumi28]. The Centers for Disease Control and Prevention (CDC)’s Social Vulnerability Index (SVI), based on equal weights of 16 social determinant variables, has been applied to assess vaccine accessibility and vaccination rates [Reference Thakore29–Reference Chien31]. Providing the dynamic nature of the pandemic and policy response, however, these weights likely vary among the variables and over time. Chien et al. [Reference Chien32, Reference Chien33] established a framework for constructing community vulnerability indexes (CVIs) with optimal weights estimated from the weighted quantile sum or lagged weighted quantile sum (LWQS) regression. The CVIs showed better associations with COVID-19 incidence than the SVI.
The primary objective of this study is to develop a time-varying, census-tract-level COVID-19 vaccination barrier index (CVBI) by vaccination type (i.e., partial, full, and booster vaccination) in Clark County, Nevada, following the framework of Chien et al. [Reference Chien32, Reference Chien33]. The CVBI integrates multiple community factors, including monthly vaccine accessibility based on the travel distance to vaccination locations from December 2020 to June 2022. Subsequently, the CVBI was examined using a spatiotemporal modelling approach to assess geographic disparities. Our hypothesis posits that CVBI may form spatial clusters, informed by its diverse associations with the COVID-19 vaccination rate. This study identifies vulnerable areas characterized by higher levels of vaccination barriers and the major contributors to such barriers. These findings can potentially prompt local health agencies to develop strategies or policies for effectively improving vaccine accessibility and vaccination rates in vulnerable areas during future pandemics.
Methods
Study area
Clark County is located in the southern part of the state of Nevada, spanning a diverse landscape ranging from the Mojave Desert to the Colorado River. It encompasses the iconic city of Las Vegas and its metropolitan area with a population of approximately 2.3 million in 2020, forming a vibrant urban area and tourist destination. Clark County spans nearly 21,000 km2 and contains three incorporated cities, Las Vegas, Henderson, and North Las Vegas, as well as several unincorporated towns, with a total of 535 census tracts.
Since the COVID-19 vaccination rolled out in December 2020, equitable distribution of vaccines in Clark County, Nevada, has been a challenge. The first group that received vaccination, known as the Tier-1 individuals, included healthcare and emergency workers. Vaccination for Tier-2 individuals (education and other essential workers) started in January 2021, followed by Tier-3 individuals (age 65+ and other risk groups) in February 2021. Vaccines became available for all individuals (age 18–64) by April 2021, but younger populations did not start to be vaccinated until November 2021. The vaccinations were generally not mandatory for Tier-2 and lower-tier individuals, except under certain circumstances. The FDA also authorized a booster dose for those fully vaccinated around September 2021.
Data source and variable definition
This study assessed 31 vaccination barrier variables at the census tract level, where 15 variables were consistent with the CDC’s SVI and Chien et al. [Reference Chien32, Reference Chien33]’s CVIs, including the percentages of poverty with income level below 150% Federal Poverty Level, unemployment, individuals without a high school diploma, individuals without health insurance, individuals aged 65 and older, individuals aged 17 and younger, individuals with disabilities, single-parent households, individuals with limited English language proficiency, minority, multi-unit structures, mobile homes, crowding, group quarters (places where people live or stay in a group living arrangement that is owned or managed by entities or organizations, such as nursing homes or shelters), and individuals lacking vehicle access. In particular, “minority” refers to Hispanic or Latino individuals of any race and non-Hispanic or Latino individuals from racial categories including Black, American Indian, American Native, Asian, Native Hawaiian, Pacific Islander, multiple races, and other races. The only SVI variable excluded is the percentage of households cost burdened, which was replaced by two variables: the percentages of owner households cost burdened and renter households cost burdened. These variables were obtained from the American Community Survey, using the 5-year estimate from 2016 to 2020.
Six variables in Chien et al. [Reference Chien32, Reference Chien33]’s CVIs and used in this study were adopted from the California Healthy Places Index [Reference Maizlish34], including inactive commuting (the percentage of workers aged 16 and above who did not commute via transit, walking, or cycling), park deprivation (the percentage of the population residing more than half a mile away from a park, beach, or open space larger than one acre), retail density (the concentration of retail, entertainment, service, and education jobs per acre on unprotected land), housing inadequacy (the percentage of households lacking kitchen facilities and plumbing), segregation (i.e., the index of dissimilarity) [Reference Krieger35], and population density (the number of residents divided by the area in square miles).
Additional variables include those specifically related to vaccination accessibility and vaccine hesitancy. Vaccine accessibility was based on the average of driving distances from the centroid of each census tract to the three closest vaccination locations. Four distinct variables were developed and used, corresponding to vaccine accessibility from hospitals, pharmacies, providers, and temporary vaccination sites, respectively, with higher values indicating lower vaccine accessibility. Providers include primary care physicians, urgent care centres, and community health clinics like Nevada Health Centers. Temporary sites were organized by the Southern Nevada Health District (SNHD) to increase access in underserved areas, including several mobile vaccination units. The monthly vaccination location data throughout the study period were collected and made available by the SNHD. Supplementary Figure S1 shows all vaccination locations. Furthermore, accessibility to public transportation, as represented by bus stop density per capita, was computed using bus stop locations from the Regional Transportation Commission of Southern Nevada [36].
Vaccine hesitancy were surrogated by (1) religion density as represented by the number of religious establishments per 1,000 residents, derived from the religious statistics in National Neighbourhood Data Archive [Reference Melendez37]; (2) health illiteracy as indicated by the percentage of individuals incapable of locating, comprehending, and utilizing health information [Reference Fang38, Reference Martin39]; and (3) air quality as represented by the PM2.5 concentration [Reference Reid40]. Religious beliefs and health illiteracy have commonly been associated with vaccine hesitancy [Reference Tiwana and Smith41, Reference Tollison and Lopresti42]. It was also found that vaccine-hesitant parents believed they could protect their child’s life from infectious diseases through a healthy lifestyle, including better air quality [Reference Guay43].
The four vaccination accessibility variables and PM2.5 concentration were dynamic, updated each month from December 2020 to June 2022, while other variables remained static. Chien et al. [Reference Chien33] noted that the weights of static variables in CVIs did change over time due to external factors like policy interventions, behavioural patterns, or the dynamic nature of the pandemic. All the 31 variables were transformed into percentile ranks among the 535 census tracts to standardize their ranges from 0 to 1 [44]. Finally, COVID-19 vaccination records were obtained from the SNHD. These data were de-identified, geocoded, and geospatially aggregated into census tracts and months from December 2020 to June 2022. Three vaccination statuses, partial (the first dose of Pfizer-BioNTech or Moderna), full (the second dose of mRNA vaccines or one dose of the Johnson & Johnson vaccine), and booster (any additional vaccines after being fully vaccinated), were counted separately.
Statistical analyses
The statistical analysis proceeded in two stages. In the first stage, we employed the LWQS regression [Reference Gennings45] to derive CVBI. The CVBI can be conceptualized as a weighted combination of the 31 variables’ quintiles ( $ {q}_i $
) with weights
$ {q}_i $
) with weights $ {w}_i $
(i.e., CVBI =
$ {w}_i $
(i.e., CVBI = $ {\sum}_{i=1}^{31}{w}_i{q}_i $
).
$ {\sum}_{i=1}^{31}{w}_i{q}_i $
). $ {w}_i $
were estimated for each month using a bootstrapping technique, where the dependent variable was the counts of one of the three vaccination statuses achieved monthly by census tract. In each bootstrap sample, we fitted a Poisson regression to derive
$ {w}_i $
were estimated for each month using a bootstrapping technique, where the dependent variable was the counts of one of the three vaccination statuses achieved monthly by census tract. In each bootstrap sample, we fitted a Poisson regression to derive $ {w}_i $
that maximizes the association between the CVBI and the dependent variable. Variable weights ranged from 0 to 1, subject to the constraint that the sum of weights equalled 1. A total of 100 bootstrap samples were analysed, and the final
$ {w}_i $
that maximizes the association between the CVBI and the dependent variable. Variable weights ranged from 0 to 1, subject to the constraint that the sum of weights equalled 1. A total of 100 bootstrap samples were analysed, and the final $ {w}_i $
in CVBI were based on the average weight across the 100 bootstrap samples. This bootstrapping process was conducted monthly. These CVBIs corresponding to partial, full, and booster vaccination rates (noted as CVBIP, CVBIF, and CVBIB, respectively) were developed, with their index values varying by census tract and by month. Notably, this study determined significant vaccination barriers based on weights greater than 1/31 ≈ 0.032, signifying their contributions to the CVBI values (i.e., exceeding the fair weight as assumed under a uniform distribution).
$ {w}_i $
in CVBI were based on the average weight across the 100 bootstrap samples. This bootstrapping process was conducted monthly. These CVBIs corresponding to partial, full, and booster vaccination rates (noted as CVBIP, CVBIF, and CVBIB, respectively) were developed, with their index values varying by census tract and by month. Notably, this study determined significant vaccination barriers based on weights greater than 1/31 ≈ 0.032, signifying their contributions to the CVBI values (i.e., exceeding the fair weight as assumed under a uniform distribution).
In the second stage, we assessed each CVBI’s association with COVID-19 vaccination rates using the Besag–York–Mollié (BYM) model [Reference Besag, York and Mollie46], where CVBI was the only independent variable. It is assumed that the COVID-19 vaccination counts (partial, full, or booster) follow a Poisson distribution with a mean parameter $ {\mu}_{ct} $
for census tract c and month t, thus:
$ {\mu}_{ct} $
for census tract c and month t, thus:
 $$ \begin{array}{c}\mathit{\log}\;\left({\mu}_{ct}\right)=\alpha +{\alpha}_c+\beta T+\\ {}{CVBI}_{ct}\times {f}_{spat}(c)+{f}_{spat}(c)+ offset\hskip0.24em c=1,\dots, 535;t=1,\dots, 19\end{array} $$
where $ \alpha $
and
$ \alpha $
and $ {\alpha}_c $
are the fixed and random intercepts, and
$ {\alpha}_c $
are the fixed and random intercepts, and $ \beta $
is the fixed slope of the calendar month
$ \beta $
is the fixed slope of the calendar month $ T $
controlling for temporal autocorrelation. The spatial function
$ T $
controlling for temporal autocorrelation. The spatial function $ {f}_{spat}(c) $
utilizes Markov random fields [Reference Baptista47], which have two roles in the model: first, as an independent term,
$ {f}_{spat}(c) $
utilizes Markov random fields [Reference Baptista47], which have two roles in the model: first, as an independent term, $ {f}_{spat}(c) $
can control for spatial autocorrelation and explain the variation of COVID-19 vaccination from unaccounted predictors; second, as an interaction term with CVBI,
$ {f}_{spat}(c) $
can control for spatial autocorrelation and explain the variation of COVID-19 vaccination from unaccounted predictors; second, as an interaction term with CVBI, $ {f}_{spat}(c) $
can examine the disparities of COVID-19 vaccination attributable to CVBI at the census tract level. The last term is an offset from the logarithm of the census tract population. A Gaussian prior was adopted for fixed and random intercepts (
$ {f}_{spat}(c) $
can examine the disparities of COVID-19 vaccination attributable to CVBI at the census tract level. The last term is an offset from the logarithm of the census tract population. A Gaussian prior was adopted for fixed and random intercepts ( $ \alpha $
and
$ \alpha $
and $ {\alpha}_c $
) and the fixed slope (
$ {\alpha}_c $
) and the fixed slope ( $ \beta $
). The spatial function
$ \beta $
). The spatial function $ {f}_{spat}(c) $
adopted an intrinsic conditional autoregressive prior. A log-Gamma prior was adopted for the precision of the random intercept and the spatial function. This model was applied separately for initial, full, and booster vaccination counts with the corresponding CVBIP, CVBIF, and CVBIB, respectively. All unknown parameters were estimated through the integrated nested Laplace algorithm [Reference Rue, Martino and Chopin48]. Moreover, the estimated spatial function interacting with the CVBI was transformed to yield the relative rate percentage (RR%) of COVID-19 vaccination counts. Census tracts with an RR% significantly less than 0 indicate areas where higher CVBI values led to lower COVID-19 vaccination rates.
$ {f}_{spat}(c) $
adopted an intrinsic conditional autoregressive prior. A log-Gamma prior was adopted for the precision of the random intercept and the spatial function. This model was applied separately for initial, full, and booster vaccination counts with the corresponding CVBIP, CVBIF, and CVBIB, respectively. All unknown parameters were estimated through the integrated nested Laplace algorithm [Reference Rue, Martino and Chopin48]. Moreover, the estimated spatial function interacting with the CVBI was transformed to yield the relative rate percentage (RR%) of COVID-19 vaccination counts. Census tracts with an RR% significantly less than 0 indicate areas where higher CVBI values led to lower COVID-19 vaccination rates.
The dataset underwent thorough cleaning and management utilizing SAS v9.4 (SAS Institute Inc., Cary, NC). ArcGIS Pro v3.4 (Environmental Systems Research Institute, Inc., Redlands, CA) measured driving distances using the Urban Network Analysis Toolbox [Reference Sevtsuk and Mekonnen49]. RStudio 2022.07.1 + 554 (RStudio Inc., Boston, MA) performed subsequent statistical analyses and mapping. A significance level of 5% was chosen for hypothesis testing and inference.
Results
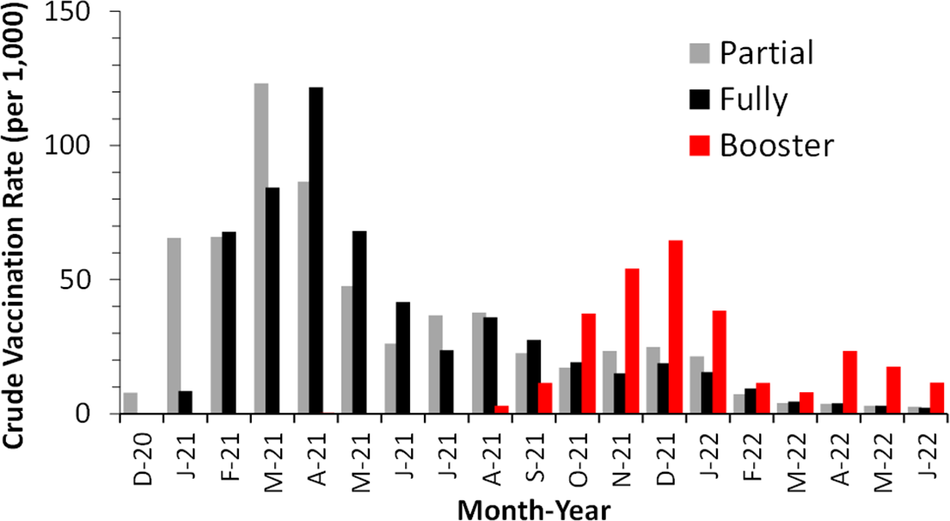
Figure 1 illustrates the monthly vaccination rates in Clark County, spanning 19 months from December 2020 to June 2022. Partial vaccination peaked in March 2021 in most census tracts, followed by full vaccination, which peaked a month later. This is consistent with the requirement that the first and second doses of mRNA vaccines are separated by 4 weeks. Subsequently, booster vaccination showed its first peak in December 2021 under the threat of the Omicron outbreak. By the end of June 2022, the cumulative partial and full vaccination rates were 627 and 571 per 1,000, respectively, across Clark County. The spatial nonuniformity of the vaccination status is illustrated in Supplementary Figure S2.
Monthly COVID-19 vaccination rates among individuals aged 5 years and older in Clark County, Nevada, December 2020 to June 2022.

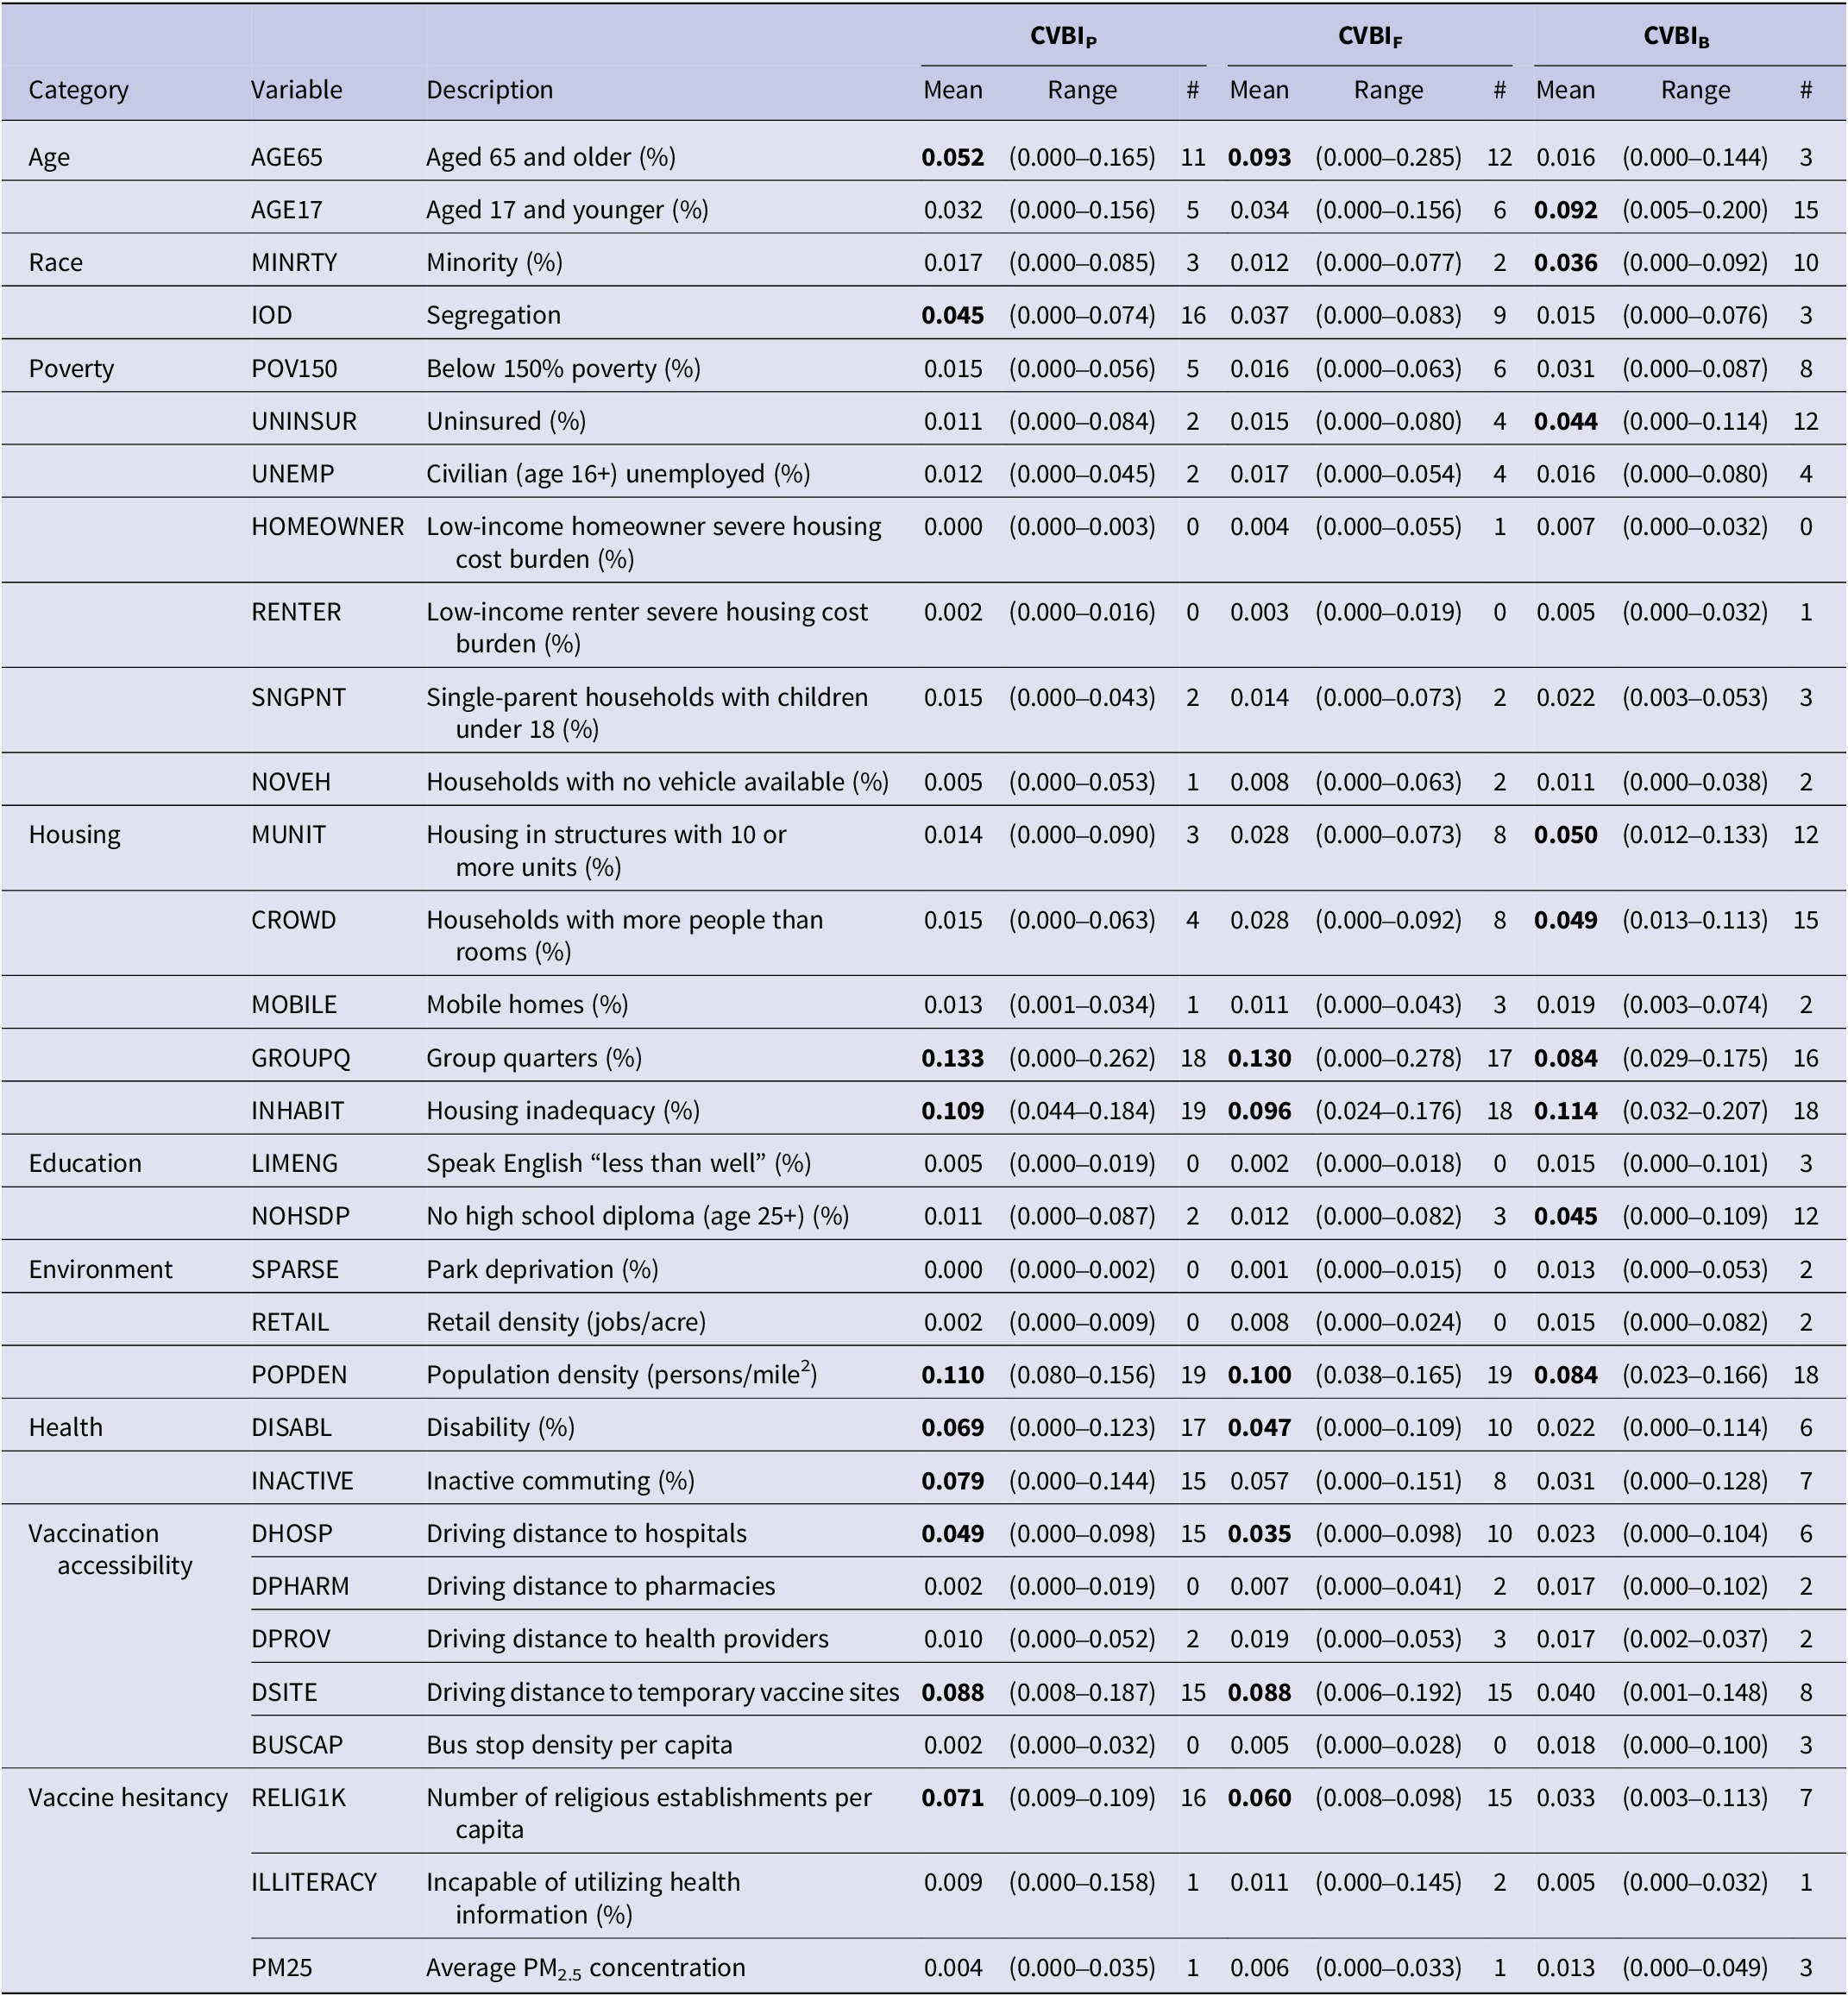
The weights of 31 variables in each CVBI, as derived through LWQS regression, varied substantially by month (Supplementary Figure S3). As summarized in Table 1, there are 10 prevalent variables with significant weights in more than half of the 19-month study period for CVBIP, including age 65+, segregation, group quarters, housing inadequacy, religious density, population density, disability, inactive commuting, and driving distances to hospitals and vaccination sites. All but segregation and inactive commuting are also prevalent variables for CVBIF. CVBIB contains 9 prevalent variables, but only three (group quarters, housing inadequacy, and population density) overlap with those for CVBIP and CVBIF. The six other prevalent variables are age 17 or younger, minority, uninsured, housing with 10+ units, crowded housing, and no high school diploma. On average, the weight of the group quarter is the highest in the CVBIP (mean = 0.133, range = 0.000–0.262) and CVBIF (mean = 0.130, range = 0.000–0.278). With respect to CVBIB, housing inadequacy has the highest average weight (mean = 0.114, range = 0.032–0.207).
A summary of weights of 31 variables in the COVID-19 partial, full, and booster vaccination barrier indices (CVBIP, CVBIF, and CVBIB), as estimated by the lagged weighted quantile sum regression

# = The number of months with a weight > 0.032. Variables with significant weights in 10 or more months are bolded.
A ranking of variables, based on the number of months as a significant vaccination barrier, is provided in Supplementary Table S1. Group quarters, housing inadequacy, and population density were consistently ranked as top vaccination barriers across all three CVBIs, with weights exceeding 0.032 for at least 16 months. On the other hand, some community condition variables, such as bus stop density, homeowner and renter housing burdens, English speaking, retail density, and park deprivation, were rarely significant vaccination barriers for the CVBIs.
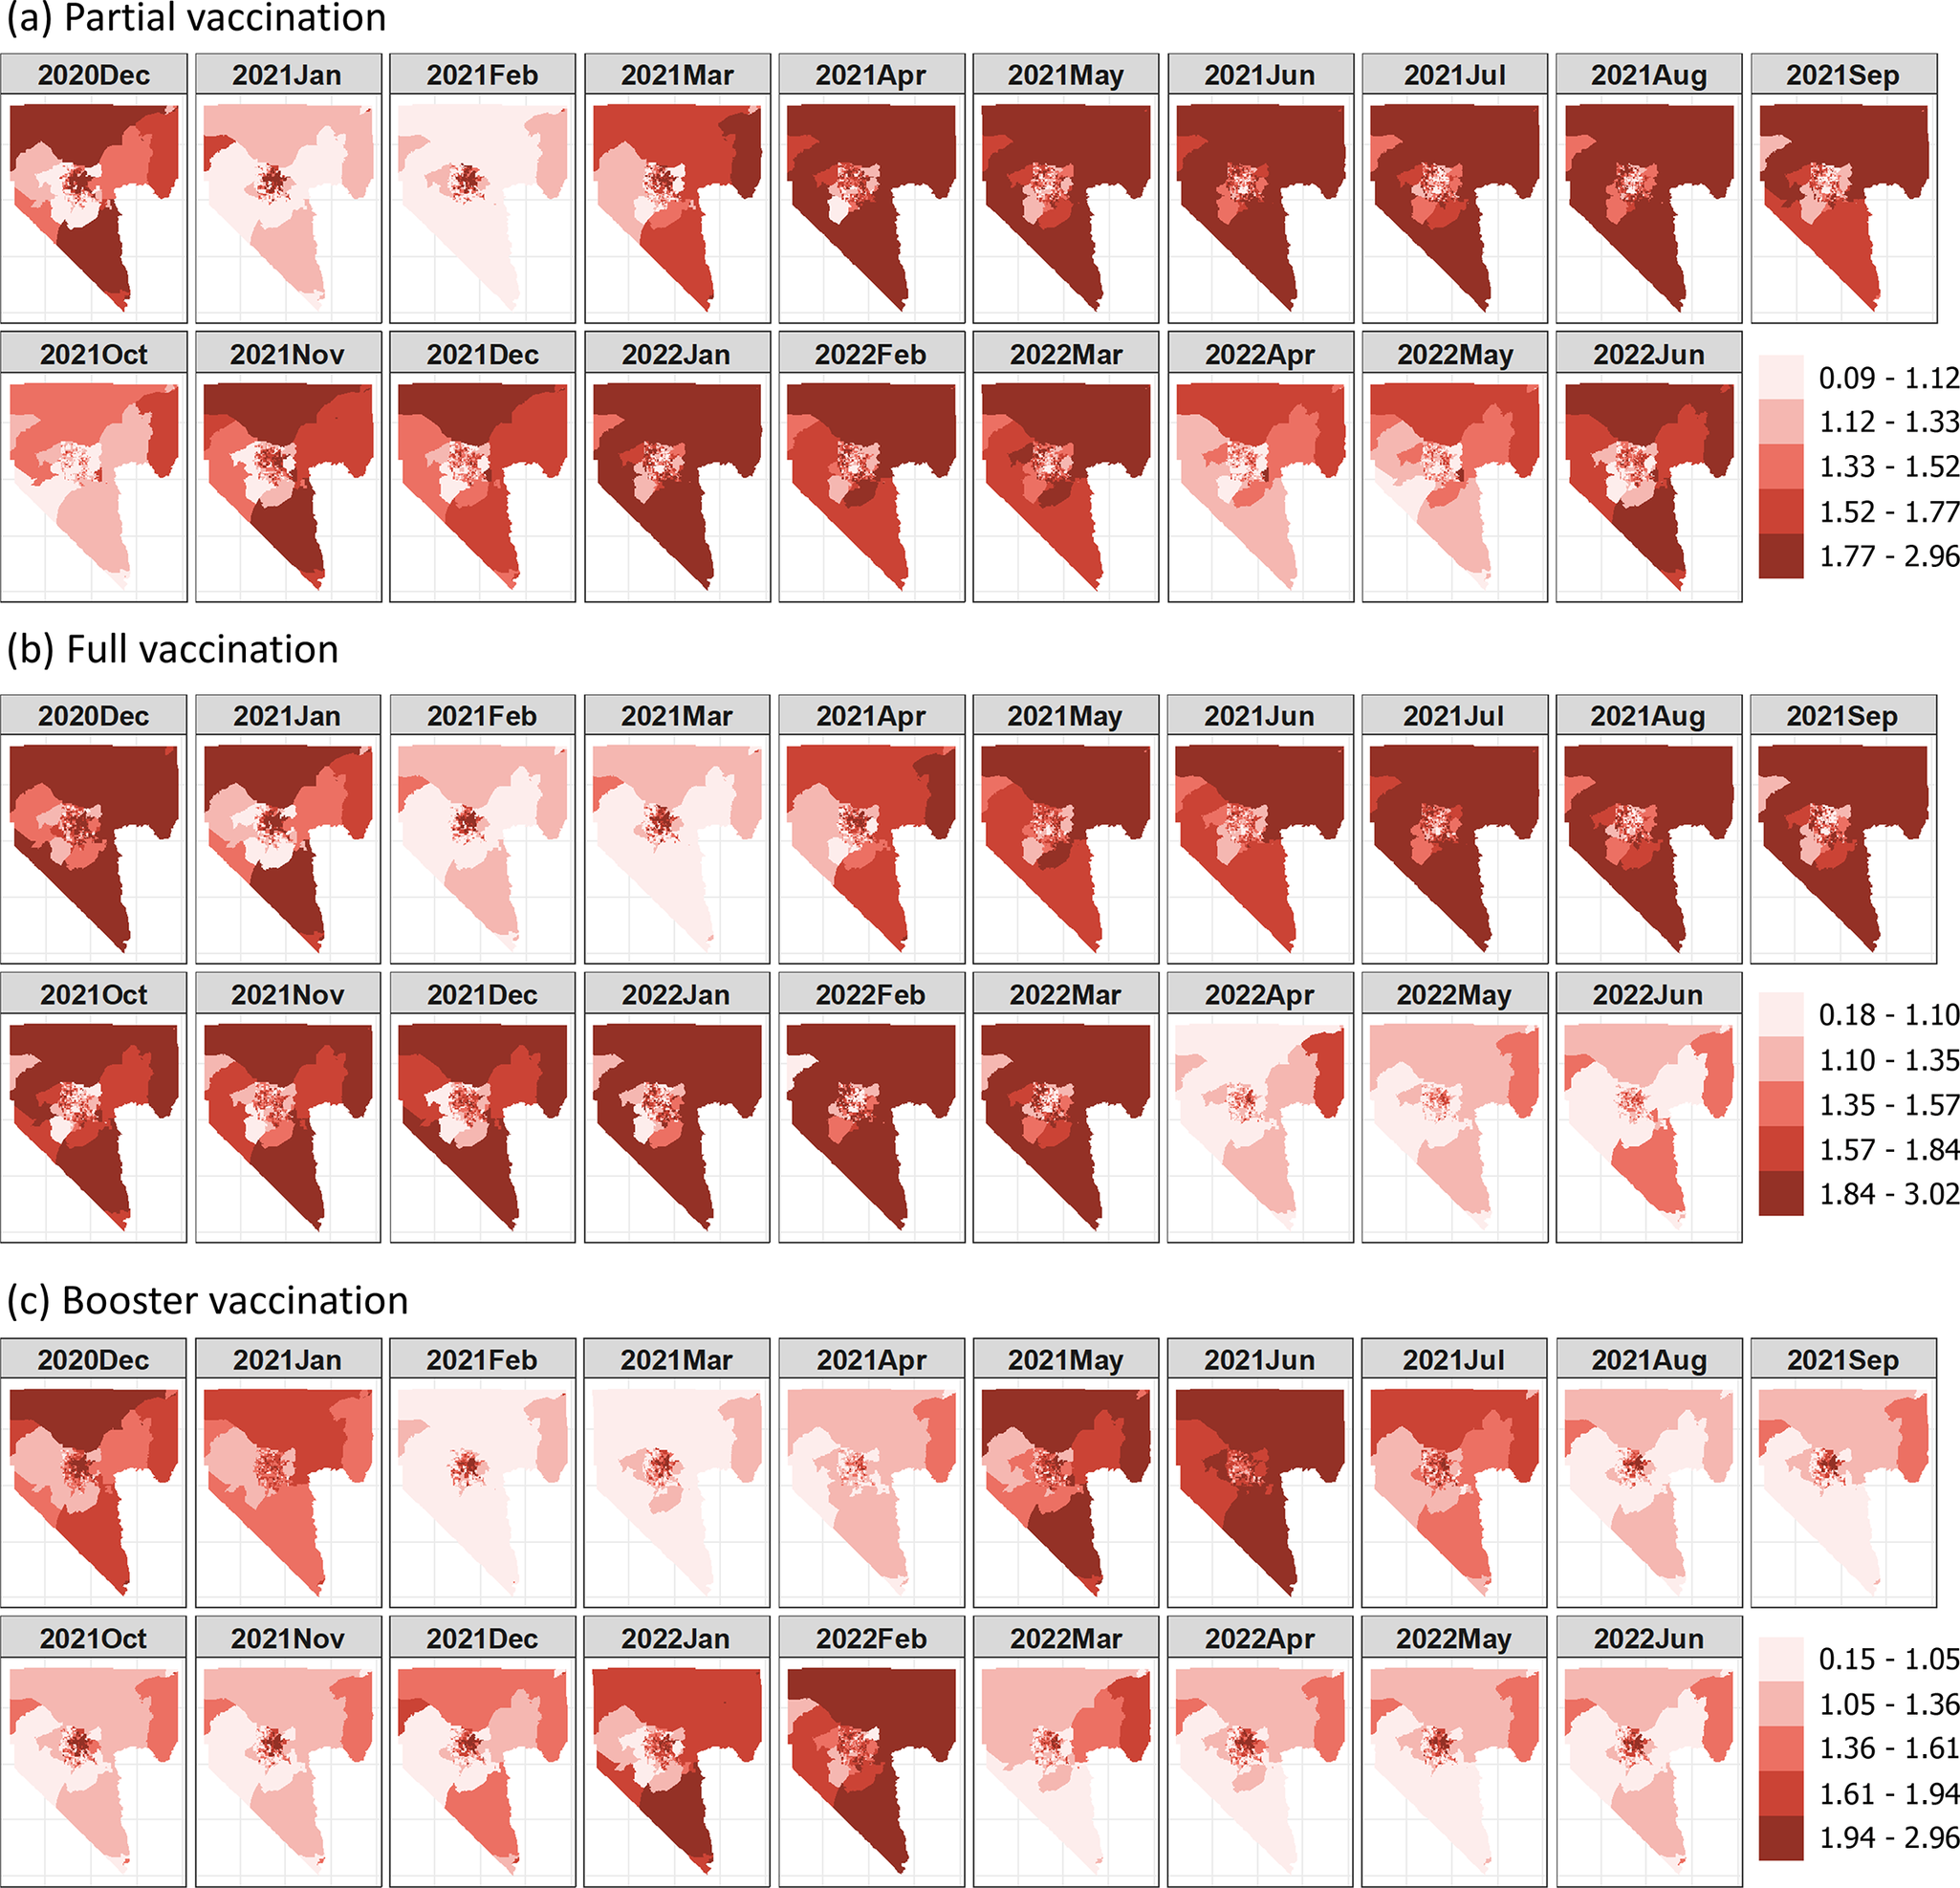
The CVBIP and CVBIF values exhibited similar distributions with means of 1.42 (SD = 0.30) and 1.43 (SD = 0.33), respectively, whereas the CVBIB had a higher mean (1.48) and SD (0.59) in booster vaccination. Figure 2 shows spatial variations of the CVBI values in each month. Regardless of vaccination status, higher CVBI values are more prevalent in northern Clark County, with a distinct cluster of elevated CVBI values observed in the northeastern Las Vegas metropolitan area. In contrast, lower CVBI values were observed in census tracts within the western and northwestern Las Vegas metropolitan areas.
Maps of COVID-19 vaccination barrier indices from December 2020 to June 2022.

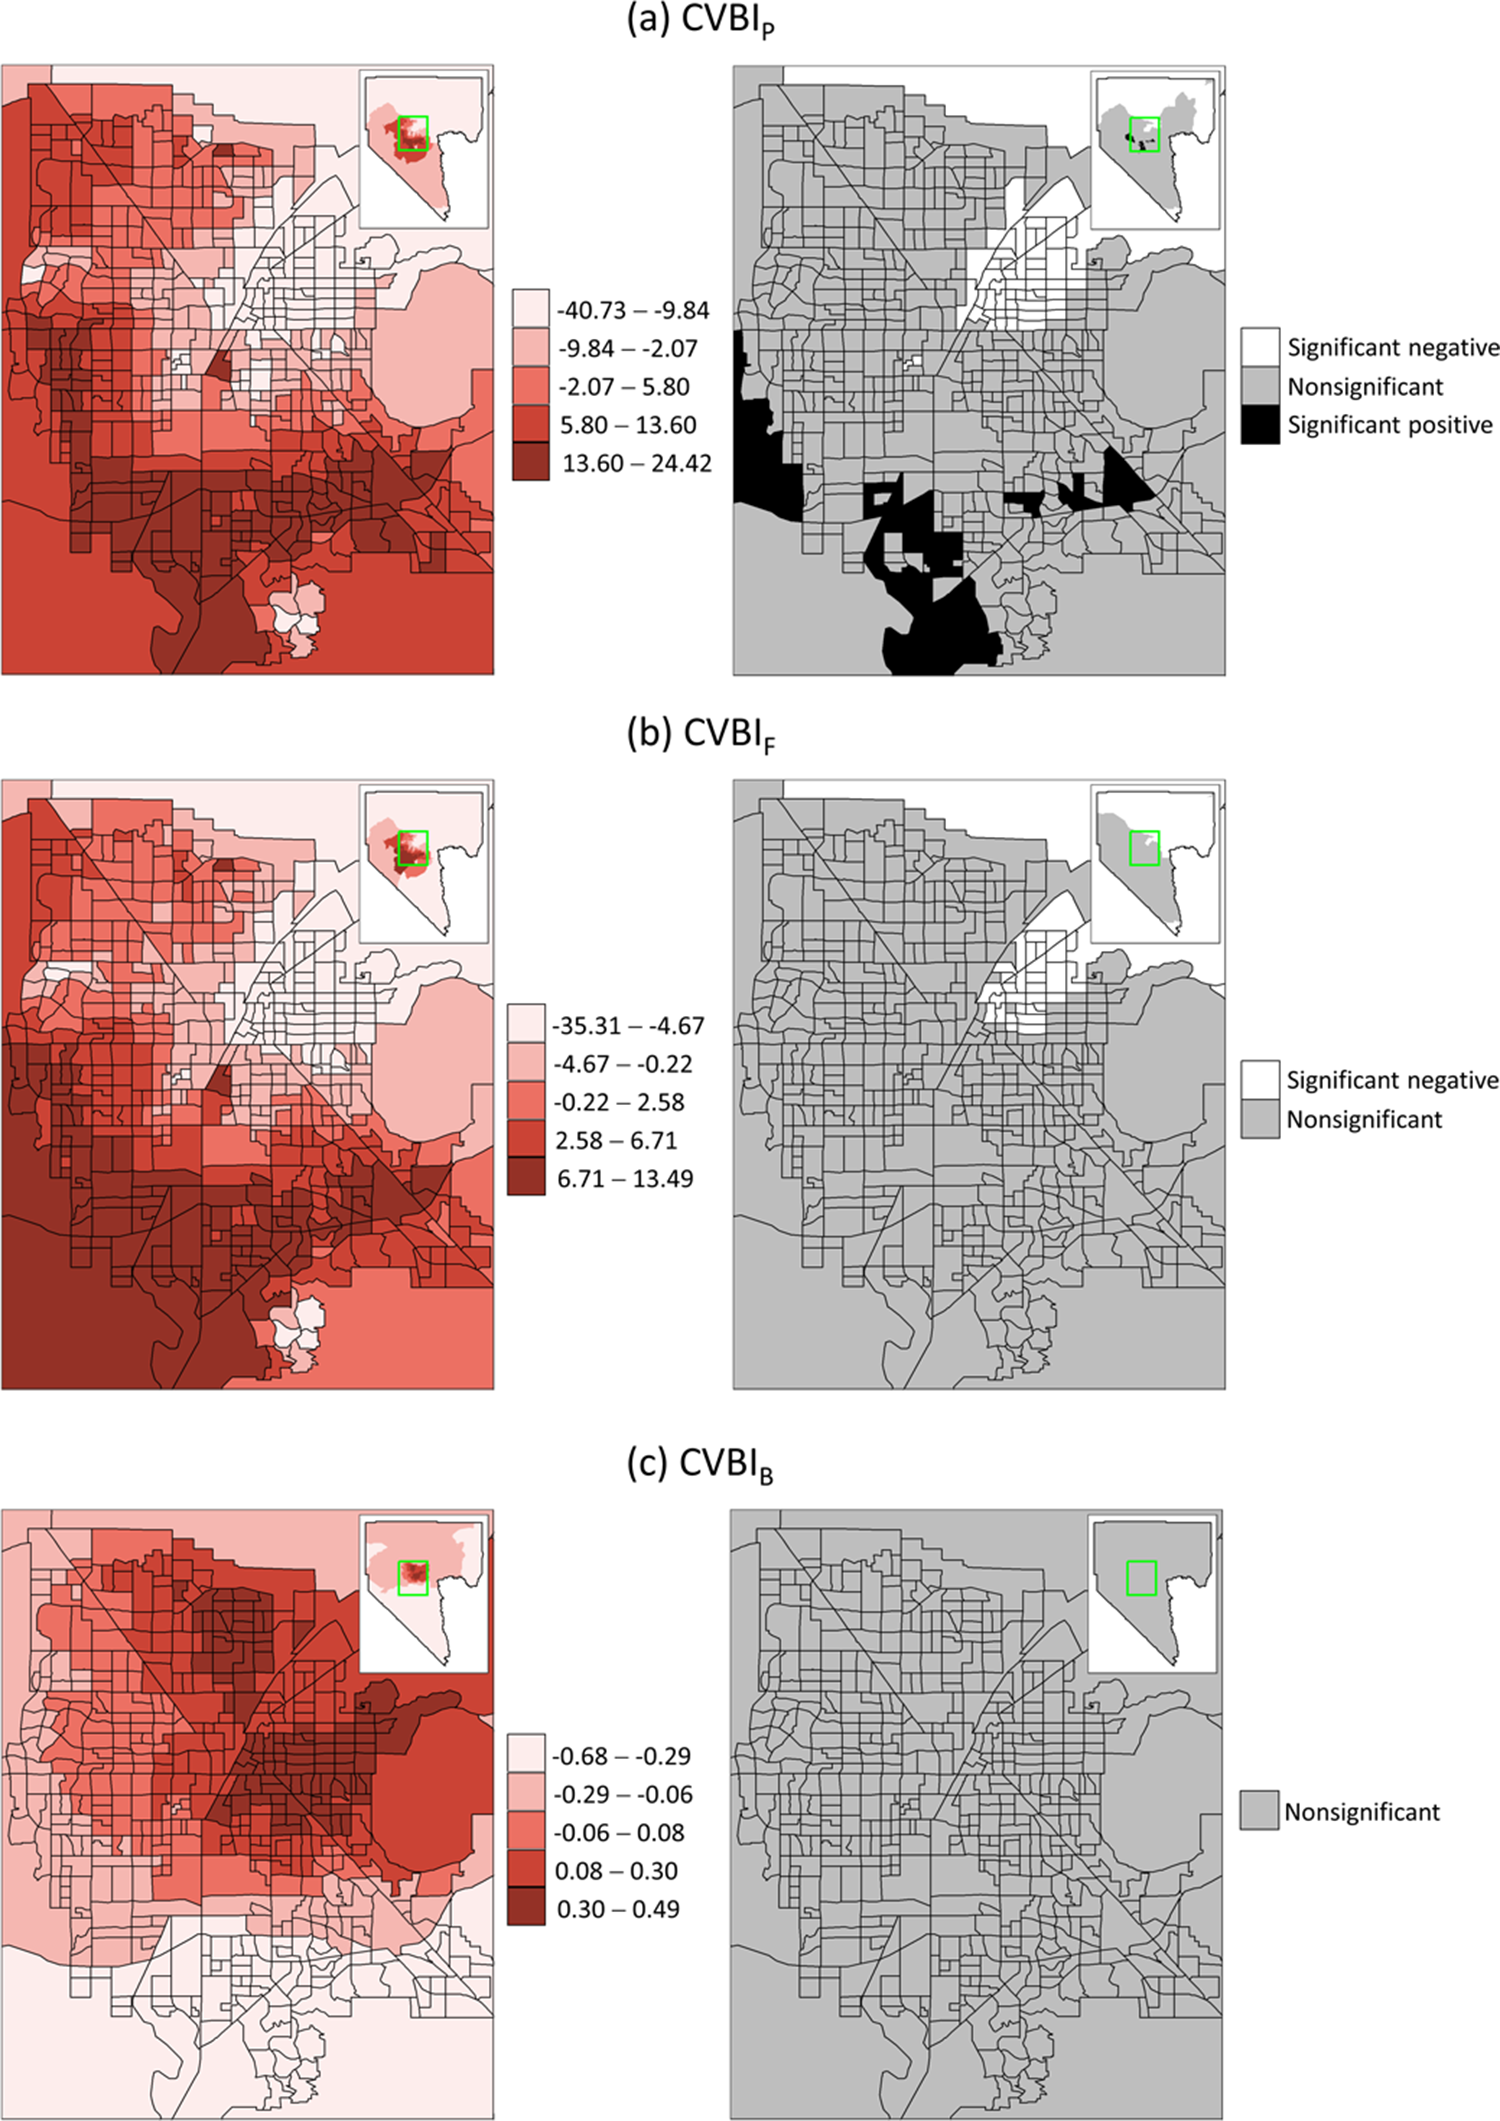
To elucidate the geospatial disparities in the association between COVID-19 vaccination and CVBI, Figure 3 shows the RR% from the estimated spatial function in the BYM model. The association of CVBIP with COVID-19 vaccination varied widely by census tract, with RR% ranging from −40.73% (95% CI = −56.67, −20.55) to 24.42% (95% CI = 5.60, 47.80). The range of RR% was smaller for CVBIF, being −35.31% (95% CI = −51.57, −14.46) to 13.49% (95% CI = −4.67, 36.47) and was the smallest for CVBIB, being −0.68% (95% CI = −8.95, 5.85) to 0.49% (95% CI = −2.00, 4.68).
Relative rate percentages of COVID-19 vaccination with respect to CVBIs (left) and significance (right) at the census tract level.

The impacts of CVBIs on COVID-19 vaccination were consistent in most census tracts on the outskirts of Clark County, where RR% was lower and negative. Within the Las Vegas metropolitan area, the impacts of CVBIP and CVBIF exhibited a similar spatial pattern, with lower RR% more likely appearing in the northeastern census tracts. RR% gradually increased towards the south and southwestern census tracts. Booster vaccination revealed a distinct spatial pattern, with a lower RR% more likely observed in the southern and western Las Vegas metropolitan areas, while two clusters of higher RR% were identified in the eastern and northern Las Vegas metropolitan areas.
Furthermore, CVBIP and CVBIF identified 59 (11.02%) and 41 (7.66%) census tracts, respectively, as vulnerable due to their significantly negative RR%, which indicates a substantial decrease in COVID-19 vaccination with increasing CVBI values. Most vulnerable census tracts were located in the northeastern Las Vegas metropolitan areas. CVBIB identified no vulnerable census tracts (no significant RR% values) by this definition.
Discussion
This study successfully employed two advanced statistical techniques to develop monthly indices integrating vaccination barrier variables and assessing their impacts on the COVID-19 vaccination rate at the census tract level in Clark County, Nevada. The findings highlight diverse variables that have contributed to the CVBI over time and across the three vaccination statuses. Notably, group quarters, housing inadequacy, and population density emerged as the most prevalent vaccination barriers throughout the study period. The spatial disparity of CVBIP appeared greater than that of CVBIF and CVBIB. The CVBIs also displayed distinct clustering patterns by month, with rural areas showing a propensity for higher values compared to urban areas. Within the Las Vegas metropolitan area, elevated CVBI values were observed in northern and northeastern census tracts, where only CVBIP and CVBIF exhibited significant negative associations with the COVID-19 vaccination rates.
The weight maps for CVBIP and CVBIF variables (Supplementary Figure S3) show a distinct transition around March 2021 where the importance of some variables, such as age 17 and under, poverty, uninsured, and no high school degree, diminished as vaccination barriers. This is when the vaccine became available for all individuals aged 18+, and the local health agency put in full force to vaccinate disadvantaged populations. The secondary transition occurred around October and November of 2021, when the importance of housing inadequacy and population density increased substantially, consistent with the start of vaccination efforts for children aged 5–11 and the rollout of COVID-19 booster doses in Clark County. While these CVBI variables are static, their weights clearly depend on policy interventions and other external factors. This study also highlights census tracts with lower COVID-19 vaccination rates, which were largely attributable to higher CVBI values, particularly for partial and full vaccination coverage (Figure 3).
Population density is commonly a confounding variable in COVID-19 research [Reference Mofleh50]. However, this study reveals that population density emerges as one of the prevalent vaccination barriers contributing to the three CVBIs. Vaccine supplies may face more severe shortages in areas with a higher population density, especially during the initial phase of distribution [Reference Liu21]. An analysis of COVID-19 vaccination data at the county level concluded that higher population density was negatively associated with vaccination rates before June 2022; however, this association became insignificant afterward [Reference Huang and Cutter51]. The high CVBI values in rural areas where population density is relatively low could be driven by other variables such as housing inadequacy and driving distance to temporary vaccine sites. This finding underscores the need to strategize vaccine distribution, particularly for urban areas where demand is high.
Driving distance to vaccination sites was another vaccination barrier identified with respect to CVBIP and CVBIF. Similar measures have been utilized to assess COVID-19 vaccination or testing coverage [Reference Mazar18, Reference Guhlincozzi and Lotfata52]. Although a shorter travel distance to vaccination sites can encourage vaccination, this measure itself does not consider the vaccine supplies at each site. Accurate vaccine supply data were not currently available. Nevertheless, the identification of driving distance to vaccination sites as a major vaccination barrier in this study corroborates existing literature. Driving distance to hospitals was identified as a prevalent vaccination barrier only in CVBIP, suggesting that individuals may have initially sought COVID-19 vaccinations at hospitals, particularly during the earlier months of 2021 when vaccines were first available. Driving distance to vaccination locations appears to be a less important factor for people to receive booster vaccinations.
The identification of group quarters and housing inadequacy as prevalent vaccination barriers throughout the study period may reflect vaccination challenges for populations living in unconventional settings. This is alarming due to increased exposure risk, vulnerability, and logistical challenges in controlling outbreaks in these settings. Homeless people, including those living in shelters or temporary housing, have been utilized to demonstrate how housing issues may impede COVID-19 vaccine uptake [Reference Nguyen, Alagbo, Hassan, Mera-Lojano, Abdelaziz, The, Makram, Makram, Elsheikh and Huy53, Reference Richard54]. A reporting bias could also contribute to the lower vaccination rates among these populations, as vaccination data is often tracked by residential address, which might not accurately record vaccinations done in group quarters, particularly in correctional facilities, shelters, and dormitories. Nonetheless, the local health agency should continue prioritizing vaccine distribution in these populations.
This research represents the first-ever study employing a variable dimension reduction modelling approach to establish a time-varying mixture index for COVID-19 vaccination at a small area level. While it offers novel insights into vaccination barriers, limitations of the data should be acknowledged. Vaccination records were collected by the SNHD based on self-reported residential addresses provided at the time of vaccination. Such data may be subject to reporting errors, incomplete information, or inaccuracies in geocoding, which could introduce uncertainty in assigning vaccination counts to specific census tracts. In addition, the 31 variables used to construct the CVBIs were derived from multiple primary and secondary sources. Each dataset carries its own potential uncertainties, such as sampling error, temporal mismatch, or measurement bias, which may affect the precision of variable estimates at the census-tract level. While efforts were made to standardize variables and apply robust statistical methods, the results should be interpreted with caution.
Beyond socioeconomic status and vaccine accessibility, COVID-19 vaccination rates may also be influenced by local COVID-19 incidence and testing rates. Studies have shown that people are more likely to seek vaccination during surges in community transmission [Reference Yoo55, Reference Hancuh56]. Masking policies that signal the urgency of outbreaks may further motivate vaccination uptake. Although the time-varying weights of CVBI variables implicitly reflect some of these effects, it is challenging to provide statistical confirmation within the current LWQS regression framework.
Some potentially important vaccine barrier indicators, such as influenza vaccination rates, prevalence of chronic health conditions, and access to healthcare services, were not readily available at the census tract level for this study. While small area estimation or spatial interpolation methods could be used to disaggregate higher-level data to finer spatial units, these approaches may introduce additional uncertainty and potential biases.
Lastly, a specific limitation of this modelling approach is that the weights of CVBI variables obtained through LWQS regression cannot be readily interpreted as associations between original variables and the COVID-19 vaccination rate. LWQS regression yields only positive weights, which does not imply that each original variable must be positively associated with the index. Building a model incorporating all original variables could be an alternative approach, though including 31 original variables interacting with the spatial function would incur significant computational burdens due to the multitude of unknown parameters that require estimation.
Conclusion
In summary, this research developed composite indices from 31 variables, which were then analysed alongside COVID-19 vaccination data to identify vulnerable areas susceptible to higher levels of vaccination barriers. We emphasize the potential for generating the index over time to align more closely with the dynamic nature of the COVID-19 pandemic at the census tract level. This study helps pinpoint key vaccination barriers as well as communities and periods where these barriers played important roles. This guides local health agencies to mobilize resources in preparation for the next outbreaks. Furthermore, this analytic framework may be applied to investigating vaccination barriers for other infectious diseases.
Supplementary material
The supplementary material for this article can be found at http://doi.org/10.1017/S0950268826100995.
Data availability statement
Data are available from the corresponding author upon reasonable request.
Acknowledgements
The authors appreciated comments and suggestions from Southern Nevada Health District staff, including Benjamin Ashraf, Matthew Kappel, and Rebecca Topol and from two anonymous reviewers while preparing the manuscript.
Author contribution
Conceptualization: Lung-Chang Chien, L.-W. Antony Chen; Data curation: Lei Zhang, Cheryl Collins, Edom Gelaw, Chad Cross; Methodology: Lung-Chang Chien, L.-W. Antony Chen; Formal analysis, Investigation, and Visualization: Lung-Chang Chien, Cheryl Collins, Edom Gelaw; Writing – original draft preparation: Lung-Chang Chien, L.-W. Antony Chen; Writing – review and editing: Chad Cross, Lei Zhang, Anil Mangla, Cassius Lockett; Supervision: L.-W. Antony Chen, Lei Zhang, Anil Mangla; Funding acquisition: Lei Zhang, L.-W. Antony Chen, Cassius Lockett. All authors read and approved the final manuscript.
Funding statement
The project was supported by Grant # NH75OT000057–01-00 from the Centers for Disease Control and Prevention. Its contents are solely the responsibility of the authors and do not necessarily represent the official views of the Centers for Disease Control and Prevention.
Competing interest
The authors declare none.


 Open access