


1. Introduction
With almost 80% of Americans having a lawn of some type (Guell Reference Guell2019), green spaces have become an integral part of the US urban ecosystem (Fuentes Reference Fuentes2021). Lawns are valued for several reasons, including their: (i) esthetic contribution to residential properties, (ii) use for recreational activities, and (iii) perceived environmental benefits (Ahn et al. Reference Ahn, Luo, Mendoza and Norwood2024; Cui et al. Reference Cui, Yue, Zhao and Watkins2022; Wang and Yue Reference Wang and Yue2021). Consequently, Americans dedicate considerable resources (time and financial) to maintain and enhance their lawns. A recent survey reported that Americans spend an average of $370 annually on landscaping services (Cui et al. Reference Cui, Yue, Zhao and Watkins2022). Consequently, the US landscaping industry has evolved into a multibillion-dollar sector of the economy, generating $153 billion in revenue in 2023 and projected to reach $184 billion by 2025 (Bohne Reference Bohne2024; IBIS-World 2023).
Traditional landscape pest management approaches largely depend on rotating conventional pesticide chemistries. However, as consumer awareness of alternative control methods grows, landscape service providers (LSPs) must adapt to evolving market expectations (Jeffers et al. Reference Jeffers, Behe, Vassalos, Bridges and White2023). Furthermore, reliance on traditional chemical pesticide rotations can lead to potential issues with pesticide resistance (Deguine et al. Reference Deguine, Aubertot, Flor, Lescourret, Wyckhuys and Ratnadass2021; Jeffers and Chong Reference Jeffers and Chong2021; Muniz-Junior et al. Reference Muniz-Junior, Roque, Pires and Guariento2023; Van der Sluijs et al. Reference Van der Sluijs, Simon-Delso, Goulson, Maxim, Bonmatin and Belzunces2013; Whitehorn et al. Reference Whitehorn, O’Connor, Wackers and Goulson2012). A possible solution to these challenges is the use of integrated pest management (IPM).
IPM is a scientifically based, multifaceted approach to maintaining pest populations at levels that are not damaging, while simultaneously reducing the potential for pesticide resistance and successfully keeping pest populations at acceptable levels in the long term (Deguine et al. Reference Deguine, Aubertot, Flor, Lescourret, Wyckhuys and Ratnadass2021). Part of the success of IPM is its ability to combat pesticide resistance by combining non-chemical control methods with pesticide chemistries. Non-chemical control methods include mechanical and physical controls (physical removal, traps, etc.), cultural controls (sanitation, irrigation management, fertility management, proper plant placement, etc.), and biological controls (releasing/attracting beneficial organisms to manage pests) (Burkman and Gardiner Reference Burkman and Gardiner2014; Doehler et al. Reference Doehler, Chauvin, Le Ralec, Vanespen and Outreman2023; Jeffers and Chong Reference Jeffers and Chong2021; Wilson and Frank Reference Wilson and Frank2023). Biological control release programs have become more prevalent in production horticulture over the last 20 years (Messelink and Janssen, Reference Messelink and Janssen2014; Pandit et al. Reference Pandit, Kumar, Gulati, Bhandari, Mehta, Katyal, Rawat, Mishra and Kaur2022; Smagghe et al. Reference Smagghe, Spooner-Hart, Chen and Donovan-Mak2023), primarily due to concerns about environmental risks from pesticides to pollinators (e.g., neonicotinoid chemistries). One challenge with biological control programs is their reliance on robust and accurate scouting programs (Jeffers and Chong Reference Jeffers and Chong2021).
Due to the interconnected relationships between biological control agents and the pests they target, scouting/monitoring plans, as well as proper pest identification, play a crucial role in the success of biological control agents and the overall IPM program. However, much literature focuses on scouting practices in ornamental production systems (Campbell et al. Reference Campbell, Khachatryan and Rihn2017; Deguine et al. Reference Deguine, Aubertot, Flor, Lescourret, Wyckhuys and Ratnadass2021; Frank et al. Reference Frank, Klingeman, White and Fulcher2013; Getter et al. Reference Getter, Behe and Wollaeger2016; Harris et al. Reference Harris, Renfrew and Woolridge2001; Hopkins et al. Reference Hopkins, Hall, Arnold, Palma, Knuth and Pemberton2022; Jeffers et al. Reference Jeffers, Behe, Vassalos, Bridges and White2023; Khachatryan et al. Reference Khachatryan, Rihn, Behe, Hall, Campbell, Dennis and Yue2018; Klingeman et al. Reference Klingeman, Braman and Buntin2000; Wei et al. Reference Wei, Hayk and Alicia2019; Wollaeger et al. Reference Wollaeger, Getter and Behe2015; Xuan et al. Reference Xuan, Hayk and Alicia2020), but, to the best of our knowledge, limited work has been completed on scouting programs in the landscape management field, including how LSPs could use scouting programs to drive pest management programs and upsell services that might be considered premium, such as biological control releases.Footnote 1
To fill this gap, this study aims to examine (1) consumer’s willingness to pay (WTP) for a scouting service offered by a LSP, and (2) what services or attributes related to a scouting program would be beneficial for the LSP to adopt. The second research objective in this study focus on identifying consumer demographic and behavioral factors associated with the likelihood of adopting scouting and IPM services. Results from this study could reveal potential new revenue opportunities for LSPs and enable them to reach new, niche customer markets
2. Data collection
2.1. Survey development
The data for this study were collected through an online survey distributed via Qualtrics Panel Services (Qualtrics LLC, Provo, UT, USA). The survey was conducted in compliance with the university’s Institutional Review Board-approved protocol (IRB2022-0415). The survey sample was restricted to individuals eighteen years or older, who currently employ a LSP or who indicated they were considering hiring one. In addition to the choice-based conjoint section of the survey, the second section of the questionnaire collected demographic data, including the number of adults and children in the household, age (at the time of the survey), gender, race, education level, state of residence, region, and self-reported income level.
To ensure data quality, several exclusion criteria were applied. Automated Qualtrics protections removed duplicate IP addresses and automated (bot) responses. Two attention-check questions were embedded in the survey; responses failing either were excluded. Responses completed in less than one-third of the median completion time were flagged as speeders and removed. Respondents who were not eighteen years of age at the time of the survey, or who indicated they did not currently have, or were seeking a LSP, were excluded. Responses that failed any of these quality checks were not included in the final data set.
To measure WTP for scouting programs, a choice-based conjoint analysis was employed. Choice-based conjoint analysis, sometimes referred to as trade-off analysis, involves presenting survey respondents with a choice set of products that vary in attribute levels, forcing them to choose between products and “trade off” certain attributes for others. The resulting analyses yield part-worth values for each attribute, indicating the relative importance of a given attribute in the respondent’s decision to purchase (Behe et al. Reference Behe, Barton, Hall, Safley and Turner1999; Hopkins et al. Reference Hopkins, Hall, Arnold, Palma, Knuth and Pemberton2022) The part-worth values can then be used to calculate consumer potential WTP, help construct the ideal product, and make predictions on what consumers might be willing to pay for a product with a given set of attributes based on their part-worth values (Behe et al. Reference Behe, Barton, Hall, Safley and Turner1999; Boyle et al. Reference Boyle, Holmes, Teisl and Roe2001; Hopkins et al. Reference Hopkins, Hall, Arnold, Palma, Knuth and Pemberton2022; Hugie et al. Reference Hugie, Yue and Watkins2012; Palma et al. Reference Palma, Wirth, Adams and Degner2010). Each of the eight choice sets presented to respondents included an explicit opt-out alternative, allowing respondents to reject all alternatives when none were acceptable. Data were analyzed in Stata (StataCorp. 2023. Stata Statistical Software: Release 18. College Station, TX: StataCorp LLC.).
2.2. Attribute identification
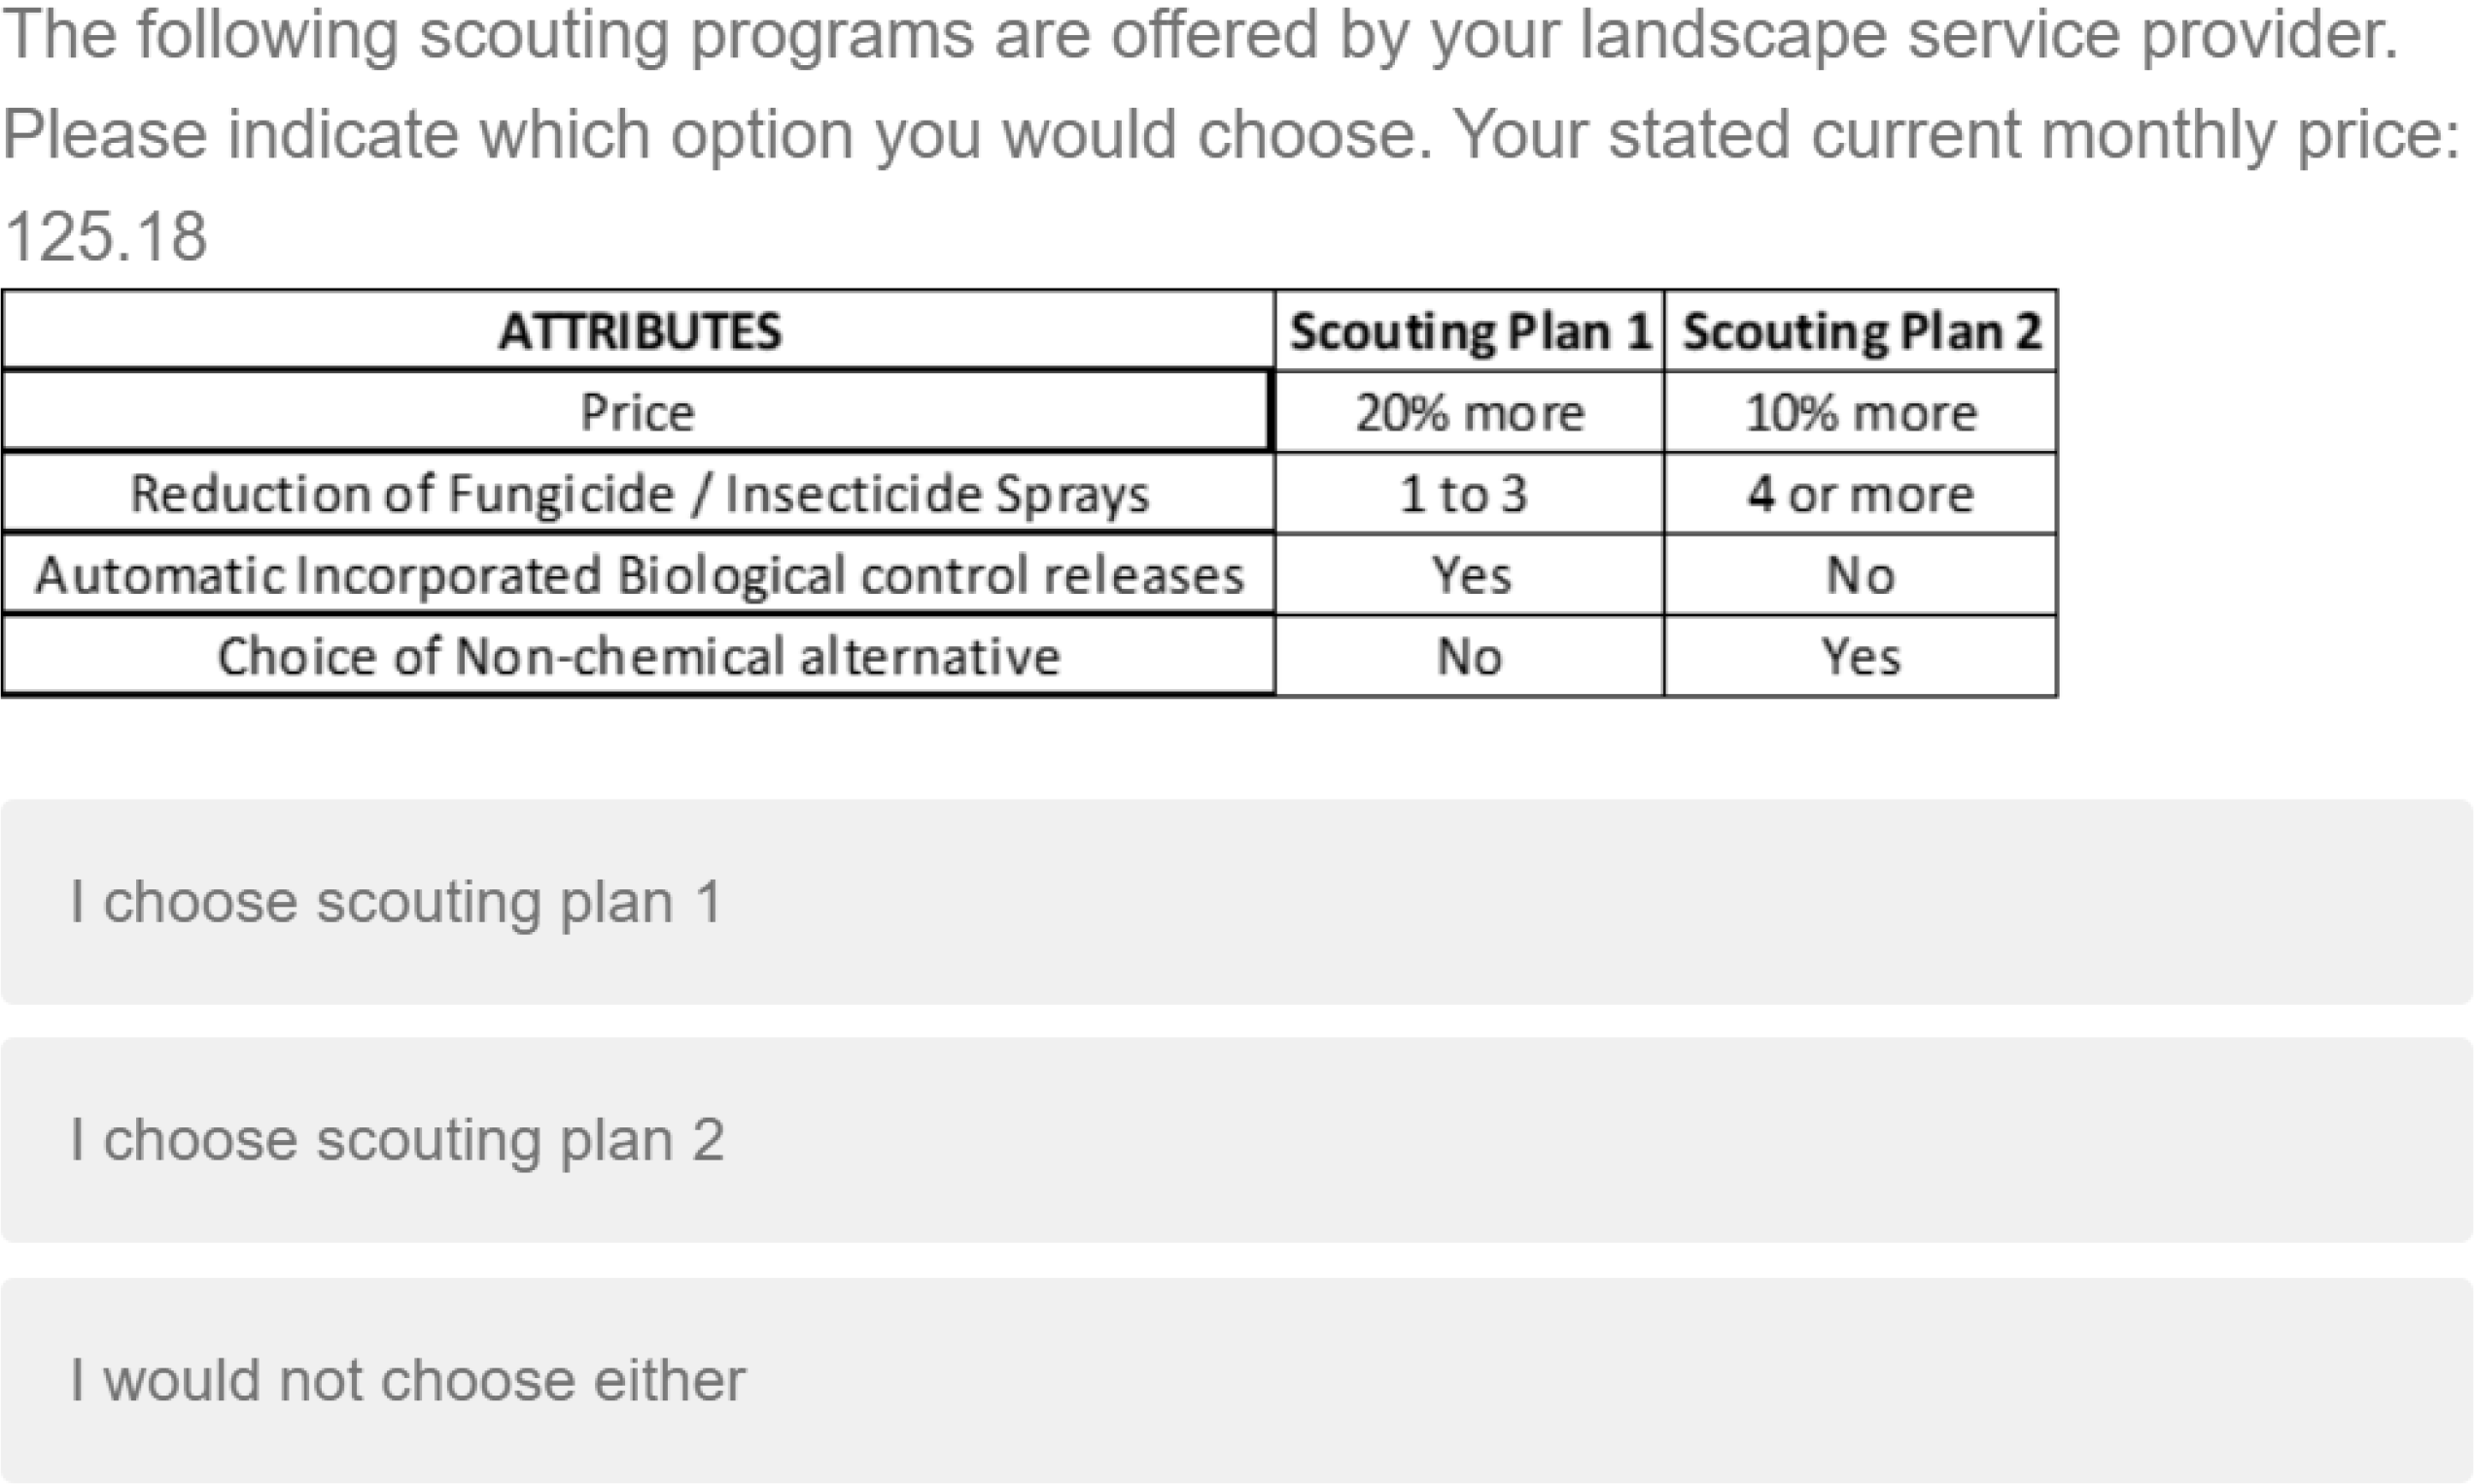
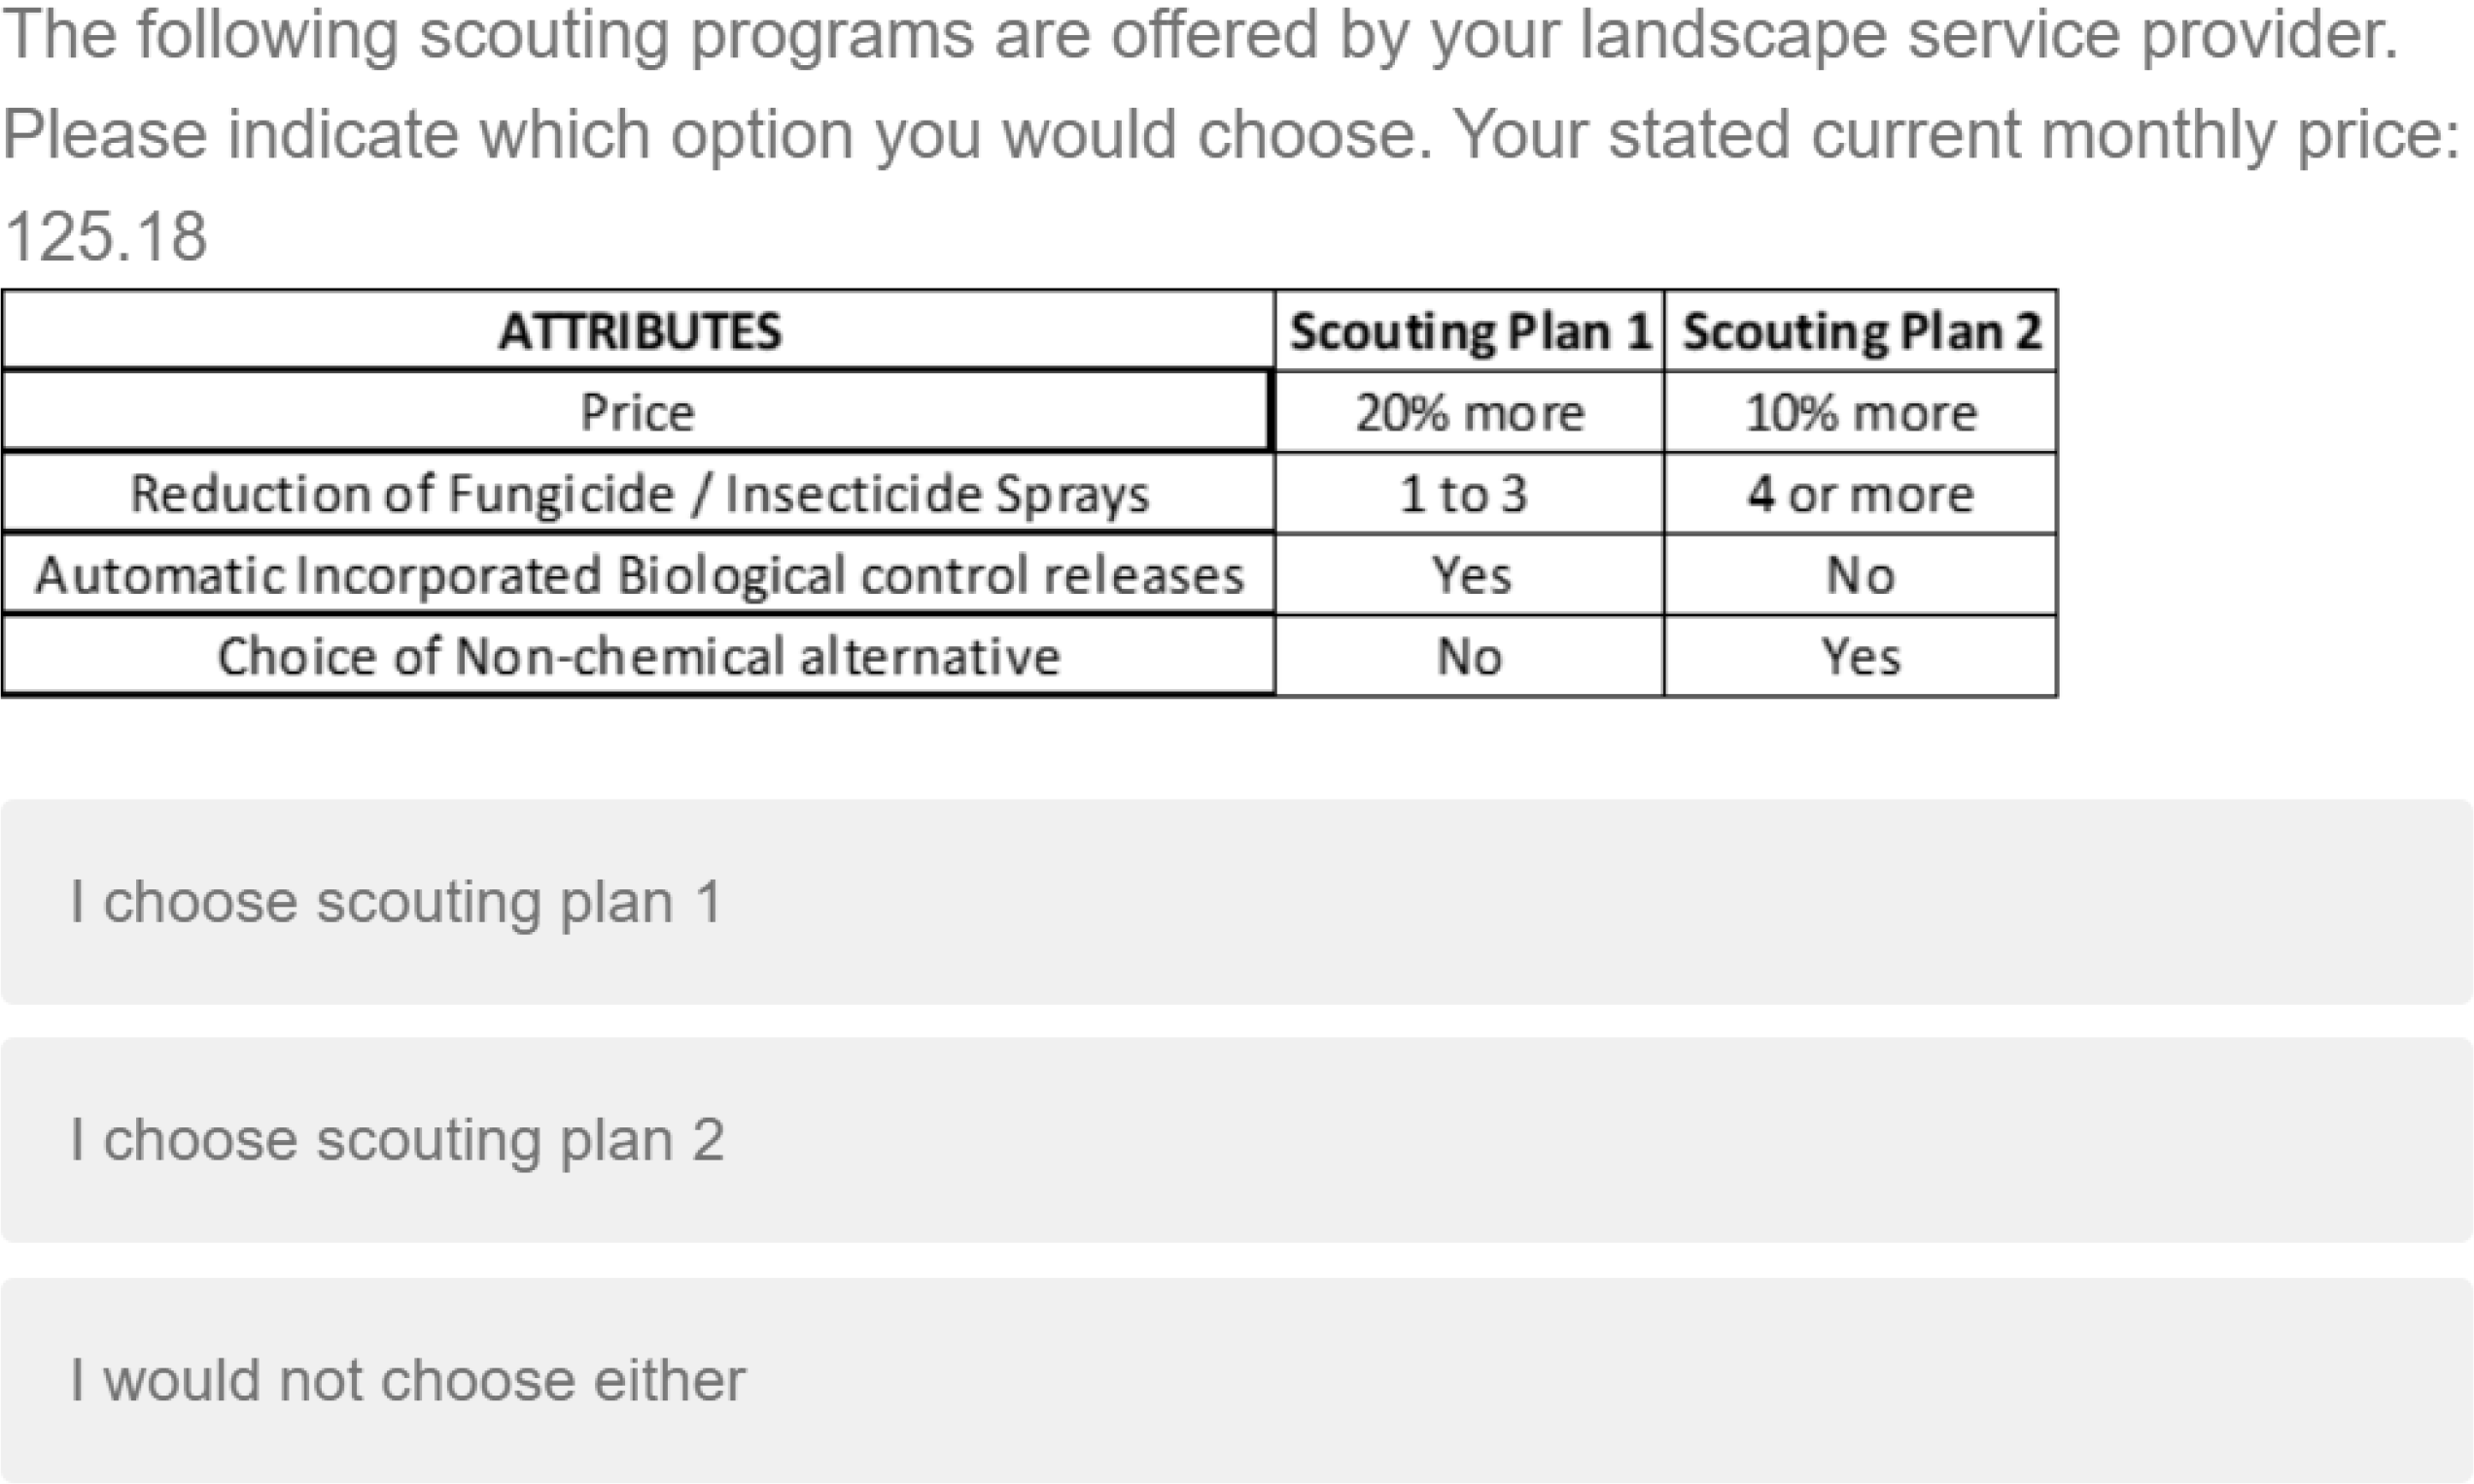
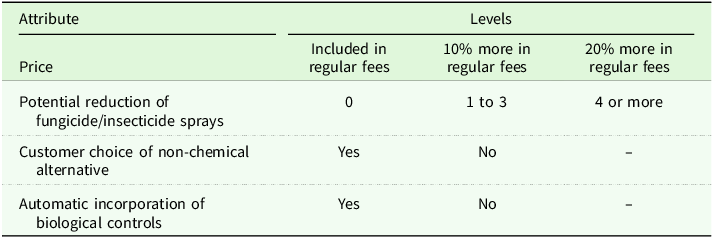
Four attributes were examined: price, the potential for reduction of pesticide applications, automatic incorporation of biological control releases, and consumer choice of alternative/non-chemical control measures (Table 1). Price had three levels: included in the price of regular program fees, 10% more in cost of regular fees, and 20% more in cost of regular fees. Participants were asked to report their current monthly payment for landscaping services. This amount was then carried forward by Qualtrics and displayed during the choice experiment section of the survey (Figure 1). For the econometric analysis, the mean of the reported monthly fees was calculated and used to define the “regular fee” baseline; price levels corresponding to 10% and 20% increases were computed relative to this mean and entered into the statistical models as dollar-valued price levels, allowing WTP estimates to be expressed directly in monetary terms (Jiang et al. Reference Jiang, Zipp and Jacobson2018).
Example of the discrete choice experiment showing respondents attributes associated with a set of two landscaper scouting plans. The respondent’s reported monthly cost that they currently pay was forwarded and displayed with the product choices.
Scouting product attribute levels used to measure willingness to pay for a landscape service provider scouting program
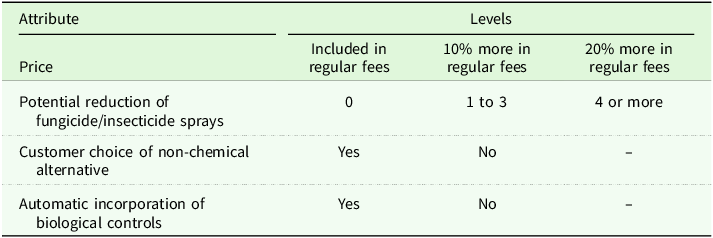
The other attributes attempted to incorporate elements of IPM programs, specifically reducing pesticide spray potential, incorporating biological controls, and offering the option to include non-chemical treatment methods. Pesticide spray reduction potential had three levels: no reduction in sprays, one to three potential reductions in spray applications, and four or more potential reductions in spray applications. The incorporation of biological controls and the choice of non-chemical control alternatives both had two levels of yes or no (Table 1).
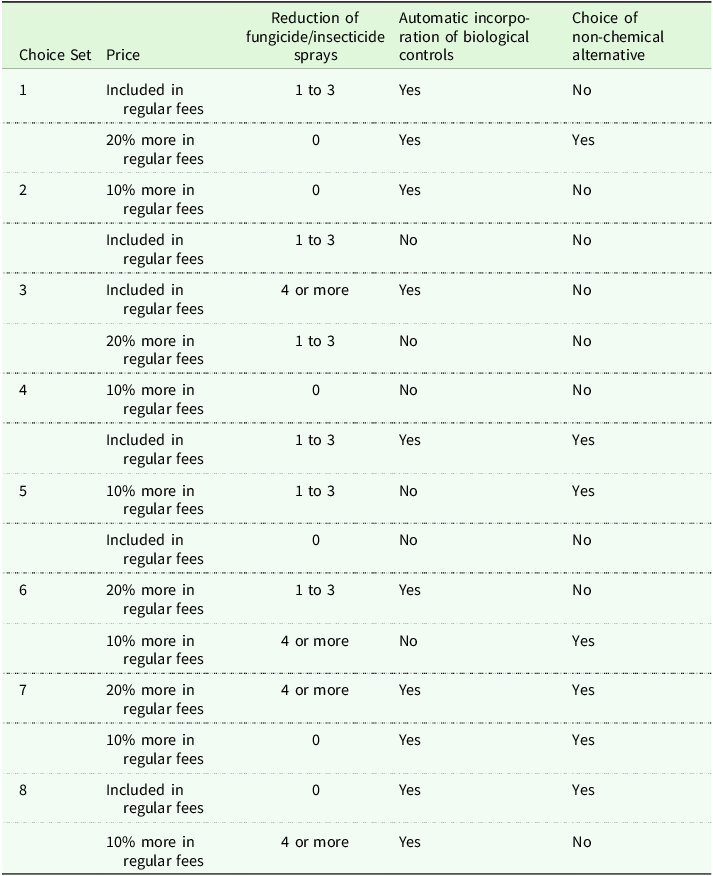
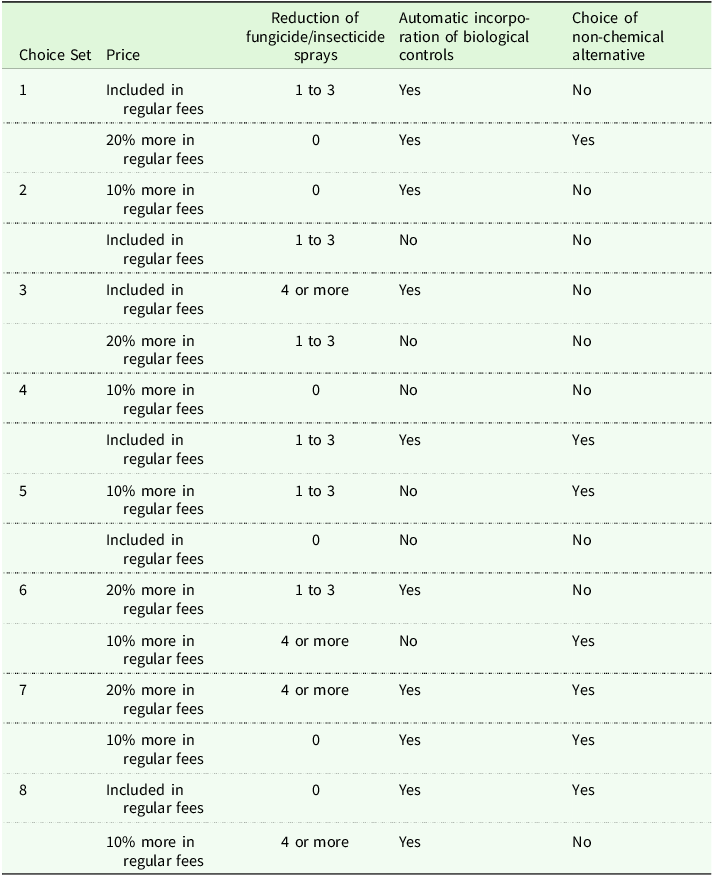
The experiment was designed as a 3 × 3 × 2 × 2 factorial, with 36 possible product combinations. To prevent potential survey fatigue, attributes and levels were entered into JMP (JMP® Pro 18.0.2, SAS Institute Inc., Cary, NC) design of choice experiments tool to produce eight product choice sets for presentation to survey respondents (Table 2) (Behe et al. Reference Behe, Barton, Hall, Safley and Turner1999; Boyle et al. Reference Boyle, Holmes, Teisl and Roe2001; Hopkins et al. Reference Hopkins, Hall, Arnold, Palma, Knuth and Pemberton2022). The experiment was designed as a fractional factorial discrete choice experiment. Each respondent was presented with eight choice sets with varying product profiles; an opt-out option was included within each choice set (Table 2, Figure 1). The order of choice sets and alternatives within sets was randomized for each respondent to minimize order effects. To ensure response quality and minimize potential bias in model estimation, observations in which respondents selected the non-dominant alternative (specifically, the second option in choice set 3 and the first option in choice set 4 were excluded before estimating the conditional and mixed logit models (Bliemer et al. Reference Bliemer, Rose and Chorus2017). Data were analyzed in Stata.
Conjoint analysis choice sets used to measure willingness to pay for a landscape service provider scouting program
2.3. Statistical methods and models
To answer the first research question, which was to estimate consumer WTP for a scouting service offered by a LSP, we relied on choice-based conjoint analysis models grounded in McFadden’s random utility theory (Hu et al. Reference Hu, Woods and Bastin2009; McFadden Reference McFadden1973). Generally, random utility theory states that every alternative from which a consumer chooses has value or “utility” (Hu et al. Reference Hu, Woods and Bastin2009; McFadden Reference McFadden1973). This utility has two main parts: the deterministic term (can be observed) and the random term (cannot be observed). The random utility model is expressed as: ${U_{ijt}} = {X_{ijt}}B + {e_{jt}}$
Where individual i faces a choice of alternative j (scouting plan profile) in the t-th choice set, with attribute levels represented by X ij. The β is the unknown parameter to be estimated, and e jt is the error term.
In discrete choice experiments, WTP represents the monetary value that respondents assign to specific attributes of a good or service and is typically derived from the estimated coefficients of a choice model, such as the multinomial logit or mixed logit model. The WTP for a given non-monetary attribute is calculated as the negative ratio of that attribute’s coefficient to the price coefficient: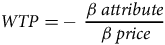 $WTP = - \;{{\beta \;attribute} \over {\;\beta \;price}}$
Equation (2) quantifies the amount respondents are willing to pay for a one-unit change in the attribute, holding all other factors constant. A positive WTP indicates that the attribute increases utility and is valued by respondents, while a negative WTP suggests the attribute is undesirable (Behe et al. Reference Behe, Campbell, Hall, Kachatryan, Dennis and Yue2013; Campbell et al. Reference Campbell, Kachatryan, Behe, Dennis and Hall2015; Mason et al. Reference Mason, Starman, Lineberger and Behe2008; McFadden Reference McFadden1973)
Two of the most common models used to analyze choice-based experiments are conditional logit and mixed logit regression (mixed logit) models (Behe et al. Reference Behe, Barton, Hall, Safley and Turner1999; Boyle et al. Reference Boyle, Holmes, Teisl and Roe2001; Hopkins et al. Reference Hopkins, Hall, Arnold, Palma, Knuth and Pemberton2022; Hu et al. Reference Hu, Woods and Bastin2009; McFadden Reference McFadden1973). Conditional logit models apply McFadden’s theory and assume all individuals have equal preferences and are more restricted by the independence of irrelevant alternatives (IIA) assumption (Train Reference Train2003).
Mixed logit models enable the expansion of McFadden’s framework by allowing the coefficients or preferences to vary across individuals, capturing the unobserved heterogeneity of individuals and relaxing the IIA assumption (Behe et al. Reference Behe, Barton, Hall, Safley and Turner1999; Boyle et al. Reference Boyle, Holmes, Teisl and Roe2001; Hopkins et al. Reference Hopkins, Hall, Arnold, Palma, Knuth and Pemberton2022; Hu et al. Reference Hu, Woods and Bastin2009; McFadden Reference McFadden1973). Estimating conditional and mixed logit models helps conceptualize random utility theory by offering different levels of complexity based on how individual preferences are treated (Behe et al. Reference Behe, Barton, Hall, Safley and Turner1999; Boyle et al. Reference Boyle, Holmes, Teisl and Roe2001; Hopkins et al. Reference Hopkins, Hall, Arnold, Palma, Knuth and Pemberton2022; Hu et al. Reference Hu, Woods and Bastin2009; McFadden Reference McFadden1973). In the mixed logit model, the coefficients for spray reduction attributes, incorporation of biological control, and inclusion of non-chemical controls were specified as normally distributed random parameters, while the price coefficient was fixed. Random parameters were assumed to be independent. The estimated means and standard deviations of these random coefficients are reported in Table 4.
Conditional logit models assume homogeneous preferences and IIA. Mixed logit models relax these assumptions, allowing coefficients to vary randomly across respondents and capturing unobserved preference heterogeneity. Both models were estimated to provide complementary insights: conditional logit serves as a benchmark, whereas mixed logit offers greater flexibility. Consistent signs and magnitudes of coefficients across models enhance confidence in the robustness of findings, while improvements in log-likelihood and Akaike information criterion (AIC) for the mixed logit model confirm the presence of preference heterogeneity. Consequently, mixed logit estimates were used as the basis for WTP calculations (King et al. Reference King, Palma, Behe, Fernandez, Sage, Hall and Arnold2015; McFadden Reference McFadden1973; Roe et al. Reference Roe, Boyle and Teisl1996).
In addition to the choice experiment, respondents were asked a supplementary question regarding their likelihood of purchasing an IPM program from a landscaper. This item was designed to provide additional context on attitudes toward IPM and was not a primary focus of the study. Responses were collected using a four-point, forced-choice scale (very unlikely, somewhat unlikely, somewhat likely, very likely) to avoid a neutral midpoint and encourage directional responses (Wetzel et al. Reference Wetzel, Frick and Brown2020). Resulting in a multinomial logistic regression model with the response levels being the dependent variable and the same respondent demographics as the previous model being the independent variables. To answer the second research question, which is what services/attributes related to a scouting program would be lucrative for LSP to adopt, respondents were asked if they would purchase a biological control application and if they would purchase an IPM program offered by a LSP. The biological control response was binary (yes or no), and responses were analyzed using a binomial logistic regression model to estimate purchase likelihood. The dependent variable was the purchase of a biological control treatment (yes/no), with respondent demographics (household income, years of education, number of hours spent gardening, household size, and area of residence) as the independent variables.
3. Results
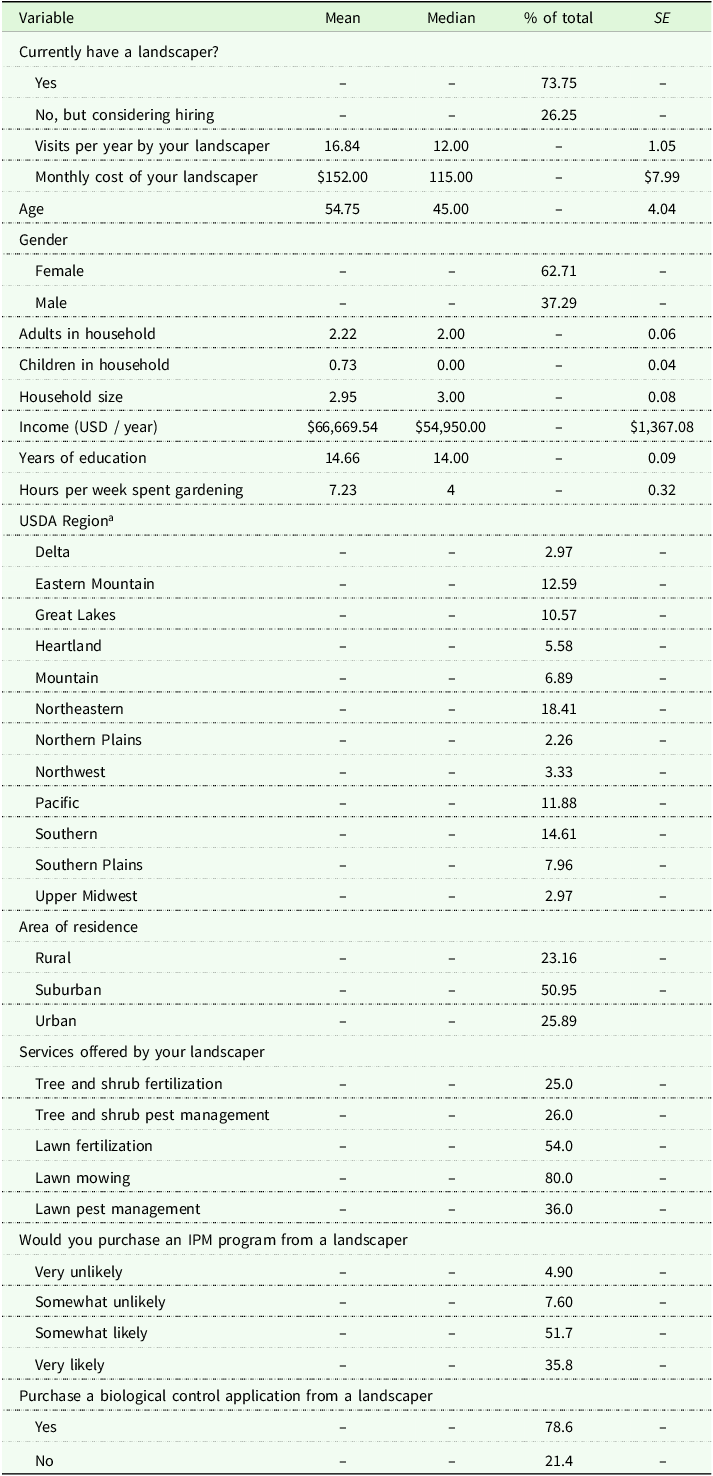
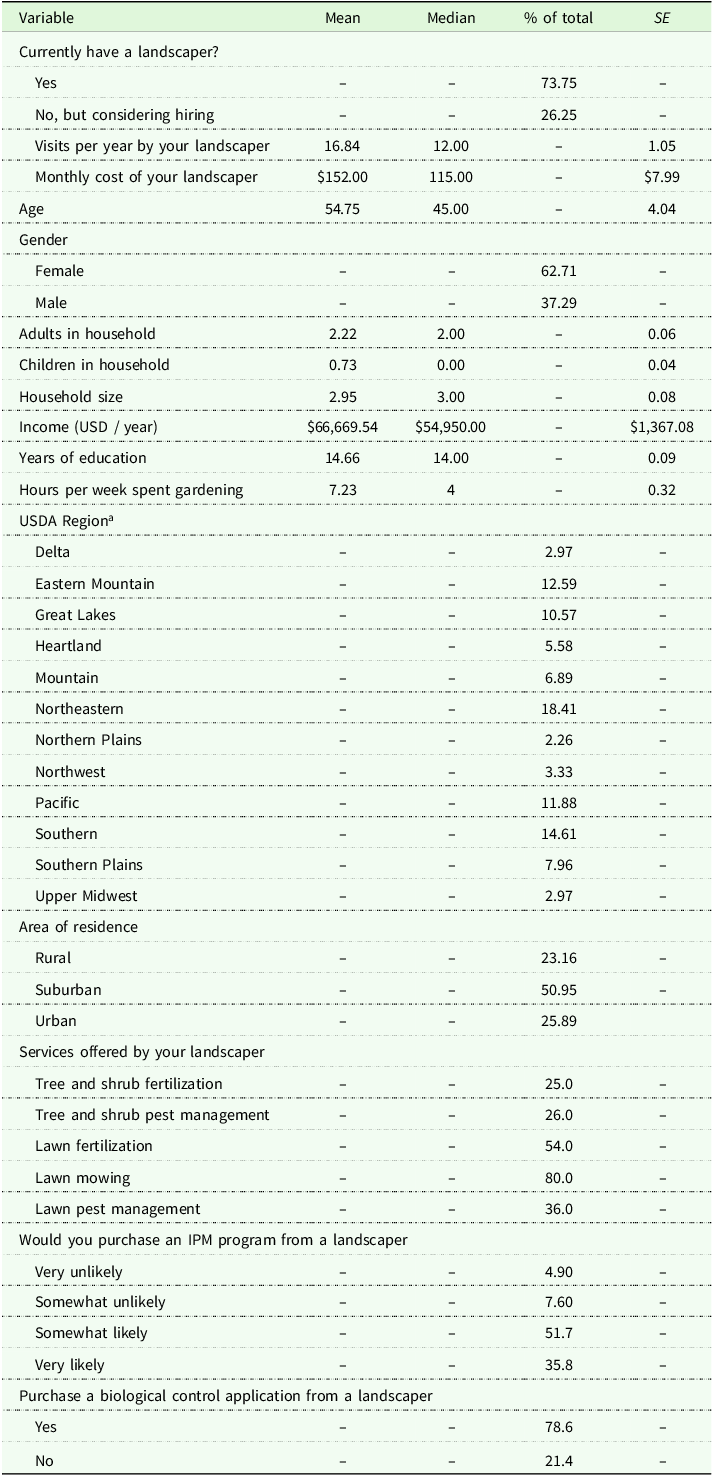
A total of 1,000 respondents completed the survey. The mean age of the respondents was 54.8 years, with a median household income of $54,950, approximately $25,000 below the 2023 national US median income of $80,610 (Guzman and Kollar Reference Guzman and Kollar2024), and a mean household size of 2.95. Respondents averaged 14.7 years of education and spent 7.23 hours gardening on average per week (Table 3). Seventy-three percent reported an active relationship with a LSP and supplied their current monthly fee. The remaining 27% indicated that they were actively considering hiring a LSP. Price attributes were presented in relative terms (“included in regular fees,” “10% more,” “20% more”), reflecting the way LSP commonly structure service packages. This design enables respondents to evaluate relative price differences without a specific baseline. For WTP estimation, the mean of $152.00 per month (calculated from current users) was used as the reference value for these respondents.
Demographics of survey respondents who participated in a study about willingness to pay for a scouting program offered by a landscape professional (n = 843)
a Cooter et al. (Reference Cooter, Bash, Benson and Ran2012).
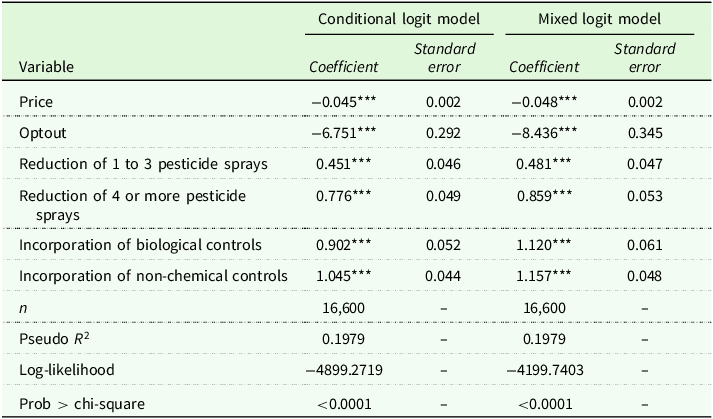
Results of conditional and mixed logit models showing the relative importance of landscaper scouting service product attributes influencing purchase likelihood of a scouting program offered by a landscape service provider
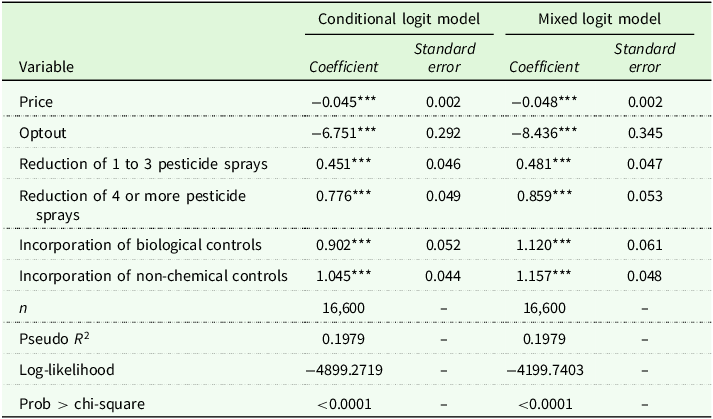
Table 4. Long description
The table presents the results of conditional and mixed logit models, focusing on the relative importance of various landscaper scouting service product attributes that influence the purchase likelihood of a scouting program offered by a landscape service provider. The table has 30 rows and 5 columns. The columns are labeled Variable, Mean, Median, % of total, and SE. The rows list different variables such as Currently have a landscaper, Visits per year by your landscaper, Monthly cost of your landscaper, Age, Gender, Adults in household, Children in household, Household size, Income (USD / year), Years of education, Hours per week spent gardening, USDA Region, Area of residence, Services offered by your landscaper, Would you purchase an IPM program from a landscaper, and Purchase a biological control application from a landscaper. Each row provides the mean, median, percentage of total, and standard error for each variable.
*, **, and *** represent significant at the 0.1, 0.05 and <0.01 significance levels respectively.
Following previous literature, our choice experiment included some non-dominant alternatives (specifically in choice sets 3 and 4) to verify whether participants understood the task (Bliemer et al. Reference Bliemer, Rose and Chorus2017). Respondents who chose the non-dominant options (n = 153) were removed from the sample, leaving 843 respondents for the conditional and mixed logit model analysis. Table 4 presents the results of the conditional and mixed logit models. Price, as expected, had a negative influence on the likelihood of purchasing a scouting program (p < 0.001; Table 4). The opt-out coefficient was negative (p < 0.001), indicating that on average, respondents had a strong negative utility for the opt-out option compared to the other alternatives and chose an alternative in the choice set rather than opting out (Table 4).
When evaluating the pesticide reduction attribute, the “no spray reduction” level was set as the reference level. Both conditional and mixed logit models indicated respondents were more likely to purchase a scouting program if the number of potential pesticide sprays was reduced by one to three (p < 0.001) and even more likely when reduced by four or more (p < 0.001) when compared to no pesticide spray reduction (Table 4). Consumers were more likely to purchase preventive scouting programs that offered biological control release options (p < 0.001; Table 4). The non-chemical control coefficient had the highest positive utility when compared to scouting programs that did not offer non-chemical options (p < 0.001; Table 4).
3.1. Willingness to pay
Discrete choice experiments are susceptible to hypothetical bias, whereby stated preferences may overestimate actual market behavior (Bliemer et al. Reference Bliemer, Rose and Chorus2017). The present design mitigates this risk by including a status quo alternative and an explicit opt-out option. The alternative-specific constant associated with the opt-out choice absorbs general yeah-saying tendencies, thereby isolating hypothetical bias from the attribute coefficients. The strongly negative opt-out coefficients (p < 0.001; Table 4) indicate that respondents preferred to choose among hypothetical alternatives rather than opt out. Following established methodology, the ratio of the opt-out coefficient to the price coefficient provides an implicit measure of hypothetical bias for a plan identical to the status quo, which should theoretically be zero (Bliemer et al. Reference Bliemer, Rose and Chorus2017). This design helps ensure that marginal WTP estimates are less influenced by hypothetical bias than in designs lacking these features (Bliemer et al. Reference Bliemer, Rose and Chorus2017). Because the price attribute was specified as percentage changes relative to the regular monthly landscaping fee, WTP values derived from coefficient ratios represent percentage-based changes in monthly fees. These estimates were converted to dollar amounts using the sample mean monthly landscaping fee to facilitate interpretation in monetary terms (Jiang et al. Reference Jiang, Zipp and Jacobson2018).
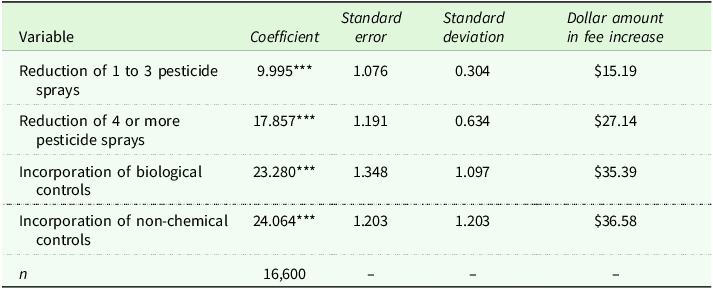
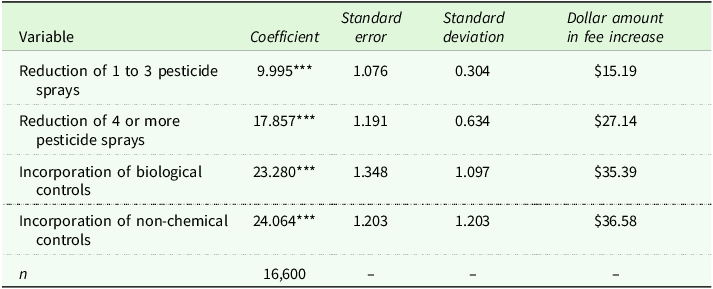
WTP values were derived using the negative ratio of each attribute coefficient to the price coefficient (Train Reference Train2003). To account for preference heterogeneity, these calculations were based on the mixed logit model reported in Table 4, and the estimates are presented in Table 5. For the spray reduction attribute, respondents were willing to pay an additional $15.19 in monthly fees for programs that reduced sprays by one to three applications compared to no spray reduction (p < 0.001). Programs offering a reduction of four or more spray applications yielded a potential WTP of $27.14 per month (p < 0.001). Programs incorporating biological control releases produced a similar increase, with an estimated WTP of $35.39 per month (p < 0.001). The most significant WTP increase was observed for programs emphasizing non-chemical control methods, with respondents willing to pay $36.58 more per month (p < 0.001) (Table 5).
Estimation of consumer’s willingness to pay based on landscaper scouting service product attributes, reflecting the change in average monthly service fees a landscapers could potentially charge if offering the attribute with the scouting service. Estimates derived from the mixed logit model coefficients
*, **, and *** represent significant at the 0.1, 0.05, and <0.01 significance levels, respectively.
a Dollar WTP estimates are based on price levels constructed using the sample mean monthly landscaping fee. Average monthly service fee was $152.00. Example: to determine the price increase = coefficient × average, for example, 9.995 × 1.52 = $15.19. or $152 per month × 0.09995.
3.2. Factors affecting the likelihood of purchase
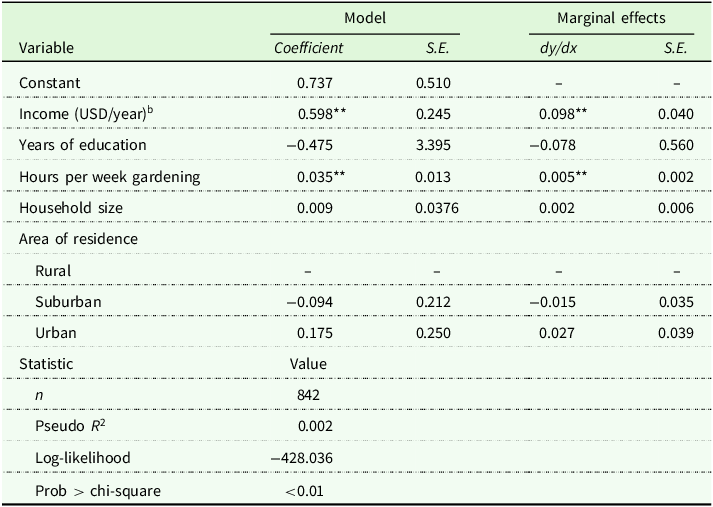
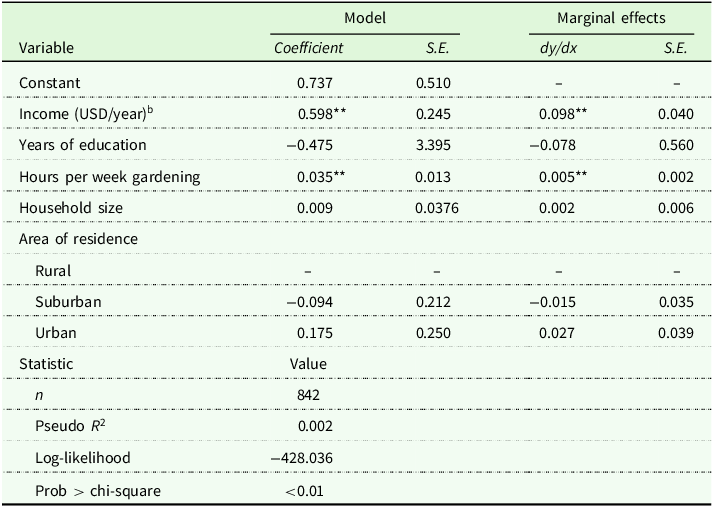
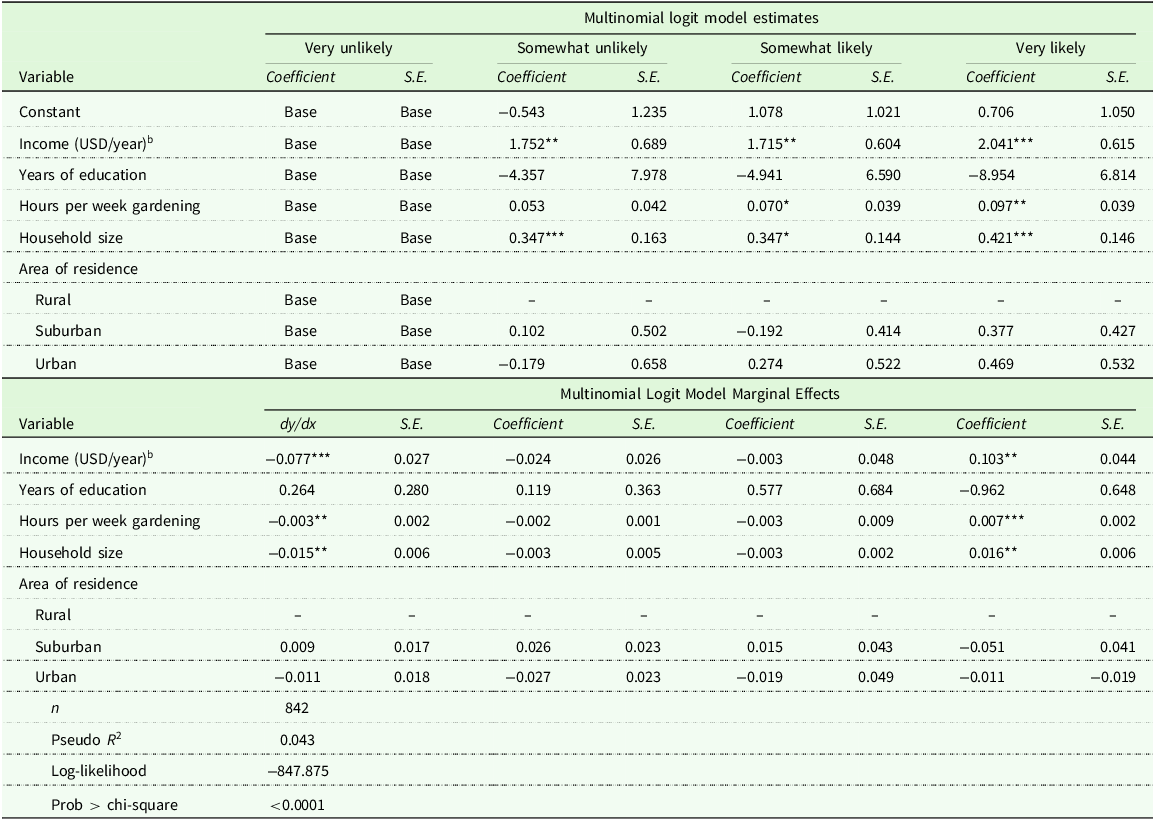
Results from the binomial logit model indicated that income (p = 0.02) and the number of hours spent gardening (p = 0.01) positively influenced the likelihood of purchasing a biological control treatment (Table 6). Specifically, as annual household income increased, the likelihood of purchasing a biological control program increased by 9.8 % (p < 0.05) (Table 6). Similarly, the multinomial logit model indicated that the probability of being somewhat likely (p = 0.01) and very likely (p < 0.001) to purchase an IPM program increased as household annual income increased when compared to those who were very unlikely to purchase a scouting program (Table 7). Household size also positively influenced consumers, being somewhat likely (p = 0.05) and very likely (p < 0.001) to purchase a scouting program (Table 7). As with the binomial model, marginal effects are more interpretable. As household income increased, the likelihood of purchasing an IPM program increased by 10.3% (p < 0.05) (Table 7).
Estimating purchase likelihood of a biological control application offered by a landscaper using a binomial logit model a
Estimating purchase likelihood of an integrated pest management plan offered by a landscaper using a multinomial logit model a
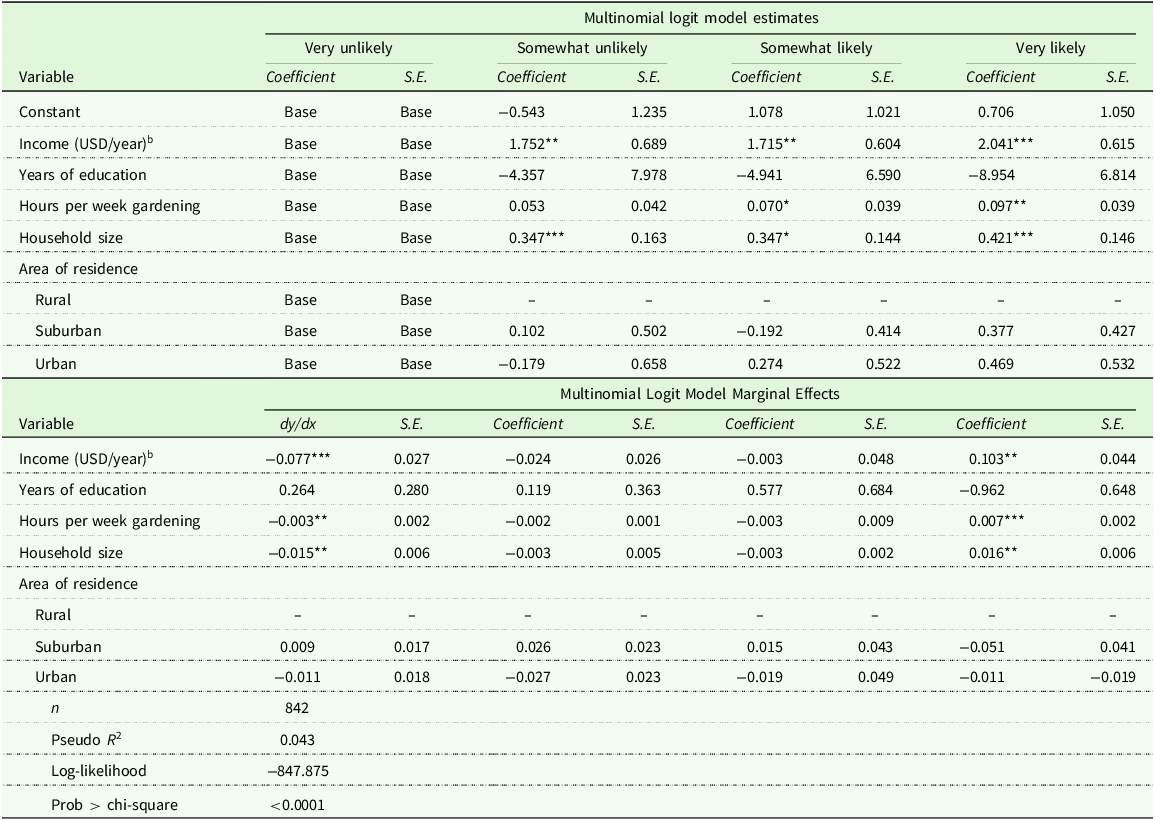
*, **, and *** represent significant at the 0.1, 0.05, and <0.01 significance levels, respectively.
4. Discussion
The correlation between utility and the number of avoided pesticide applications (p < 0.001; Table 4) supports the principles of IPM, as pesticides are used as a last resort when all other non-chemical control methods have failed to manage the pest. LSPs may perceive this as a potential loss of revenue, as the number of spray applications would be reduced. However, the majority of pesticide applications in the landscape are preventive. LSPs may be concerned that if preventative sprays are not completed, they may be blamed for any issues (Hubbell et al. Reference Hubbell, Florkowski, Oetting, Braman and Rodbacker2001; Klingeman et al. Reference Klingeman, Braman and Buntin2000). However, LSPs should make the case that active, monthly scouting will help detect pest infestations early and avoid unnecessary pesticide applications when pests are not present, a proactive and environmentally sustainable approach.
Given the results of Jeffers et al. (Reference Jeffers, Behe, Vassalos, Bridges and White2023, Reference Jeffers, Behe Bridget, Vassalos, Bridges and White2025) and the significant preference for biological control options (p < 0.001; Tables 4 and 5), LSPs may be able to offer biological control agent release services instead of chemical controls and charge customers a premium for this service. Adding biological control agent releases into their landscape management programs would also make their pest management programs more resilient in terms of combating pesticide resistance and enhancing environmental sustainability.
Non-chemical options produced the highest utility (p < 0.001; Table 4) and WTP (Table 5). These can include cultural controls that focus on maintaining plant health, as well as mechanical or physical controls that involve physical removal or methods that physically kill the pests. Both cultural and mechanical/physical control types are likely already performed by LSPs, as typical landscaping services involve fertilization, yard cleanup, debris removal, and other plant culture activities. Additionally, this could be a counterpoint to the earlier-mentioned reduction in preventive spray applications. LSPs can demonstrate to their clients that, even if they have detected a pest, there is no need to apply a pesticide when regular maintenance activities can resolve the issue. These activities are also potentially more profitable for LSPs, as they do not require specialized training and licensure, unlike pesticide applications.
5. Conclusions
With the importance of lawns and landscapes being greater than ever in the United States, consumers will need solutions to pest problems to protect them (Ahn et al. Reference Ahn, Luo, Mendoza and Norwood2024). With the rise in concern regarding pesticide overuse and dependency, consumers will always still be relying on landscape professionals to deliver solutions that manage the pests, but going forward may require more environmentally conscious approaches (Deguine et al. Reference Deguine, Aubertot, Flor, Lescourret, Wyckhuys and Ratnadass2021; Jeffers and Chong Reference Jeffers and Chong2021; Muniz-Junior et al. Reference Muniz-Junior, Roque, Pires and Guariento2023; Van der Sluijs et al. Reference Van der Sluijs, Simon-Delso, Goulson, Maxim, Bonmatin and Belzunces2013; Whitehorn et al. Reference Whitehorn, O’Connor, Wackers and Goulson2012). IPM can effectively manage pests while also protecting against environmental impacts resulting from the overuse of pesticides (Deguine et al. Reference Deguine, Aubertot, Flor, Lescourret, Wyckhuys and Ratnadass2021). As consumers become more aware of IPM, landscape professionals will need to respond with appropriate services (Jeffers et al. Reference Jeffers, Behe, Vassalos, Bridges and White2023; Jeffers et al. Reference Jeffers, Behe Bridget, Vassalos, Bridges and White2025). Since scouting is a foundational component of IPM, it is a natural starting point for landscape professionals to offer these services (Jeffers et al. Reference Jeffers, Behe, Vassalos, Bridges and White2023).
This research aimed to determine whether consumers are willing to pay for scouting services and provides evidence that they are willing. Notably, consumers are WTP for services if potential sprays are reduced and non-chemical options, such as biological controls, are included. While these patterns have implications for potential market segmentation and revenue generation, the models presented do not directly calculate profitability; rather, they provide insights into which segments of the market are most receptive to these service offerings.
These results show new potential revenue streams for LSPs. Offering a scouting program creates potential new revenue streams and marketing opportunities for LSPs. According to model results, LSPs that offer scouting programs potentially reducing pesticide sprays by four or more could yield $325 in annual gross revenue per customer. Even if only 100 customers signed up for the service, the potential additional yearly gross revenue would be $32,000 added to the firm. Similar gross revenue increases would be achievable if 100 customers purchased scouting programs that offered biological control options.
Scouting programs with non-chemical control options included could potentially yield an additional $43,000 in gross annual revenue. The perceived value of these services would enable landscape firms to potentially generate additional revenue, even if the number of actual sprays performed decreases. Similar to a termite warranty, where even if no recurring annual treatments are performed, the customer’s perception is likely that the landscaper is at least “protecting” their landscape, even when treatments are not performed. Allowing landscape firms to make nearly passive revenue with lower input costs.
Additional research is needed to determine the damage threshold(s) that customers are willing to tolerate before chemical intervention. Future studies could focus on a specific type of pest management (e.g., weed, disease, or insect) and the tolerance thresholds associated with that type of pest. Similarly, consumer populations could be sampled based on the services they currently receive from LSPs. For example, examining WTP for a scouting program specifically for residential lawns or residential shrubs and trees.
Data availability statement
Data were collected via a survey of 1,000 consumers through the Qualtrics Panel. Data is stored in an encrypted file per IRB policy and is available upon request to the primary or corresponding author.
Funding statement
This research received no specific grant from any funding agency, whether commercial or not-for-profit.
Competing interests
The authors declare no competing interests.

 Open access

