


1. Introduction
Exerting environmental regulations while achieving the dual goals of environmental protection and economic growth raises many concerns, especially for policymakers in developing countries (Liu et al., Reference Liu, Tan and Zhang2021). Existing literature finds that the impacts of environmental regulations at the firm level have become a controversial topic. A strand of studies shows that environmental regulations (e.g., the 2003 Plan of Key Cities Designation for Air Pollution Control in China, pollution abatement and control mandates in China, UK, and Europe) have some negative effects on firm innovation, Total Factor Productivity (TFP), and Research and Development (R&D) (Jiang et al., Reference Jiang, Wang and Li2018; Kneller and Manderson, Reference Kneller and Manderson2012; Rubashkina et al., Reference Rubashkina, Galeotti and Verdolini2015). Another strand of studies, consistent with Porter Hypothesis, finds that some environmental regulations (e.g., the 1997 cleaner production standards and pollution emission standards in China, the ban by Germany on the input of Azo-dyes in 1994) have positive impacts on innovation and productivity at the firm or industry level (Chakraborty and Chatterjee, Reference Chakraborty and Chatterjee2017; Kesidou and Wu, Reference Kesidou and Wu2020; Rubashkina et al., Reference Rubashkina, Galeotti and Verdolini2015; Xu et al., Reference Xu, Yang, Li and Shao2023).
While the food processing industry is increasingly associated with severe pollution problems, previous studies on the effects of environmental regulations have predominantly focused on heavily polluting industries such as steel and chemicals. Research specifically addressing the impact of environmental regulations on the food processing industry is rare. In 2020, the food processing industry emerged as the predominant sector of phosphorus metabolism in 14 provinces in China, which causes oxygen depletion, harmful algal blooms, and other environmental issues (Yang and Zhang, Reference Yang and Zhang2023). In other developing countries such as Bangladesh, the food industry is the largest source of air pollution, accounting for 39% of total emissions, with sugar mills, oil production, and fat factories being the primary culprits (Rasul et al., Reference Rasul, Faisal and Khan2006).
The uncertain impact of environmental regulations and their broader implications for the food processing industry emphasize the need for further investigation. To explore the relationship between environmental regulations and the food processing industry, this study examines the environmental policy effect on innovation of food processors and manufacturers using firm-level data from China. Specifically, we assess the impact of China’s 2016 Pollutant Discharge Permits System (PDPS).Footnote 1 The PDPS requires firms to obtain permits from local environmental authorities before discharging pollutants. These permits are granted based on region-specific standards designed to enhance environmental quality. Under the PDPS, firms will be held more accountable for their pollution, ensuring that both the discharge of pollutants and the monitoring of emissions are conducted with greater efficiency and transparency.
While the PDPS may contribute to an overall reduction in pollution in China, it is essential to consider how polluting firms, especially in the food processing industry, strategically navigate this regulation. The PDPS actions impose additional mandatory permits on firms, putting them at a competitive disadvantage relative to firms in regions with easier accessibility to discharge permits and fewer restrictions. This may encourage a “skirting strategy,” where firms are more inclined to locate in areas with weaker enforcement to avoid stringent regulations.Footnote 2 As a result, the PDPS reshapes the dynamics of firm entry and exit, stimulating agglomeration in regions where permit application is more lenient. This agglomeration leads to advantages such as a cheaper and faster supply of goods and services, proximity to consumers, improved quality of workers in labor markets, and knowledge spillovers (Greenstone et al., Reference Greenstone, Hornbeck and Moretti2010; Mukim, Reference Mukim2012). In this paper, we examine the effects of the PDPS on food processors’ innovation, particularly through the agglomeration resulting from firm entry and exit in response to the PDPS.
First, we construct a theoretical framework to model the static competition in terms of firm entry, exit, and innovation efforts under the PDPS by deriving the market entry threshold based on fixed PDPS compliance and innovation costs. We then conduct a static analysis of innovation efforts with respect to regulation enforcement and market size. We find the impact of PDPS stringency on innovation efforts is decomposed into two main effects: (1) price effects, and (2) market structure effects. The impact of PDPS regulations on innovation is uncertain because PDPS may reduce innovations through the negative own-price effect on demand but may stimulate innovation if the reduction in competing firms strengthens market power.
The empirical analysis is divided into two parts. First, as a validation, we examine the entry and exit decisions at the county level ex ante and ex post the implementation of the PDPS. Second, we investigate the impact of the PDPS on innovation and the mechanism of agglomeration. The results suggest that compared with the period before the PDPS, more stringent environmental enforcement would lead to a decrease of local firm entry. Besides, we show that a higher environmental regulation enforcement in neighboring regions would stimulate entrance in local markets following the implementation of the PDPS, confirming the prevalence of the skirting strategy among firms. We propose that the positive impact of the PDPS on firm innovation is primarily driven by increased industry agglomeration, a dynamic directly stimulated by heterogeneous regulatory pressures. This study demonstrates that firms adopt the skirting strategy by locating in regions with weaker enforcement, and that this agglomeration of firms can potentially enhance innovation. Such innovative behavior becomes an unintended consequence of environmental regulations.
The contribution of this study is twofold. First, this paper adds to the existing literature by examining how firms in the food processing industry adjust their spatial distribution and innovation strategies in response to environmental regulations. While previous studies have documented the positive agglomeration effect on innovation in agriculture and food processing sectors (e.g., Xu et al., Reference Xu, Jin and Tang2022), few have explored how such effect operates under the pressures of environmental regulation. Second, this study offers a complementary perspective on environmental standards by considering the potential innovation benefits of uneven regulations across regions. While most previous literature is in favor of a common environmental standard across regions to prevent the pollution haven effect and regional differences of environment (Hou et al., Reference Hou, Yu and Fei2023; Lian et al., Reference Lian, Ma, Cao and Wu2016; Peng et al., Reference Peng, Zhu and Cui2023; Wu et al., Reference Wu, Guo, Zhang and Bu2017), this study sheds light on the innovation benefits driven by uneven environmental regulations.
The remainder of the paper is organized as follows. Section 2 presents related literature. Section 3 illustrates a conceptual framework and Section 4 describes our empirical strategy. Section 5 discusses the data and provides a descriptive analysis. Section 6 presents the two parts of empirical results. We first conduct aggregate regressions to discuss firm entry and exit. Then, the baseline results, mechanism analysis, robustness checks, and heterogeneity analysis are presented. Finally, Section 7 concludes the study and provides policy implications.
2. Related literature
2.1. Porter hypothesis
Neoclassical economics views stringent environmental regulations as costly, forcing firms away from their optimal conditions. Porter and van der Linde (Reference Porter and van der Linde1995), however, argue that well-designed regulations, despite compliance costs, can stimulate innovation that offsets these costs and enhances competitiveness – an idea later termed the “Porter Hypothesis.” The subsequent literature distinguishes between its weak version (regulations encourage innovation) and strong version (regulations improve firm performance). Empirical research generally provides more support for the weak version than for the strong one (Qiu et al., Reference Qiu, Zhou and Wei2018), suggesting that environmental regulations hold potential to enhance innovation.
Building upon the debate surrounding the strong version of the Porter Hypothesis, this paper relates to a long-lasting body of literature that examines the impact of environmental regulation on firm performance. A particularly important strand of this literature focuses on how environmental regulation affects firms’ productivity. A number of studies investigate this issue through environmental policies in China. For instance, Cai and Ye (Reference Cai and Ye2020) find that the enactment of the New Environmental Protection Law (NEPL) in 2014 significantly hinders firms’ TFP. In contrast, Liu et al. (Reference Liu, Tan and Zhang2021) show that the Key Cities for Air Pollution Control (KCAPC) improves firm productivity and stimulates technological progress.
Beyond productivity, the impact of environmental regulation on firms’ innovation, which is more relevant to our study, has also been a widely discussed topic. Several studies argue that environmental regulations exert a negative effect on innovation and R&D investment. For example, Kneller and Manderson (Reference Kneller and Manderson2012), using data from the U.K. manufacturing sector between 2000 and 2006, show that stricter regulations directly reduce the optimal input allocated to non-environmental innovation, thus lowering overall R&D expenditure. Similarly, Jiang et al. (Reference Jiang, Wang and Li2018) find that industry-level environmental regulation in China negatively affects firms’ innovation activities.
In contrast, another strand of the literature emphasizes the potential for environmental regulation to stimulate innovation. Rubashkina et al. (Reference Rubashkina, Galeotti and Verdolini2015), examining manufacturing industries in 17 European countries over 1997–2009, provide evidence that environmental regulation promotes firms’ innovative activity. Chakraborty and Chatterjee (Reference Chakraborty and Chatterjee2017) exploit Germany’s 1994 ban on the use of ‘Azo-dyes’ in India’s leather and textile industries as a quasi-natural experiment and find that the regulation spurs innovation among Indian dye producers. Similar positive effects have been documented in China. Kesidou and Wu (Reference Kesidou and Wu2020) show that manufacturing firms located in provinces with stricter pollution reduction requirements generate a greater quantity and intensity of green patents. Xu et al. (Reference Xu, Yang, Li and Shao2023) find that the implementation of China’s cleaner production standards significantly encourages firms’ technological innovation. Using environmental information disclosure (EID) as a proxy of environmental regulation tools, Yang et al. (Reference Yang, Zhang, Song, Wu and Zhang2025) find that EID promotes both firms’ innovation input and output by relaxing financial constraints. Building upon this strand of literature, our work further extends the argument of Porter Hypothesis to the context of the food processing industry, aiming to reveal the innovation consequences of environmental regulation.
2.2. The Impact of environmental regulation on firm entry and exit
This study examines topics associated with the Pollution Haven Hypothesis, which suggests that firms may relocate in response to environmental regulation (Antweiler et al., Reference Antweiler, Copeland and Taylor2001; Copeland and Taylor, Reference Copeland and Taylor2004; Pethig, Reference Pethig1976). Our contribution connects to this hypothesis by focusing on how environmental policies affect firm entry and exit. There is a large body of research evaluating the impact of environmental regulation on entry and exit of firms (e.g., Candau and Dienesch, Reference Candau and Dienesch2017; Cui and Moschini, Reference Cui and Moschini2020; Qiu, Zhou, and Wei, Reference Qiu, Zhou and Wei2018; Zeng and Zhao, Reference Zeng and Zhao2009). Numerous studies show that firms adjust their location choices in response to environmental policies. For example, Wu et al. (Reference Wu, Guo, Zhang and Bu2017) show that water pollution reduction mandates in China induce a westward relocation of new firms. Building on this, Wu et al. (Reference Wu, Segerson and Wang2023) further highlight that such spatial shifts in response to environmental regulation can reduce the overall effectiveness of policy interventions. Manufacturing industry in China tends to move from strictly regulated provinces to loosely regulated ones, leading to the phenomenon of domestic pollution haven (Lian et al., Reference Lian, Ma, Cao and Wu2016). Notably, some studies examine the issue at an even more granular, intra-provincial level. For instance, Peng et al. (Reference Peng, Zhu and Cui2023), focusing on chemical firms in Jiangsu Province, document a sharp increase in inter-city relocations between 1998 and 2004, with a clear tendency for firms to move from cities with stricter to those with more lenient environmental regulations. Yet, little attention has been given to extending this strand of literature to the food processing industry.
2.3. The impact of industrial agglomeration on firm innovation
A substantial body of research has explored the role of industrial agglomeration in shaping firm performances. It is suggested that industrial agglomeration brings multiple benefits to firms, such as easier and cheaper access to goods and services (Greenstone et al., Reference Greenstone, Hornbeck and Moretti2010), closer proximity to labor and consumers, and lower transportation costs (Duranton and Puga Reference Duranton and Diego2014). Within the broad literature on agglomeration, this study focuses on its impact on innovation. An fundamental hypothesis early proposed by Marshall (Reference Marshall1890) is that geographic concentration of industries fosters knowledge spillovers and an innovative environment. A large body of research has since investigated how agglomeration affects firm innovation. For instance, India exhibits highly concentrated economic activity and innovation geographically, and empirical study using patent data shows that the innovation activities of Indian firms are influenced by spatial economic concentration (Mukim, Reference Mukim2012). Figueiredo et al. (Reference Figueiredo, Guimarães and Woodward2015) employ a high-dimensional gravity model to examine the role of inter-firm distance in the diffusion of knowledge, finding that knowledge spillovers are positively correlated with industrial agglomeration.
Empirical evidence also confirms positive spillover effects of agglomeration in sectors such as agriculture and food processing. While food processing is generally considered transportation-intensive and thus expected to be dispersed, Wu et al. (Reference Wu, Jin and Tokunaga2016) report a high degree of agglomeration in China, likely because processors locate near clustered agricultural raw materials. Larue and Latruffe (Reference Larue and Latruffe2009) evaluate the effect of spatial clustering on the technical efficiency of French pig-farming enterprises and find positive externalities of agglomeration, largely driven by knowledge spillovers. Similarly, Pan and Li (Reference Pan and Li2019) show a high geographic agglomeration effect from the hog market in China. Xu et al. (Reference Xu, Jin and Tang2022) use provincial panel data from 2009–2019 in China and find a U-shaped effect of agricultural agglomeration on productivity, with later stages enhancing productivity via knowledge spillovers.
2.4. Research summary
Existing studies have examined how environmental regulations influence firms’ innovation, entry and exit decisions, and the role of industrial agglomeration. It is widely acknowledged that stricter regulations generally discourage entry and stimulate exit, generating the Pollution Haven effect as firms locate in regions with weaker enforcement. However, the effect on innovation remains debated: some studies support the Porter Hypothesis, suggesting well-designed regulation stimulates innovation, while others highlight cost and uncertainty effects that inhibit innovation. Mechanism-focused research regarding the Porter Hypothesis primarily considers compliance costs, green technology efficiency, and policy uncertainty, yet less attention has been given to the role of agglomeration driven by firms’ entry and exit decisions.
The food processing industry has long been recognized as an important area of research within agricultural economics, with studies examining firm profitability, trade, and market structure (Curzi et al., Reference Curzi, Garrone and Olper2021; Hamilton and Sunding, Reference Hamilton and Sunding2021; Jafari et al., Reference Jafari, Koppenberg, Hirsch and Heckelei2023; Pagoulatos and Sorensen, Reference Pagoulatos and Sorensen1979). Although research directly linking environmental regulation to innovation in this sector is limited, prior studies on other regulations show mixed effects: some nutrition and food safety regulations hinder innovation (e.g., Hermann, Reference Hermann2009; Khedkar et al., Reference Khedkar, Ciliberti and Bröring2016; Moors, Reference Moors2012), while regulations promoting product scale expansion may enhance firms’ innovative capacity (Herath et al., Reference Herath, Cranfield, Henson and Sparling2008). Our study contributes by explicitly examining the relationship between environmental regulation and innovation in the food processing industry.
According to the literature, industrial agglomeration is widely recognized to enhance innovation through knowledge spillovers, resource sharing, and collaborative dynamics – a conclusion that also applies to the food processing industry. We provide a new insight that environmental regulation can influence innovation via three steps: it redirects new entrants to less regulated areas, reshapes agglomeration patterns, and fosters innovation through agglomeration-based spillovers and supportive local knowledge networks. Figure 1 shows the logic of the empirical strategy throughout this paper.
The dual channels of PDPS: skirting strategy and heterogeneous innovation incentive.

Figure 1 Long description
The flowchart titled 'Empirical Strategy Logic' outlines the process and impact of the Pollutant Discharge Permits System (PDPS) on firm behavior and innovation. The PDPS influences firms' entry and exit decisions, which are moderated by regional environmental enforcement. This enforcement can be weak or strong, leading to different outcomes. Weak enforcement results in significant increases in innovation, while strong enforcement results in insignificant increases. The mechanism analysis shows that agglomeration plays a key role in these outcomes. Firms may adopt a skirting strategy to avoid stringent regulations, leading to agglomeration in regions with lenient permit applications. This agglomeration provides advantages such as cheaper and faster supply of goods and services, proximity to consumers, improved quality of workers, and knowledge spillovers. The overall impact of the PDPS on innovation is examined through the lens of heterogeneous agglomeration effects.
3. Conceptual framework
In this section, we construct a theoretical framework to model the static competition on entry and exit of firms and their innovation effort under the PDPS. The entry and exit equilibriums are made by market demand (see, for instance Bresnahan and Reiss (Reference Bresnahan and Reiss1991) and Hopenhayn (Reference Hopenhayn1992)). We first derive a market entry condition that incorporates both fixed compliance and innovation costs, and then analyze how firms determine cost-reducing innovation in equilibrium.Footnote 3
3.1. Entry and exit
Following Vives (Reference Vives2008), we consider a differentiated product market with n symmetric firms competing à la Bertrand. Each firm produces a unique variety, and consumers exhibit a preference for variety. Let the inverse demand function for firm i’s product be derived from a representative consumer’s utility maximization problem, so that the demand for firm i is:
 $$ Q_{i}=Sd_{i}\left(P_{i}\left(a\right),P_{-i}\left(a\right), n\left(a\right)\right)$$
where Q i denotes quantity demanded, P i (a) is the price set by firm i, and P −i (a) is the vector of prices set by all other firms. The number of firms in the market, n(a), may also depend on the stringency of the PDPS regulation, denoted by a ∈ [0,1], where higher values of a represent stricter enforcement and more rigorous compliance obligations. The function d i (P i (a),P −i (a), n(a)) captures consumer preferences for differentiated products, responding to own price, rivals’ prices, and the degree of variety available in the market. S denotes the size of the market.
Each firm incurs a fixed compliance cost, F(a), which is increasing in regulation stringency a, as firms must undertake greater efforts – such as monitoring, reporting, or capital investments – to meet PDPS requirements. Firms can also invest in innovation, denoted z i , which reduces their marginal production costs. The marginal cost function is given by c i = c(z i ), where c(z) > 0, c′(z) < 0, and c″(z) > 0, implying that innovation lowers marginal costs, but at a diminishing rate. Firm i’s profit is given by:
 $$\pi _{i}=\left[p_{i}-c_{i}\left(z_{i}\right)\right]Sd_{i}\left(P_{i}\left(a\right),P_{-i}\left(a\right),\ n\left(a\right)\right)-z_{i}-F\left(a\right) $$
Entry occurs only if the expected profit is positive. Solving the inequality π i > 0 for the threshold condition yields:
 $$s={S \over n}\gt {F\left(a\right)+z_{i} \over \left[p_{i}-c\left(z_{i}\right)\right]nd_{i}\left(P_{i}\left(a\right),P_{-i}\left(a\right),\ n\left(a\right)\right)}$$
where s is the market entry threshold for firm i. This expression characterizes the minimum market size per firm, or the entry threshold. As PDPS regulations become more stringent (higher a), the fixed compliance cost F(a) increases, raising the entry threshold and potentially deterring some firms from entering. This may lead to a lower equilibrium number of firms. In extreme cases, firms may exit the market or relocate to jurisdictions with weaker environmental standards.
However, the impact of regulatory stringency on the entry threshold is theoretically ambiguous. While stricter regulation increases costs (raising the threshold), it may also influence demand (denominator of Equation 3), depending on how a affects consumer preferences and competition. We explore this further in the innovation section.
3.2. Innovation effort
Now fix market size per firm at s = 1, so that firms simultaneously choose innovation and price, (z i ,p i ). This is equivalent to an open-loop strategy in a two-stage game where firms first choose z i , then compete in prices (Vives, Reference Vives2008). The question therefore is how parameter changes affect output in equilibrium. Let equilibrium output per firm be x(z i ;a) ≡ H(P i (a),P −i (a),n(a);a) in the Bertrand equilibrium for a given z i . Differentiating with respect to regulation a yields that
 $${\partial x_{i} \over \partial a}={\partial H \over \partial p_{i}}{\partial p_{i} \over \partial a}+{\partial H \over \partial p_{-i}}{\partial p_{-i} \over \partial a}+{\partial H \over \partial n}{\partial n \over \partial a}+{\partial H \over \partial a}$$
The term ${\partial H \over \partial p_{i}}{\partial p_{i} \over \partial a}$
and
${\partial H \over \partial p_{i}}{\partial p_{i} \over \partial a}$
and ${\partial H \over \partial p_{-i}}{\partial p_{-i} \over \partial a}$
are price effects. The term
${\partial H \over \partial p_{-i}}{\partial p_{-i} \over \partial a}$
are price effects. The term ${\partial p \over \partial a}\gt 0$
indicates that higher regulatory enforcement increases costs for firms to meet discharge requirements, affecting prices. The own-price effect on demand is expected to be negative (
${\partial p \over \partial a}\gt 0$
indicates that higher regulatory enforcement increases costs for firms to meet discharge requirements, affecting prices. The own-price effect on demand is expected to be negative ( ${\partial H \over \partial p_{i}}\lt 0$
) as higher prices reduce own demand, while the cross-price effect is expected to be positive (
${\partial H \over \partial p_{i}}\lt 0$
) as higher prices reduce own demand, while the cross-price effect is expected to be positive ( ${\partial H \over \partial p_{-i}}\gt 0$
) if the product of firm i is substitutable with that of other firms. The net price effect depends on the relative magnitude of these forces. This means that firm i’s demand may decrease due to its own price increase, but it may increase if competitors’ prices rise more sharply, making firm i’s product more attractive.
${\partial H \over \partial p_{-i}}\gt 0$
) if the product of firm i is substitutable with that of other firms. The net price effect depends on the relative magnitude of these forces. This means that firm i’s demand may decrease due to its own price increase, but it may increase if competitors’ prices rise more sharply, making firm i’s product more attractive.
The third term ${\partial H \over \partial n}{\partial n \over \partial a}$
captures market structure effect and depends on how the number of firms, n, changes with regulatory enforcement. Compliance with PDPS regulations reduces the number of firms (
${\partial H \over \partial n}{\partial n \over \partial a}$
captures market structure effect and depends on how the number of firms, n, changes with regulatory enforcement. Compliance with PDPS regulations reduces the number of firms ( ${\partial n \over \partial a}\lt 0)$
, then less competition (lower n) can strengthen market power of firm i and expand its demand, making
${\partial n \over \partial a}\lt 0)$
, then less competition (lower n) can strengthen market power of firm i and expand its demand, making ${\partial H \over \partial n}$
negative. Yet,
${\partial H \over \partial n}$
negative. Yet, ${\partial H \over \partial n}$
can be positive because when there are more firms in a market, firms often differentiate their products, which appeal to a larger segment of consumers that can closely match their preferences, thereby increasing overall demand. The final term,
${\partial H \over \partial n}$
can be positive because when there are more firms in a market, firms often differentiate their products, which appeal to a larger segment of consumers that can closely match their preferences, thereby increasing overall demand. The final term, ${\partial H \over \partial a}$
, captures the direct impact of regulation on demand, which has no predetermined sign.
${\partial H \over \partial a}$
, captures the direct impact of regulation on demand, which has no predetermined sign.
Consider a symmetric regular interior equilibrium (p*, z*), the innovation effort responds to changes in output. Specifically,
 $$sign\left\{{\partial z^{*} \over \partial a}\right\}=sign\left\{{\partial x_{i} \over \partial a}\right\}=sign\left\{{\partial H \over \partial p_{i}}{\partial p_{i} \over \partial a}+{\partial H \over \partial p_{-i}}{\partial p_{-i} \over \partial a}+{\partial H \over \partial n}{\partial n \over \partial a}+{\partial H \over \partial a}\right\}$$
where (p
i
(z
i
,a), x
i
(z
i
,a)) is the symmetric Bertrand equilibrium for given a and z
i
. In Appendix A, we show explicitly why the sign of ${\partial z_{i} \over \partial a}$
follows the sign of
${\partial z_{i} \over \partial a}$
follows the sign of ${\partial x_{i} \over \partial a}$
. This condition implies that innovation rises when stricter regulation increases output per firm, for example by strengthening market power as the number of competing firms declines, but falls when stricter regulation reduces demand, for example through higher prices. The overall impact of PDPS on innovation is therefore theoretically ambiguous.
${\partial x_{i} \over \partial a}$
. This condition implies that innovation rises when stricter regulation increases output per firm, for example by strengthening market power as the number of competing firms declines, but falls when stricter regulation reduces demand, for example through higher prices. The overall impact of PDPS on innovation is therefore theoretically ambiguous.
3.3. Comparative statics
To analyze comparative statics with respect to the number of firms, we involve a sequential game, where firms first choose their innovation effort and then engage in Bertrand price competition. We use the concept of subgame perfect equilibrium (SPE) to ensure that firms’ strategies are optimal at every stage of the game. This approach allows us to derive each firm’s reduced-form profit function as a function of both its own and its rivals’ innovation choices. We then conduct comparative statics on this equilibrium profit function to examine how the number of firms – representing entry and exit behavior within the SPE framework – affects innovation incentives and market outcomes.
Let p*(z i ,z −i ), i = 1, …, n, denote the second-stage Bertrand equilibrium for a given innovation profile z. Firm i’s reduced-form profit in the first stage is
 $$\left[p_{i}^{*}\left(z_{i},z_{-i}\right)-c_{i}\left(z_{i}\right)\right]H\left(p_{i}^{*}\left(z_{i},z_{-i}\right)\right)-z_{i}-F\left(a\right)$$
From the equilibrium conditions we obtain
 $${\partial \pi _{i} \over \partial p}=H\left(p\right)+\left(p-c\left(z\right)\right){\partial H \over \partial p}=0$$
and the first-order condition for innovation is
 $$\rm B\left(z;n\right)={\partial \pi _{i} \over \partial z_{i}}=-\it{c}^\prime\left(z_{i}\right)H\left(p^{*}\left(z,n\right)\right){\rm -1}+\left(\it{p}_{i}^{*}-c_{i}\left(z_{i}\right)\right){\it{\partial H} \over \it{\partial p_{j}}}{\it{\partial p_{j}^{*}} \over \it{\partial z_{i}}}\left(\it{n}-\rm{1}\right)=0$$
The first term, −c′(z i )H(p), is the direct marginal benefit of innovation: lowering cost raises the margin on each unit sold.
The last term $\left(p_{i}-c_{i}\left(z_{i}\right)\right){\partial H \over \partial p_{j}}{\partial p_{j}^{*} \over \partial z_{i}}\left(n-1\right)$
captures the strategic effect of innovation: changing z
i
influences the equilibrium prices set by other firms in the second stage.Footnote
4
With strategic complementarity in prices, each firm’s best-response function in the pricing stage slopes upward: when one firm raises its price, rivals also find it optimal to raise theirs. Suppose firm i increases its innovation z
i
. This lowers its cost c
i
(z
i
), making it more aggressive in price competition. In equilibrium, its own optimal price falls, which reduces profitability and discourages innovation. Therefore,
$\left(p_{i}-c_{i}\left(z_{i}\right)\right){\partial H \over \partial p_{j}}{\partial p_{j}^{*} \over \partial z_{i}}\left(n-1\right)$
captures the strategic effect of innovation: changing z
i
influences the equilibrium prices set by other firms in the second stage.Footnote
4
With strategic complementarity in prices, each firm’s best-response function in the pricing stage slopes upward: when one firm raises its price, rivals also find it optimal to raise theirs. Suppose firm i increases its innovation z
i
. This lowers its cost c
i
(z
i
), making it more aggressive in price competition. In equilibrium, its own optimal price falls, which reduces profitability and discourages innovation. Therefore, ${\partial p_{j}^{*} \over \partial z_{i}}\leq 0$
. In addition, since products are gross substitutes, demand functions for differentiated products satisfy
${\partial p_{j}^{*} \over \partial z_{i}}\leq 0$
. In addition, since products are gross substitutes, demand functions for differentiated products satisfy ${\partial H \over \partial p_{j}}\geq 0$
: when rival j’s price rises, demand for firm i’s variety increases (and vice versa). Overall, the “commitment” term
${\partial H \over \partial p_{j}}\geq 0$
: when rival j’s price rises, demand for firm i’s variety increases (and vice versa). Overall, the “commitment” term $\left(p_{i}-c_{i}\left(z_{i}\right)\right){\partial H \over \partial p_{j}}{\partial p_{j}^{*} \over \partial z_{i}}\left(n-1\right)$
is non-positive. Intuitively, innovation commits a firm to tougher competition, provoking rival price cuts that erode the payoff to innovation. Hence, the strategic effect of innovation effect always weakens the incentive to invest in innovation.
$\left(p_{i}-c_{i}\left(z_{i}\right)\right){\partial H \over \partial p_{j}}{\partial p_{j}^{*} \over \partial z_{i}}\left(n-1\right)$
is non-positive. Intuitively, innovation commits a firm to tougher competition, provoking rival price cuts that erode the payoff to innovation. Hence, the strategic effect of innovation effect always weakens the incentive to invest in innovation.
For comparative statics in the number of firms, Appendix B shows that
 $$sign\left\{{\partial z \over \partial n}\right\}=sign \ \left\{{\partial \rm B\ \over \partial n}\right\}$$
with
 $${\partial \rm B\ \over \partial n}=-c^\prime\left(z_{i}\right){\partial H\left(p^{*}\left(z,n\right)\right) \over \partial n}+\left(p_{i}^{*}-c_{i}\left(z_{i}\right)\right){\partial H \over \partial p_{j}}{\partial p_{j}^{*} \over \partial z_{i}}+\left(p_{i}^{*}-c_{i}\left(z_{i}\right)\right){\partial \over \partial n}\left[{\partial H \over \partial p_{j}}{\partial p_{j}^{*} \over \partial z_{i}}\right]\left(n-1\right)$$
The first term is negative if additional entry reduces per-firm demand ${\partial H\left(p^{*}\left(z,n\right)\right) \over \partial n}\lt 0$). The second term is non-positive by the sign structure above. The last term, the derivative of the strategic effect, has an ambiguous sign: with more firms, competition in the second stage may intensify, strengthening innovation incentives, or firms may have weaker incentives to innovate if each one’s ability to influence equilibrium prices diminishes. Overall, the comparative static sign of ${\partial z \over \partial n}$
is theoretically ambiguous. Thus, Equation (10) shows that a greater number of firms may be associated with lower innovation incentives. However, innovation may rise with entry if firms anticipate substantially intensified competition, consistent with evidence from agglomeration studies such as Greenstone et al. (Reference Greenstone, Hornbeck and Moretti2010), which find that clustering can stimulate innovative activity.
${\partial z \over \partial n}$
is theoretically ambiguous. Thus, Equation (10) shows that a greater number of firms may be associated with lower innovation incentives. However, innovation may rise with entry if firms anticipate substantially intensified competition, consistent with evidence from agglomeration studies such as Greenstone et al. (Reference Greenstone, Hornbeck and Moretti2010), which find that clustering can stimulate innovative activity.
4. Empirical strategy
4.1. Skirting strategy validation: impact of the PDPS on firm entry and exit
Consistent with the conceptual framework discussed in Equation (3), we first investigate the impact of the PDPS policy on firm location behavior as a validation, using the OLS method with county-industry-year-level panel data. An empirical challenge is the measurement of the skirting strategy of firms. Since direct observation of firm relocation is unavailable, we use the spatial lag of X (SLX) model to evaluate the effects of neighboring environmental regulation on local firm entry and exit. The SLX model allows for both direct (local) effects and indirect (spillover) effects of explanatory variables (Halleck Vega and Elhorst, Reference Halleck Vega and Elhorst2015). The models are specified as:


where Exit kjt (Entry kjt ) is the number of firms exit (entry) of three-digit industry k in county j at year t. PDPS kt takes the value of one if the PDPS implements at year t for industry k. Enforcement jt denotes the number of environmental penalty cases in county j in year t, capturing the intensity of local environment enforcement (Li and Ramanathan, Reference Li and Ramanathan2018; Wang et al., Reference Wang, Si and Hu2023). Enforcement jt ′ denotes the neighboring number of environmental penalty cases, which is constructed by utilizing the county-level spatial weights matrix with inverse distance. We use the total number of environmental penalty cases as a proxy for local environmental enforcement because the PDPS regulates emissions from food processing firms across multiple sources, including air pollution, water pollution, and other as well. We focus on the interaction terms between the PDPS and environmental enforcement (both local and neighboring) to assess whether the implementation of the PDPS affects firms’ entry and exit decisions across regions with varying levels of environmental enforcement. The main effects of the variables involved in the interaction terms are controlled for in the model. We adjust all the continuous variables by taking logarithm. γ kj are industry-county fixed effects capturing differences across counties and industries. Moreover, we include year fixed effects (η t ) in our specification. u kjt and ϵ kjt are the unobservable error terms. To control for potential industrial correlations of the error terms, we cluster the standard errors by industry and year.
Changes in the number of firms, driven by firm entry and exit, can influence the number of environmental penalty cases, leading to reverse causality and potential endogeneity issues. Specifically, an increase in firm activity may elevate pollution levels, prompting stricter enforcement and more penalties, while a decline in firm numbers could reduce violations and regulatory actions. This dynamic introduces bias in estimation if not properly addressed. To mitigate this endogeneity concern, we adopt an IV strategy, using the air ventilation coefficient as an IV (Shi and Xu, Reference Shi and Xu2018; Yang et al., Reference Yang, Ding and Zhu2024). According to Jacobson (Reference Jacobson2002), higher air ventilation coefficients facilitate faster dispersion of pollutants, mitigating the negative effects of air pollution. In contrast, regions with lower air ventilation coefficients experience greater pollution accumulation, resulting in more environmental penalties.
As our measure of environmental penalty cases consists of air pollution-related penalties, the air ventilation coefficient serves as a strong predictor of penalty frequency. Moreover, air ventilation is determined by geographical and meteorological factors (e.g., wind speed, topography), it is exogenous to firm-specific characteristics and local regulatory discretion, satisfying the exogeneity condition for a valid instrument. To ensure consistent treatments in the IV estimates for ln (Enforcement), ln (Enforcement′) and their corresponding interaction terms, we further construct the air ventilation coefficient of neighboring regions as an additional IV by employing the same county-level spatial weights matrix logic for ln (Enforcement′).
4.2. Firm level analysis: impact of the PDPS on firm innovation
We then examine the impact of the PDPS on firm innovation as our baseline, using the following model that corresponds to the theoretical framework in Equation (5):
 $$ln\left({Patent}\right)_{ith} =\lambda _{0}+\lambda _{1}{Treated}_{ith}+\mu _{i}+\omega _{t}+\tau _{h}+\upsilon _{ith}$$
where i represents firms, t represents years, and h represents firm ages. We include firm age as a time dimension in the panel and utilize age fixed effects to control for the probability of innovation caused by firm age, given existing literature has shown that firm age plays a critical role in innovation (Coad et al., Reference Coad, Segarra and Teruel2016; Criscuolo et al., Reference Criscuolo, Nicolaou and Salter2012; Huergo and Jaumandreu, Reference Huergo and Jaumandreu2004). Patent ith denotes the number of patent applications of firm i in year t at age h. We use patent application as a proxy of overall innovation activity because patent broadly approximates the output of innovation (Bloom et al., Reference Bloom, Draca and Van Reenen2016; Rubashkina et al., Reference Rubashkina, Galeotti and Verdolini2015). We exclude applications being rejected by authorities. Treated ith is an indicator with 1 if the PDPS is treated in firm i in year t at age h and 0 otherwise. Firm fixed effects μ i are included to control for time-invariant characteristics of firms that are related to innovation capacity. We also include year fixed effects ω t to capture the general macroeconomic factors that influence all firms over time. τ h are age fixed effects. υ ith is the error term. Because the explanatory variables of interest vary at the industry-year level, we cluster the standard errors by three-digit industry and year to control for potential industrial correlations of the error term (Liu et al., Reference Liu, Tan and Zhang2021).
4.2.1. Mechanism
Should firms choose to circumvent PDPS regulations, thereby influencing regional agglomeration, we further examine how this mechanism impacts firm performance, i.e., innovation activities. The empirical model builds on the comparative statics discussed in Section 3.3 and is specified as follows:

where Agglomeration ith is the number of neighboring firms in the same three-digit industry within a given geographical distance. This measurement is based on economic relevance rather than political boundaries such as county, which indicates that firms can benefit from their geographical neighboring firms through the role of agglomeration even though they are not in the same administrative unit (Seim, Reference Seim2006; Hailu and James Deaton Reference Hailu and James Deaton2016). According to previous literature, we compute the number of neighboring firms within a great circle of 10 km (Hoogstra and Van Dijk, Reference Hoogstra and Van Dijk2004; Hailu and James Deaton Reference Hailu and James Deaton2016). We also calculate with 5 and 10 km for robustness checks.
5. Data
The following sections describe data construction in more detail. The summary statistics for all variables used are shown in Table 1.
Summary statistics

Table 1 Long description
The table presents summary statistics for various variables analyzed at both county and firm levels. For county-level analysis, it includes variables such as Entry count, Exit count, Environmental penalty cases count, Enforcement log, Enforcement of neighboring regions log, Air ventilation coefficient, and Air ventilation coefficient of neighboring regions. The firm-level analysis covers variables like Patent count, Agglomeration counts at different distances, Registered capital in million RMB, and indicators for foreign and domestic firms. Each variable is described with its mean, standard deviation, minimum, and maximum values. The county-level analysis includes 455,940 observations, while the firm-level analysis includes 244,567 observations.
Note: The upper panel of the table presents the mean and standard deviation for each variable at the county-industry-year level during 2013–2022, focusing on the investigation of the PDPS impact on firm entry and exit. The lower panel of the table demonstrates the summary statistics for variables at the firm-year-age level ranging from 2013–2022, used in the baseline regression and mechanism analysis.
5.1. PDPS data
The policy implementation timelines are obtained from documents issued by the Ministry of Ecology and Environment (MEE) in China. The Classified Management Catalog for Pollutant Discharge Permits for Fixed Pollution Sources, published by the MEE, details the implementation time of the PDPS for various industries. The food processing industry consists of three two-digit industries: agricultural and sideline food processing, food manufacturing, and alcoholic, beverage and tea manufacturing.Footnote 5 , Footnote 6 There are several studies of the food processing industry using the same way of classification (Wu et al., Reference Wu, Jin and Tokunaga2016; Chen et al., Reference Chen, Khanna and Yang2022). Within these three categories, there are 18 three-digit industries with different PDPS implementation timelines. Table 2 provides information about the industries, proportion in our firm-level sample, and the policy implementation time according to the requirements of the PDPS.
Summary statistics of industry and policy time

Table 2 Long description
The table presents summary statistics of industry and policy time, focusing on two-digit and three-digit industry classifications, their proportions in a firm-level sample, and the corresponding policy implementation times. The table has three main columns: two-digit industry, three-digit industry, and time. The two-digit industries include agricultural and sideline food processing, food manufacturing, and alcoholic, beverage, and tea manufacturing. Each two-digit industry is broken down into several three-digit industries with specific proportions and implementation years. For example, agricultural and sideline food processing includes categories like sugar processing, slaughter and meat processing, and feed processing, with implementation years ranging from 2017 to 2020. Food manufacturing includes categories like convenience food manufacturing, dairy product manufacturing, and bakery and baked goods manufacturing, with implementation years from 2019 to 2020. Alcoholic, beverage, and tea manufacturing includes alcohol manufacturing, beverage manufacturing, and tea manufacturing, with implementation years from 2019 to 2020.
5.2. Firm-level data
Firm data was sourced from the China Academy for Rural Development-Qiyan China Agri-research Database (CCAD), which provides information on firms with continuous annual observations for each, including entry and exit years, province, city, and county information, firm name, industry classification, registered capital, firm type, and geographic coordinates (longitude and latitude) for each firm. CCAD also includes detailed patent data, such as patent type, application and publication dates, and patent ownership. We merge the patent database with the firm data to create a unique firm-level panel dataset from 2013 to 2022 while retaining observations of older firms founded before 2013. The geographic information is then used to measure agglomeration.
5.3. County characteristics
The environmental penalty data is obtained from the Pku Law database and covers the period from 2013 to 2022. We interpret the variable as a suitable proxy of the local environmental regulation enforcement (Li and Ramanathan, Reference Li and Ramanathan2018; Wang et al., Reference Wang, Si and Hu2023). We further investigate the neighboring effect by using the county-level spatial weights matrix (inverse distance matrix) to construct the enforcement of neighboring environment regulation. In the validation analysis, we use the air ventilation coefficient as IV, which is the product of wind speed and the mixing height for each county. The variable is derived from the European Center for Medium-Term Weather Forecasting ERA-interim dataset from 2013 to 2021. We match the dataset with counties in our sample by their corresponding longitudes and latitudes.
6. Empirical results
6.1. Skirting strategy validation: impact of the PDPS on firm entry and exit
Table 3–5 show the results on the impact of the PDPS on firm entry and exit based on Equation (11) and (12). Table 3 reports the OLS estimates of the impact of the PDPS on firm exit and entry, respectively. We find that both local and neighboring regulatory enforcement after the PDPS significantly increase the number of entry and exit. Since our OLS estimates could be biased if the changes of the entry and exit decision affect the number of environmental penalty cases, IV estimations are presented in Tables 4 and 5. Table 4 reports the first stage results, indicating that the IV is a strong predictor of environmental regulation enforcement with F-values of 17.46, 18.99, 22.00, and 21.47, respectively. The second-stage results are presented in Table 5. Column (1) shows that either local or neighboring environmental enforcement has no significant impact on firm exit after the implementation of the PDPS. This could be because firms had already adjusted their operations to meet regulatory standards or because enforcement measures did not create strong enough deterrents to drive firms out of the markets.
Impact of the PDPS on firm entry and exit (OLS estimates)

Table 3 Long description
The table presents the results of the impact of the PDPS on firm entry and exit based on OLS estimates. It includes two columns labeled 'ln(Exit)' and 'ln(Entry)', each with several rows of data. The rows include variables such as PDPS, PDPS x ln(Enforcement), PDPS x ln(Enforcement'), ln(Enforcement), and ln(Enforcement'). The table also indicates the inclusion of year fixed effects and industry-county fixed effects. The data shows the coefficients and standard errors for each variable, with some coefficients being statistically significant. The table has 455940 observations and R-squared values of 0.3972 for ln(Exit) and 0.5516 for ln(Entry).
Note: Columns (1) and (2) are the regression results from estimating equations (11) and (12). The sample ranges from 2013 to 2022. All continuous variables are log transformed. Robust standard errors are clustered at the industry-year level and are reported in the parentheses. *** p < 0.01, ** p < 0.05, * p < 0.1.
Impact of the PDPS on firm entry and exit: first stage of IV estimates

Table 4 Long description
The table presents the results of the impact of the PDPS on firm entry and exit based on the first stage of IV estimates. It includes four columns with different variables related to enforcement and ventilation. The table has 398844 observations and includes year and industry-county fixed effects. The F-test values for the columns are 17.46, 18.99, 22.00, and 21.47 respectively. The table shows coefficients and standard errors for various interactions between PDPS, ventilation, and enforcement variables.
Note: Columns (1) – (4) are the regression results from IV first stage regressions. The sample ranges from 2013 to 2021 due to data limitation. All continuous variables are log transformed. Robust standard errors are clustered at the industry-year level and are reported in the parentheses. *** p < 0.01, ** p < 0.05, * p < 0.1.
Impact of the PDPS on firm entry and exit: second stage of IV estimates

Table 5 Long description
The table presents the results of the impact of the PDPS on firm entry and exit based on OLS estimates. It includes two main columns labeled ln Exit and ln Entry, with various rows showing different variables and their respective coefficients. The variables include PDPS, PDPS times ln Enforcement, PDPS times ln Enforcement prime, ln Enforcement, and ln Enforcement prime. Each variable has corresponding coefficients and standard errors listed below them. The table also indicates the inclusion of year fixed effects and industry-county fixed effects, with a total of 398844 observations. Notable trends include significant negative impact of PDPS on firm entry and significant positive impact of ln Enforcement prime on firm exit.
Note: Columns (1) and (2) are the regression results from IV second stage regressions. The sample ranges from 2013 to 2021 due to data limitation. All continuous variables are log transformed. Robust standard errors are clustered at the industry-year level and are reported in the parentheses. *** p < 0.01, ** p < 0.05, * p < 0.1.
Column (2) reveals that before the implementation of the PDPS, a one percent increase in local penalty cases is associated with a 0.808% increase in firm entries. This suggests that, prior to the PDPS, firms are more likely to enter markets with higher environmental penalties, as these markets are often associated with more developed regions characterized by greater opportunities, higher economic activity, and stronger market demand (Liu, Reference Liu2009). Following the implementation of the PDPS, new firm entries decrease by 0.826% for an additional one percent increase in local penalty cases, indicating that the policy generated a deterrent effect of environmental regulation by increasing compliance costs and regulatory uncertainty for new entrants. Further, we observe that a one percent increase of regulation enforcement in neighboring regions correlates with an average increase of 2.255% in firm entries into the local county after PDPS implementation. This suggests that firms respond strategically to variations in enforcement intensity, locating to areas with comparatively lower regulatory stringency to minimize compliance costs. These results can also be interpreted in absolute terms, where each additional environmental penalty case in the local or neighboring region decreases the impact of the PDPS on firm entry by 0.25 or increases it by 0.66, respectively.Footnote 7 , Footnote 8 These empirical findings align well with our theoretical assumption that firms in the food processing industry may have an incentive to circumvent the PDPS policy by locating to regions with lower compliance costs. Moreover, they are in line with previous literature discussing the relationship between environmental regulation and firm entry and exit (Biørn et al., Reference Biørn, Golombek and Raknerud1998; Yang et al., Reference Yang, Yuan, Yang and Patino-Echeverri2021; Zhu et al. Reference Zhu, He and Liu2014).
6.2. Impact of the PDPS on firm innovation
To explore the direct impact of the PDPS on firm innovation, we show the estimation results based on Equation (13) in Table 6. Column (1) indicates that the implementation of the PDPS has a negative effect on firm innovation, but the coefficient is statistically insignificant. Similar results can also be found in columns (2) and (3) when using different fixed effects. These findings align well with our conceptual framework and the discussion of Equation (3), which posits that the direct impact of the PDPS on firm innovation is uncertain upon firm specific characteristics.
Impact of the PDPS on firm innovation

Table 6 Long description
The table presents the estimation results of the impact of the PDPS on firm innovation, based on Equation 13. It includes three columns labeled (1), (2), and (3), each showing the coefficient for the variable Treat and its standard error. The table also indicates the inclusion of firm fixed effects, year fixed effects, age fixed effects, year trends, and age trends. The number of observations is 244393, and the R-squared values are 0.2911, 0.2859, and 0.2872 for columns (1), (2), and (3) respectively. Column (1) shows a negative but statistically insignificant effect of the PDPS on firm innovation. Columns (2) and (3) present similar results with different fixed effects.
Note: Columns (1) - (3) are the regression results from estimating equation (13). The sample ranges from 2013 to 2022. All dependent variables are log transformed. Robust standard errors are clustered at the industry-year level and are reported in the parentheses. *** p < 0.01, ** p < 0.05, * p < 0.1.
As outlined in the empirical strategy section, firm age is a critical factor influencing innovation capacity. Consequently, we further investigate the impact of the PDPS on sub-groups categorized by firm age in Equation (15).
 $$ln\left({Patent}\right)_{ith} =\lambda _{0}+\sum _{s=1}^{31}\lambda _{s}\left({Treated}_{ith}\times Age_{h}^{s}\right)+\mu _{i}+\omega _{t}+\tau _{h}+\upsilon _{ith}$$
where Age h s equals 1 if firm age is s and 0 otherwise.Footnote 9 Figure 2 demonstrates how the impact of the PDPS on innovation varies with firm age. Notably, the PDPS significantly enhances innovation for newly established firms aged 2 to 5 years, possibly due to an agglomeration effect stemming from firms’ skirting strategy. Specifically, younger firms tend to locate in regions with weaker regulatory enforcement, which facilitates technology spillovers among firms in the same region and enhances innovation benefits.Footnote 10 Conversely, medium-aged firms (8 to 11 years old) often experience a negative impact from the PDPS, as they may lack the innovation drive and face sunk costs of establishment, making it difficult to exit the market or relocate to circumvent regulations. Older firms, typically more resilient and equipped with stable innovation capabilities and market power, appear largely unaffected by the PDPS regulation.
Dynamic effects of the PDPS on firm innovation by firm age. Note: each dot denotes the point estimation of interaction terms across different firm ages. Each vertical line with a cap represents the 95% confidence interval of the effect.

Figure 2 Long description
A line graph titled 'Dynamic effects of the PDPS on firm innovation by firm age' displays the relationship between firm age and the effects of the PDPS on firm innovation. The x-axis represents firm age, ranging from 1 to 31 years, while the y-axis represents the effects of the PDPS on firm innovation, ranging from -0.1 to 0.3. Each dot on the graph denotes the point estimation of interaction terms across different firm ages. Vertical lines with caps extending from each dot represent the 95% confidence interval of the effect. The graph shows variations in the effects of the PDPS on firm innovation across different ages, with some ages showing positive effects and others showing negative effects. The confidence intervals vary in length, indicating the uncertainty of the estimates. All values are approximated.
6.3. Mechanism analysis
To validate the assumption that a positive impact of the PDPS on innovation stems from the regional agglomeration, we conduct the mechanism analysis based on Equation (14). Table 7 presents findings on the influence of agglomeration on firm innovation under the PDPS. Specifically, columns (1) to (3) detail the effects at varying radii of agglomeration – 5 km, 10 km, and 15 km – illustrating the spatial extent of agglomeration’s impact on innovation. Column (1) shows that the effect of agglomeration is significantly positive but moderate at a 5-kilometer radius. In contrast, at 10- and 15-kilometer distances, the effects become stronger and remain statistically significant. Specifically, column (2) shows that after the implementation of the PDPS, relative to the pre-policy period, a one percent increase in firm numbers within a 10-kilometer radius leads to an average increase of 0.0104% in firms’ patent applications. When expanding the radius to 15 km, a similar and robust estimate of 0.0122% is reported in column (3).
Impact of the agglomeration effect on firm innovation

Table 7 Long description
The table presents data on the impact of agglomeration on firm innovation under the PDPS, with columns detailing effects at 5 km, 10 km, and 15 km radii. The first row shows the effect of treatment on the natural logarithm of patents, with varying significance levels across columns. The second row shows the interaction between treatment and the natural logarithm of agglomeration at 5 km, 10 km, and 15 km radii, indicating positive and significant effects at larger radii. The third row shows the interaction between treatment and the natural logarithm of agglomeration for the 5 km to 10 km range, also indicating a positive and significant effect. The fourth row shows the effect of the natural logarithm of agglomeration at 5 km, 10 km, and 15 km radii, with varying levels of significance. The table includes firm fixed effects, year fixed effects, and age fixed effects, with observations totaling 244,393 and an R-squared value of approximately 0.2912.
Note: Columns (1) - (4) are the regression results from estimating equation (14). In column (1)–(3), we calculate firm number within each firm’s geographically spherical distance of 5 km, 10 km, and 15 km, respectively. In column (4), we further calculate firm number between 5 km and 10 km. The sample ranges from 2013 to 2022. All continuous variables are log transformed. Robust standard errors are clustered at the industry-year level and are reported in the parentheses. *** p < 0.01, ** p < 0.05, * p < 0.1.
We attribute the moderate coefficient at the 5-kilometer radius to the competitive effect, as firms located in close proximity within the same industry are likely to compete for resources, thereby stifling knowledge sharing and innovation. If this hypothesis is right, then the positive effect of agglomeration between 5 km and 10 km should be larger than that observed at 10 km while remaining statistically significant. To test this hypothesis, we examine firm concentration within the 5- to 10-kilometer range. As shown in column (4), a one percent increase in the number of firms within this range results in an average increase of 0.0138% in firms’ patent applications, the highest among all estimates. This finding aligns with existing literature that identifies pronounced agglomeration benefits within this 5- to 10-kilometer distance range (Aharonson et al., Reference Aharonson, Baum and Feldman2007; Hoogstra and Van Dijk, Reference Hoogstra and Van Dijk2004). Following previous literature, we use the 10-kilometer estimate for further analysis in the following sections (Hailu and James Deaton Reference Hailu and James Deaton2016; Hoogstra and Van Dijk, Reference Hoogstra and Van Dijk2004).
6.4. Robustness checks
We conduct several robustness checks to test the stability of the mechanism estimates, including two alternative measures of innovation and alternative model specifications. Table 8 summarizes the estimated coefficients for the robustness regressions. First, we use one-year and two-year forwards of the patent variable, as firms typically take more time to invest before applying for a patent (Cui et al., Reference Cui, Huang and Wang2023). Columns (1) and (2) shows the coefficients are robust and consistent across the models using forwarded measures. Second, we apply Poisson models and use count data for both the patent variable and agglomeration variable. Column (3) and column (4) estimate Poisson models with two different fixed effects. Column (5) provides results using the Poisson Pseudo-Maximum Likelihood (PPML) model, which efficiently handles high-dimensional fixed effects. The positive and statistically significant estimates across columns (3) to (5) further strengthen the empirical robustness of our findings.Footnote 11
Robustness checks

Table 8 Long description
The table presents estimated coefficients for robustness regressions, testing the stability of mechanism estimates with alternative measures of innovation and model specifications. It includes columns for different models: F1, F2, Poisson, Poisson with different fixed effects, and Poisson Pseudo-Maximum Likelihood (PPML). The table has five columns labeled (1) to (5) and several rows with variables such as Treat, Treat times the natural log of Agglomeration, Treat times Agglomeration, the natural log of Agglomeration, and Agglomeration. Each cell contains coefficient values with standard errors in parentheses. The table also indicates the inclusion of firm fixed effects, year fixed effects, and age fixed effects, along with the number of observations and R-squared values for each model. Notable trends include the robustness and consistency of coefficients across different models and the positive, statistically significant estimates in columns (3) to (5), which strengthen the empirical robustness of the findings.
Note: This table summarizes the regression results of different robustness checks for mechanism analysis. In column (1) and (2), we report estimates using one-year lead and two-year lead of patent application taking logarithm as dependent variables. Column (3) and (4) estimates fixed-effect Poisson model that uses different fixed effects. Column (5) reports the estimate of a multidimensional fixed effect Poisson model, where all fixed effects in mechanism analysis are included. For columns (1)–(2), standard errors in parentheses are clustered at the industry-year level. *** p < 0.01, ** p < 0.05, * p < 0.1.
6.5. Heterogeneity in effects
Initially, we show that the agglomeration effect plays a role in regions with weaker environmental enforcement. Then we account for firm heterogeneity, suggesting which firms with specific characteristics would benefit more from the agglomeration effect.
6.5.1. Region heterogeneity
We divide the sample into two groups by the average county-level environmental penalty cases, say, regions with higher environmental regulation enforcement and regions with lower environmental regulation enforcement.Footnote 12 As shown in Table 9, we investigate the agglomeration effect in these two sub-samples respectively. In column (1), we find a statistically insignificant estimate of the agglomeration effect in regions with high enforcement. In contrast, the coefficient remains positive and statistically significant in regions with low enforcement. These results are in line with our previous assumption, suggesting that as more firms choose to skirt the policy and locate in low-enforcement region to obtain the PDPS permit, such skirting behavior increases firm innovation.
Heterogeneous agglomeration effects by regions

Table 9 Long description
The table presents a comparison of agglomeration effects in regions with high and low environmental regulation enforcement. It includes data for two subsamples: regions with high enforcement and regions with low enforcement. The table has four rows and three columns, with column headers labeled as Treat, Treat times the natural log of Agglomeration, and the natural log of Agglomeration. The rows are labeled with these headers and include corresponding values and standard errors in parentheses. The table also indicates the inclusion of firm fixed effects, year fixed effects, and age fixed effects, along with the number of observations and R-squared values for each subsample. Notable trends include a statistically insignificant estimate of the agglomeration effect in regions with high enforcement and a positive, statistically significant coefficient in regions with low enforcement.
Note: This table explores the heterogeneity of region by breaking down the mechanism analysis result. The cutoff of subsamples is calculated based on the mean value of county-level environmental penalty cases in the sample. “Regions with high (low) enforcement” denotes firms locate in county where environmental penalty cases are above (below) the cutoff. We test difference in coefficient Treat×ln(Agglomeration) between the two groups by computing bootstrap and permutation test and report the difference p-value in the table. Robust standard errors are clustered at the industry-year level and are reported in the parentheses. *** p < 0.01, ** p < 0.05, * p < 0.1.
6.5.2. Firm heterogeneity
To account for firm heterogeneity, we categorize firms by capital size, ownership, and industry category. Table 10 summarizes the estimated coefficients for the agglomeration effect on firm innovation while incorporating firm heterogeneity.
Heterogeneous agglomeration effects by firm characteristics

Table 10 Long description
The table presents estimated coefficients for the agglomeration effect on firm innovation, accounting for firm heterogeneity. It includes three columns of coefficients for the natural logarithm of patents, with different variables and interactions. The rows detail various factors such as treatment, interactions of treatment with agglomeration and capital, ownership, and industry categories. The table also includes fixed effects for firms, years, and ages, along with the number of observations and R-squared values.
Note: Each column denotes a separate regression. In column (1), Capital represents the amount of firm’s initial capital when establishing. In column (2), firms in the food processing industry are classified into two groups, foreign-owned firms and domestic-owned firms. In column (3), firms are divided into three groups according to their belonging industry. Industry1–3 represent two-digit industries, including agricultural and sideline food processing industry, food manufacturing industry, and alcoholic, beverage and tea manufacturing industry, respectively. Observation numbers are different due to the missing value of Capital. Robust standard errors are clustered at the industry-year level and are reported in the parentheses. *** p < 0.01, ** p < 0.05, * p < 0.1.
Capital Size
Firms with different capital sizes may respond differently to the PDPS policy regarding innovation. Existing literature discusses the relationship between firm capital size and innovation (Hirukawa and Ueda, Reference Hirukawa and Ueda2011; Kortum and Lerner, Reference Kortum and Lerner1998). On the one hand, firms with larger capital reserves may have greater innovation capabilities due to their ability to invest more in research and development and acquire advanced technologies. On the other hand, smaller firms might be more agile and willing to take risks, leading to breakthrough innovations despite having fewer financial resources.
To investigate how firm capital size influences the agglomeration effect, we interact the logarithmic form of time-invariant registered capital with the policy and agglomeration interaction term from the previous mechanism analysis. Column (1) of Table 10 shows that firms with larger capital tend to innovate more, as they benefit from knowledge spillovers in regions with greater agglomeration. Specifically, one percent increase in firm initial capital leads to a 0.003% increase in patent applications driven by the agglomeration effect.
Ownership
Due to differences in access to subsidies, technology levels, operating objectives, and information efficiency (Yang et al., Reference Yang, Wen and Li2025), firms with different ownership may respond differently to the PDPS policy. Previous study indicates that foreign affiliates are more likely to channel knowledge through innovation cooperation (Srholec, Reference Srholec2009). This implies a larger benefit may be obtained by foreign-owned firm through agglomeration effects. To examine this heterogeneity, we categorize firms into two groups – foreign-owned and domestic-owned – based on ownership information from the CCAD dataset. Column (2) in Table 10 shows that the coefficient of the interaction term for foreign-owned firms is larger than that for domestic firms, indicating that foreign-owned firms are more innovative as they adapt to the agglomeration dynamics induced by the policy reforms.
Industry
Our sample consists of three two-digit industries: agricultural and sideline food processing, food manufacturing, and alcoholic, beverage and tea manufacturing. According to the Report on the Second National Census of Polluting Source issued by the Ministry of Environment Protection in 2020, the three industries produce varying levels of pollution. For example, the agricultural and sideline food processing industry is the largest phosphorus emission industry among all industries in China and the second-largest industry of ammonia and nitrogen emission. The food manufacturing industry ranks third in phosphorus emissions. In contrast, alcoholic, beverage and tea manufacturing industry shows lower levels of pollution in the report and does not rank high in any pollution category.
Firms would undertake different levels of policy compliance costs when they are naturally engaged in industries with high or low pollution, thus influencing their entry and exit decisions and innovation. We interact industry dummy variables with the policy and agglomeration terms in column (3). The results show the agglomeration effect generates a significant impact on the agricultural and sideline food processing industry and the food manufacturing industry – both of which have high pollution levels – but has no significant effect on the alcoholic, beverage and tea manufacturing. This finding is in line with our research motivation, as firms in low-pollution industries may be less influenced by the PDPS policy. Consequently, their entry and exit decisions remain largely unchanged, and the agglomeration effect does not significantly contribute to innovation in these industries.
7. Conclusion and policy implications
The development of the food processing industry is crucial not only for stabilizing food prices and addressing food insecurity but also for contributing to a more resilient and productive global food system (Chen et al., Reference Chen, Khanna and Yang2022; Polopolus and Wershow, Reference Polopolus and Wershow1978; Shashi et al., Reference Shashi and Shabani2017; Yao and Fu, Reference Yao and Fu2025). While extensive studies have examined the impact of environmental regulations on heavily polluting industries like steel and chemicals, little attention has been given to the food processing industry, despite its growing association with sustainability pressures and environmental challenges (Daniel et al., Reference Daniel, Secor and Campbell2023). Our paper contributes to the ongoing discussion on how sustainability policies shape agribusiness strategies and technological development.
One common concern in agribusiness sustainability is whether environmental regulations impose excessive compliance costs, potentially limiting firm productivity and innovation, or how agribusiness firms respond to emerging environmental regulations. Our findings challenge this conventional view by demonstrating that sustainability and environmental regulations can coexist with the growth of agribusiness. We show firms actively adapt to regulatory pressures through strategic skirting behavior, shifting operations to regions with lower compliance costs. While this could potentially undermine the effectiveness of sustainability policies, our findings reveal an unintended benefit: agglomeration-driven innovation. Agribusinesses locating in areas with lower regulatory enforcement tend to cluster together, which enhances knowledge spillovers and innovation capacity. In our heterogeneity analysis, we show that foreign-owned and capital-intensive firms innovate more, as they derive greater benefits from knowledge spillovers in regions with agglomeration.
This suggests that to effectively anticipate and manage strategic firm responses to environmental regulations, policymakers should consider several targeted measures. First, regions with stringent environmental regulations should implement targeted policies to support agribusiness firms in achieving compliance. These regions could offer financial incentives, tax breaks, or subsidized R&D facilities to firms adopting sustainable practices, ensuring that compliance does not become a barrier to market entry. Additionally, stricter regions could receive additional government support for technology adoption, such as low-interest green loans and direct subsidies for cleaner production methods, helping firms transition toward sustainable operations without compromising their competitiveness.
Furthermore, policy coordination between regions is crucial to prevent excessive regulatory arbitrage. Governments could design inter-regional sustainability agreements to create a balanced regulatory environment while maintaining the benefits of firm agglomeration. For example, provinces or counties with lenient enforcement could be required to implement baseline environmental standards while simultaneously benefiting from incentives for attracting innovative agribusiness firms from neighboring regions. In addition, policymakers should strengthen data transparency and monitoring systems in regions with more lenient enforcement to track firms’ environmental impact. Implementing real-time pollution monitoring, cross-regional data-sharing platforms, and performance-based financial incentives can help ensure that firms locating to less-regulated areas do not contribute to long-term environmental degradation.
Recognizing that foreign-owned firms and capital-intensive businesses are more likely to benefit from the agglomeration effect, policymakers could introduce differentiated policy frameworks to support smallholder and domestic agri-food firms in adapting to sustainability regulations. Providing targeted financial assistance, technical support, and access to green technology incentives could help level the playing field, ensuring that smaller agribusiness firms are not disproportionately burdened by compliance costs while still encouraging sustainable industry practices.
While this study reveals several findings, some limitations should be noted. First, since the PDPS was first launched in 2016, this paper can only provide insights based on a short-term perspective and should not be interpreted as an endorsement of uneven environmental regulation. It is unclear whether these effects will persist over time and how they may evolve in the long term. Second, due to data constraints, this study is unable to examine firms’ relocation decisions. Directly observing firm relocation would significantly enhance the understanding of the relationship between location choices and agglomeration dynamics, thereby strengthening the linkage between the skirting strategy and innovation induced by policy-driven agglomeration. Moreover, the available database does not include information on awards, quality, or citations of patents, which limits the analysis of these dimensions of innovation in the food processing industry. These could be important topics for future research when more data becomes available.
Supplementary material
The supplementary material for this article can be found at https://doi.org/10.1017/aae.2026.10036.
Data availability statement
The data used in this study are from the restricted-access Qiyan China Agri-research Database (CCAD). The authors do not have permission to publicly share the data or provide access to third parties.
Author contribution
Conceptualization, F.S., X.K., P.H., H.Q.; Methodology, F.S., X.K., P.H.; Formal Analysis, F.S., X.K., P.H.; Data Curation, F.S., P.H.; Writing – Original Draft, F.S., X.K., Writing – Review and Editing, F.S., X.K., P.H., H.Q.; Supervision, X.K. and H.Q.
Financial support
This project was supported by the National Natural Science Foundation of China (Grant Nos. 72561147285 and 72141307).
Competing interests
The authors declare no competing interests. We confirm that the submitted manuscript is original research conducted by us, has not been previously published, and is not currently being considered for publication elsewhere. We also confirm that there are no other persons who satisfied the criteria for authorship but are not listed. We further confirm that we have given due consideration to the protection of intellectual property associated with this work and that there are no impediments to publication, including the timing of publication, concerning intellectual property.
AI disclosure statement
Artificial intelligence tools were used only for proofreading purposes. No AI tools were involved in the research design, data analysis, or the writing of this manuscript.


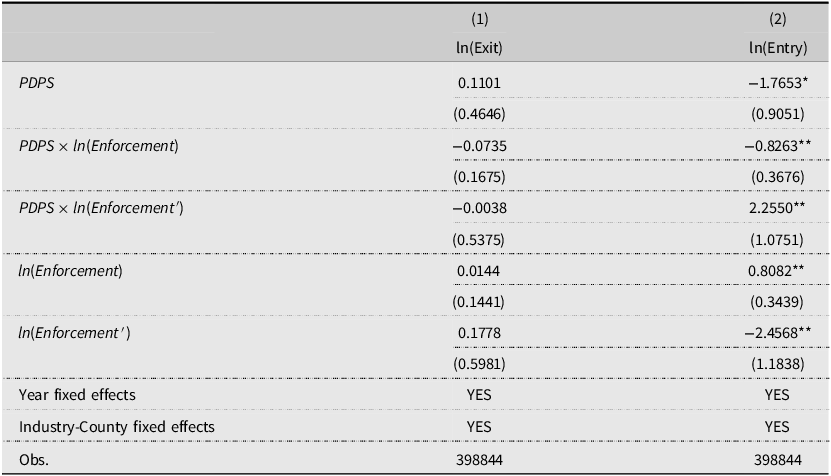
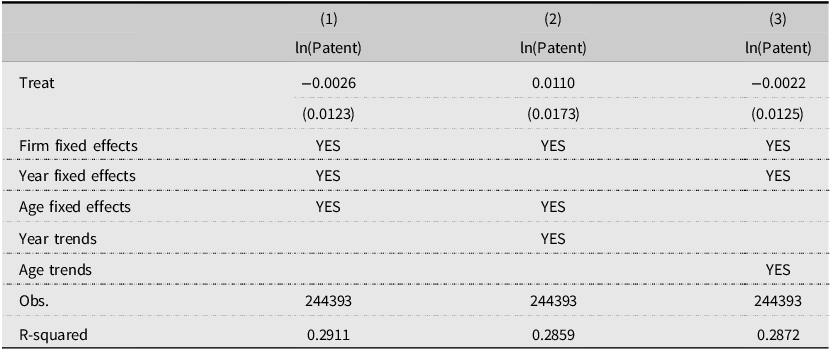
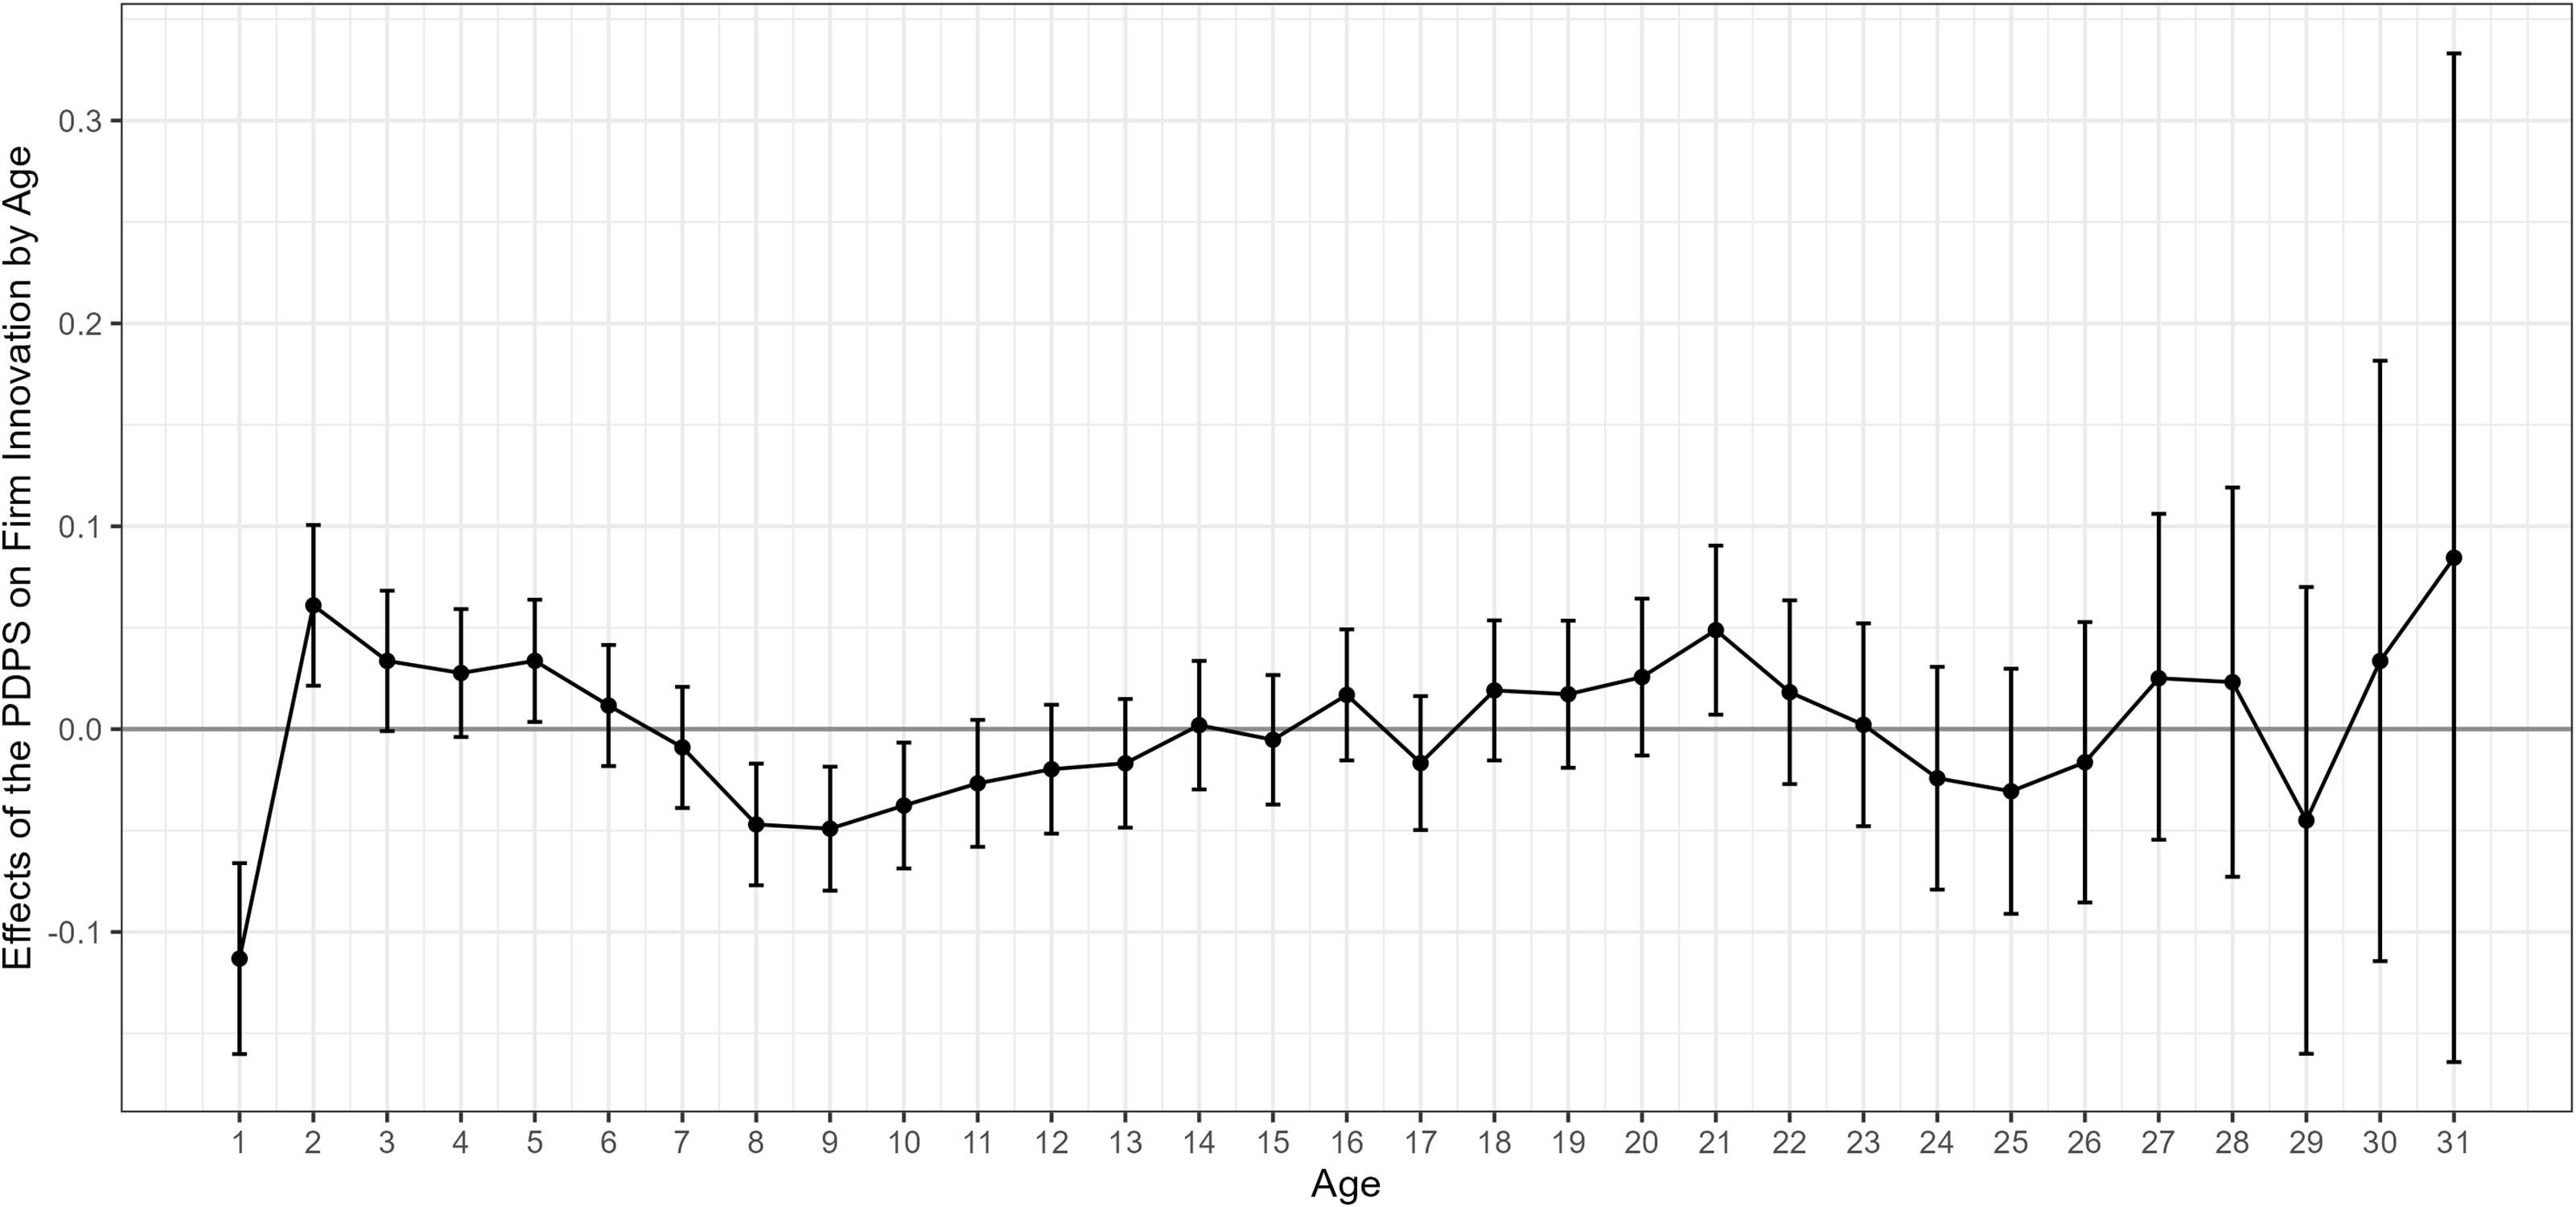
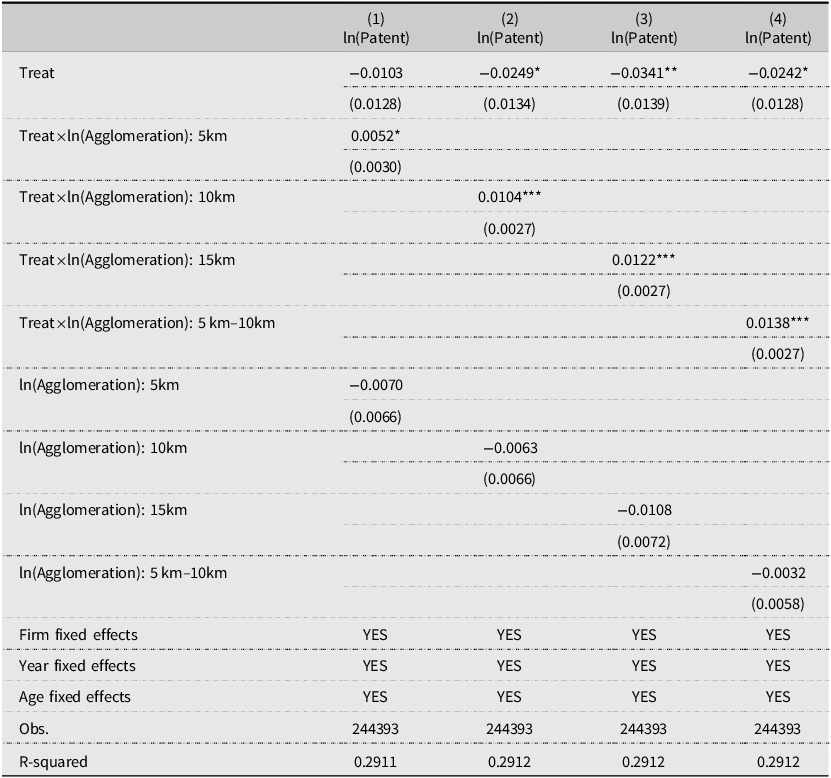
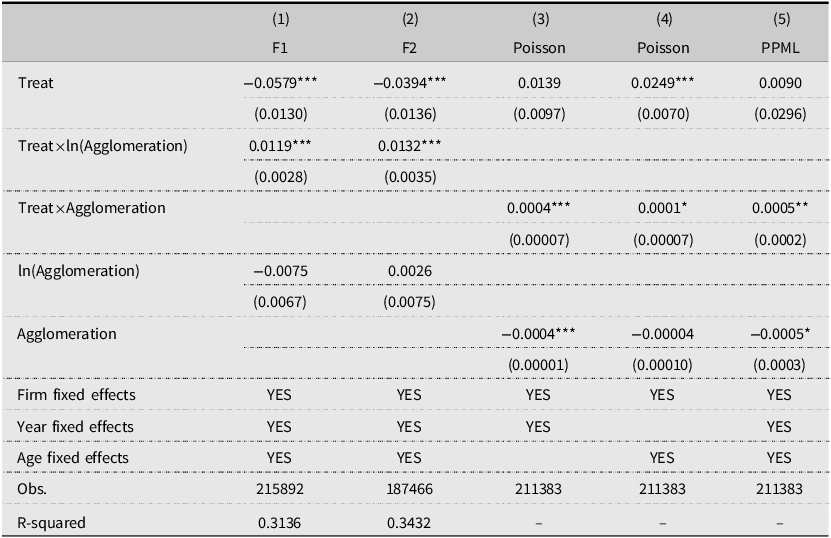
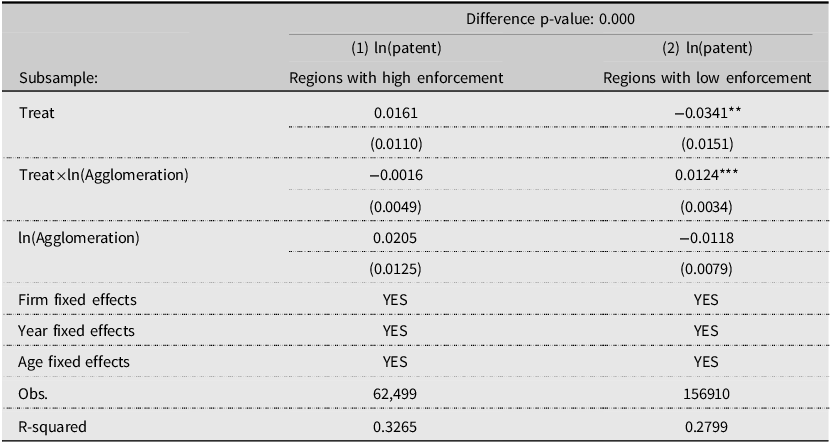
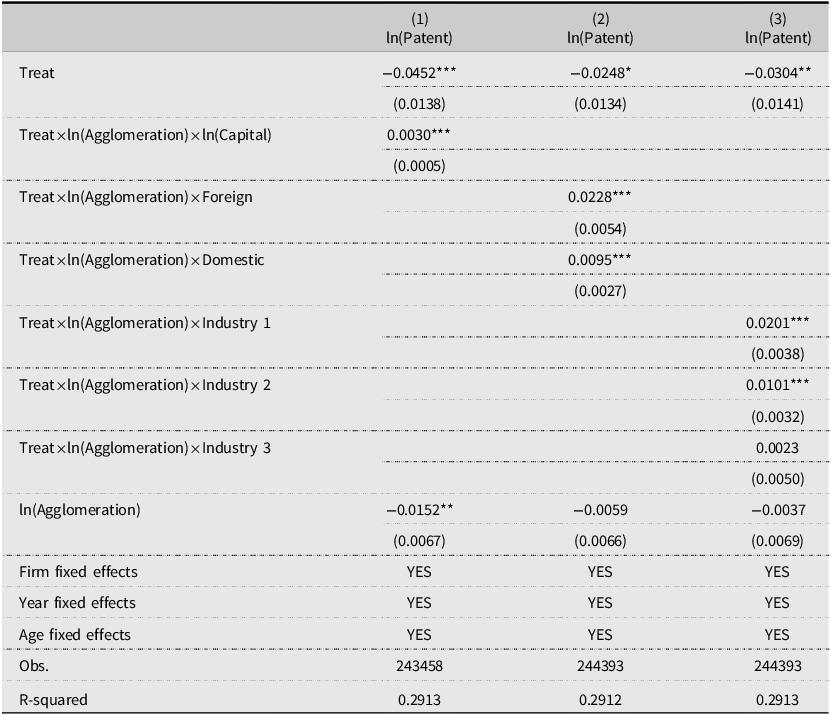


 Open access