


Impact Statement
Drag reduction of superhydrophobic (SHPo) surfaces has been studied for over two decades due to its global-scale impact. Despite many successes in numerical simulations and water tunnel experiments, success in experiments of high-speed flows on open water (i.e. not water tunnel) was reported only recently. While the reduction was large (i.e. ~30 %), unfortunately the results did not show a clear trend due to the difficulties in (i) controlling flows under a speeding boat on ocean water and (ii) maintaining a pinned plastron in the high-speed flows of a towing tank. This manuscript develops and tests SHPo surfaces that can retain a pinned plastron under a 4 m long motorboat, which is revamped to maintain controlled flows up to 14 knots. A clear trend of drag reduction under field conditions is reported for the first time, indicating the possibility of predictably designing drag-reducing SHPo surfaces for real applications.
1. Introduction
Superhydrophobic (SHPo) surfaces, which may be able to capture a thin air layer underwater called a plastron (Reference BrocherBrocher 1912), have been studied intensively since around 2000, most notably due to their potential drag-reducing ability for water vessels (Reference Barrat and BocquetBarrat & Bocquet 1999; Reference Watanabe, Udagawa and UdagawaWatanabe, Udagawa & Udagawa 1999; Reference Choi, Westin and BreuerChoi, Westin & Breuer 2003; Reference Ou, Perot and RothsteinOu, Perot & Rothstein 2004; Reference Choi, Ulmanella, Kim, Ho and KimChoi et al. 2006). However, despite many reports of successful drag reduction in both laminar (Reference Ou, Perot and RothsteinOu et al. 2004; Reference Choi, Ulmanella, Kim, Ho and KimChoi et al. 2006; Reference Davies, Maynes, Webb and WoolfordDavies et al. 2006; Reference Maynes, Jeffs, Woolford and WebbMaynes et al. 2007; Reference Byun, Kim, Ko and ParkByun et al. 2008; Reference Maali, Pan, Bhushan and CharlaixMaali et al. 2012) and turbulent (Reference Daniello, Waterhouse and RothsteinDaniello, Waterhouse & Rothstein 2009; Reference Park, Sun and KimPark, Sun & Kim 2014; Reference Srinivasan, Kleingartner, Gilbert, Cohen, Milne and MckinleySrinivasan et al. 2015; Reference Gose, Golovin, Boban, Mabry, Tuteja, Perlin and CeccioGose et al. 2018; Reference Abu Rowin and GhaemiAbu Rowin & Ghaemi 2020; Reference Li, Ji, Tan, Li, Xiang, Lv and DuanLi et al. 2020) flows in laboratory settings and laminar flows on the open water (Reference Dong, Cheng, Zhang, Wei and ShiDong et al. 2013; Reference Cheng, Song, Dong and ShiCheng et al. 2015; Reference Zhang, Ouyang, Li, Gao, Han, Liu and WeiZhang et al. 2015), similar success in fully turbulent flows on the open water, which represents typical watercraft, has long been elusive until very recently (Reference Xu, Grabowski, Yu, Kerezyte, Lee, Pfeifer and KimXu et al. 2020b, Reference Xu, Yu, Kim and Kim2021). Building on these first successes and leveraging a pair of other advancements (Reference Yu, Kiani, Xu and KimYu et al. 2021, Reference Yu, Li, Mcclelland, del Campo Melchor, Lee, Lee and Kim2023), in this paper we (i) develop high-performance SHPo surfaces, (ii) expand the range of boat speed, (iii) enhance the control of flow conditions under the boat and (iv) distinguish the pinned (including the slightly depinned) plastron from the depinned state during the flow tests. These advancements improved the repeatability of experimental results significantly and led us to a clear and quantitative trend of how the drag reduction increases with the flow speed of a motorboat in the natural sea environment.
Friction drag reduction with SHPo surfaces has been analytically predictable (Reference Lauga and StoneLauga & Stone 2003; Reference Ybert, Barentin, Cottin-Bizonne, Joseph and BocquetYbert et al. 2007) and experimentally verifiable (Reference Lee, Choi and KimLee, Choi & Kim 2008) for laminar flows, but the same has not been true for turbulent flows. While numerical studies have consistently reported a successful drag reduction, which comes from the streamwise effective slip velocity on the air–water interface and mitigation of turbulent structures in the near-wall region (Reference Min and KimMin & Kim 2004; Reference Fukagata, Kasagi and KoumoutsakosFukagata, Kasagi & Koumoutsakos 2006; Reference Park, Park and KimPark, Park & Kim 2013; Reference Rastegari and AkhavanRastegari & Akhavan 2018), experimental results have long been inconsistent and controversial until the mid-2010s mainly because, looking back, the status of the plastron was not known or accounted for. Consistent drag reduction has been observed when a plastron was found to persist on the SHPo surface (Reference Park, Sun and KimPark et al. 2014; Reference Srinivasan, Kleingartner, Gilbert, Cohen, Milne and MckinleySrinivasan et al. 2015; Reference Abu Rowin and GhaemiAbu Rowin & Ghaemi 2020; Reference Li, Ji, Tan, Li, Xiang, Lv and DuanLi et al. 2020; Reference Xu, Grabowski, Yu, Kerezyte, Lee, Pfeifer and KimXu et al. 2020b, Reference Xu, Yu, Kim and Kim2021), while less drag reduction or even drag increase has been reported when the plastron was found to be depleted (Reference Aljallis, Sarshar, Datla, Sikka, Jones and ChoiAljallis et al. 2013; Reference Gose, Golovin, Boban, Tobelmann, Callison, Barros, Schultz, Tuteja, Perlin and CeccioGose et al. 2021). For high-shear turbulent flows, until very recently, all the successful drag-reduction experiments were conducted in closed water, such as with the Taylor–Couette apparatus (Reference Srinivasan, Kleingartner, Gilbert, Cohen, Milne and MckinleySrinivasan et al. 2015; Reference Hu, Wen, Bao, Jia, Song, Song, Pan, Scaraggi, Dini and XueHu et al. 2017) and water tunnels (Reference Park, Sun and KimPark et al. 2014; Reference Gose, Golovin, Boban, Mabry, Tuteja, Perlin and CeccioGose et al. 2018; Reference Abu Rowin and GhaemiAbu Rowin & Ghaemi 2020; Reference Li, Ji, Tan, Li, Xiang, Lv and DuanLi et al. 2020), with the only experimental study conducted in open water (done in a towing tank) reporting a drag increase (Reference Aljallis, Sarshar, Datla, Sikka, Jones and ChoiAljallis et al. 2013). The first successful drag reduction with highly turbulent flows in open water was reported by Reference Xu, Grabowski, Yu, Kerezyte, Lee, Pfeifer and KimXu et al. (2020b) using a 4 m long motorboat that could reach ~5 m s−1. Using a 4 cm × 7 cm sized SHPo surface covered with longitudinal micro-trenches, approximately 30 % (up to 40 %) drag reduction was reported with friction Reynolds numbers up to Reτo ~ 5800, where  $R{e_{\tau o}} = \delta \sqrt {{\tau _o}/\rho } /\nu $, δ is the boundary layer thickness, τo is the wall shear stress of a smooth (i.e. no-slip) surface, ρ is the density of water and ν is the kinematic viscosity of water. Subsequently, similar SHPo surfaces were used to obtain up to 27 % drag reduction at 7 m s−1 or Reτo ~ 4400 in a towing tank, but the drag reduction deteriorated at higher speeds (tested up to ~10 m s−1 or Reτo ~ 5700) (Reference Xu, Yu, Kim and KimXu et al. 2021). While the plastron was observed at all speeds in the boat experiments (Reference Xu, Grabowski, Yu, Kerezyte, Lee, Pfeifer and KimXu et al. 2020b), the plastron was depleted on portions of the sample surface along with deteriorated drag reduction at high speeds in the towing tank experiments (Reference Xu, Yu, Kim and KimXu et al. 2021).
Because of the plastron's central role in SHPo drag reduction, it is worth noting that the plastron can assume various states on given surface asperities, as detailed in Reference Park, Choi and KimPark, Choi & Kim (2021). However, for the current study, which focuses on longitudinal trench SHPo surfaces, the discussion can be simplified to one micro-trench, as illustrated in figure 1(a). The air trapped in the trench is sheared by the water flow and circulated inside the plastron, creating a pressure gradient along the trench. Following the model for the air loss from SHPo surfaces including the effects of hydrostatic pressure, water flow shear and air diffusion by Reference Yu, Li, Mcclelland, del Campo Melchor, Lee, Lee and KimYu et al. (2023), figure 1(b–g) lists the states of a plastron along a trench with length, L, which is larger than the steady-state plastron length, Lss. In this study, the longitudinal trenches are designed to maximize the pinned states, and drag reduction was measured only while the plastron is pinned (figure 1d–f) over the entire length of the trench, i.e. Lss > L. Note that the depinned-in state with slight depinning, chosen to be h/w < 0.14 here, is considered to be a part of the pinned-concave state (figure 1d) in the current study, where h is water intrusion depth, and w is trench width, as shown in figure 1(c). The effect of h/w on drag reduction will be discussed in the next section.
The states of plastron illustrated for a hydrophobic micro-trench moving longitudinally under water. (a) If the trench is longer than the steady-state plastron length, i.e. L > Lss, the trench would be wetted over the extra length at the leading end. Cross-sectional views of the trench at several length locations are shown in (b–f). (b) Fully wetted state with no plastron. (c) Depinned-in state, i.e. the contact line inside the trench, with intrusion depth h. (d) Pinned-concave state, i.e. the interface pinned and deformed inwardly. (e) Pinned-flat state, i.e. the interface pinned and flat. (f) Pinned-convex state, i.e. the interface pinned and deformed outwardly. (g) Depinned-out state, i.e. the contact line outside the trench, which may proceed to an overgrown plastron. The trench SHPo surfaces used in this study are designed to maintain a pinned state, i.e. (d–f), over the entire trench length throughout the drag-reduction experiments.

To find a drag-reducing trend with SHPo surfaces over a range of flow speeds in field tests, one would need SHPo surfaces that maintain a pinned (including a slightly depinned) plastron for most of the challenging flow conditions. Such a high-performance SHPo surface was recently developed and confirmed to maintain an acceptable plastron under the motorboat even at high speeds (up to 7.2 m s−1 or 14 knots) (Reference Yu, Li, Mcclelland, del Campo Melchor, Lee, Lee and KimYu et al. 2023). The development required: a theoretical estimation to predict the maximum trench length that can maintain a full plastron; a new microfabrication method to make micro-trenches with hierarchical roughness; and the implementation of a field-compatible observation method devised by Reference Yu, Kiani, Xu and KimYu et al. (2021), which can differentiate a pinned and a slightly depinned plastron from a substantially depinned and no plastron. In this paper, following the same microfabrication method of Reference Yu, Li, Mcclelland, del Campo Melchor, Lee, Lee and KimYu et al. (2023), we design a series of longitudinal trench SHPo surfaces with geometrical parameters that would allow the pinned (including the slightly depinned) plastron over the entire trench length up to the maximum shear rate (~69 000 s−1) imposed by the boat reaching 14 knots. Trench SHPo surfaces with different slip lengths are fabricated and tested to study the drag reduction free of the deteriorated plastron in open-water turbulent flows. Empowered by the high-performance SHPo surfaces that can maintain a pinned plastron, which is confirmable by the new observation method for the first time, over the entire trench length, we study the drag-reducing trend of SHPo surfaces underneath a motorboat on the natural sea. Improving the boat and test procedures, which led to more reliable drag ratio data over a wider range of boat speeds than the previous boat study (Reference Xu, Grabowski, Yu, Kerezyte, Lee, Pfeifer and KimXu et al. 2020b), we obtain a clear trend of drag ratio vs. slip length of SHPo surfaces expressed in wall units, where the drag ratio is defined as the ratio of shear stress on the SHPo surface, τ, to that on smooth surface, τo, under the same flow condition. While our main interest is in the drag reduction on longitudinal trench SHPo surfaces, we also test transverse trench and aligned post SHPo surfaces to see the effect of transverse slip on longitudinal drag reduction in turbulent flows.
2. The slip length for drag reduction
The amount of slip on a surface is quantified as a slip length, which is the virtual distance into the wall where the extrapolated flow velocity vanishes to zero, expressed as  $\lambda = {u_s}/(\partial u/\partial y){|_{wall}}$, where us is the slip velocity on the wall. For laminar flows, drag reduction can be calculated from the slip length, which is unique for a given SHPo surface, and the flow geometry imposed by a given flow system, such as Couette flow (Reference Choi, Ulmanella, Kim, Ho and KimChoi et al. 2006). On the other hand, in turbulent flows, drag reduction required numerical analysis for the asperities of a given SHPo surface and the given flow geometry by a given flow system (Reference Min and KimMin & Kim 2004; Reference Fukagata, Kasagi and KoumoutsakosFukagata et al. 2006; Reference Park, Park and KimPark et al. 2013; Reference Rastegari and AkhavanRastegari & Akhavan 2018). Also, note the drag reduction in turbulent flows is affected by the turbulent structures. While the drag in the flow direction is affected by the slip in only the flow direction for laminar flows, it is affected by the slips in both the streamwise and spanwise directions for turbulent flows, where the spanwise slip aggravates the turbulence (Reference Min and KimMin & Kim 2004; Reference Busse and SandhamBusse & Sandham 2012). Despite the lack of a direct relationship with the drag reduction in turbulent flows, the slip length of a slip surface is still the best indication to predict its drag-reducing ability, as a large longitudinal slip length would lead to a large drag reduction in the flow direction. For turbulent flows, much can be learned from the riblet-based drag reduction (Reference García-Mayoral and JiménezGarcía-Mayoral & Jiménez 2011; Reference LuchiniLuchini 2013; Reference Mele and TognacciniMele & Tognaccini 2018; Reference Wong, Camobreco, García-Mayoral, Hutchins and ChungWong et al. 2024), considering the similarities in how a surface slip leads to friction drag reduction; see, for example, Reference Rastegari and AkhavanRastegari & Akhavan (2018).
The slip length of SHPo surfaces with a regularly patterned roughness, including longitudinal trenches that tend to provide the largest drag reduction, have been analytically derived. For modelling, SHPo surfaces are usually assumed to have water–air interfaces that are flat, shear free (i.e. infinite slip) and pinned at the top edges of surface asperities. Furthermore, for trench SHPo surfaces, the trenches are assumed to be infinitely long with no ends. Assuming such ideal conditions, it was theoretically derived (Reference PhilipPhilip 1972; Reference Lauga and StoneLauga & Stone 2003) and experimentally proven (Reference Lee, Choi and KimLee et al. 2008) that the slip length on the SHPo surface with longitudinal trenches (LT) is
 \begin{equation}{\lambda _{LT,P}} = {-} \frac{p}{\rm \pi}\ln \left( {\cos \left( {\frac{{{\rm \pi}{\phi_g}}}{2}} \right)} \right),\end{equation}
where p is the pitch, i.e. periodicity, of the regularly patterned roughness and ϕg is the gas fraction, i.e. the ratio of the gas–liquid interfacial area to the total projected area, and the slip length on the SHPo surfaces with transverse trenches (TT) is
 \begin{equation}{\lambda _{TT,P}} = {-} \frac{p}{{2{\rm \pi}}}\ln \left( {\cos \left( {\frac{{{\rm \pi}{\phi_g}}}{2}} \right)} \right).\end{equation}
Also, while confirming an early experimental result (Reference Lee, Choi and KimLee, Choi & Kim 2016), it was theoretically derived (Reference Davis and LaugaDavis & Lauga 2010) that the slip length on the SHPo surface with aligned posts (AP) in a square pattern is
 \begin{equation}{\lambda _{AP,DL}} = \left[ {\frac{3}{{16}}\sqrt {\frac{\rm \pi}{{1 - {\phi_g}}}} - \frac{3}{{2{\rm \pi}}}\ln (1 + \sqrt 2 )} \right]p.\end{equation}
However, in reality, the interfaces are not flat, not shear free, not necessarily pinned and not on infinitely long trenches. Note trenches have a finite length unless arranged as a ring (Reference Lee, Choi and KimLee et al. 2008; Reference Hu, Wen, Bao, Jia, Song, Song, Pan, Scaraggi, Dini and XueHu et al. 2017). Efforts have been made to address deviations from the above four ideal assumptions, as follows. To account for the deviation from the shear-free interface assumption, Reference Belyaev and VinogradovaBelyaev & Vinogradova (2010) derived the slip length of SHPo surfaces comprising infinitely long trenches filled with viscous air. Since numerical solutions are required to utilize the derived formula (Reference Ng and WangNg & Wang 2010; Reference Chang, Jung, Choi and KimChang et al. 2019), Reference Schönecker, Baier and HardtSchönecker, Baier & Hardt (2014) derived explicit expressions, which, in addition, addressed deviation from the infinitely long trench assumption. When accounted for finite length (i.e. with closed ends), note the trench has air circulating in it, reducing the slip length
 \begin{align}{\lambda _{LT,S}} &= {-} \frac{{p\; \ln (\cos ({\rm \pi}{\phi _g}/2))}}{{{\rm \pi} + \dfrac{1}{{2{\phi _g}N{D_{LT}}}}\textrm{ln}\left( {\dfrac{{1 + \sin ({\rm \pi}{\phi_g}/2)}}{{1 - \sin ({\rm \pi}{\phi_g}/2)}}} \right)}},\end{align}
 \begin{align}{\lambda _{TT,S}} &= {-} \frac{{p\; \ln (\cos ({\rm \pi}{\phi _g}/2))}}{{2{\rm \pi} + \dfrac{1}{{2{\phi _g}N{D_{TT}}}}\textrm{ln}\left( {\dfrac{{1 + \sin ({\rm \pi}{\phi_g}/2)}}{{1 - \sin ({\rm \pi}{\phi_g}/2)}}} \right)}},\end{align}
where N is the viscosity ratio  $(N = {\mu _{water}}/{\mu _{air}})$ and DLT and DTT are the maximum local slip lengths described by the following error functions, which grow with d/w in the low-aspect-ratio regime (d/w ~ 0) and reach a plateau in the high-aspect-ratio regime (d/w → ∞)
 \begin{equation}{D_{LT}} = f({\phi _g}){\hat{D}_{LT}}erf\left( {\frac{{g({\phi_g})\sqrt {\rm \pi}}}{{8f({\phi_g}){{\hat{D}}_{LT,c}}}}\frac{d}{w}} \right),\end{equation}
with the prefactor written as
 \begin{gather}{\hat{D}_{LT}} = \dfrac{{\ln 2}}{\rm \pi} - \dfrac{1}{2}\left( {\dfrac{{\ln 2}}{\rm \pi} - \dfrac{{0.505}}{{2{\rm \pi}}}} \right)exp \left( { - f({\phi_g})\dfrac{{\ln 2}}{\rm \pi}\dfrac{d}{w}} \right),\end{gather}
 \begin{gather}{D_{TT}} = f({\phi _g})\dfrac{{0.505}}{{2{\rm \pi}}}erf\left( {\dfrac{{g({\phi_g})\sqrt {\rm \pi}}}{{8f({\phi_g})\dfrac{{0.505}}{{2{\rm \pi}}}}}\; \dfrac{d}{w}} \right),\end{gather}
where the coefficients f(ϕg) and g(ϕg) are functions of the gas fraction as
 \begin{gather}f({\phi _g}) = {-} \dfrac{{\ln \left( {\dfrac{{1 + \sin ({\rm \pi}{\phi_g}/2)}}{{1 - \sin ({\rm \pi}{\phi_g}/2)}}} \right)}}{{2{\phi _g}\ln 2\; \left( {1 + \dfrac{{2\ln (\cos ({\rm \pi}{\phi_g}/2))}}{{2{\phi_g}\textrm{arctanh}({\phi_g}) + \ln (1 - \phi_g^2)}}} \right)}},\end{gather}
 \begin{gather}g({\phi _g}) = \dfrac{4}{\rm \pi}(1 - {\phi _g}) + {\phi _g},\end{gather}
which follows the assumption that, when the trench is shallow, i.e. d/w → 0, the growth rate of the maximum slip length on LT with respect to d/w is similar to that of TT.
Next, let us review how deviations from the flat and pinned interfaces affect the slip length on LT surfaces. For the deviation from the flat interface assumption, since the slip lengths on pinned-concave and pinned-convex interfaces (figures 1d and 1f, respectively) were found to be similar to that on the pinned-flat interface (figure 1e) (Reference CrowdyCrowdy 2010, Reference Crowdy2016; Reference Ng and WangNg & Wang 2011), we can ignore the deviation from the flat interface for drag reduction. However, for the deviation from the pinned interface assumption, the slip length on depinning-in interfaces was found to be significantly smaller. For example, on LT surfaces with flat interfaces, the slip length decreased by ~50 % when the depinning was h/w = 0.1, by ~70 % when h/w = 0.2 and to zero or even a negative value when fully wetted (Reference Ng and WangNg & Wang 2009; Reference CrowdyCrowdy 2021). Accordingly, it is essential to detect when the plastron has deteriorated non-negligibly (i.e. depinned more than slightly) for dependable drag-reduction research. Despite the importance of maintaining a pinned plastron for successful drag reduction, not many studies in the literature even confirmed the existence of a plastron throughout the flow experiments, explaining why there have been so many inconsistencies and so much confusion among the experimental results of SHPo drag reduction in turbulent flows. To make things worse, the widely popular practice of confirming the plastron by the brightness (i.e. the silvery sheen appearance), while reliable to notice the loss of plastron (by the dark appearance), may miss the deterioration of the plastron even when the deterioration is severe enough to negate the drag reduction altogether (e.g. h/w > 0.5), as proven by Reference Yu, Kiani, Xu and KimYu et al. (2021). This previously unknown scenario of a silvery sheen plastron with little slip, possibly including the previous boat experiment (Reference Xu, Grabowski, Yu, Kerezyte, Lee, Pfeifer and KimXu et al. 2020b) as well, is one of the main motivations for the current study. By employing the low-angle observation method by Reference Yu, Kiani, Xu and KimYu et al. (2021), we can limit the deviation from the pinned state in this study, thus addressing deviations from all four ideal assumptions above.
3. Experiments and methods
3.1 Design and fabrication of SHPo surfaces
To achieve a noticeable drag reduction, the slip length of the SHPo surface should be comparable to the viscous sublayer thickness of turbulent flows (Reference Park, Choi and KimPark et al. 2021). Considering that the sublayer thickness for a wide range of watercraft in motion is around 50 μm, we have designed LT SHPo surfaces with pitches p = 50 μm, 75 μm and 100 μm and widths w = 45 μm, 67.5 μm and 90 μm, respectively, for a constant gas fraction ϕg = w/p = 0.9, leading to the nominal streamwise slip lengths of λ = 29.5 μm, 44.3 μm, 59.0 μm, respectively, according to (1.1) for simplicity. The depths of trenches, d, were set to be the same as the trench width, w, keeping the aspect ratio at d/w = 1. Based on the maximum trench length that allows a pinned plastron for LT surfaces at the same speeds (Reference Yu, Li, Mcclelland, del Campo Melchor, Lee, Lee and KimYu et al. 2023), we used trenches not longer than 2 cm, which is estimated to be short enough to avoid shear-induced drainage of the trapped air with a sufficient safety margin to counter the uncertainties of the boat experiment on the sea. The surface is expected to maintain a pinned or slightly depinned plastron, which is confirmed throughout each of the tests. Our design for the LT surface was a 7 cm long sample divided into four trenches in the streamwise direction with one 1 cm long trench upstream followed by three 2 cm long trenches, as shown in figure 2(a). The overall size of the sample (4 cm × 7 cm) was limited by the 100 mm diameter silicon wafer the sample was made from. The leading trench was chosen to be 1 cm (shorter than the other trenches) to make it more robust against wetting, considering the potentially abrupt change from the smooth upstream surface to the slippery SHPo surface (Reference Yu, Li, Mcclelland, del Campo Melchor, Lee, Lee and KimYu et al. 2023) as well as the space gap between them.
Schematics and pictures of the 4 cm × 7 cm SHPo surface samples with water flow directions. (a) Arrangement of microstructure patterns on the samples. Left: longitudinal trench. Middle: transverse trench. Right: aligned post. The patterns in the insets are drawn to scale. (b) The scanning electron microscope (SEM) pictures of a cleaved trench sample. Yellow arrows indicate the flow directions on LT and TT. The inset SEM picture shows the microstructures covered with Al2O3 nano-grass and reveals the cross-section view of the re-entrant edge at the trench top. (c) The SEM pictures of an aligned post sample. The pitch p, space width w and depth d of posts are labelled. The inset SEM picture shows that the microstructures are covered with Al2O3 nano-grass, but the re-entrant top edge is not apparent in this non-cross-sectional picture.
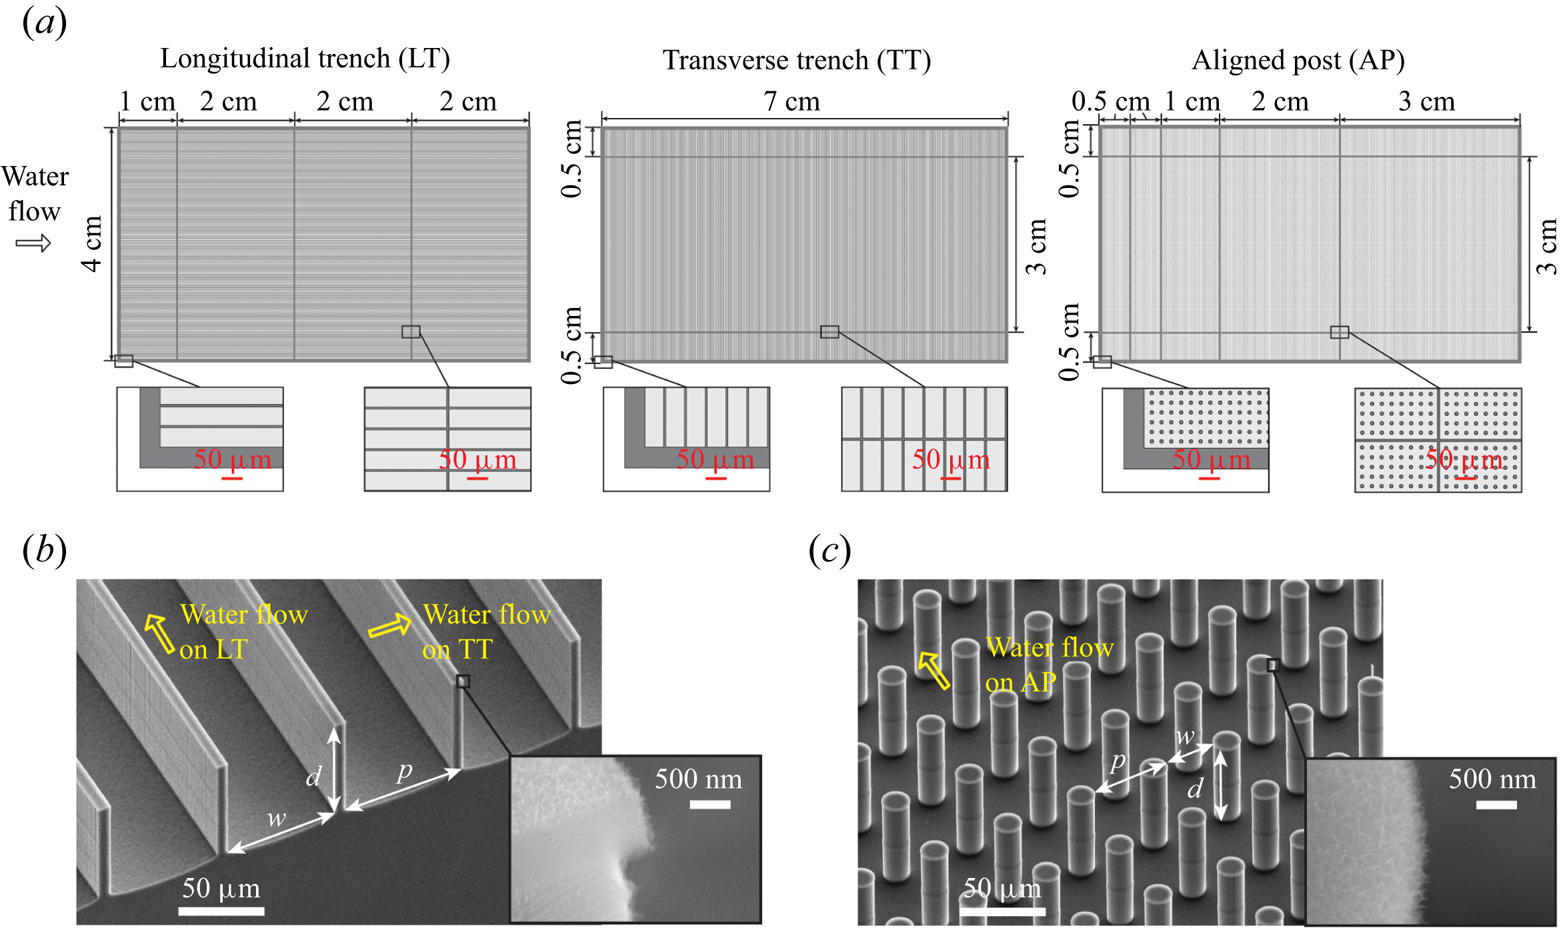
To further study the effect of structure types on the drag-reducing ability, we designed two other patterns of SHPo surface with TT and AP, as schematically drawn in figure 2(a). For a fair comparison with the LT sample of p = 50 μm, the TT and AP samples were designed to have the same gas fraction (i.e. ϕg = 0.9) and the same nominal streamwise slip length (λ = 29.5 μm) based on (1.1)–(1.3) for simplicity, as shown in table 1. The depth of TT was set to be d = 90 μm to maintain the same trench aspect ratio as LT, i.e. 1.0. Similarly, the depth of AP was set to be d = 50 μm to maintain a similar space aspect ratio ~1, considering the pitch p = 46.9 μm. For the TT surface, the 4 cm wide sample was divided into three sections in the transverse direction, as shown in figure 2(a). The sections along the sample sides were chosen to have short trenches (0.5 cm in the side sections vs. 3 cm in the middle section) to confine the potential wetting initiated by the surroundings. For the AT surface, the sample was divided into multiple sections to prevent shear-induced drainage of the trapped air, following the sectioning on the LT surface, and to confine the potential wetting by the surroundings, following the sectioning on the TT surface.
The types and names of SHPo surfaces with their geometric parameters of microstructures. The design slip lengths are calculated with the intended (i.e. design) pitch and gas fraction, using analytical equations (1.1)–(1.3), which assume a flat, shear-free and pinned interface on unbounded microstructures (e.g. infinitely long trench). The actual slip lengths are calculated with the pitch and gas fraction measured from the fabricated samples and using analytical equations (1.4)–(1.10), which assume a flat and pinned interface but account for the air viscosity and finite length of trenches, for LT and TT, and using (1.3) for AP, which has no analytic solution that accounts for air viscosity or bounded microstructures.

For the three LT types studied, two samples were fabricated and tested for each type, while for the TT and AP types, one sample was fabricated and tested for each type. All the SHPo surfaces were prepared using micro electromechanical system fabrication technology, as described in Reference Yu, Li, Mcclelland, del Campo Melchor, Lee, Lee and KimYu et al. (2023), and involved standard photolithography, reactive ion etching, deep reactive ion etching, atomic layer deposition and self-assembled monolayer coating of 1H,1H,2H,2H-perfluorodecyltrichlorosilane. All the microstructures have the re-entrant edges on top and their surfaces are covered with nano-grass, as shown in the inset pictures of figure 2(b,c).
3.2 Improved low profile shear-stress comparator
An in-house-developed shear-stress comparator (Reference Xu, Yu, Kim and KimXu et al. 2021), shown in figure 3, was used to measure the drag ratio of each SHPo surface. For each flow test, a SHPo surface was placed next to a smooth surface of the same size diced out from a silicon wafer. Each surface sample was attached to its own floating element on the shear comparator, whose displacement is proportional to the shear force on the surface attached to it. The floating elements and the supporting flexure beams were monolithically machined from a titanium plate, and their natural resonant frequency was designed not to affect the measurement. The flexure beams of the floating elements have a high-aspect-ratio cross-section so that they are flexible only in the streamwise direction and rigid in all other directions. Two optical interference encoders (M2000 linear encoder, Celera Motion Inc.), one under each floating element, were sealed in a waterproof encoder plate with marine grade sealant (Marine Adhesive Sealant Fast Cure 4200, 3M) for underwater usage and used to measure the displacement of the floating elements with 78 nm spatial resolution and 512 Hz sampling frequency. To minimize disturbance of the flows by the shear comparator, the surrounding hull surfaces were polished to be flush with the frame plate, which was permanently affixed to the hull. The sample plate, which was attached to the frame plate for each sample, was adjusted to be flush with the frame plate using screws. More importantly, the sample was placed flush with the cover sheet on the sample plate using screws to minimize the form drag by the step (i.e. height difference) between the sample and the surroundings. The displacements of the two floating elements attached with two surfaces were simultaneously measured by the two optical encoders and recorded by a computer. While this sensor is used as a shear-stress comparator most times, when desired, the shear stress on each sample can be calculated based on the spring constant of the flexure beams and the sample surface area. The measurement uncertainties were found to be less than 10 % of the measured values (Reference Xu, Arihara, Tong, Yu, Ujiie and KimXu et al. 2020a). The shear-stress comparator was proven to work in different field conditions, such as under a boat (Reference Xu, Grabowski, Yu, Kerezyte, Lee, Pfeifer and KimXu et al. 2020b), in a wind tunnel (Reference Xu, Arihara, Tong, Yu, Ujiie and KimXu et al. 2020a) and for a towing tank (Reference Xu, Yu, Kim and KimXu et al. 2021). The low profile configuration (1.8 cm thick) makes the sensor versatile by allowing it to fit in a small space, even into a towing plate (Reference Xu, Yu, Kim and KimXu et al. 2021).
Shear-stress comparator installed under the boat. (a) Schematic top view. One smooth sample and one SHPo sample are attached to the two floating elements in the main plate made of titanium. (b) Schematic cross-section view. For each test run, the main plate attached with the two samples is fastened to the frame plate, which stays affixed to the hull, and the frontal horizontal gap and step height between the sample and the surrounding cover sheet are adjusted to meet the specifications. Adapted from Reference Xu, Arihara, Tong, Yu, Ujiie and KimXu et al. (2020a), the figures are not drawn to scale for clarity.
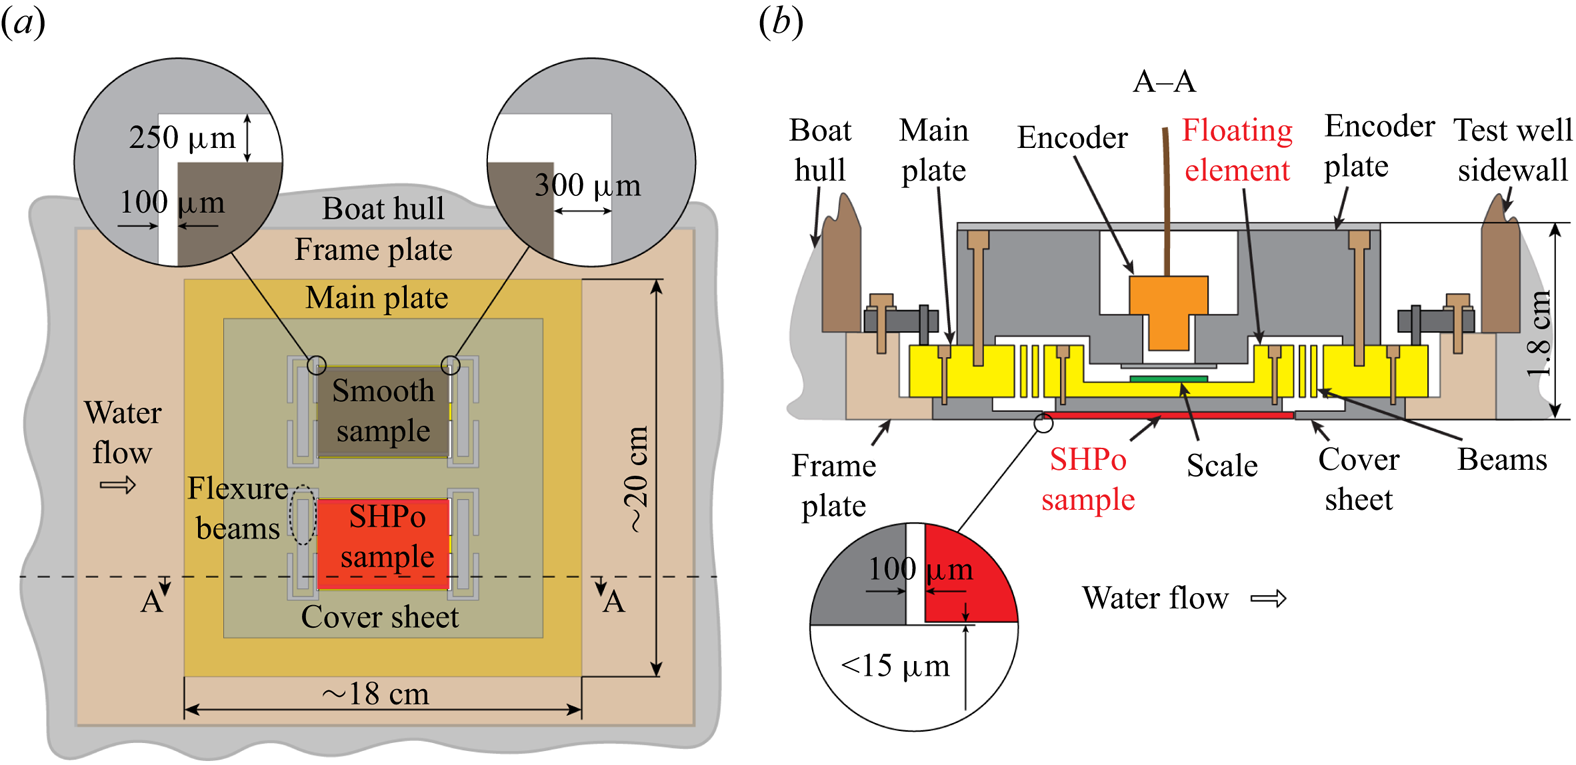
For the current study, the previous comparator used by Reference Xu, Grabowski, Yu, Kerezyte, Lee, Pfeifer and KimXu et al. (2020b, Reference Xu, Yu, Kim and Kim2021) was improved by replacing the plate material from marine-grade aluminium with titanium. Furthermore, to minimize the form drag experienced by the sample, the frontal horizontal gap and the step height between the sample and the cover sheet were kept at approximately 100 μm and below 15 μm, respectively (see the insets of figure 3), using a portable microscope and a feeler gauge.
3.3 Revamped motorboat and low-angle underwater cameras
The 4 m long motorboat retrofitted for the drag-reduction experiments by Reference Xu, Grabowski, Yu, Kerezyte, Lee, Pfeifer and KimXu et al. (2020b) has been revamped, as shown in figure 4, to increase the maximum boat speed from ~10 knots (~5 m s−1) to ~14 knots (~7 m s−1). A hydrofoil (Doel-Fin Hydrofoil, Davis Instruments) was installed on the outboard motor (Honda Marine 20 HP) to reduce the bow rise while speeding up and to improve the boat's balance performance, leading to higher speeds and a smoother ride with a steady trim angle. The boat speed, U, was measured by a paddlewheel speedometer (D800 Thru-Hull Smart Multisensor Transducer, Raymarine) installed below the boat transom and connected to a display instrument (i40 Speed Instrument Display, Raymarine) whose data were recorded by a computer. The trim angle of the boat, α, was measured by an inclinometer (H4A1-45 Inclinometer, RIEKER) fixed in the boat and found to stay at α = 3 ± 1° during the drag ratio measurement. Boat speed, trim angle and pressure were monitored as a function of time and recorded by a computer. The shear-stress comparator was installed at the bottom hull of the boat and used to measure drag ratios (or shear stress when desired) at various boat speeds. For each test, the boat would stay stationary for 5 s initially, accelerate to reach a target speed in 5 s and maintain the target speed for 40 s before the shear stresses were measured simultaneously and recorded. The wetting length, xs, which is the streamwise distance from the leading edge of the immersed hull to the centre of sample, was measured with a tape measure attached on the side of the hull.
Revamped boat installed with various instruments to monitor the flow conditions and underwater camera system to visually monitor the plastron states. The origin of the xyz coordinates is the starting point of the hull in contact with water, and the centre point of the SHPo sample is at x = xs. Looking up from below in the water, the inset figure shows the shear-stress comparator installed underneath the boat and the two underwater cameras observing the sample surface in the directions of the yellow arrows with an elevation angle, βe.

Based on Reference Yu, Kiani, Xu and KimYu et al. (2021) and following Reference Yu, Li, Mcclelland, del Campo Melchor, Lee, Lee and KimYu et al. (2023), the immersed SHPo surface was monitored by a system of two underwater cameras, as illustrated in figure 4, to ensure the SHPo surface had a pinned (or slightly depinned) plastron on its entire surface. For LT surfaces, a depinned plastron could be detected by the side camera. We set the elevation angle of the side camera to βe = 8 ± 2°, which would detect the depinning when h/w > 0.14 ± 0.04. For TT surfaces, a depinned plastron could be detected by the rear camera, which was set to have the same elevation angle as the side camera, therefore detecting h/w > 0.14 ± 0.04 as well. For AP surfaces, although their brightness with different observation angles has not been systematically studied, the depinning of the plastron could lead to a slightly dimmer appearance due to the loss of the total internal reflection region on the plastron.
3.4 Field test conditions
All the tests have been performed in the ocean area of Santa Monica Bay near Los Angeles, California, ~20 miles from the land. Testing times on different days were chosen so that the tide and wind conditions were similar for all the test runs. The wave heights and periods were 1–1.5 ft and 13 ± 3 s, respectively, according to WindAlert (https://windalert.com/spot/84161) an online forecast website. For each test, the boat was driven against the wave direction to avoid the effect of transverse flows on the sample. The weight distribution on the boat was carefully controlled to maintain similar flow conditions, including the wetting length and trim angle, for tests on different days. The air-saturation level in the ocean water was monitored periodically by a total gas sensor (Point FourTM tracker, PENTAIR) and measured to be 104 %–109 % for all the tests. Unlike the 99 %–101 % found in the water at the mouth of the creek to the ocean, which was chosen to study the plastron status (Reference Yu, Li, Mcclelland, del Campo Melchor, Lee, Lee and KimYu et al. 2023), this supersaturated water helped sustain the plastron. The seawater temperature was measured to be 15–25° over the period of our experiments (from October to May) but constant during the test on a given day. The salinity of the ocean water was measured to be 35 ± 1 g kg−1 using a salinity refractometer (Xin Da Cheng), and the surface tension was measured to be 73.46 ± 0.24 mN m−1 using a tensiometer (K100, Krüss). These values are comparable to the properties reported by Reference Nayar, Panchanathan, Mckinley and LienhardNayar et al. (2014), where the ocean water had a salinity of 35.28 g kg−1 and surface tension of 73.48 mN m−1. Although natural seawater likely contains multiple types of surfactants, the measured surface tension is comparable to that of water containing sodium dodecyl sulphate at a concentration of less than 10−3 mM (Reference Prosser and FransesProsser & Franses 2001).
4. Results and discussions
A total of eight SHPo surface samples (i.e. two samples each of three LT types, one TT sample and one AP sample, as listed in table 1) have been fabricated and tested under the boat with speeds varying from around 2.5 m s−1 to 7.2 m s−1 with ~0.5 m s−1 increments. For each SHPo sample, the drag ratio between the SHPo and smooth surface was measured at ~9 different boat speeds. In addition, smooth surfaces were used to calibrate the drag measurements. For clarification, the samples are labelled in the format of type\pitch; for example, LT\p100 means longitudinal trench sample with 100 μm pitch.
4.1 Calibration with smooth surfaces
To assess the reliability of the drag ratio measurement for the current flow experiment, we placed two smooth silicon surfaces, diced from two silicon wafers, on the two floating elements of the shear-stress comparator and tested their shear stresses with increasing boat speeds. As shown in figure 5, the shear stresses measured by the two floating elements were identical, with less than a 5 % difference between them, indicating the flow conditions on the two floating elements were similar during the flow tests as more extensively tested in Reference Xu, Arihara, Tong, Yu, Ujiie and KimXu et al. (2020a). Also, the measured values fit the theoretical boundary layer model  ${\tau _o} = 0.0288{\rho ^{4/5}}{U^{9/5}}{\mu ^{1/5}}{x^{ - 1/5}}$ (Reference Schlichting and GerstenSchlichting & Gersten 2003) quite well. The slight differences at high speeds are likely by the flow condition under the boat deviating from that past a flat plate.
Shear stresses measured with two smooth surfaces on the shear-stress comparator. Two smooth surfaces were attached to the two floating elements and subjected to varying boat speeds. The nearly identical values of the two smooth surfaces confirm the two samples experience the same flows. The measured values also follow the theoretical boundary layer model quite well, although the deviation from the flat plate model is noticeable at high speeds.

4.2 Plastron state monitored using two cameras with low elevation angle
Two miniature underwater cameras were used to observe all the SHPo surfaces during the boat tests to ensure they have a pinned (including slightly depinned) plastron. For each surface type, seven exemplary pairs of images taken at different boat speeds are presented in figure 6 and supplementary material figures S1–S4 are available at https://doi.org/10.1017/flo.2024.25, where the images have been cropped for a uniform sample size and stretched vertically for clarity. The boat speed, U, and the friction Reynolds number on the smooth surface, Reτo, are also shown next to the image pairs to indicate the flow conditions. To obtain Reτo, the boundary layer thickness, δ, is estimated from  $\delta /x = \textrm{ }0.16/Re_x^{1/7}$ (Reference Schlichting and GerstenSchlichting & Gersten 2003). The dark patches appearing on the side-view pictures at low speeds are the reflection of boat strake (chine), which is located next to the smooth surface but just outside the picture, on the mirror-like plastron. At high speeds, on the other hand, the air bubbles created by the strake are populous enough to block the view, explaining the disappearance of dark patches.
Image pairs taken from one of the two longitudinal trench samples with the pitch of 100 μm (LT\p100). The images confirm a pinned (including slightly depinned) plastron over the entire trench length up to U ~ 7.1 m s−1 although at low speeds some bubbles were found at the rear end of the sample, as identified in the yellow boxes. The dark patches on the surface of the side-view pictures at low speeds are shades, not deteriorated plastron, as explained in the main text.

For all the LT surfaces, at low speeds (U < 4.5 m s−1), bubbles were found to be attached on the sample surface along its rear end, as indicated by the yellow boxes, likely due to the high air concentration level in the surrounding water, creating a local form drag that hinders the intended measurement, but these bubbles were sheared away when the boat sped up. When the boat was faster than 4.5 m s−1, all the LT samples (i.e. LT\p75, LT\p50 and LT\p100) maintained a pinned (including slightly depinned) plastron on the entire surface. To compare with SHPo samples of LT, which is the main interest of this study, those of TT and AP were also tested. Unlike the plastron on LT\100, the plastron on TT\p100 and AP\47 was found to deteriorate by depinning-in at high speed, as presented in the supplementary material. The depinning state was discerned by the dark patches appearing on the rear view for the TT surface and on both rear and side views for the AP surface, which is caused by the decrease of total internal reflection area on the depinning meniscus, as studied in Reference Yu, Kiani, Xu and KimYu et al. (2021). Only the tests where the surface possessing only the pinned (including slightly depinned) plastron were used for the drag ratio measurement. The cases with bubbles and depinned-in plastrons were excluded to avoid form drag and significantly decreased slip, respectively, both of which distort the measurement of skin friction drag on SHPo surfaces.
4.3 Drag reduction of longitudinal trenches
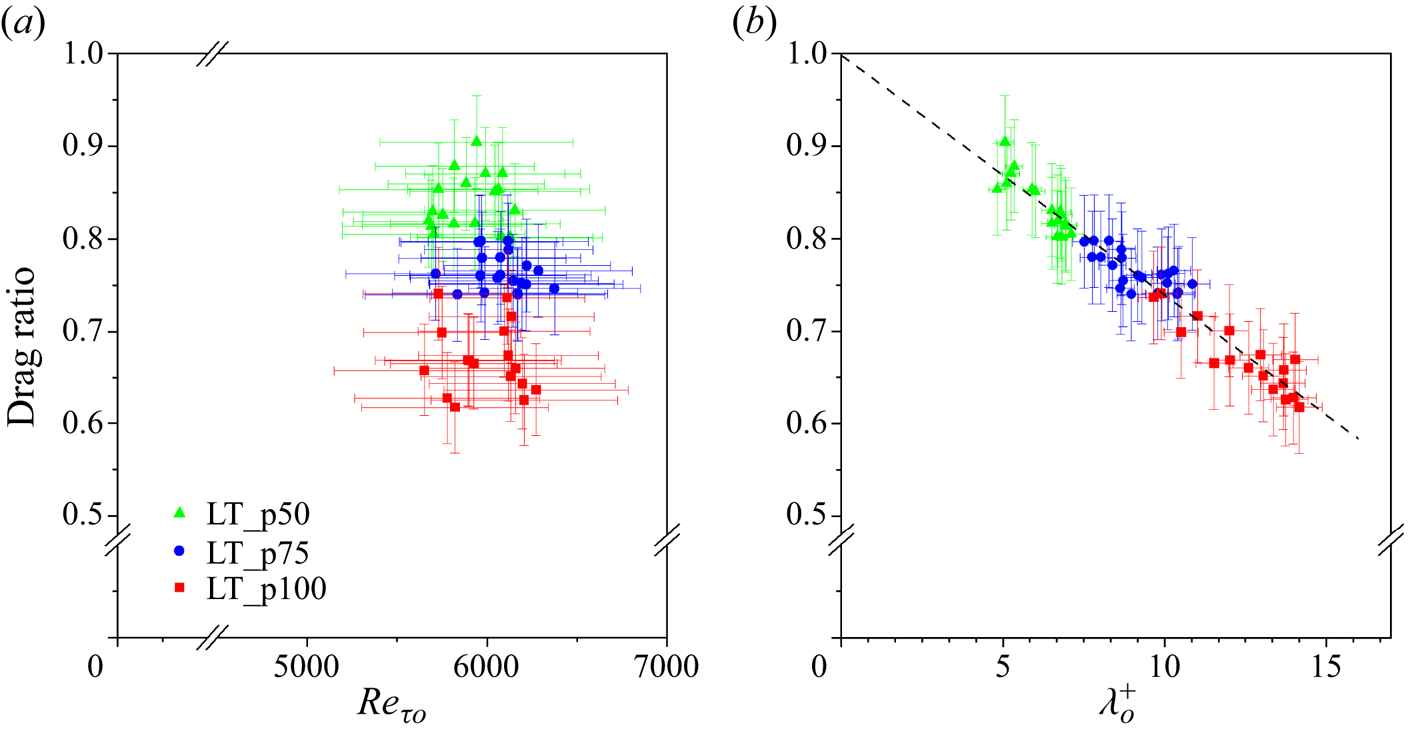
Let us first report the drag ratio of the LT surfaces over a range of friction Reynolds number in figure 7(a), following the common practice of presenting the drag ratio as a function of friction Reynolds number for experimental (Reference Aljallis, Sarshar, Datla, Sikka, Jones and ChoiAljallis et al. 2013; Reference Park, Park and KimPark et al. 2013; Reference Bidkar, Leblanc, Kulkarni, Bahadur, Ceccio and PerlinBidkar et al. 2014; Reference Xu, Grabowski, Yu, Kerezyte, Lee, Pfeifer and KimXu et al. 2020b, Reference Xu, Yu, Kim and Kim2021) and some numerical studies (Reference Martell, Rothstein and PerotMartell, Rothstein & Perot 2010; Reference Lee, Jelly and ZakiLee, Jelly & Zaki 2015). While the drag ratio data on LT obtained from the similar boat tests by Reference Xu, Grabowski, Yu, Kerezyte, Lee, Pfeifer and KimXu et al. (2020b) were scattered and did not show a clear trend, in this much-improved boat experiment with a new plastron observation technique (Reference Yu, Kiani, Xu and KimYu et al. 2021, Reference Yu, Li, Mcclelland, del Campo Melchor, Lee, Lee and Kim2023), the drag ratio results of six LT samples revealed a distinct trend of how the drag ratio decreases with the trench pitch (for ϕg = 0.9). Note that the drag reduction of ~30 % on p = 100 μm is roughly twice that of ~15 % on p = 50 μm. Expecting the trenches with a larger pitch result in a smaller drag ratio mostly due to their larger slip length and following the practice common for analytical and numerical studies (Reference Fukagata, Kasagi and KoumoutsakosFukagata et al. 2006; Reference Busse and SandhamBusse & Sandham 2012; Reference Park, Park and KimPark et al. 2013; Reference Jung, Choi and KimJung et al. 2016; Reference Chang, Jung, Choi and KimChang et al. 2019; Reference Rastegari and AkhavanRastegari & Akhavan 2019), next we present the same results with respect to the non-dimensional slip length of the surface,  $\lambda _o^ +$, as shown in figure 7(b), where $\lambda _o^ + = \lambda /{\delta _{\nu o}},{\delta _{\nu 0}}$ is the viscous length scale in the turbulent boundary layer on a smooth surface, defined as ${\delta _{\nu o}} = \nu /\sqrt {{\tau _o}/\rho } $. We calculated the slip length values using (1.4), (1.6) and (1.7) for this graph, which incorporates the viscous shear by the air in the trench with closed ends, resulting in slightly smaller slip lengths than the nominal values by (1.1) as listed in table 1. Note that, for figure 7(b), the non-dimensional slip length was obtained a priori using the measured gas fraction and theoretical slip length derived by assuming Stokes flows, while most of the numerical studies (Reference Park, Park and KimPark et al. 2013; Reference Chang, Jung, Choi and KimChang et al. 2019) obtained the non-dimensional slip length a posteriori by solving the flow on a SHPo surface with a certain surface geometry. All the data points obtained from LT samples with three different pitches (six samples in total) collapsed to a single line, indicating that the non-dimensional slip length is a good candidate parameter for determining the drag reduction of slip surfaces in turbulent flows. We believe the common understanding that, in turbulent flows, the drag ratio decreases (i.e. drag reduction increases) as the Reynolds number increases, is valid only for a given slip surface. For a given surface, which has a given slip length, the drag ratio would decrease as the Reynolds number increases because the viscous length scale decreases. Figure 7(a) shows that the same trend does not hold for surfaces with different slip lengths. Instead of the friction Reynolds number (figure 7a), the slip length expressed in wall units predicts the drag ratio much better, as shown in figure 7(b). The linear regression fitting of all the data points in figure 7(b) shows that the drag ratio is extrapolated to around 1.0 at $\lambda _o^ + = 0$, indicating no drag reduction on a smooth surface, as expected. Regarding the uncertainties of data, the horizontal error bars (standard deviations) reflect the measurement uncertainties of boat speed, wetting length and shear stress, and the vertical error bars ±0.05 indicate the maximum shear difference of two smooth surfaces in figure 5.
Drag ratio results on longitudinal trench surfaces. (a) Drag ratio versus friction Reynolds number calculated assuming a smooth surface, Reτο. Green triangles, blue circles and red squares are from the trench pitches of 50, 75 and 100 μm, respectively. (b) Drag ratio vs. the slip length non-dimensionalized by the viscous length scale on a smooth surface,  $\lambda _o^ +$. The black dashed line is the linear regression of all the data points.
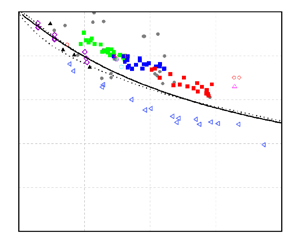
In figure 8(a), we have plotted the measured drag ratio of LT surfaces in this study vs. their slip length in wall units of a smooth surface,  $\lambda _o^ +$, which was obtained from the wall shear measured on the smooth surface during the boat experiments. For comparison, all the literature data of longitudinal micro-trenches presentable with the non-dimensionalized slip length, including the analytical and numerical results (Reference Fukagata, Kasagi and KoumoutsakosFukagata et al. 2006; Reference Martell, Perot and RothsteinMartell, Perot & Rothstein 2009; Reference Martell, Rothstein and PerotMartell et al. 2010; Reference Busse and SandhamBusse & Sandham 2012; Reference Park, Park and KimPark et al. 2013; Reference Jelly, Jung and ZakiJelly et al. 2014; Reference Lee, Jelly and ZakiLee et al. 2015; Reference Jalalabadi, Hwang, Nadeem, Yoon and SungJalalabadi et al. 2017; Reference Chang, Jung, Choi and KimChang et al. 2019; Reference Rastegari and AkhavanRastegari & Akhavan 2019) and the previous experimental reports in open water (Reference Xu, Grabowski, Yu, Kerezyte, Lee, Pfeifer and KimXu et al. 2020b, Reference Xu, Yu, Kim and Kim2021), are also shown. Closed-water experiments are avoided here because water tunnels may subject the surface to an unrealistic air-saturation level and Taylor–Couette flows enable infinitely long trenches, both of which may induce misleading drag ratio performance, as explained in Reference Park, Choi and KimPark et al. (2021). Although the non-dimensionalized slip length is usually presented in a log scale for the numerical studies to cover a wide range of slip, we use a linear scale here because the possibility of testing very large values (e.g. $\lambda _o^ + > 30$) is small in reality. When the numerical studies reported the slip length non-dimensionalized by the viscous length scale of the SHPo surface, λ+, where ${\lambda ^ + } = \lambda /{\delta _\nu }$ and the viscous length scale on a SHPo surface is ${\delta _\nu } = \nu /\sqrt {\tau /\rho } $, their data have been modified to represent $\lambda _o^ +$ for figure 8(a) based on the correlation ${\lambda ^ + }/\lambda _o^ +{=} \sqrt {\tau /{\tau _o}} $, where τ/τo is the drag ratio. We also showed all the drag ratio data with respect to λ+ in figure 8(b), where the data originally reported by $\lambda _o^ +$ have been modified to be presented by λ+. Here, in figure 8, we present several correlation lines between the $\lambda _o^ +$ graph and λ+ graph. In figure 8(a), the thin, dotted curves show several exemplary λ+ values, which the theoretical combination of $\lambda _o^ +$ and the drag ratio would correspond to. For example, on a smooth surface with $\lambda _o^ + = 5$ and drag ratio = 1, the λ+ value is 5 since there is no drag-reduction effect and therefore ${\lambda ^ + } = \lambda _o^ +$ effectively; while for a SHPo surface with $\lambda _o^ + = 6.455$ and drag ratio = 0.6, the λ+ value will also be ~5 due to the drag-reduction effect. Similar correlation can be found in figure 8(b) from the combination of λ+ and the drag ratio to $\lambda _o^ +$, as illustrated by thin, dotted curves with the corresponding exemplary $\lambda _o^ +$ values. In figure 8, all three analytical solutions (Reference Fukagata, Kasagi and KoumoutsakosFukagata et al. 2006; Reference Busse and SandhamBusse & Sandham 2012; Reference Rastegari and AkhavanRastegari & Akhavan 2019), which tuned their functions to fit direct numerical simulation data, show a trend consistent with our measured data. The measured drag ratios are slightly but consistently larger than the analytical prediction, which is understandable considering the highly turbulent flows of coastal seawater containing bubbles, debris and surfactant. When plotting the three analytical predictions, we assumed the transverse slip length to be $\frac{1}{2}$ of the streamwise slip length following (1.1) and (1.2) and further assumed ϕg = 0.9 from Reference Rastegari and AkhavanRastegari & Akhavan (2019).
Drag ratio results on longitudinal trench SHPo surfaces obtained in the current study (green, blue and red solid squares – data from figure 7b) and interpreted from other studies in the literature as a function of streamwise slip length expressed in wall units of (a) a smooth surface and (b) the given SHPo surface. Experimental data are only from open-water tests. The analytical lines were drawn by noting the spanwise slip length is a half of the streamwise slip length. Boat means motorboat; TowT means towing tank; w.r.t. is with regards to.

Compared with the previous results from the similar boat set-up (marked ‘Reference Xu, Grabowski, Yu, Kerezyte, Lee, Pfeifer and KimXu et al. (2020b), Boat’), which could not measure the wetting length accurately and could not preclude the marginally deteriorated plastron, the current work (marked ‘This work, Boat’) shows a clear trend, where the drag ratio decreases with the non-dimensional slip length. The drag ratios in the current study are also larger than those obtained by towing tank experiment (marked ‘Reference Xu, Yu, Kim and KimXu et al. (2021), TowT’), which provided a similar open-water environment. Although future studies will be needed to find the reasons for the difference from the towing tank results, at this point, logical speculations include: (i) much of the pinned interface was slightly depinned, i.e.  $0 \le h/w \le 0.14$, while this range was smaller for Reference Xu, Yu, Kim and KimXu et al. (2021), who did not incorporate nano-grass; (ii) the shorter trenches (the current 1 cm and 2 cm vs. the previous 3.5 cm and 7 cm) exacerbated the surfactant effect; and (iii) the V-shape hull made the flows less parallel to the trenches.
4.4 Drag reduction of transverse trenches and aligned posts
The drag-reduction results of TT\p100 and AP\p47 surfaces are presented in figure 9, along with those of the LT\p50 sample. While all the three samples were designed to have the same streamwise slip length based on (1.1)–(1.3), their spanwise slip lengths are different, as summarized in table 1. Compared with the same streamwise slip length for the three surfaces, the spanwise slip length is one-half for LT, twice for TT and the same for AP. Unlike in laminar flows, where the spanwise slip does not affect the streamwise drag, in turbulent flows, the spanwise slip is expected to increase the streamwise drag (Reference Min and KimMin & Kim 2004; Reference Busse and SandhamBusse & Sandham 2012). Accordingly, we expect the drag ratio of AP to be larger than that of LT, and the drag ratio of TT to be larger than that of AP. For the data points in figure 9, the slip lengths of LT and TT calculated from (1.4) and (1.5), which account for air viscosity and finite trench length, were smaller than the nominal slip lengths of LT and TT calculated from (1.1) and (1.2), which assume a shear-free interface and infinite trench length, by 5 %–10 %. Expecting a similar decrease, we used the slip length data of AP after decreasing the values calculated from (1.3) by 5 %. In figure 9, the AP surface has a drag ratio slightly larger than that of LT, supporting the expectation that the spanwise slip on AP, which is twice that on LT, would increase the streamwise drag more than the spanwise slip on LT does. The TT surface has the largest drag ratio of the three, staying at 0.97–1.04 regardless of the non-dimensional slip length, supporting the expectation that spanwise slip on TT, which is twice that on AP (and four times that on LT), would increase the streamwise drag more than the spanwise slip on AP does. Moreover, since the interfacial length in the streamwise direction is only 90 μm on TT\p100, there is a good chance that the surfactant in the water has negated any slip effect in the streamwise direction (Reference Landel, Peaudecerf, Temprano-Coleto, Gibou, Goldstein and Luzzatto-FegizLandel et al. 2020).
Drag ratio results on longitudinal trench, transverse trench and aligned post as a function of streamwise slip length obtained in the current study expressed in wall units of a smooth surface. The three samples have nearly identical streamwise slip lengths but different spanwise slip lengths, which make the drag ratios in the streamwise direction differ. Green triangles, inverted magenta triangles and rotated orange triangles are for LT, AP and TT, respectively. The black dashed line is the linear fitting of all the LT samples and duplicated from figure 7(b). The orange dash-dotted line is the linear fitting of the TT sample, and the magenta dash-dot-dotted line is the linear fitting of the AP sample.

5. Conclusions
Using the theoretical estimation that predicts the state of plastron on longitudinal trench SHPo surfaces in high-speed flows underwater (Reference Yu, Li, Mcclelland, del Campo Melchor, Lee, Lee and KimYu et al. 2023), we have designed and fabricated high-performance SHPo surfaces that can maintain a pinned or slightly depinned plastron under the high shear rate of the current study (up to ~69 000 s−1). The motorboat used for Reference Xu, Grabowski, Yu, Kerezyte, Lee, Pfeifer and KimXu et al. (2020b) has been revamped to expand the speed range (from 10 to 14 knots) and improve the boat balance with a steady trim. A recently developed observation system consisting of two underwater cameras was implemented to ensure the measured drag-reduction data are not compromised by deteriorated plastron. We have tested longitudinal trench SHPo surfaces with three different trench pitches and found the drag reduction is well described with the slip length expressed in turbulent wall units. By testing the SHPo surfaces with TT and AP in comparison with the LT, the experimental results have confirmed that the spanwise slip diminishes the drag reduction. In addition to expanding the speed range of a large drag reduction in field conditions, the clear trend found in this study has suggested that the amount of drag reduction in turbulent flows may be predicted from the analytical slip length of a given surface and flow conditions, shedding light on the design of drag-reducing SHPo surfaces for highly turbulent flows in the future, which will present new challenges, such as curved surfaces and blunt bodies, including non-fluid mechanical issues, such as surface wear, biofouling, manufacturing and implementation.
Supplementary material
Supplementary material are available at https://doi.org/10.1017/flo.2024.25. Data sets generated during the current study are available from the corresponding author on reasonable request.
Acknowledgements
We appreciate Professor H. Park for providing the drag ratio data of SHPo surfaces in the literature, Professor P. Luzzatto-Fegiz for assisting in estimating the surfactant effects on the drag reduction for this study and Q. ‘Leo’ Wang for measuring the gas fraction of fabricated samples.
Funding
This work was supported by NSF 1336966, NSF 2030404, DARPA HR00111520021 and DARPA HR00112490344 (DRAG).
Declaration of interests
The authors report no conflict of interest.


 Open access