


Introduction
Soybean (Glycine max [L.] Merril) is one of the world’s most important crops, significantly contributing to global oil and protein production, and serving as a vital food source for both humans and livestock. The success of soybean cultivation largely depends on the use of high-quality seeds, which are essential for the rapid and uniform establishment of plant stands, even under challenging environmental conditions. Identifying the physiological status of seeds is crucial, as it enables growers to select those that are more likely to produce resilient seedlings, leading to improved field performance and potentially higher yields (Caverzan et al., Reference Caverzan, Giacomin, Müller, Biazus, Lângaro and Chavarria2018; ISTA, 2020; Cheng et al., Reference Cheng, Ye, Wu and Ma2023).
Seed respiration is a fundamental metabolic process essential for seed development and function, closely linked to the seed’s physiological status. Traditionally, this relationship has been assessed through indirect methods such as the tetrazolium test and ethanol production. However, recent advances like Q2 technology have offered a different approach by directly measuring the respiration of individual seeds during germination (Bradford et al., Reference Bradford, Bello, Fu and Barros2013). The Q2 technology integrates spectroscopy with a chemical reaction in a polymer that changes colour based on oxygen concentration, enabling the equipment to monitor these changes. When applied to germination-induced seeds in sealed vials, this technology provides detailed characterization of each seed’s respiration profile. This is particularly important, as seeds with compromised metabolic states often exhibit delayed respiration onset or fail to initiate proper respiratory activity in critical tissues, ultimately resulting in poor performance (Bello and Bradford, Reference Bello and Bradford2016; Bradford, Reference Bradford2018).
In this study, the Q2 technology was combined with spectral imaging to analyze the physical and physiological properties of individual seeds. Spectral imaging is a powerful, non-destructive tool increasingly used in seed science to rapidly assess seed quality, and can provide detailed physical information on a per-seed basis (Boelt et al., Reference Boelt, Shrestha, Salimi, Jorgensen, Nicolaisen and Carstensen2018). Previous studies have used spectral imaging to distinguish seed physiological classes or correlate imaging data with biochemical compounds in seed populations (Olesen et al., Reference Olesen, Nikneshan, Shrestha, Tadayyon, Deleuran, Boelt and Gislum2015; Kandpal et al., Reference Kandpal, Lohumi, Kim, Kang and Cho2016; Shrestha et al., Reference Shrestha, Deleuran and Gislum2017; Barboza da Silva et al., Reference Barboza da Silva, Oliveira, de Carvalho, de Medeiros, de Lima Nogueira and Dos Reis2021; Jin et al., Reference Jin, Qi, Jia, Tang, Gao, Li and Zhao2022; Qi et al., Reference Qi, Huang, Sun, Tang, Zhao, Zhu and Zhang2023). While these approaches are useful for evaluating seed lots, without assessing individual seeds, determining which seeds contribute to observed changes in characteristics becomes challenging (Bradford et al., Reference Bradford, Bello, Fu and Barros2013; Bradford, Reference Bradford2018; Bello and Bradford, Reference Bello and Bradford2021).
The application of spectral imaging in studying seed physiology is still in its early stages, largely due to the challenges associated with directly measuring physiological traits through imaging (Caverzan et al., Reference Caverzan, Giacomin, Müller, Biazus, Lângaro and Chavarria2018; Elmasry et al., Reference Elmasry, Mandour, Al-Rejaie, Belin and Rousseau2019; Xia et al., Reference Xia, Xu, Li, Zhang and Fan2019; França-Silva et al., Reference França-Silva, Gomes-Junior, Rego, Marassi and Tannús2023). However, combining seed respiration profiles with spectral imaging – both individual measurements – has proven to be a feasible approach for exploring their relationship. For instance, these methods have already been used as early indicators of susceptibility to plant blindness in kohlrabi seeds, where features identified by both techniques were correlated with seed performance measurements (Bello and Bradford, Reference Bello and Bradford2021).
By linking the spectral characteristics of individual seeds with their respiration profiles, this study seeks to explore their association. This integrative approach has the potential to enhance our understanding of seed physiology by providing a non-invasive method to assess the physiological status of seeds based on their morphological and spectral traits. Therefore, the objective of this study is to investigate the relationship between the respiration profiles of individual soybean seeds and their morphological and spectral characteristics, utilizing single-seed respiration analysis in conjunction with multispectral imaging techniques.
Material and methods
Seed sample
Six samples totalling 1,808 soybean seeds (Glycine max L.) of the cultivar 55i57 RSF IPRO, harvested in the 2021/2022 season and produced in the region of Ponta Grossa, southern Brazil (25°05’52.1”S 50°09’25.7”W), were used. The seeds obtained in a seed laboratory originated from the reduction of six distinct seed lots, resulting in six individual samples of approximately 500 g each. Each sample was numbered from 1 to 6 and stored in plastic bags at 10°C.
Due to the limited capacity of the Q2 equipment in accommodating all the seeds at once, the experiment was conducted in 6 separate rounds, each processing approximately 300 seeds.
Multispectral system
The VideometerLab4 system (Videometer, Hørsholm, Denmark) was responsible for capturing the multispectral images. This system comprised a coated matte sphere with LEDs arranged along its perimeter and a monochromatic camera positioned on top, offering high spatial resolution (40 µm per pixel and a resolution of 2,192 × 2,192 pixels). Before capturing the images, the system underwent calibration to ensure radiometric accuracy, geometric alignment and proper lighting setup. The samples were exposed to 19 distinct wavelengths of LED illumination, covering ultraviolet (365 and 405 nm), visible (430, 450, 470, 490, 515, 540, 570, 590, 630, 645, 660 and 690 nm), as well as near-infrared (780, 850, 880, 890 and 970 nm). Additionally, four long-pass filters with cut-off wavelengths at 400, 500, 600 and 700 nm were employed to measure fluorescence emitted from the seed surface. The filters were combined with different excitation wavelengths, providing 30 excitation-emission combinations (e.g. 365/400 nm). As a result, 19 images were collected for each illuminated wavelength, in addition to 31 images based on distinct excitation-emission combinations, resulting in a total of 50 monochromatic images for each sample.
Multispectral imaging
The VideometerLab software (version 3.24.11) was utilized for image segmentation, seed labelling and feature extraction. A predefined mask was applied to isolate regions of interest (ROIs), specifically seeds, and to eliminate the background (consisting of the blue plate and petri dish). Autofluorescent-spectral features were extracted from these ROIs, in addition to morphological features, such as area, autocorrelation energy components, International Commission on Illumination (CIE) colour space components, width-to-length ratio and width (Table 1). Subsequently, all the biometric features were exported to an Excel file for further data analysis.
Overview of biometric feature types, the number of features per type and their corresponding descriptions

Seed respiration assessment
After capturing multispectral images using VideometerLab, individual seeds were transferred to 5 mL screw-cap vials, each containing 800 µL of agar (0.4% w/v) and 0.2% plant preservative mixture to prevent fungal growth. The seeds were placed in vials within plates, maintaining the same position as they were initially positioned in VideometerLab. The vials were sealed with caps featuring a fluorescent polymer dot on their inner side. This polymer contains a dye that changes its fluorescence properties in response to oxygen concentration. The Seed Respiration Analyzer (Fytagoras B.V., Leiden, The Netherlands) was employed to measure the oxygen consumption (respiration) rates of the individual seeds during the processes of imbibition and germination. As the seeds respire, oxygen in the sealed vial is depleted, causing a detectable change in the fluorescence intensity of the dye. This change is monitored by a light source focused on the dot and a sensor that measures the fluorescence intensity. A robotic arm systematically guides the light source and sensor over each vial, enabling the measurement of oxygen concentration within (Bradford et al., Reference Bradford, Bello, Fu and Barros2013). Measurements were recorded at 30-minute intervals over a duration of 100 hours to construct the oxygen consumption activity. The sample temperature was controlled at 20 ± 0.5°C using Peltier heating/cooling units and fans to maintain a stable environment. The recorded data were extracted into Excel files and subsequently subjected to data analysis.
Data manipulation and clustering
In this study, given the high variability and complexity of the data, which would have limited the explanatory power of traditional machine learning methods, a methodology was developed specifically to explore and interpret the data rather than to make predictions. By prioritizing clarity and interpretability between the association of the seed oxygen consumption curves (response variable) with their morphological and spectral features (explanatory variables), all quantitative measurements were converted into categorical variables using hierarchical clustering (Figure 1).
Seed biometric features and oxygen consumption data acquisition, manipulation and clustering process.

The clustering calculations for the oxygen consumption curves were based on changes in oxygen levels between consecutive time points. This approach reduced the influence of correlations in the data, making it easier to group the curves into distinct categories.
The clustering process of morphological and spectral features involved analyzing both one-way and two-way interactions of the features. In one, each of the 75 individual features was categorized separately. The two-way evaluated how features interacted in pairs by grouping all possible combinations of two features. In total, this pairing created 2,775 feature combinations to be categorized.
The hierarchical clustering analysis was based on the Euclidean distance metric and Ward.D2 linkage method, sourced from the R package stats (version 4.2.0). This approach was applied to group oxygen consumption curves, as well as the one-way and two-way interactions of biometric features into n distinct categories. The determination of the optimal number of categories involved a visual inspection of their distribution and the dendrogram generated from the clustering analysis.
Data association
To address computational limitations, the analysis of the association between seed respiration profiles and their morphological and spectral features was conducted on a subpopulation of soybean seeds. This subpopulation was selected to include seeds representing respiration profile categories with high levels of contrast, ensuring the inclusion of distinct differences for robust analysis.
The association between respiration profiles and biometric features was evaluated using 75 individual features and 2,775 feature combinations. Contingency tables were constructed for each feature to compare the frequency of their categories (rows) within each respiration profile categories (columns), enabling a structured assessment of their relationships (Figure 2).
Example of data association evaluation between categories of a covariate (C_A, C_B and C_C) on the row axis and two response variables (O2_C3 and O2_C7), which represent categories of the oxygen consumption profile, on the column axis. The significance of the association for each covariate category is expressed as a p-value, calculated based on 4,000 simulated contingency tables. The red area in the random entropy distribution indicates where the differences in random entropies exceed the original entropy difference for each category, corresponding to the p-value.

To quantify the strength of these associations, Shannon’s entropy metric was employed (Shannon, Reference Shannon1948). This metric reflects the change in frequency distribution before and after incorporating biometric features into the contingency tables. The entropy calculation highlights potential links between specific biometric categories and respiration profiles, effectively identifying which features categories are most closely associated with variations in seed respiration patterns.
The conditional entropy (H) is a measure used to quantify the uncertainty or randomness of a respiration profile category (Г) given a specific biometric characteristic class (C = c). It is calculated using the formula 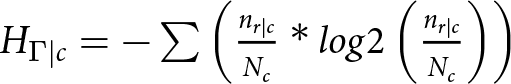 ${H_{\Gamma |c}} = - \sum {\left( {\frac{{{n_{r|c}}}}{{{N_c}}}*log2\left( {\frac{{{n_{r|c}}}}{{{N_c}}}} \right)} \right)} $. Here, ${n_{r|c}}$ represents the number of seeds that fall into a respiration pattern category (Γ = r) with r ∈{r1, r2} and belong to the biometric characteristic class (C = c). ${N_c}$ is the total number of seeds in the biometric characteristic class (C = c) and the term $\frac{{{n_{r|c}}}}{{{N_c}}}$ is the proportion of seeds in each respiration pattern within the given biometric category. This formula essentially captures how well a biometric feature category explains the variability in respiration patterns contrast, with lower entropy indicating stronger associations.
To evaluate the significance of the conditional entropy for each biometric feature category, a simulation approach was used. For each contingency table created, 4,000 random contingency tables were generated based on the structure of the original table. These random tables were created using a multinomial distribution, denoted as 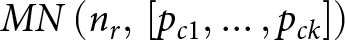 $MN\left( {{n_r},\,\left[ {{p_{c1}}, \ldots ,{p_{ck}}} \right]} \right)$ where ${N_r}$ represents the total number of seeds in each respiration pattern (r), p represents the probability of a seed belonging to each biometric class (c) and k is the total number of biometric feature categories. For each randomly generated table, the conditional entropy was calculated and compared to the entropy of the original table. The significance of entropy reduction was determined by checking whether the observed reduction in entropy was greater than 95% of the entropy reductions from the random tables. This corresponds to a significance level of 0.05, ensuring that only meaningful reductions in entropy were identified as statistically significant.
Visualization of O2 consumption and biometric measurements relationship
To visualize the relationship between seed biometric feature categories and respiration profiles, a heatmap was created using the significant biometric categories identified in the analysis. These significant categories were used to determine whether each seed exhibited the corresponding characteristic, resulting in a binary matrix where a value of 1 indicated the presence of the biometric feature category and 0 indicated its absence. The binary matrix was constructed with dimensions of  ${N_r} \times C$ where ${N_r}$ were the seeds from the respiration patterns r1 and r 2 and C denotes the significant biometric feature classes. Seeds were displayed along the rows, and biometric categories were displayed along the columns. To enhance the visualization, a dendrogram was included to group seeds with similar characteristics. This clustering was based on Euclidean distance and Ward’s D2 linkage method. Additionally, a data mechanics procedure was applied to further refine the grouping. This method used the clustering structure between seeds and biometric categories to create a weighted distance matrix, integrating the similarities between seeds and feature categories. This approach improved the visualization of patterns within the seed data, providing clearer insights into the relationship between biometric features and respiration profiles (Fushing and Chen, Reference Fushing and Chen2014; McVey et al., Reference McVey, Hsieh, Manriquez, Pinedo and Horback2021).
To assess how many seeds with the same respiration patterns shared similarities in the presence or absence of significant biometric features, a neighbourhood evaluation was performed along the row-axis of the heatmap’s dendrogram. This evaluation focused on identifying whether a seed’s five closest neighbours, determined by the branches of the dendrogram, mostly belonged to the same respiration pattern. The proportion of seeds that clustered with others from the same respiration pattern was then calculated and expressed as a percentage, providing a clear measure of how well the clustering captured the association between respiration patterns and biometric features.
All analyses were performed using R (version 3.5.2) and RStudio (version 2022.02.3). The following R packages were used for data visualization: pheatmap (version 1.0.12) for heatmaps, ggridges (version 0.5.6) for density plots, ggcorrplot (version 0.1.4) for correlation plots and ggplot2 (version 3.5.1) for bar and line plots. Hierarchical clustering was performed using the stats package (version 4.4.2).
Results
The normalized distribution of all 1,808 seeds’ biometric features and their correlogram are presented in Figure 3. Notably, the distribution of biometric features highlighted the heterogeneity within the seed population (Figure 3A). For instance, the distribution of size attributes (area, width and length) showed high deviation, indicating the presence of seeds from a broad size range. The spectral features (RF-365 to RF-970) exhibited similar distribution patterns, although they had distinct median values. In contrast, morphological, autofluorescence (AF) and CIE components displayed diverse distribution patterns and median values. Furthermore, spectral features, AF and autocorrelation components features exhibited high correlation within each respective class (Figure 3B).
Distribution (A) and correlation (B) of normalized soybean morphological, spectral (RF), autofluorescence (AF) and texture (ACE) features using min-max normalization. In the correlation plot, the shape and orientation of the ellipses indicate the strength and direction of the correlation, with narrower ellipses representing stronger correlations and the direction indicating positive or negative relationships.

The time-course oxygen consumption curves were classified into 12 categories based on a visual examination of the hierarchical cluster tree (Figure 4A). This clustering revealed distinct patterns in the oxygen consumption of the seeds (Figure 4B). Clusters 1–5 shared the same branch in the dendrogram and exhibited a common characteristic of rapid oxygen consumption initially, followed by stabilization. Clusters 6 and 7, located on the second branch of the dendrogram, shared a pattern characterized by a slight initial linear rate of respiration phase, with slower oxygen consumption at the beginning, followed by a steeper slope and a plateau. Finally, seeds from clusters 8–12, positioned on the third dendrogram branch, displayed varying patterns among themselves but collectively demonstrated a slow and consistent oxygen consumption over time. The seeds extracted from cluster trees 7 and 10 exhibit a notable contrast in their respiration patterns, revealing both homogeneous patterns within each cluster and distinctive characteristics in terms of the transition from a fast (cluster 3) to intermediate (cluster 7) to a slow (cluster 10) respiration rate.
Time course of oxygen consumption activity for individual soybean seeds, including a dendrogram (A) and curves segmented into 12 clusters (B). Each curve’s colour corresponds to a distinct seed.

The evaluation of biometric features without considering any interaction revealed distinctions among seeds with different respiration patterns (Figure 5). Notably, 40 characteristics significantly (p-value < 0.05) distinguished between seeds with a fast respiration pattern from those with a slow respiration pattern. Additionally, 23 characteristics differed between seeds with a slow and intermediate respiration pattern, while 51 characteristics distinguished between fast and intermediate respiration patterns. It is noteworthy that seeds with a certain level of attributes related to size, such as width, area and length, as well as reflectance at 365, 405, 660 and 690 nm, along with AF features, presented higher odds of displaying a particular respiration pattern. For instance, seeds with a smaller width are five times more likely to exhibit an intermediate respiration pattern compared to a faster respiration pattern, as well as among the seeds with smaller areas and lengths, which is expected since shape features are highly correlated (Figure 5C). This result corroborates with Figure 5A, where seeds with larger areas or width are nearly twice as likely to demonstrate a fast respiration pattern, while smaller seeds are twice as likely to exhibit a slow respiration pattern. Additionally, seeds that presented higher values of AF 470/700 excitation-emission are less likely to present a fast respiration pattern.
Significant biometric feature classes odds ratio between seeds with fast and slow oxygen consumption (A), slow and intermediate oxygen consumption (B) and fast and intermediate oxygen consumption (C). The x-axis is presented on logarithmic scale. The odds ratio represents the odds of seeds with a particular feature between two respiration patterns, divided by the odds of the total number of seeds in each respective respiration pattern.

Differences in the two-way interaction of biometric features between seeds displaying fast and intermediate respiration patterns are illustrated in Figure 6. Notably, a total of 3,296 characteristics significantly (p-value < 0.05) distinguished between the respiration patterns, and these are arranged along the heatmap’s column axis. These distinctions are visually presented on the heatmap, where the presence or absence of significant biometric features among seeds from the two respiration patterns is colour-coded as red or blue. Seeds are grouped on the row axis according to the similarities in their characteristics. Notably, seeds with the same respiration pattern tend to share a common branch on the dendrogram, while rounds and batches remain randomly distributed. An evaluation of the closest neighbours on the row-axis dendrogram revealed that 75.8% of seeds have a majority of neighbours sharing the same respiration pattern. This observation underscores the similarity among seeds from the same respiration pattern in terms of the presence or absence of selected characteristics, indicating a robust relationship between respiration and biometric features. Moreover, examining the block patterns of characteristic presence revealed by the row- and column-axis dendrograms suggests that different combinations of characteristics contribute to either higher or intermediate respiration.
A total of 2,765 two-way interactions of biometric features differed significantly between seeds with fast and slow respiration patterns (Figure 7). Seeds with the same respiration pattern shared the same neighbourhood in 74.10% of cases, tending to cluster on similar branches of the dendrogram. This finding indicates that the selected biometric features are associated with seed respiration patterns. Notably, a high presence of characteristics linked to AF in seeds with slower respiration patterns is observed in the block-pattern formation in the last row, third column. This result aligns with Figure 3A, where AF features showed higher odds of being associated with slower oxygen consumption.
Seeds with slow and intermediate respiration patterns were significantly distinguished by 1,650 two-way biometric feature combinations (Figure 8). In 78.60% of cases, seeds with the same respiration pattern clustered in the same neighbourhood on the row-axis dendrogram. The fewer distinguishing characteristics between these two respiration patterns, compared to the fast versus intermediate and fast versus slow contrasts, suggest a higher degree of similarity between them. This similarity is also evident in Figure 4, where the time-course oxygen consumption curves from clusters 7 and 10 (intermediate and slow respiration patterns) exhibit more similarities than with cluster 3 (fast respiration pattern). Notably, seeds from the same respiration pattern frequently share branches on the dendrogram, and a greater number of block patterns are formed. This indicates that seeds with the same respiration pattern share similar characteristics; however, no single set of characteristics can be attributed to differentiating each respiration pattern.
Discussion
This study provides an in-depth exploration of the relationship between soybean seed respiration and biometric features at the single-seed level. A total of 75 biometric features were analyzed, encompassing morphological, textural, spectral and AF traits, with both one-way and two-way interactions considered. This approach resulted in 2,775 feature combinations, leading to the evaluation of over 8,000 unique seed biometric characteristics. The analysis focused on three distinct respiration patterns, uncovering significant differences in biometric traits between each pair of patterns. Notably, the selected two-way interaction features captured the majority of these differences, with over 75% of seeds clustering in the same neighbourhood based on their respiration profiles when grouped by biometric similarities.
The soybean seed population used in the study effectively highlighted a range of respiration patterns, as illustrated in Figure 4. The differences observed in the respiration patterns are directly related to the physiological status of the soybean seeds at various developmental stages. Typically, the time-course of oxygen consumption in seeds displays a sigmoid pattern. The initial stage involves a linear respiration rate, followed by a second stage characterized by a steep slope until oxygen is depleted. The seeds’ oxygen consumption during the imbibition process and prior to radicle emergence is frequently associated with seed physiological status (Corbineau, Reference Corbineau2012; Xin et al., Reference Xin, Wan, Wang, Yin, McLamore and Lu2013; Bello and Bradford, Reference Bello and Bradford2021; Tu et al., Reference Tu, Yin, Yang, Wang and Sun2023). A brief initial linear rate of respiration indicates seeds with a robust capacity to repair their respiratory system. On the other hand, a steeper slope is associated with embryo axis development, radicle emergence and seedling growth, consequently accelerating oxygen consumption (Bello and Bradford, Reference Bello and Bradford2016; Bradford et al., Reference Bradford, Bello, Fu and Barros2013). Both situations are commonly linked to high vigour seeds. For instance, studies on sweetcorn, pepper, wheat, watermelon, onion and Brassicas demonstrate that high-vigour seeds tend to consume more oxygen during the germination process (Bradford et al., Reference Bradford, Bello, Fu and Barros2013; He et al., Reference He, Ye, Ying, Ma, Zang, Wang, Yu and Zhu2019; Tu et al., Reference Tu, Yin, Yang, Wang and Sun2023). Interestingly, a linear rate of respiration was frequently observed among the seed population until the end of the measured time (Figure 4B – clusters 9, 11 and 12). A linear respiration rate is often associated with the absence of embryo axis growth and radicle emergence (i.e. germination strictu sensu) (Bello and Bradford, Reference Bello and Bradford2016).
Clear distinctions emerged in the composition of characteristics between soybean seed populations exhibiting rapid oxygen consumption and those displaying slower oxygen consumption. Notably, variations were observed in the size, AF and seeds’ reflectance. AF features are established markers of seed maturity and deterioration such as chlorophyll, lignin, carotenoids and phenols fluorescence (Jalink et al., Reference Jalink, Van Der Schoor, Frandas, Van Pijlen and Bino1998; Donaldson, Reference Donaldson2020; Barboza da Silva et al., Reference Barboza da Silva, Oliveira, de Carvalho, de Medeiros, de Lima Nogueira and Dos Reis2021; França-Silva et al., Reference França-Silva, Gomes-Junior, Rego, Marassi and Tannús2023). Lower AF excitation-emission combinations of 365/600 appeared more frequently on seeds with slower oxygen consumption (Figure 5C). The excitation wavelength at UV-light (365 nm) has been primarily associated with chlorophyll fluorescence (Li et al., Reference Li, Zhang and Huang2014; Donaldson, Reference Donaldson2020). Additionally, a strong correlation (Pearson correlation = 0.91) with hydrogen peroxide (H2O2) levels in soybeans has also been reported (Barboza da Silva et al., Reference Barboza da Silva, Oliveira, de Carvalho, de Medeiros, de Lima Nogueira and Dos Reis2021). Previous studies have linked lower AF intensity at 365 nm excitation with deteriorated seeds. For instance, Barboza da Silva et al. (Reference Barboza da Silva, Oliveira, de Carvalho, de Medeiros, de Lima Nogueira and Dos Reis2021) and Batista et al. (Reference Batista, Mastrangelo, de Medeiros, Petronilio, Fonseca de Oliveira, Dos Santos, Crusciol and Amaral da Silva2022) noted reduced AF at 365 nm excitation in aged soybean seeds, which also presented a better discrimination among seed aging classes compared to early germination tests, corroborating the present study. Similarly, Li et al. (Reference Li, Sun, Wu, Chen, Lu and Dai2019) observed that aged and non-viable soybean seeds exhibited lower fluorescence intensity at the 365 nm excitation wavelength. An interesting finding was the similarities observed at excitation wavelengths of 430, 450 and 470 nm, where a higher fluorescence signal was associated with lower oxygen consumption rates. This association was evident both between seeds with fast and intermediate respiration patterns and between seeds with fast and slower respiration patterns (Figure 5A and 5C). The wavelength spectrum of 430–470 nm has been reported to be associated with lignin, ferulic acid and flavonoids fluorescence and to exhibit a strong correlation (Pearson correlation > 0.95) with lignin content in soybean seed coats (Donaldson, Reference Donaldson2020; Barboza da Silva et al., Reference Barboza da Silva, Oliveira, de Carvalho, de Medeiros, de Lima Nogueira and Dos Reis2021; Batista et al., Reference Batista, Mastrangelo, de Medeiros, Petronilio, Fonseca de Oliveira, Dos Santos, Crusciol and Amaral da Silva2022). This is an interesting finding, since the role of those compounds is not completely elucidated on seed vigour (Batista et al., Reference Batista, Mastrangelo, de Medeiros, Petronilio, Fonseca de Oliveira, Dos Santos, Crusciol and Amaral da Silva2022).
The biometric characteristics investigated in this study provide valuable indicators for estimating seed respiration. However, they do not offer information on seed performance, which depends on multiple factors such as the maturation stage at harvest, post-harvest treatments and aging during storage. As a result, individual markers are often insufficient for a comprehensive evaluation of seed performance (Corbineau, Reference Corbineau2012). This limitation is clearly observed in the biometric features two-way interactions map, where different compositions of seed characteristics lead to the same respiration rate (Figures 6–8). Additionally, different composition patterns of features were observed among seeds from the same batch, possibly due to the presence of subpopulations among them. It is known that seed batches present mixtures of multiple subpopulations, influenced by factors such as seed locations in the fruit or on the mother plant or commercial seed lots blending. Thus, the integrated assessment of different features in a single-seed approach is highly needed to understand whether a characteristic or combination of characteristics can lead to a certain seed performance (Bello and Bradford, Reference Bello and Bradford2016; Corbineau, Reference Corbineau2012; de Medeiros et al., Reference de Medeiros, Capobiango, da Silva, da Silva, da Silva and Dos Santos Dias2020).
Data mechanics visualization of the significant (p-value < 0.05) differences in the two-way interaction of biometric features between soybean seeds displaying fast (O2 cluster 3) and intermediate (O2 cluster 7) respiration patterns. Red tiles in the heatmap indicate the presence (1) of a characteristic, while blue tiles represent its absence (0). The row-axis represents each soybean, colour-coded according to its respiration pattern (O2 cluster), as well as its round and batch. The column-axis represents each significant biometric characteristic, colour-coded based on its corresponding two-way interaction category. The presence or absence of the characteristic in the seed is colour-coded as red or blue, respectively. The row-axis dendrogram groups the oxygen consumption patterns based on similarities in biometric characteristics, while the column-axis dendrogram groups the features by type.

Data mechanics visualization of the significant (p-value < 0.05) differences in the two-way interaction of biometric features between soybean seeds displaying fast (O2 cluster 3) and slow (O2 cluster 10) respiration patterns. Red tiles in the heatmap indicate the presence (1) of a characteristic, while blue tiles represent its absence (0). The row-axis represents each soybean, colour-coded according to its respiration pattern (O2 cluster), as well as its round and batch. The column-axis represents each significant biometric characteristic, colour-coded based on its corresponding two-way interaction category. The row-axis dendrogram groups the oxygen consumption patterns based on similarities in biometric characteristics, while the column-axis dendrogram groups the features by type.

Data mechanics visualization of the significant (p-value < 0.05) differences in the two-way interaction of biometric features between soybean seeds displaying intermediate (O2 cluster 7) and slow (O2 cluster 10) respiration patterns. Red tiles in the heatmap indicate the presence (1) of a characteristic, while blue tiles represent its absence (0). The row-axis represents each soybean, colour-coded according to its respiration pattern (O2 cluster), as well as its round and batch. The column-axis represents each significant biometric characteristic, colour-coded based on its corresponding two-way interaction category. The row-axis dendrogram groups the oxygen consumption patterns based on similarities in biometric characteristics, while the column-axis dendrogram groups the features by type.

In summary, the methodology described here proves a feasible way to map differences in seed characteristics within populations and tracing them back to individual seeds. It allows for the visualization of seed clusters that share similar respiration profiles but exhibit distinct characteristics, making it valuable for studying seed physiology and identifying subpopulations. While still under development, the methodology effectively demonstrated the relationship between seed respiration profiles and biometric traits. Due to the high computational demands, the study focused on a subpopulation to explore higher-order interactions between biometric features (two-way interactions) and their significance through simulations. Selecting respiration pattern categories further enhanced the ability to detect differences. For future studies, we recommend evaluating higher-order interactions and increasing the number of seed populations analyzed. This approach could improve the detection of patterns and provide deeper insights into the relationship between seed respiration and biometric characteristics. Additionally, we suggest recording germination data, as this could offer valuable information about oxygen consumption and the physiological status of the seeds. Lastly, these findings underscore the strong association between seed respiration patterns and biometric traits, highlighting the value of this integrated approach in distinguishing physiological characteristics.
Conclusion
In conclusion, this study successfully investigated the relationship between the respiration profiles of individual soybean seeds and their morphological and spectral characteristics. The evaluation of single biometric features revealed significant differences in respiration patterns, particularly in AF excitation-emission at 365/600, 430/700, 450/700 and 470/700 nm, as well as in reflectance at 365, 690 and 405 nm. Mapping the two-way interactions of these characteristics demonstrated that different combinations of traits could lead to the same respiration pattern. The exploratory analysis methodology presented in this study provides robust evidence of an association between seed respiration profiles and biometric traits, offering valuable insights for future research on seed physiology and quality assessment.
Acknowledgements
To the Coordination for the Improvement of Higher Education Personnel (CAPES – Finance Code 001), for providing a scholarship to the first author, to the National Council for Scientific and Technological Development (CNPq) for providing a scholarship to the first author during the period abroad and to the seed lab Apasem (Ponta Grossa/PR) donating the seeds to the experiment.
Competing interests
None declared.


 Open access