


Management Implications
This study assesses the risk of invasion by exotic ornamental plants in California under climate change conditions. This assessment uses a relatively simple methodology and provides a basis and rationale for prioritizing areas and species of potential concern. The evaluation identifies potential hot spots of plant invasion and ranks individual species according to the calculated risk. This is the first screening stage and provides to land managers and stakeholders an additional tool to identify feasible management strategies for potentially new invaders. These risk maps can be used to develop a regional surveying strategy to look for new potential invasive plant species in California. Resources and efforts should be focused on those areas where the conditions seem to be more suitable for the establishment of a high number of potential new invasive species. This assessment allowed us to classify species within three risk categories (high, moderate, and low). Depending on species naturalization status and risk of invasion, various interventions (trade ban, cessation of cultivation, monitoring, control, containment, or eradication) can be contemplated at different scales.
Introduction
Greater undesirable impacts are expected when regions become more susceptible to the establishment of exotic plant species. The interaction of California’s complex topography with its climate and habitat diversity make the state home to a wide variety of native flora (3,400 species). The region is a biodiversity hot spot that contains 20% of all vascular plant species in the United States (Stein et al. Reference Stein, Kutner and Adams2000). However, these conditions are also favorable for the establishment of exotic plant species (Baldwin et al. Reference Baldwin, Goldman, Keil, Patterson, Rosatti and Wilkin2012; Brusati et al. Reference Brusati, Johnson and DiTomaso2014). More than 1,500 exotic plant species have naturalized in agricultural systems and natural areas in California (DiTomaso and Healy Reference DiTomaso and Healy2007).
Studies have shown that the ornamental horticultural industry is the main pathway for plant invasions worldwide (van Kleunen et al. Reference van Kleunen, Essl, Pergl, Brundu, Carboni, Dullinger, Early, González-Moreno, Groom, Hulme, Kueffer, Kühn, Máguas, Maurel and Novoa2018). Ornamental plants are produced mainly for their aesthetic value and are grown for decorative purposes in gardens and landscape design projects. Ornamental plants constitute an important part of the global horticulture industry (Li et al. Reference Li, Cheng, Smith, Ellis, Chen, Zheng, Pei, Luo, Zhao, Yao, Duan and Li2004; Mitrofanova et al. Reference Mitrofanova, Zakubanskiy and Mitrofanova2018). More than 50,000 exotic plant species have been introduced for ornamental purposes in the United States; although most of these species do not represent a problem, some do escape and become invasive (Reichard and White Reference Reichard and White2001). In California, exotic ornamental species represent 47% of the total number of invasive plants according to the California Invasive Plant Council’s Invasive Plant Inventory (Bell et al. Reference Bell, DiTomaso and Wilen2017; Conser et al. Reference Conser, Seebacher, Fujino, Reichard and DiTomaso2015). There is a significant risk of new plant invasions in California from subsequent introductions (Brusati et al. Reference Brusati, Johnson and DiTomaso2014; Conser et al. Reference Conser, Seebacher, Fujino, Reichard and DiTomaso2015; Reichard and White Reference Reichard and White2001).
The increase in the proportion of greenhouse gases in the Earth’s atmosphere is likely to cause an average global warming of 1 to 3.5 C over the next century (IPCC 2014). This warming will vary spatially and is predicted to be most intense in the winter at high northern latitudes (Houghton Reference Houghton1997). Changes in global temperatures will also bring a change in precipitation regimes, but forecasting for the magnitude or direction of these changes is unclear. California has experienced an overall warming trend over the past century, and it is projected that the temperature will continue increasing. Statewide mean temperature could increase as much as 5.8 C by 2070 to 2099 relative to 1971 to 2000 under continued high greenhouse gas emissions (Cordero et al. Reference Cordero, Kessomkiat, Abatzoglou and Mauget2011; Pierce et al. Reference Pierce, Kalansky and Cayan2018; Rapacciuolo et al. Reference Rapacciuolo, Maher, Schneider, Hammond, Jabis, Walsh, Iknayan, Walden, Oldfather and Ackerly2014). Future change in precipitation for California is less certain, with both increases and decreases in annual precipitation projected, depending on the general circulation model (GCM) considered (Berg and Hall Reference Berg and Hall2015; Dettinger et al. Reference Dettinger, Udall and Georgakakos2015; Pierce et al. Reference Pierce, Das, Cayan, Maurer, Miller, Bao, Kanamitsu, Yoshimura, Snyder and Sloan2013).
On a local scale, the anticipated changes in climate will directly favor some species over others, and range shifts will consequently occur (Allen and Bradley Reference Allen and Bradley2016; Buckley and Csergő Reference Buckley and Csergő2017; Dukes and Mooney Reference Dukes and Mooney1999). Some studies have shown that cultivated species could expand and become problem species over larger areas if the limiting temperatures recede (Dullinger et al. Reference Dullinger, Wessely, Bossdorf, Dawson, Essl, Gattringer, Klonner, Kreft, Kuttner, Moser, Pergl, Pyšek, Thuiller, van Kleunen and Weigelt2017; Patterson Reference Patterson1995). Long-term observational studies suggest that an increase in annual precipitation in arid and semiarid regions of western North America could increase the dominance of invasive alien grasses (Boyte et al. Reference Boyte, Wylie and Major2016; Hobbs and Mooney Reference Hobbs and Mooney1991). In contrast, other studies have predicted decreases in the potential ranges and spatial shifts of some invasive plant species under future climatic scenarios (Beerling et al. Reference Beerling, Huntley and Bailey1995; Buckley and Csergő Reference Buckley and Csergő2017; Manzoor et al. Reference Manzoor, Griffiths, Iizuka and Lukac2018). For example, a decrease in range size was predicted for five of South Africa’s major plant invaders under future climatic scenarios (Richardson et al. Reference Richardson, Bond, Dean, Higgins, Midgley, Milton, Powrie, Rutherford, Samways and Schulze2000).
Increasing temperature and precipitation combined with more frequent and intense climatic events (very wet and very dry years) are likely to favor the establishment and spread of some invasive species (Bradley et al. Reference Bradley, Wilcove and Oppenheimer2010; Guan et al. Reference Guan, Guo, Chen, Li, Liu, Gong and Ge2020; Hellmann et al. Reference Hellmann, Byers, Bierwagen and Dukes2008). Climate change may increase the probability of invasive species establishment by providing more favorable climatic conditions in areas where exotic species are currently unable to survive (e.g., ornamental exotic plants that currently depend on the artificial climate of a garden). Climate change might also facilitate exotic species establishment by increasing their competitive abilities or rate of spread; and finally, climate change might shift native species’ geographic distributions, reducing their competitive resistance (Adhikari et al. Reference Adhikari, Jeon, Kim, Shin, Adhikari and Seo2019; Hellmann et al. Reference Hellmann, Byers, Bierwagen and Dukes2008).
For new potentially invasive exotic species, the use of risk maps can guide management strategies by identifying areas where new invasive species are more likely to establish and cause negative impacts (Kriticos et al. Reference Kriticos, Venette, Baker, Brunel, Koch, Rafoss, der Werf and Worner2013; Venette et al. Reference Venette, Kriticos, Magarey, Koch, Baker, Worner, Gómez Raboteaux, McKenney, Dobesberger, Yemshanov and De Barro2010). Species distribution models (SDMs) are often used for a diverse range of ecological studies, including biological invasion studies (Guillera-Arroita et al. Reference Guillera-Arroita, Lahoz-Monfort, Elith, Gordon, Kujala, Lentini, McCarthy, Tingley and Wintle2015); SDMs use mathematical algorithms to establish a relationship between species’ occurrence data and environmental variables. These models can then be projected across the environmental space to identify areas likely to have suitable conditions for a particular species; these outputs then can be used to support management decisions (Bradley et al. Reference Bradley, Wilcove and Oppenheimer2010; Guisan et al. Reference Guisan, Tingley, Baumgartner, Naujokaitis-Lewis, Sutcliffe, Tulloch, Regan, Brotons, McDonald-Madden and Mantyka-Pringle2013; Mammola and Leroy Reference Mammola and Leroy2018).
Considering the large number of plant species that could become invasive in California (Brusati et al. Reference Brusati, Johnson and DiTomaso2014), deciding which species should be targeted for management can be challenging. Several frameworks have been developed to assess the risk of invasion by exotic plants, including trait-scoring, statistical, decision-tree, rapid screening, and mechanistic approaches, as well as other more detailed approaches that might include comprehensive information on the species, the region where it might be introduced, and the circumstances of its introduction (Keller and Kumschick Reference Keller and Kumschick2017; Martin et al. Reference Martin, Jewell, Hoff, Givens and Marcot2020). These pre- or post-border assessments are usually based on a series of parameters related to the species’ life history and ecology and its potential environmental and socioeconomic impacts (Cunningham et al. Reference Cunningham, Barry, Woldendorp and Burgess2004; Darin et al. Reference Darin, Schoenig, Barney, Panetta and DiTomaso2011; Hulme Reference Hulme2012; Kumschick et al. Reference Kumschick, Bacher, Dawson, Heikkilä, Sendek, Pluess, Robinson and Ingolf2012; Roy et al. Reference Roy, Rabitsch, Scalera, Stewart, Gallardo, Genovesi, Essl, Adriaens, Bacher and Booy2018). Depending on the number of parameters and information availability, completing these risk assessment frameworks for a large number of species can be challenging (Hulme Reference Hulme2012; Renteria et al. Reference Renteria, Rouget and Visser2017; Verbrugge et al. Reference Verbrugge, de Hoop, Aukema, Beringen, Creemers, van Duinen, Hollander, de Hullu, Scherpenisse, Spikmans, van Turnhout, Wijnhoven and Leuven2019).
Managers often face the challenge of deciding which species should be targeted for intervention; however, given the amount of information required to make such a decisions, it is likely that those interventions will be implemented under a certain level of uncertainty (Darin et al. Reference Darin, Schoenig, Barney, Panetta and DiTomaso2011; Kumschick and Richardson Reference Kumschick and Richardson2013). Rapid prioritization assessments provide an initial screen, allowing managers to rank and identify potentially problematic species at different scales. Generally these assessments use few parameters and are less time-consuming compared with other more detailed schemes (Branquart et al. Reference Branquart, Brundu, Buholzer, Chapman, Ehret, Fried, Starfinger, van Valkenburg and Tanner2016; Martin et al. Reference Martin, Jewell, Hoff, Givens and Marcot2020).
Predicting future distributions of invasive species can aid development of effective management actions such as prevention of introductions and opportunities for eradication. Proactively identifying high-risk species and areas increases resource-use efficiency by preventing new invasions through targeted surveying in managed areas (Jiménez-Valverde et al. Reference Jiménez-Valverde, Peterson, Soberón, Overton, Aragón and Lobo2011; Venette et al. Reference Venette, Kriticos, Magarey, Koch, Baker, Worner, Gómez Raboteaux, McKenney, Dobesberger, Yemshanov and De Barro2010). Assessing the risk of new invasion is beneficial for informing stakeholders and land managers, particularly in the face of climate change (Allen and Bradley Reference Allen and Bradley2016; Gallagher et al. Reference Gallagher, Duursma, O’Donnell, Wilson, Downey, Hughes and Leishman2013; O’Donnell et al. Reference O’Donnell, Gallagher, Wilson, Downey, Hughes and Leishman2012). We used SDMs to predict the current and future potential distribution of 170 exotic ornamental plants listed as potentially new invasive species for California. Using GIS analysis, we identified geographic areas most at risk of invasion under different climate change scenarios. Using individual species’ predicted area together with some biological traits, the risk of invasion of each species was assessed using a weighted-score approach. We discuss how these results can be used to help prioritize both high-risk areas and species for subsequent management intervention.
Methods
For this study, we considered the exotic ornamental plant species listed as potential new invaders for California generated by Brusati et al. (Reference Brusati, Johnson and DiTomaso2014). Their assessment was based on species’ invasiveness elsewhere with a similar Mediterranean climate or species listed as invasive in a neighboring state. Their risk analysis resulted in a total of 186 species arranged in two main groups: naturalized (species that naturalized after 1940, 70 spp.) and non-naturalized (116 spp.). Naturalized species are often defined as exotic species than have been able to reproduce and maintain viable populations for substantial number of years in the recipient area, as opposed to non-naturalized exotic species, whose fate is either extinction or persistence through human aid (Pyšek and Prach Reference Pyšek and Prach2003). Within these two groups, the assessment also categorized species according to their availability in Californian nurseries.
Areas at Risk of Invasion
Occurrence data from the 186 species were gathered from the Global Biodiversity Information Facility database (GBIF). Data from GBIF are derived from many sources ranging from museum specimens to citizen science data; every single species’ occurrence record in GBIF goes through a series of data-quality steps until it becomes available for the users (www.gbif.org). Occurrences from species’ native and introduced ranges (including records from California) were considered; this approach provides the best approximation of the range of niches a species can occupy and so can be used to understand its full potential (Jiménez-Valverde et al. Reference Jiménez-Valverde, Peterson, Soberón, Overton, Aragón and Lobo2011; Verbruggen et al. Reference Verbruggen, Tyberghein, Belton, Mineur, Jueterbock, Hoarau, Gurgel and De Clerck2013).
Before analysis, all records were carefully checked to match species’ taxonomy. We included occurrence records with geographic coordinates having at least two decimal places. Record occurrences having ≥1 km error or uncertainty (suspicious outliers) associated with the geographic coordinates were discarded. To avoid pseudo-replication, only one record per ˜4.5 km2 grid cell (based on the climatic variables resolution, 2.5 minutes) was used for model calibration. It is likely the data may exhibit spatial bias due to sampling effort, because the occurrences were not collected using a specific sampling methodology (Phillips et al. Reference Phillips, Dudík, Elith, Graham, Lehmann, Leathwick and Ferrier2009). To reduce the geographic sampling biases, a geographic thinning (1 record per 4.5 km) was performed on all occurrences using the spThin R package (Aiello-Lammens et al. Reference Aiello-Lammens, Boria, Radosavljevic, Vilela and Anderson2015). Species with fewer than 30 occurrences were not included; therefore, the analysis was carried out with 170 species (65 naturalized and 105 non-naturalized).
We used three SDMs to predict the species’ potential distribution: a generalized linear model, a random forest model, and a support vector machine model. Six climatic variables identified as important in driving plant distributions in the western United States (Rehfeldt et al. Reference Rehfeldt, Crookston, Warwell and Evans2006; Stephenson Reference Stephenson1998) were considered as predictors of species occurrence: annual mean temperature, maximum temperature of warmest month, minimum temperature of coldest month, annual precipitation, precipitation of wettest month, and precipitation of driest month. These six bioclimatic variables (raster layers at 2.5 arc-minute resolution, historical climate data for 1970 to 2000) were acquired from the WorldClim database (Fick and Hijmans Reference Fick and Hijmans2017). We examined collinearity among the six bioclimatic variables by running a Pearson correlation analysis. Annual mean temperature and annual precipitation were highly correlated (Pearson r > 0.7) to the other climatic variables and therefore were not considered to reduce the negative impact of multicollinearity in the modeling process.
Modeling was performed by randomly splitting the records into a calibration set (70% of the records) and a test set (30% of the records). The three SDM algorithms used in this study require absences or background data. Pseudo-absences were generated within the extent of the environmental rasters defined by the maximum and minimum latitude and longitude values from all the species occurrence data (Vasquez et al. Reference Vasquez, de Lima, dos Santos and Pinto2021). Using the selected method repeatedly under the SSDM package (default parameters) (Schmitt et al. Reference Schmitt, Pouteau, Justeau, de Boissieu and Birnbaum2017), a set of pseudo-absences was automatically generated for each SDM following recommendations from Barbet-Massin et al. (Reference Barbet-Massin, Jiguet, Albert and Thuiller2012) (e.g., for GLM: 10 runs of 1,000 randomly selected pseudo-absences; for RF and SVM: same as number of presences, 100 or fewer presence points, a minimum of 10 runs with 100 pseudo-absences). Each model was run five times, and the average AUC (area under the receiver operating characteristic curve) was used to evaluate model performance. AUC values vary from 0 to 1; values below 0.7 represent poor model performance, whereas AUC values close to 1 indicate a high predictive model performance. We also assessed the variable relative importance generated by the SSDM package (Schmitt et al. Reference Schmitt, Pouteau, Justeau, de Boissieu and Birnbaum2017), which computes a simple Pearson’s correlation r between predictions of the full model and the one without a variable and returns the score 1 − r: the higher the value, the more influence the variable has on the model.
Models were projected onto the California near-current (years 1970 to 2000, hereafter referred to as “current”) and future (year 2040) climatic conditions. Two GCMs (CNRM and MIROC) listed as good simulations of California’s historic climate (Pierce et al. Reference Pierce, Kalansky and Cayan2018) were used as future climatic scenarios. These two GCMs represent scenarios with the most extreme directional changes in precipitation (CNRM-wettest; MIROC-driest) and have shown an effect on species’ habitat suitability prediction in California (Riordan et al. Reference Riordan, Montalvo and Beyers2018). For each GCM, we considered two greenhouse gas scenarios (representative concentration pathways: RCP 4.5 and RCP 8.5) to create future projections. Each scenario defines a pathway in terms of the concentration of carbon in the atmosphere at any date: RCP 4.5 represents a target forcing of 4.5 W m−2 above the preindustrial baseline by 2100 and delivers a temperature increase of about 1.8 C; RCP 8.5 corresponds to a high greenhouse gas emissions pathway of 8.5 W m−2 and delivers a temperature increase of about 3.7 C by 2100 (IPCC 2014). Future bioclimatic variables generated for the two GCMs (CNRM-CM6-1 and MIROC6) and the two greenhouse gas emissions (RCP 4.5 and 8.5) were acquired from the WorldClim database (raster layers at 2.5 arc-minute resolution, future climate data for year 2040) (Fick and Hijmans Reference Fick and Hijmans2017).
Species’ suitability maps generated by each of the three models were transformed to binary maps (presence/absence maps) using the maximum sum of sensitivity and the specificity as a threshold cutoff value. With this approach, a threshold value for each species was calculated to maximize the agreement between the observed and predicted distribution (Liu et al. Reference Liu, White and Newell2013). Individual species’ binary maps were combined, and the potential distribution for each individual species was calculated as the grid cells where at least two out of three binary maps predicted the species occurrence. Finally, the potential distributions of the 170 species were merged to produce the risk maps for California—resulting in five main risk maps: current climatic conditions, two GCMs, and two RCPs. To identify species-rich areas or hot spots of invasion, risk maps’ cells were classified into four risk categories based on the number of species predicted to occur in a given cell (four equal intervals, range between 1 and the highest number of species predicted). All analyses were conducted using the SSDM package in the R environment and ArcGIS Desktop (ArcGIS Version 10.0, Environmental Systems Research Institute, Inc. [ESRI], Redlands, CA; R Core Team 2018; Schmitt et al. Reference Schmitt, Pouteau, Justeau, de Boissieu and Birnbaum2017).
Species Risk Assessment
A rapid-invasion risk assessment was carried out using the species’ potential distribution and some biological traits. The species’ potential distribution (predicted area) under current climatic condition was evaluated in relation to: California total area, number of ecoregions overlapping with predicted area, and the variation of the predicted area relative to the prediction under two future climatic scenarios (GCMs: CNRM and MIROC; RCPs: 4.5 and 8.5). Higher risk of establishment was given to species with a broader predicted area within California, overlapping with various ecoregions, and an increase in predicted area under two future climatic scenarios (Supplementary Table S1).
Three species’ biological traits were considered as factors that could facilitate the invasion process: growth form, reproduction mechanisms, and age of maturity. Studies suggest that herbs, grasses, and vines have higher invasion rates than other plant growth forms (Anning and Yeboah-Gyan Reference Anning and Yeboah-Gyan2007; Godoy et al. Reference Godoy, Richardson, Valladares and Castro-Díez2009; Johnson et al. Reference Johnson, Trammell, Bishop, Barth, Drzyzga and Jantz2020). Reproduction is a key factor in plant invasions. Effective reproduction mechanisms enable invasive plants to produce a large number of propagules to establish new populations and spread (Barrett Reference Barrett2011; Burns et al. Reference Burns, Pardini, Schutzenhofer, Chung, Seidler and Knight2013). Plant invasions have also correlated with high relative growth rate, small seed masses, and short juvenile period (Grotkopp et al. Reference Grotkopp, Rejmánek, Rost, Rejmanek and Rost2010; Rejmanek Reference Rejmanek1996). A higher risk was assumed for species classified as herbs/grasses/vines, with multiple reproduction mechanisms, and with a short time to reach maturity; information on species’ traits was gathered from publications and Internet resources (Supplementary Table S2).
The assessment was carried out using a scored approach assigning a value from 0 to 3 to each of the parameters (species’ potential distribution and biological traits). A total score was calculated by adding the individual score from each parameter; the lower the species’ total score, the lower the risk of it becoming invasive (Table 1).
List of parameters, range values, and scores used to run the species’ risk assessment. a

a Species’ parameters were scored from 0 to 3, the total score (sum of all parameter scores for a species) for a given species could vary from 3 to 16.
b Species’ predicted area in relation to California’s total area.
c Number of ecoregions intersected by a species’ predicted area (Hickman Reference Hickman1993).
d Difference between predicted area under current climatic conditions and predicted area under future climatic scenarios. For each general circulation model (GCM), an increase in predicted area needed to occur under both emission scenarios (representative concentration pathways [RCPs] 4.5 and 8.5) to be categorized as an increase for the GCM.
Results and Discussion
Areas at Risk of Invasion
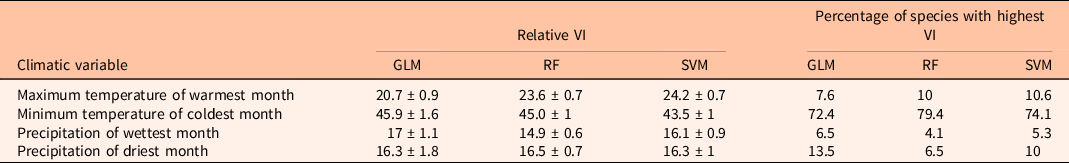
Species distribution models were fit for 170 species (65 naturalized and 105 non-naturalized) of the total 186 listed as potentially invasive plant species for California (Brusati et al. Reference Brusati, Johnson and DiTomaso2014). On average, the three models showed a very good AUC evaluation: GLM = 0.82 ± 0.004 SE, RF = 0.93 ± 0.002 SE, and SVM = 0.91 ± 0.003 SE. GLM models for two species showed an AUC below 0.7; however, these values were reasonably high (AUC = 0.68) (Supplementary Table S3). Therefore, these models were still considered to predict species’ distribution. Overall, the temperature of coldest month was the variable that consistently had the higher predictive power, whereas precipitation of wettest month had low importance across the three models (Table 2).
Relative variable importance (VI; average percentage ± SE) across all species and percentage of species with the highest VI for each species distribution model (SDM): generalized linear model (GLM), random forest model (RF), and support vector machine model (SVM).
The analysis predicted that under current climatic conditions, 99% of California shows suitable climatic conditions for at least one species. Most of California (78%) shows suitable conditions for 1 to 30 species, whereas a greater number of species (91 to 125) are predicted to occur in only 3.3% of the total area (Table 3). A high number of species are predicted to occur along the coast, particularly in the Central Western (CW) and South Western (SW) ecoregions, where 46% and 27% of these regions could be suitable for more than 60 species. The CW could be considered as a potential hot spot for new invasions, while a small number of species (1 to 30) are predicted in inland regions (Figure 1).
Variation in the percentage of predicted area by risk categories (no species predicted) relative to predicted area under current and future climatic conditions (GCMs: CNRM and MIROC; RCPs: 4.5 and 8.5). a

a GCM, general circulation model; RCP, representative concentration pathway.
b Negative values represent reductions in area with climate change.
California invasion risk map created by combining the 170 species’ potential distribution under current and future climatic conditions; for future climatic conditions (year 2040; global circulation models [GCMs]: CNRM, and MIROC; greenhouse emissions: representative concentration pathways [RCP] 4.5, and 8.5). Codes correspond to Jepson ecoregions; CaR: Cascade Ranges; CW: Central Western CA; SNE: East of Sierra Nevada; GV: Great Valley; MP: Modoc Plateau; DMoj: Mojave Desert; NW: North Western CA; SN: Sierra Nevada; DSon: Sonoran Desert; SW: Southwestern CA (Hickman Reference Hickman1993).

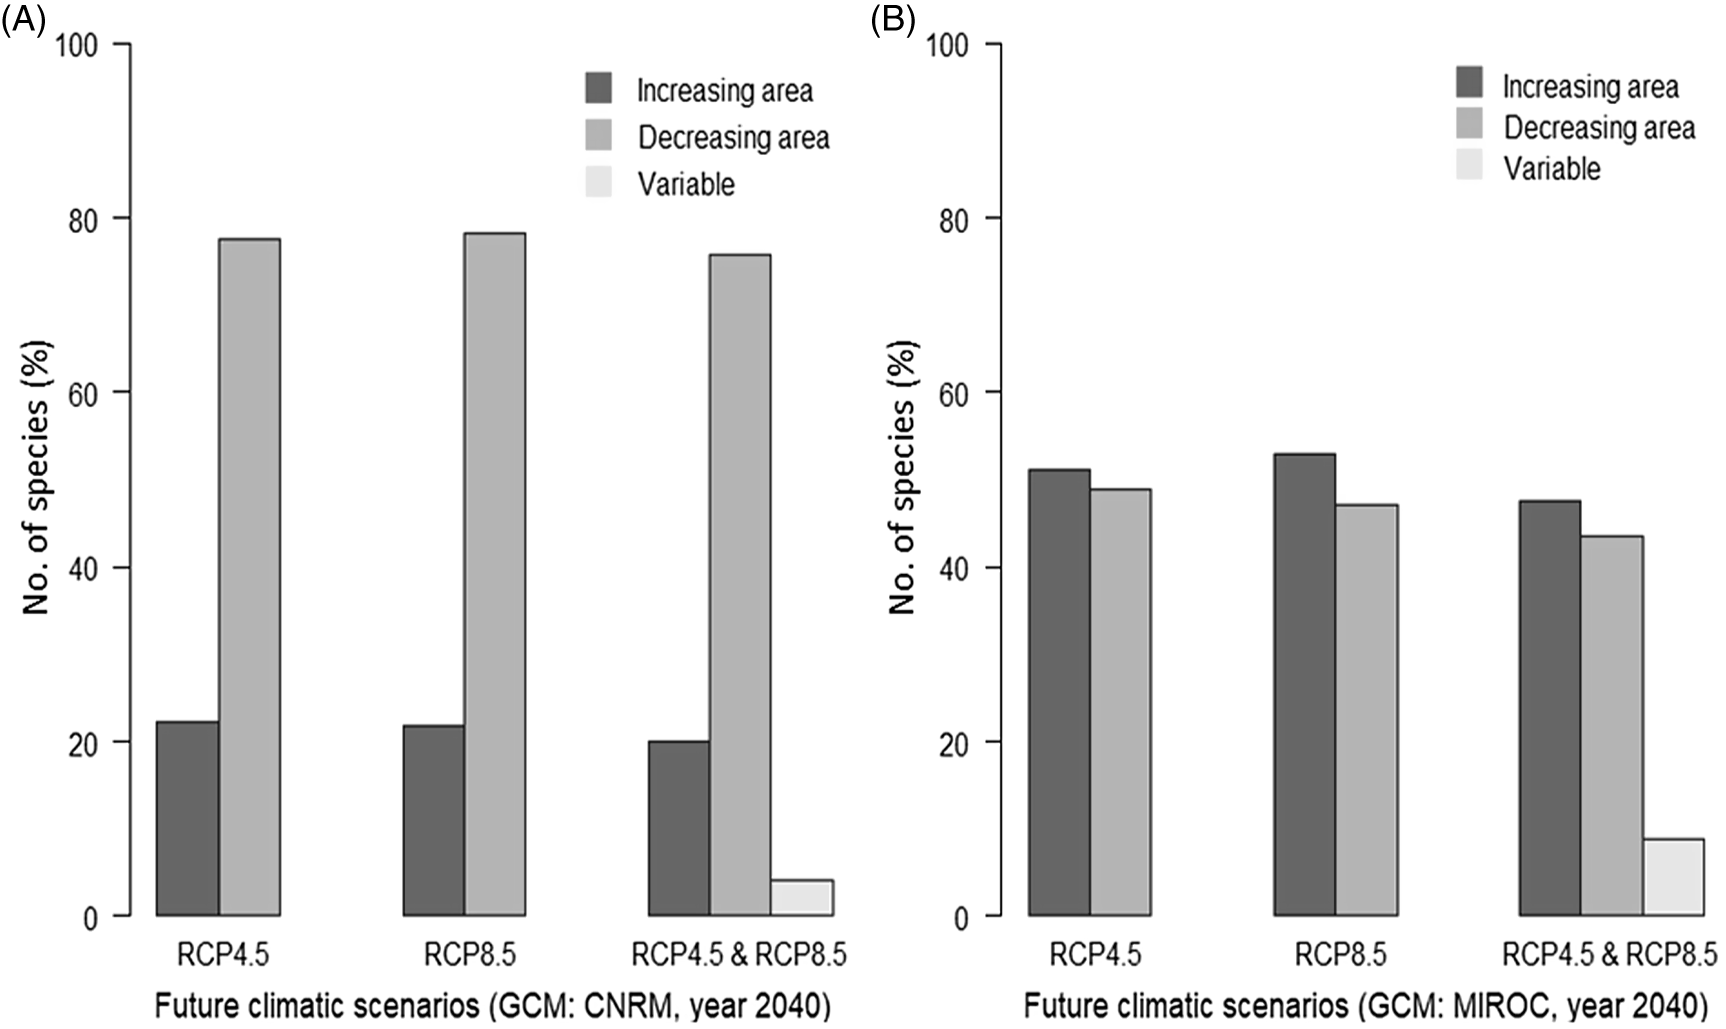
Overall, species’ distribution predicted under future climatic scenarios shows similar patterns to predictions under current climatic conditions (Figure 1). Climatic suitability for a greater number of species is predicted along the coast compared with the inland regions. Some level of variation on the predicted species richness by the two GCMs can be observed (Table 3). GCM CNRM predicted a decrease on the number of cells with high species richness under both greenhouse emissions (RCP 4.5 and 8.5). GCM MIROC predicted an increase on species richness under RCP 4.5 and a decrease under RCP 8.5. The effect of the two climatic scenarios (CNRM and MIROC) on individual species’ predicted area was different (Figure 2). Under climatic scenario CNRM, 20% of the species showed an increase in predicted area versus 47% under climatic scenario MIROC.
Effect of future climatic conditions (year 2040; representative concentration pathways [RCP] 4.5 and 8.5) on species’ predicted area in relation to species’ predicted area under current climatic conditions: (A) under climatic conditions generated by GCM CNRM and (B) under climatic conditions generated by GCM MIROC.
Species Risk Assessment
The risk of invasion for 170 ornamental plants listed as future potential invasive species for California was investigated using species’ potential distribution and some biological and ecological attributes. The species include 64 families, for which Fabaceae (21 spp.), Asteraceae (15 spp.), and Iridaceae (10 spp.) account for 27% of the total number of species. Regarding growth form, the species list includes 76 herbs/grasses/vines (45%), 54 woody/shrubs (32%), and 40 tree species (23%); as per habitat preference, 94% are terrestrial species (Supplementary Table S2).
The calculated species’ total risk score varied from 3 to 15. Using a three equal score intervals (lowest score +4), species were grouped within three risk categories: low risk (total score: 3 to 7), moderate risk (total score: 8 to 11), and high risk (total score: 12 to 15) (Table 4; Supplementary Table S4). The evaluation ranked 38 species on top of the list as high-risk species, 112 species as moderate risk, and 20 species as low risk. Regarding families, 67% of the Asteraceae species and 30% of the Iridaceae species ranked as high risk, whereas most of the Fabaceae species ranked as moderate and low risk (76% and 24%, respectively). Out of the 38 species categorized as high-risk species, herbs/grasses/vines accounted for 78%.
Species ranked as top 10 according to the assessment. a
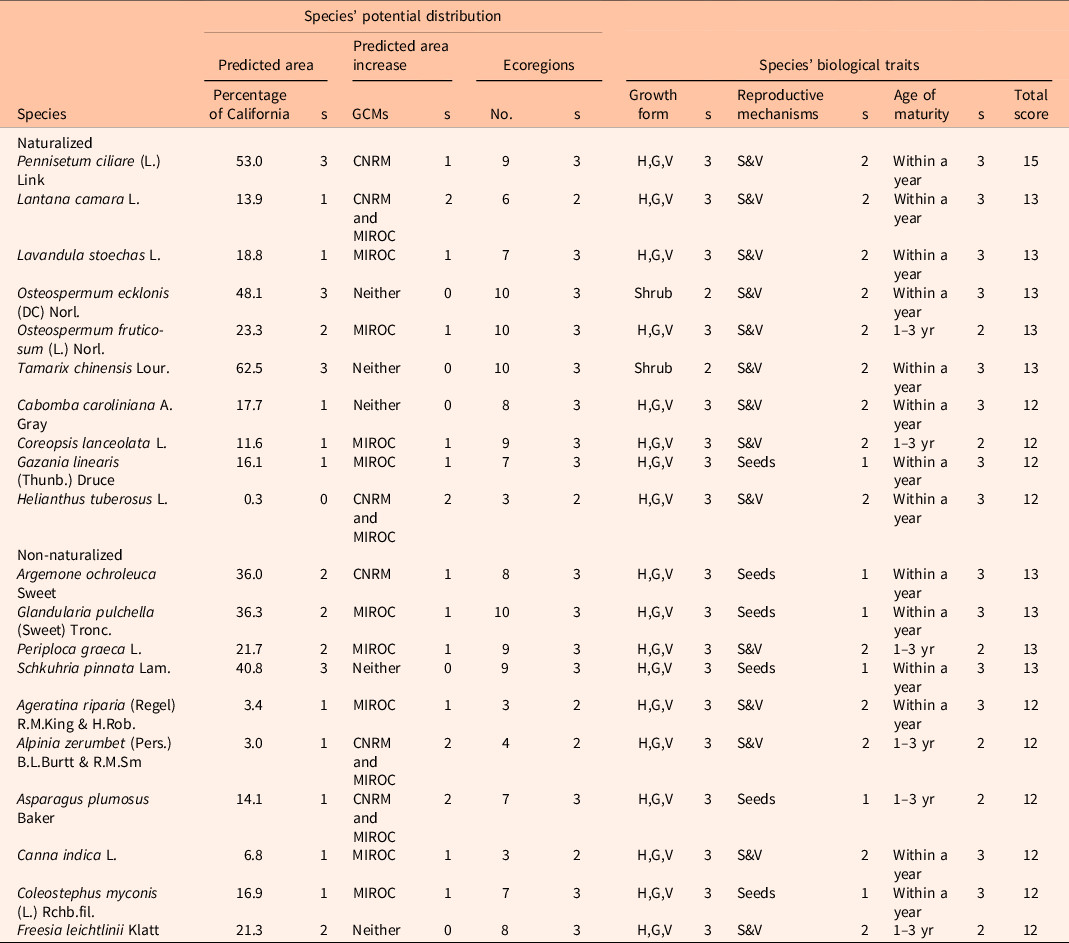
a List of parameters and scores (s) used for the risk of invasion evaluation: growth form: H,G,V, herb, grass, or vine; reproductive mechanisms: S&V, seeds and vegetative.
b GCM, general circulation model.
According to Brusati et al. (Reference Brusati, Johnson and DiTomaso2014), out of the 170 species used on this assessment, 65 have been recorded as naturalized and 105 as non-naturalized in California. Because naturalized species are already established in California, the probability of these species becoming invasive is considerably higher than for non-naturalized species; results of the assessment are presented by naturalization status (Table 4). Within naturalized species, the risk assessment ranked 19 species as high risk, a second group of 41 species as moderate risk (score: 8 to 11), and 5 species as low risk. Species such as lantana (Lantana camara L.), french lavender (Lavandula stoechas L.), five-stamen tamarisk (Tamarix chinensis Lour.), and birdwood grass [Pennisetum ciliare (L.) Link] ranked on top, and these species are considered wildfire hazards (Supplementary Table S2). Within non-naturalized species, 19 species were ranked as high risk, 71 species as moderate risk, and 15 as low risk. Overall, the proportion of the number of species by risk categories follows the naturalization status trend (Figure 3A). Most of the naturalized and non-naturalized species were ranked as moderate risk; however, the number of species classified as high risk is greater for naturalized species. Within the growth forms, most of the species were classified as moderate risk (Figure 3B). However, the proportion of herbs, grasses, and vine species ranked as high risk was considerably greater than for shrubs and trees.
Number of species within the invasion risk categories: (A) by naturalized status in California and (B) by growth forms.

Using the potential distribution of 170 plant species, we created risk maps of invasion under “current” and future climatic conditions for California. The influence of climatic conditions on species distribution at regional scales is well known (Chapin and Díaz Reference Chapin and Díaz2020). The use of temperature and precipitation as predictors of species distribution is very common and has provided a reasonably good approximation of species’ environmental suitability (Bradie and Leung Reference Bradie and Leung2017; Bucklin et al. Reference Bucklin, Basille, Benscoter, Brandt, Mazzotti, Romanach, Speroterra and Watling2015). The contributions of the four climatic variables were consistent across models and species (Table 1). Results of the modeling indicate that extreme temperatures explained the distribution of most of the species used for this assessment.
Our analysis revealed that most of California would have suitable climatic conditions for a relatively low number of species. A higher number of species are predicted along the coastline, with the highest concentration in the CW and SW regions. Studies have shown that an invasive species is more likely to invade areas with conditions similar to those where it is indigenous (Thuiller et al. Reference Thuiller, Richardson, Pyšek, Midgley, Hughes and Rouget2005). Most of the species used for this assessment originate from regions with a Mediterranean climate; therefore, suitable conditions for these species would be expected along the coastline, where the climatic conditions are likely to match species’ climate requirements. These areas identified as having a high risk for invasion are also known to be rich in plant biodiversity and endemism (Kraft et al. Reference Kraft, Baldwin and Ackerly2010; Loarie et al. Reference Loarie, Carter, Hayhoe, McMahon, Moe, Knight and Ackerly2008). There is great potential for undesirable impacts to these ecologically valuable and vulnerable ecoregions—particularly to evergreen and deciduous forest, woodland, chaparral, and open grassland vegetation types. As in other Mediterranean regions, the climate in California is defined by cool wet winters and hot dry summers (Harrison et al. Reference Harrison, Spasojevic and Li2020; Rundel et al. Reference Rundel, Arroyo, Cowling, Keeley, Lamont and Vargas2016). These climatic conditions, which vary considerably by ecoregion, have shaped native plant diversity, and vegetation communities might also be an important factor for future plant species establishment (Lenihan et al. Reference Lenihan, Drapek, Bachelet and Neilson2003; Pyšek et al. Reference Pyšek, Pergl, Essl, Lenzner, Dawson, Kreft, Weigelt, Winter, Kartesz and Nishino2017).
Future species’ distribution varied widely depending on the climatic scenario considered. The wettest climatic scenario, CNRM (RCP 4.5 and 8.5), projected a reduction in invasive species richness, whereas the driest scenario, MIROC (RCP 4.5), projected an increase. Contrary to the negative effects that extreme climatic conditions such as those generated by climatic scenario MIROC might have on California native vegetation (Riordan et al. Reference Riordan, Montalvo and Beyers2018), a higher number of species (˜50%) increased the predicted distribution under the MIROC climatic scenario. Extreme variations in climatic conditions are expected to have important impacts on distribution patterns of native and invasive plant species (Lenihan et al. Reference Lenihan, Drapek, Bachelet and Neilson2003; Sandel and Dangremond Reference Sandel and Dangremond2012); however, the magnitude and direction of these impacts might depend on the climate change scenario and the species-specific responses to climatic conditions (Bellard et al. Reference Bellard, Thuiller, Leroy, Genovesi, Bakkenes and Courchamp2013; Finch et al. Reference Finch, Butler, Runyon, Fettig, Kilkenny, Jose, Frankel, Cushman, Cobb, Dukes, Hicke and Amelon2021; Guan et al. Reference Guan, Guo, Chen, Li, Liu, Gong and Ge2020; Petitpierre et al. Reference Petitpierre, McDougall, Seipel, Broennimann, Guisan and Kueffer2016).
Informing government and society about areas at risk of invasion is necessary to guide management efforts and secure economic resources (del-Val et al. Reference del-Val, Balvanera, Castellarini, Espinosa-García, Murguía and Pacheco2015). To our knowledge, this is one of the first assessments using a large number of species to produce an invasion risk map for California. These maps should be used as an early screening tool to identify potential areas suitable for invasion and spread (Montemayor et al. Reference Montemayor, Dellapé and Melo2015; Pearson and Dawson Reference Pearson and Dawson2003), allowing for a coarse identification of areas where effort should be focused to look for particular plants or areas at risk.
The list of ornamental plant species produced by Brusati et al. (Reference Brusati, Johnson and DiTomaso2014) was created on the basis of species invasiveness in regions with similar climatic conditions or states neighboring California. Although all these species are at risk of becoming invasive in California, given the variety of climatic and topographic conditions, the magnitude of the risk would be expected to vary between species. Using the species’ potential distribution and some biological attributes, we performed a rapid screening to rank and categorize species according to the calculated invasion risk. High-risk naturalized species should have the highest priority; these species have established and created self-sustainable populations, making them more likely to become invasive. For these species, monitoring should be considered to assess the spatial distribution and population dynamics with the aim of detecting species invasiveness behavior. As a precautionary principle for non-naturalized high-risk species, interventions should be focused on preventing species arrival; for those already introduced, state trade regulation might be required.
The scope of the assessment is the entire state of California; however, the list can be modified to generate a list of priority species at local scales. Although this rapid assessment does not replace other, more detailed risk assessment schemes, it can be used as an initial step in the prioritization process. Moreover, this assessment should be considered to be a dynamic process; the status of some species might change, and new invasive species are likely to arrive, so this ranking and categorization will need to be modified accordingly (Conser et al. Reference Conser, Seebacher, Fujino, Reichard and DiTomaso2015).
Predicting the distribution of an invasive species is not an easy task, and it becomes even more challenging when the exercise includes a large number of species. The invasion process is complex and involves the interaction of several biotic and abiotic factors that might influence the species’ establishment and spread (Gantchoff et al. Reference Gantchoff, Wilton and Belant2018; Lee and Lee Reference Lee and Lee2006). Additionally, predicted distributions are sensitive to data and modeling processes (Sofaer et al. Reference Sofaer, Jarnevich, Pearse, Smyth, Auer, Cook, Edwards, Guala, Howard, Morisette and Hamilton2019; Zurell et al. Reference Zurell, Franklin, König, Bouchet, Dormann, Elith, Fandos, Feng, Guillera-Arroita and Guisan2020). As with any modeling effort, our approach is subject to constraints and limitations; for example, using records from species’ native and introduced ranges to fit the models risks overestimating species’ predicted distributions (Bradley Reference Bradley2013; Jiménez-Valverde et al. Reference Jiménez-Valverde, Peterson, Soberón, Overton, Aragón and Lobo2011). Further, it is likely the data may exhibit spatial bias due to sampling effort, because the occurrences were not collected using a specific sampling methodology (Phillips et al. Reference Phillips, Dudík, Elith, Graham, Lehmann, Leathwick and Ferrier2009). Additionally, studies have shown variability among model predictions of species moving into new environments (Araújo and New Reference Araújo and New2007; Webber et al. Reference Webber, Yates, Le Maitre, Scott, Kriticos, Ota, McNeill, Le Roux and Midgley2011). We have tried to address limitations (e.g., selecting uncorrelated environmental variables, applying geographic thinning to reduce the geographic sampling biases, using three SDMs to reduce variability, generating pseudo-absences according to each model), aiming to reduce the source of error and increase the models’ predictive ability. Species’ predicted distributions and future shifts in range are approximations and do not represent an absolute measure of site suitability or change. Our risk analysis focuses on distribution patterns across the landscape rather than an accurate potential invasion area.
Despite assumptions and difficulties in evaluating predictions accurately (Araújo and Peterson Reference Araújo and Peterson2012; Barbet-Massin et al. Reference Barbet-Massin, Rome, Villemant and Courchamp2018), SDMs are a valuable tool to assess invasion risk and assist in designing effective management strategies (Bradley et al. Reference Bradley, Wilcove and Oppenheimer2010; Barbet-Massin et al. Reference Barbet-Massin, Rome, Villemant and Courchamp2018). This risk analysis is an important step toward the development of early warning systems to prevent the arrival or establishment of new potential invasive plant species in California.
Acknowledgments
We are grateful for the contributions made by Rachel Atkinson and Ryan Boynton to earlier versions of this article. This research received no specific grant from any funding agency or the commercial or not-for-profit sectors. No conflicts of interest have been declared.
Supplementary material
To view supplementary material for this article, please visit https://doi.org/10.1017/inp.2021.23


 Open access