


The introduction of immune-checkpoint inhibitors (ICIs) over the last decade has represented a major development in cancer treatment (Reference Martin-Liberal, Ochoa de Olza and Hierro1). Single-agent or combination ICI therapies have been approved for many advanced cancers, and their clinical application continues to grow (Reference Mittra, Takebe and Florou2). ICIs have a different mechanism of action compared to standard therapies such as chemotherapies or targeted therapies. Whereas the latter directly target cancer cells, ICIs target immunocompetent cells and stimulate them to attack and eliminate the tumors (Reference Marshall and Djamgoz3). Unlike standard therapies, which act to slow tumor growth and metastasis, ICIs offer significant benefits on the tumor eradication and long-term remission (Reference Farkona, Diamandis and Blasutig4). In clinical trials, to date, as well as in real-world studies, ICIs have demonstrated their efficacy in extending overall survival (OS) compared to standard therapies (Reference Topalian, Hodi and Brahmer5–Reference Assie, Corre and Giaj Levra9).
All new treatments require a health technology assessment (HTA) to inform decisions on reimbursement or pricing. In France, HTA is performed by the National Authority for Health (“Haute Autorité de Santé” [HAS]) (Reference Toumi, Motrunich and Millier10). Under certain conditions, cost-effectiveness (CE) assessment is mandatory (11). The CE analyses require economic models to quantify the incremental impact of the new intervention on costs and on health outcomes compared to the current standard of care over a lifetime or a specified period (Reference Latimer, Abrams and Lambert12–Reference Gray, Sullivan and Latimer15). At the time of submission to HAS, the duration of follow-up of randomized controlled trials (RCTs) for cancer treatments is often limited. Unless most patients have died by the end of follow-up, extrapolation of OS over a predefined time horizon is required to estimate the long-term benefit of the intervention (Reference Latimer, Abrams and Lambert12;Reference Latimer13). The accuracy of such estimates is heavily dependent on the choice of the model used to extrapolate the data; inappropriate selection can contribute to unreliable and biased CE results.
Until recently, standard parametric models were the preferred method for extrapolating observed survival data in health economic models developed for cancer treatments (Reference Latimer13;Reference Bullement, Meng and Cooper16;Reference Castanon, Sanchez-Arraez and Alvarez-Mancenido17). However, the shapes of the hazard functions from these models can capture both within and beyond the trial, but are limited and may be unsuitable for estimating the lifetime benefit of ICI. There is growing evidence that more sophisticated, flexible survival models may be better able to capture delayed treatment responses and long-term survival observed with these drugs (Reference Rutherford18). Modeling the “tail” of Kaplan–Meier (KM) curves is particularly challenging (Reference Quinn, Garrison and Pownell19;Reference Pocock, Clayton and Altman20), even though this is critical for the assessment of ICIs, where a plateau may occur at unknown times and levels after initiation of therapy (Reference Schadendorf, Hodi and Robert6). The publication of extended follow-up data from RCTs is an opportunity to assess retrospectively the accuracy of OS predictions in CE assessments and to explore differences in best-fitting models between the CE assessments and medium- or long-term data from RCTs of ICIs.
The objectives of this study were twofold. The first objective was to evaluate the accuracy of estimates of long-term OS predicted in French CE assessment reports for ICIs. This involved comparison of OS extrapolated from RCT data available at the time of submission to actual OS data collected during extended follow-up of these same RCTs. The second objective was to identify models providing the best fit to the observed survival data from extended follow-up and to compare the difference in restricted mean survival time (RMST) of these projections with the ones selected in the CE assessments.
Methods
Identification and Selection of CE Assessment Reports
The HAS Web site was searched for all published assessments of pharmaceutical products by the economic evaluation committee (CEESP) of the HAS since inception (2013) until 15 May 2020 (cutoff) (21). Only assessments related to ICIs indicated for the treatment of advanced or metastatic cancer were retained. In a second step, the clinicaltrial.gov Web site, PubMed database, and conference proceedings for the American and European Societies for Clinical and Medical Oncology were searched for publications of longer-term follow-up data from the RCTs used in the CE assessment. The search algorithm is presented in Supplementary Material 2.
For the first phase of the study, RCTs were retained if at least 6 months of extended follow-up data since those used in the CE assessment report were available to identify potential differences between projected and observed OS. This cutoff was selected assuming it would be difficult to observe difference in OS in a shorter time frame than 6 months. For the second phase, at least 18 months of extended follow-up data from the RCTs were required to provide sufficient additional OS data for fitting a set of models.
Data Extraction
The following information from the RCT used in the CE assessment reports was extracted: nonproprietary name of the ICI, the indication, RCT identifier, the duration of follow-up for OS, and the maturity of data, defined as the proportion of deaths across all patients included in the ICI arm at the time of the data cutoff. The type of model selected to extrapolate OS, the selected time horizon, and OS at specific landmarks were retrieved from the French CE reports. In the published reports of extended follow-up of the RCT, duration of follow-up and survival probabilities with confidence intervals at similar time points to those selected in the assessment report were extracted. OS were documented at the most robust available follow-up date, which was identified as either the one reported in the publication or, if not relevant, an earlier date where at least 10 percent of the patients were still at risk (Reference Tremblay, Haines and Briggs22). The extraction was performed separately by two operators (S.B. and V.G.). Disagreements between operators were resolved through discussions with senior authors (J.C. and S.R.).
Data Analysis
Extrapolated survival curves obtained from French CE assessments were digitized and then plotted in R software to evaluate the reliability of the digitization and obtain long-term survival predictions. Kaplan–Meier curves for OS for the ICIs in the identified clinical trials with extended-follow-up were digitized using Engauge Digitizer v3.0. We then applied the Guyot algorithm on Kaplan–Meier curves from clinical trials to obtain pseudo-individual patient data (IPD) (Reference Guyot, Ades and Ouwens23). The accuracy of digitization was validated by comparing median OS between the RCTs and the pseudo-IPD and with visual inspection between the generated and published Kaplan–Meier curves.
Part 1: Descriptive Comparison of OS between Extrapolated and Actual Data from Extended Follow-up of RCTs
Difference in OS was calculated between the most robust follow-up time points in the extended follow-up of RCT and the same time points of the extrapolated OS curves in the CE assessment reports. The relative difference was expressed as a percentage of the observed survival probability, and the absolute difference was expressed as a percentage point difference. In the absence of a robust method to quantify the precision of these differences, they were assigned to one of four classes, considered negligible (≤±5 percent), minor (>±5 percent and <±11 percent), moderate (≥±11 percent and <±20 percent), and major (≥±20 percent).
Relative differences results were presented according to the cancer type, the extended follow-up available, the model used for extrapolating OS in the CE assessment report, and the maturity of data at the time of the submission.
Part 2: Evaluation of Extrapolation Methods
Different extrapolation models were applied to the pseudo-IPD generated from the OS Kaplan–Meier curves with at least 18 months of extended follow-up. Methods for extrapolation of survival data used approaches recommended in the published literature as directed in the HAS methods guide (Reference Latimer13;14;Reference Rutherford18;Reference Jackson24). Standard parametric models (Gompertz, Weibull, log-logistic, lognormal, gamma, and generalized gamma) and spline-based models (normal, odds, and hazard with one and two knots) were tested. For one-knot spline model, the knot was located at 50 percent survival. For two-knot spline model, these knots were placed at 33 percent and 67 percent survival, the flexsurv R package default (Reference Jackson24). The number of knots was limited to avoid being too specific to the curve. Cox proportional hazards regression model were not tested since data were not complete in most extended follow-up RCTs (Reference Latimer, Abrams and Lambert12).
Goodness of fit of the different extrapolations to the extended follow-up RCT OS data was assessed using Akaike’s information criterion (AIC) (Reference Akaike25) and the Bayesian information criterion (BIC) over the entire KM curve (Reference Schwarz26). All the models were classified according to their associated AIC. Models with the lowest AIC and BIC were selected and defined as the best-fit and second best-fit models (Reference Burnham and Anderson27). To confirm the selection, the goodness of fit of the model to the smoothed hazard rate was evaluated (Reference Kenneth28), as well as the projected versus observed OS.
Extrapolated survival curves selected in the CE report were digitized and presented (i.e., “Submitted function”) to observe the differences between the extrapolation made at the time of the submission and the ones with extended follow-up of RCT.
The RSMT, estimated as the area under the survival curve over a given time horizon (Reference Royston and Parmar29), was calculated for both the best-fit models and the second best-fit models. Finally, the difference in RMST between the extrapolation from the CE assessment and the one selected in our analysis was calculated.
All survival analyses were implemented on RStudio Software v4.0.0. Extrapolations with standard parametric or spline-based models were performed using flexsurv R package, (Reference Jackson24;Reference Royston and Parmar30), whereas hazard plots were produced with muhaz R package (Reference Kenneth28).
Results
Identification of CE Assessment Reports
Overall, 121 CE assessment reports were available on the HAS Web site, but only seventeen were related to ICIs in advanced or metastatic cancer (Figure 1). Six of them were excluded from the analysis due to the lack of published 6-month extended follow-up data (n = 4), the analysis population difference between the assessment report and the extended follow-up of RCT (n = 1), or the CE assessment report was a resubmission (n = 1). The characteristics of the remaining eleven assessments studied in Part 1 are presented in Table 1. The seven assessments evaluated in Part 2 are presented in Table 2.
PRISMA flow diagram illustrating the selection of French cost-effectiveness assessment reports selection.

Characteristics of Selected Case Studies

a Proportion of patients dead at the data cutoff across all patients randomized in the immune-checkpoint inhibitor arm.
b Unusual approach: Kaplan–Meier curve for the 60 first weeks followed by external data (Schadendorf et al. until 6.2 yr and Balch et al. between 6.2 yr and 10 yr).
c These models were performed piecewise, with the survival Kaplan–Meier curve until a selected time point, and the data extrapolated thereafter. For the other evaluations, extrapolation started from randomization.
d Confidence interval calculated from the digitization.
Abbreviations: 1L, first line; 2L, second line; FU, follow-up; HR, hazard ratio; KM, Kaplan–Meier; la, locally advanced; m, metastatic; N.A., not available; NSCLC, non small-cell lung cancer; NSQ, non squamous cell; OS, overall survival; RCC, renal cell carcinoma; RCT, randomized controlled trial; SQ, squamous cell; UC, urothelial carcinoma.
Five assessment reports presented the CE of pembrolizumab as monotherapy or in combination with chemotherapy. The other reports were related to either nivolumab in monotherapy (n = 4), nivolumab in combination with ipilimumab (n = 1), or durvalumab (n = 1). The selected CE reports referred to assessments in lung cancer (n = 6), melanoma (n = 2), renal cell carcinoma (RCC; n = 2), and urothelial cancer (n = 1). The median follow-up of RCT at the submission ranged from 8.3 to 25.9 months. For six of the CE assessment reports, the extrapolation was performed from randomization, whereas a piecewise approach was adopted in the remaining five reports. In the first case, a variety of statistical models were used for the extrapolation. For the piecewise approach, the initial section of the survival curve was modeled using the Kaplan–Meier function up to a predefined time point, whereafter an exponential (n = 3) or a log-logistic model (n = 1) was applied. For pembrolizumab in metastatic melanoma, an “atypical” approach was considered (Kaplan–Meier curve for the 60 first weeks and then OS data from pooled clinical trials and a registry).
Extended OS Follow-up Available
For the eleven retained RCTs for which at least 6-month extended follow-up data were available, the mean additional duration of this extended follow-up period was 28.2 months (range: 6–52 mo; Table 1). The available extended follow-up duration was less than 1 year in two case studies, and more than 3 years in four studies.
Comparison of Extrapolated and Observed OS from Extended Follow-up of RCT
Actual long-term OS was underestimated in 73 percent of the CE assessment reports (n = 8). Overall, the mean relative difference was −13 percent (range: −38 percent, +10 percent [Figure 2]; median: −15 percent; IQR: −26 percent, 0.4 percent). The mean absolute percentage point difference was −3 percent (range: −10 percent; +6 percent; Supplementary Material 3). In five cases, the extrapolated survival fell outside the 95 percent confidence interval of the OS observed in the extended follow-up. OS was under or overestimated by more than 5 percent in the majority of CE assessment reports (n = 8). In six cases, long-term OS was underestimated by >5 percent, including five cases where it was underestimated by greater than 20 percent (i.e., major; Figure 2). Only two CE assessment reports overestimated the long-term OS with a difference greater than 5 percent (namely, durvalumab in nonsmall-cell lung cancer [NSCLC] and pembrolizumab in urothelial carcinoma). Negligible differences were observed in the remaining three CE opinions. Unreliable estimates of OS were observed across all types of ICIs and indications.
Relative difference between extrapolated and observed OS in extended follow-up of randomized clinical trial (RCT). Studies are numbered as in Table 1. The numbers above or below the columns indicate the relative difference between the extrapolated overall survival (OS) estimate and the observed OS, expressed as a percentage. Gray columns: negligible difference (≤±5 percent); blue columns: minor overestimation of survival (>5 percent and <10 percent); beige columns: moderate underestimation of survival (>10 percent and <20 percent); green columns: major underestimation of survival (≥20 percent). The bars above the graph indicate the additional duration of follow-up (FU) between the cutoff point in the RCT used in the extrapolation and that used in the long-term extension of the same RCT. Cancer type: M, melanoma; NSCLC: non small-cell lung cancer; RCC: renal cell carcinoma; UC: urothelial carcinoma. Therapy: CT, chemotherapy; D, durvalumab; I, ipilimumab; ICI, immune-checkpoint inhibitor; N, nivolumab; P, pembrolizumab. Extrapolation function: exp, exponential; GG, generalized gamma; HR, hazard ratio; KM, Kaplan–Meier; LL, log logistic; LN, log normal; nov, “atypical” approach; Spline-2k-N, spline two-knot normal.
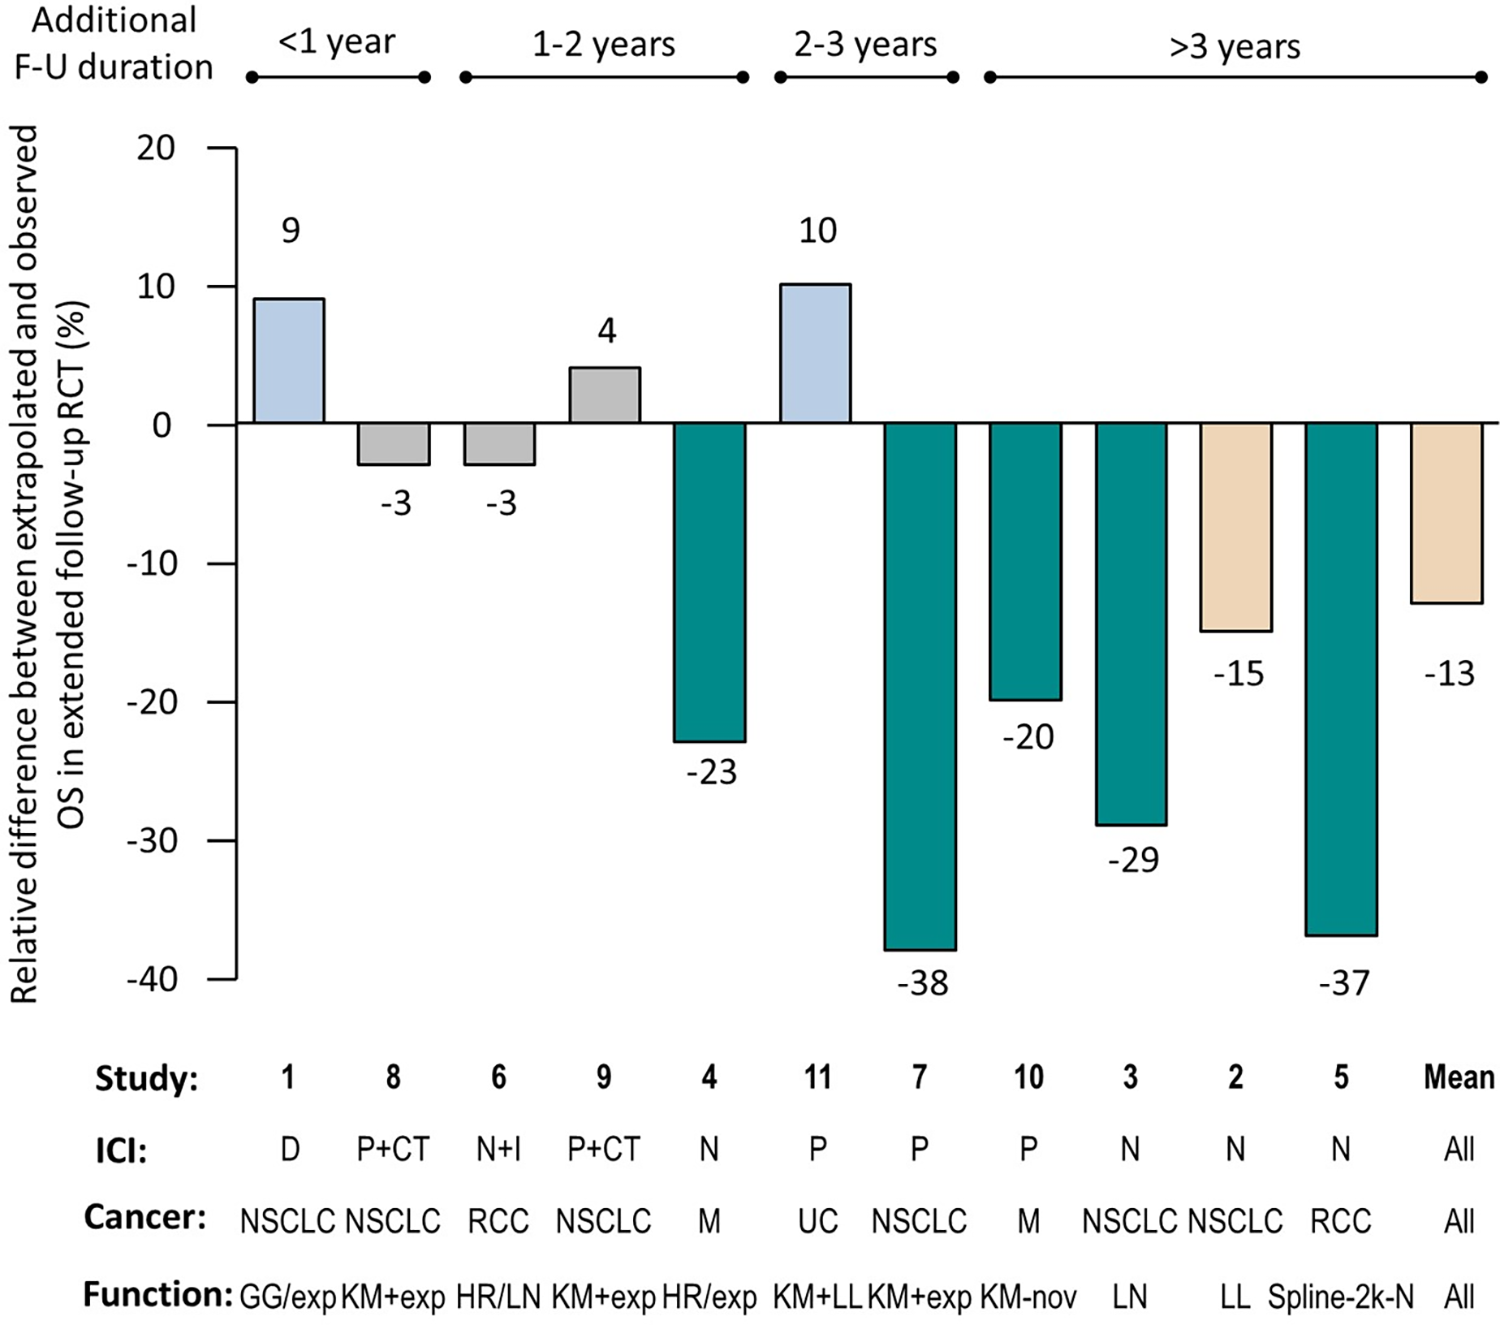
Unreliable estimates greater than 5 percent of OS were observed whatever the model used to fit the data (Figure 2). However, the discrepancy between estimated and observed OS was larger for RCTs with longer extended follow-up since the cutoff date for extrapolation used in the CE assessment report. This underestimation was most pronounced when the extended follow-up was greater than 3 years, with a mean relative difference of −25 percent.
In addition, no trend was observed between the maturity of the data (number of events at the time of the submission) at the time of the CE assessment reports and the accuracy of the OS predictions (Figure S9 in Supplementary Material 4).
Exploratory Evaluation of Extrapolation Methods
Seven CE opinions (52–58) had the required ≥18 months of extended follow-up to be included in Part 2 of the study. The time horizon for extrapolation was 10 years in all cases with the exception of the study of pembrolizumab in urothelial carcinoma (5 years). Four reports concerned studies of nivolumab, and the remaining three pembrolizumab. Overall, extrapolated OS was underestimated in 71 percent of the assessment reports. Only one projection overestimated the long-term OS (pembrolizumab in urothelial carcinoma; KeyNote 045). Overall, the relative difference in OS between the extrapolated and observed values was at least of 10 percent. No single model consistently provided the best fit to the observed data in the extended follow-up RCT, although the generalized gamma model performed the best in three of the seven (43 percent) data sets evaluated (Table 2). The best-fit selected model in our study was the same as that used for the CE assessment report in only one case, namely the log-logistic function used for assessment of nivolumab in NSCLC based on the CheckMate 017 study. In four out of seven cases, the difference in RMST between the best-fit extrapolation and that used in the CE assessment report was at least 5 months over the predefined time horizon (RMST ranging from −1.7 to 17.0 mo).
The models that provided the second best fit were also compared. The RMST ranged from −2.0 to 16.4 months (Table 2). Spline one-knot normal model was the second best fit in three cases. The difference in RMST between the best and second best fit was limited.
Best-Fit and Second Best-Fit Models to OS Kaplan–Meier Curves with at Least 18-Month Extended Follow-up
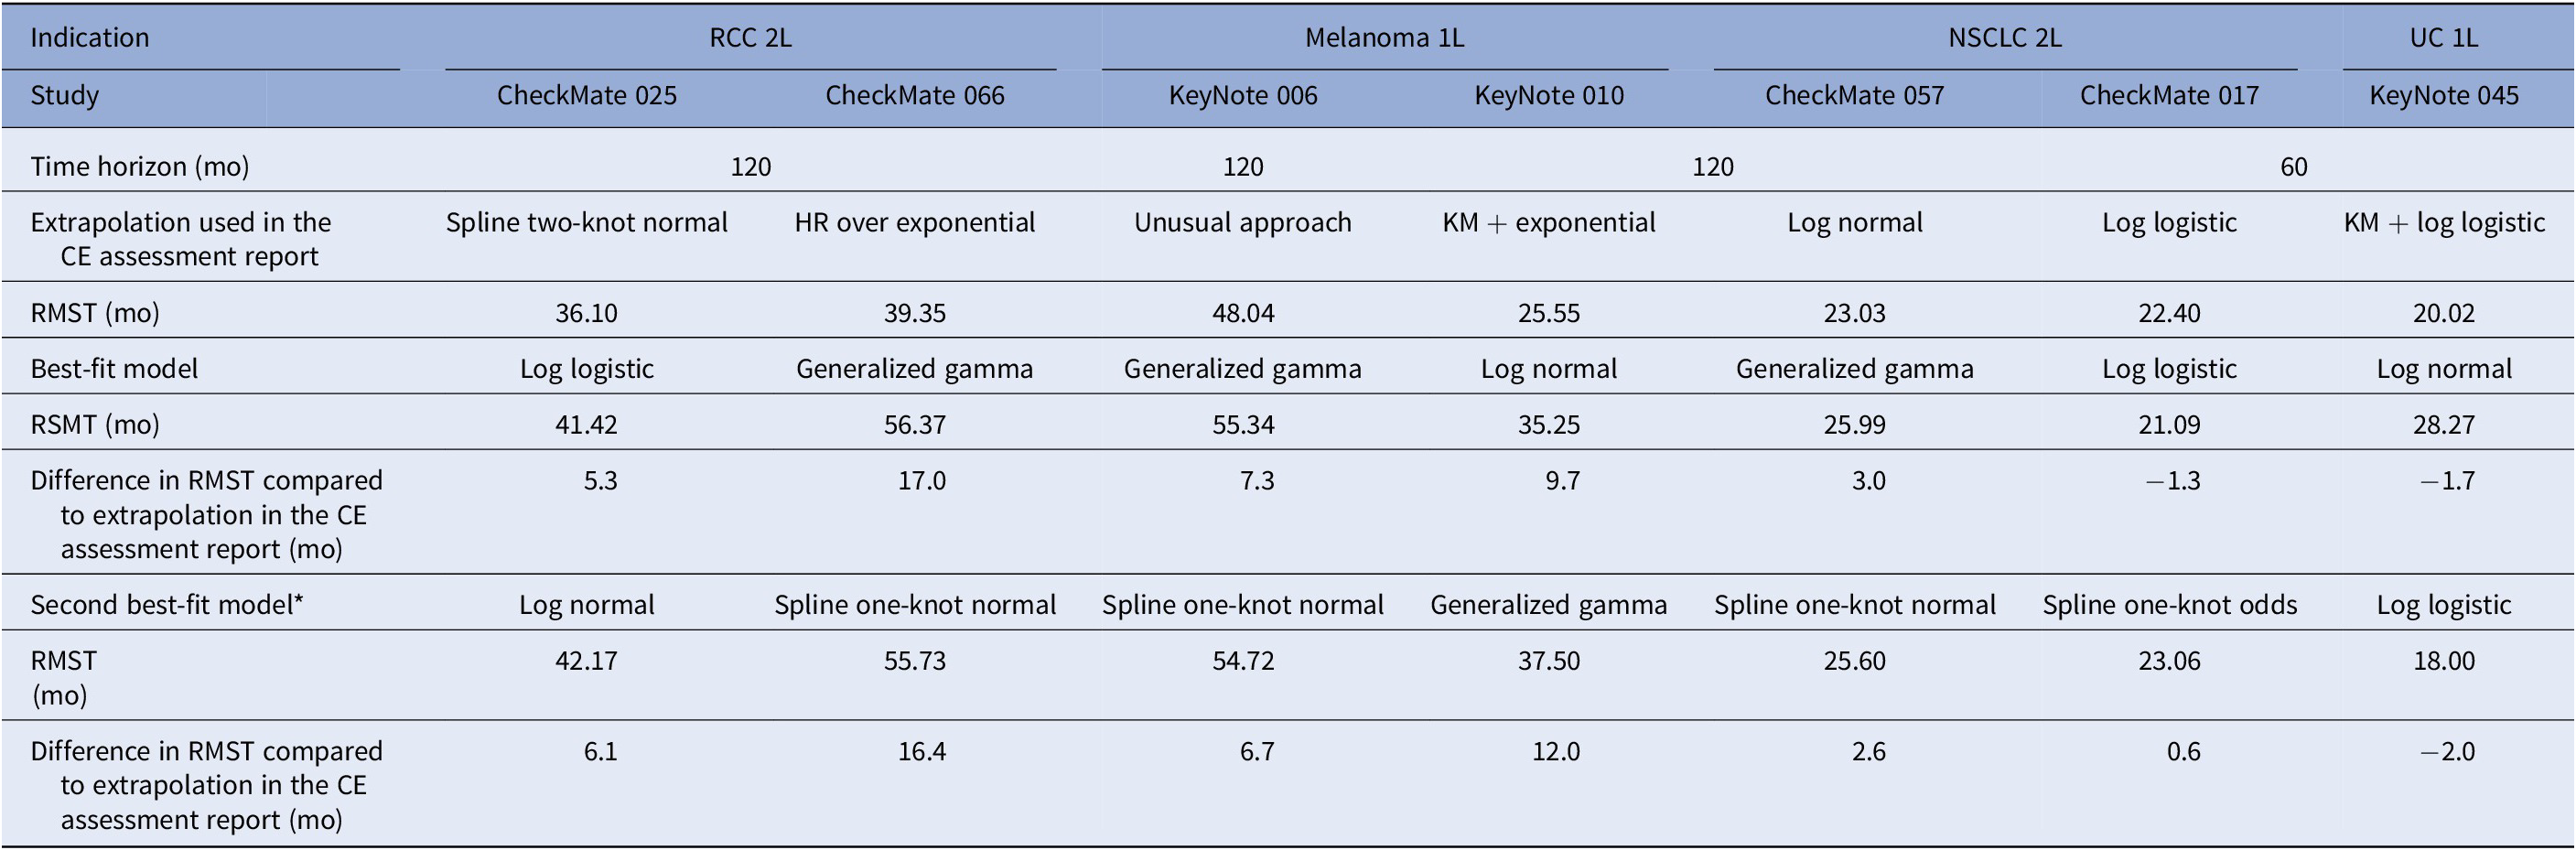
Abbreviations: HR, hazard ratio; KM, Kaplan–Meier; NSCLC, non small-cell lung cancer; OS, overall survival; RCC, renal cell carcinoma; RMST, restricted mean survival time; UC, urothelial cancer.
The benchmark between the best-fit models and the one used in the CE assessment report for all studies is provided in Supplementary Material 1.
Discussion
This is the first study assessing the accuracy of predicted OS in French CE assessment reports for ICIs. We found that predicted OS was underestimated in 73 percent of these assessment reports, with a mean difference of 13 percent. This mismatch between predicted and observed OS was even more pronounced when the extended follow-up duration was ≥3 years. In most assessment reports, the long-term benefit of ICIs does not seem to be adequately captured by the models used to extrapolate data from RCTs with limited follow-up available at the time of submission. The clinical development of ICIs has resulted in an increased interest in the use of models with a greater degree of flexibility than standard parametric models. These models include piecewise, spline-based models, mixture models, cure models, and landmark models (Reference Latimer, Abrams and Lambert12). The objective of these models is to reflect appropriately the complex hazard function of ICIs due to potential delayed responses to treatment and the existence of long-term survivors (Reference Rutherford18). In the selected CE assessment reports, only standard parametric, piecewise, and spline-based models were tested. Only one CE assessment report (see study (10)) used external data to directly inform the extrapolation model. This raises questions on the reasons why other modeling approaches (Reference Kroep, Kiff and Kraan59) were not considered. One possible explanation is that the acceptability of these new approaches for HTAs undertaken by the French health authorities is currently unknown, as their recommendations on extrapolation of survival data are limited (14). The National Institute for Health and Care Excellence (NICE) technical support document on flexible methods for survival analysis may provide the impetus to address this need (Reference Rutherford18).
The modeling of the long-term benefit of ICIs is an important field of research. A number of survival extrapolation case studies have been published, resulting in similar conclusions, although the study design or the drug indications have differed. A recent study reviewed eleven STAs from the NICE (Reference Bullement, Meng and Cooper16). Overall, the standard parametric or piecewise survival models underestimated OS at the midpoint between the maximum follow-ups of the initial and most mature Kaplan–Meier curve by −9.2 percent and +4.6 percent. This results in absolute difference are close to the ones from our study. However, we also reported relative differences that showed larger differences. From our perspective, relative differences are more appropriate, as they take into account the differences in survival prognosis between different cancer types, and in the amount of additional long-term follow-up data available as opposed to absolute differences. Another study evaluated the CE assessment reports of ICIs by the Norwegian Medical Agency (n = 7) and the Dental and Pharmaceutical Benefits Board (n = 7) (Reference Johannesen, Holmberg and Huetson60). Overall, long-term OS under ICI treatment was again underestimated in 79 percent of the assessment reports (n = 11/14).
In the second part of this study, we assessed the performance of a variety of extrapolation models in predicting long-term survival for ICIs. The models providing the best fit were those that could reflect nonmonotonic hazards (i.e., generalized-gamma, log logistic, and lognormal). These models are able to fit survival data for treatments that exhibit unimodal hazard functions (i.e., hazards that initially increase, but at some point of time gradually decrease). In addition, flexible parametric spline models also provided a suitable fit to the observed data.
Model selection can have a considerable impact on the lifetime survival benefit, as highlighted in the difference in RMST between the best-fit model and the extrapolated OS used in the assessment report. In two thirds of the CE assessment reports (n = 4/7), the OS was underestimated by at least 5 months (and up to 17 mo) compared to the best-fit estimate over the predefined time horizon. Such an underestimate of the survival benefit is likely to have a significant impact on the assessment of CE.
A number of studies have compared the accuracy of different extrapolation approaches in modeling long-term survival of cancer patients receiving ICIs. From the data of the CheckMate 057 trial, different models were tested for predicting long-term survival following nivolumab treatment in advanced non-squamous NSCLC (Reference Porteous, Herbert and Painter61). In this analysis, log-logistic, log-normal, and generalized-gamma functions provided better goodness of fit and more accurate estimates of long-term survival. The same researchers have also performed a similar study using data from four RCTs of nivolumab (Reference Porteus, van Herst and Curteis62). They concluded that models with nonmonotonic hazards were consistently associated with better statistical fit and more accurate prediction of long-term survival for ICI monotherapies, consistent with the findings of the present study (Reference Porteus, van Herst and Curteis62). Finally, Klijn et al. have compared the accuracy over time of a range of extrapolation methods to predict OS of patient treated with nivolumab based on IPD from CheckMate 025 study (Reference Klijn, Fenwick and Kroep63). All extrapolation methods underestimated long-term OS compared to observed data with the exception of mixture models. However, a log-logistic function performed well across all database locks, which is also consistent with the results observed in this study.
The main limitation of this study is the limited sample size. However, this study constitutes a comprehensive review of the French CE assessment reports of ICIs at the advanced or metastatic stage of the cancer. The number of CE reports evaluating ICIs in the adjuvant treatment setting was extremely limited, and since conclusions may differ according to the treatment setting, they were not selected. Although we compared the performance of a range of extrapolation models, we did not cover all types of models currently available. For some of these, such as landmark models, IPD is necessary and access to such data is challenging. For piecewise models, there is currently no consensus on how to determine the switching point, so we did not apply such approaches. However, we did consider the majority of models that have been used in CE assessment reports to date. We acknowledge that testing mixture models, cure models, and landmark models would be of interest, in the light of the recent NICE technical support document (Reference Rutherford18). There are also several emerging extrapolation models that show promise. A recent simulation study suggests that dynamic survival models and general additive models worth consideration, particularly when longer-term follow-up data are available and/or the patient sample size is reasonable (Reference Kearns, Stevenson and Triantafyllopoulos64). Fitting extrapolation models to immature survival data is inherently fraught with uncertainty. If data are poor, there is a danger that no model will provide reliable predictions of long-term survival. In this study, there was no external validation to help inform the choice of model, which is a frequent issue in CE assessment reports (14). The use of external survival data from mature early phase trials, cancer registries, or expert opinion is a critical part of the extrapolation model selection and validation process. This is important since models that provide a good visual and statistical fit to the observed data do not necessarily provide reliable estimates of long-term survival, as found in this study. However, it is also accepted that at the time of submission to HTA agencies, external data for the intervention are often limited, and the generalizability of any long-term survival data found for the comparator must be carefully considered. To improve the robustness of these findings, it will be relevant to perform a similar analysis on progression-free survival and OS once longer follow-up data become available for all the RCTs, and to consider a higher number of CE assessment reports. This complementary objective to the present research would also provide an opportunity to integrate the comparator arm from the RCTs, to assess relative differences in survival and the impact of underestimating between-group differences on the CE assessment. To evaluate the real impact of such survival differences on the CE ratio, the changes in RMST should translate into a difference in quality-adjusted life-year. An additional area of research would be to assess which of the survival functions we examined provided the best predictive accuracy when fitted to the data available at the time of the CE assessment. Finally, it would also be interesting to compare the performance of the selected models in assessment reports from other HTA agencies. For example, agencies in England and Wales, Sweden, and Norway have used different models to estimate long-term survival following treatment of RCC with nivolumab, although the data source was identical (CheckMate 025) (Reference Klijn, Fenwick and Kroep63).
In conclusion, models selected in the French CE assessment reports systematically underestimate longer-term survival of patients treated with ICIs, sometimes markedly so. This may lead to a significant impact on the results of economic evaluations, and on the decisions regarding pricing of the treatment. It is therefore important to test a large range of models, to assess the clinical plausibility of the extrapolation used, and to identify any observed or expected variation in the hazard ratio over time. In line with the observed results, spline models and parametric distributions that can model unimodal hazards may be worth considering at least in sensitivity analysis in HAS submissions.
Funding Statement
This study was funded by Bristol Myers Squibb France.
Conflicts of Interest
V.G., S.B., A.F.G., and J.B. are employed by Bristol Myers Squibb.
Supplementary Materials
To view supplementary material for this article, please visit http://doi.org/10.1017/S0266462322000125.


 Open access