

Introduction
The economy appears to have maintained momentum in the second half of 2016. The ONS’ Preliminary Estimate of GDP suggests that output grew by 0.6 per cent in the final three months of 2016, matching the rate of growth in the preceding quarter (figure 1). This resilience, via robust consumer spending growth, is not expected to persist. As figure 1 shows, we expect economic growth to slow through the course of this year. The causes of this moderation have not changed from our previous forecasts; we expect households to face an erosion of purchasing power as the depreciation of sterling passes through to consumer prices, combined with elevated uncertainty weighing on the spending decisions of households and firms.
Real GDP growth (per cent per quarter)

We have lifted our economic growth forecast by 0.3 percentage point to 1.7 per cent this year. The upward revision is due to the carryover from the performance of the economy at the end of 2016. In the absence of this single data point, our GDP growth forecast for this year would have remained at 1.4 per cent. While there is an upside risk to our forecast that stems from continued buoyancy of consumer spending, such developments are difficult to square with the forthcoming acceleration in consumer prices and the initiation of a negotiated withdrawal from the EU. We expect the rate of growth to be close to the 2 per cent mark for the next few years (figure 2), close to our estimate of the UK's long-run potential growth rate. With a still significant margin of spare capacity, these growth forecasts imply the negative output gap will persist over the course of the next few years. One risk scenario that we wish to highlight and it is encompassed by the fan chart is that the slowdown in growth in 2017 has downward momentum. Such momentum might be triggered by an adjustment in consumption expenditure to build up savings more abruptly to long run levels. Tighter global monetary conditions, led by the actions of the Federal Reserve, and the possibility of a more persistent inflation overshoot as the sterling prices of commodities continue to rise pose the risk of persistently lower output growth.

GDP growth fan chart (per cent per annum)

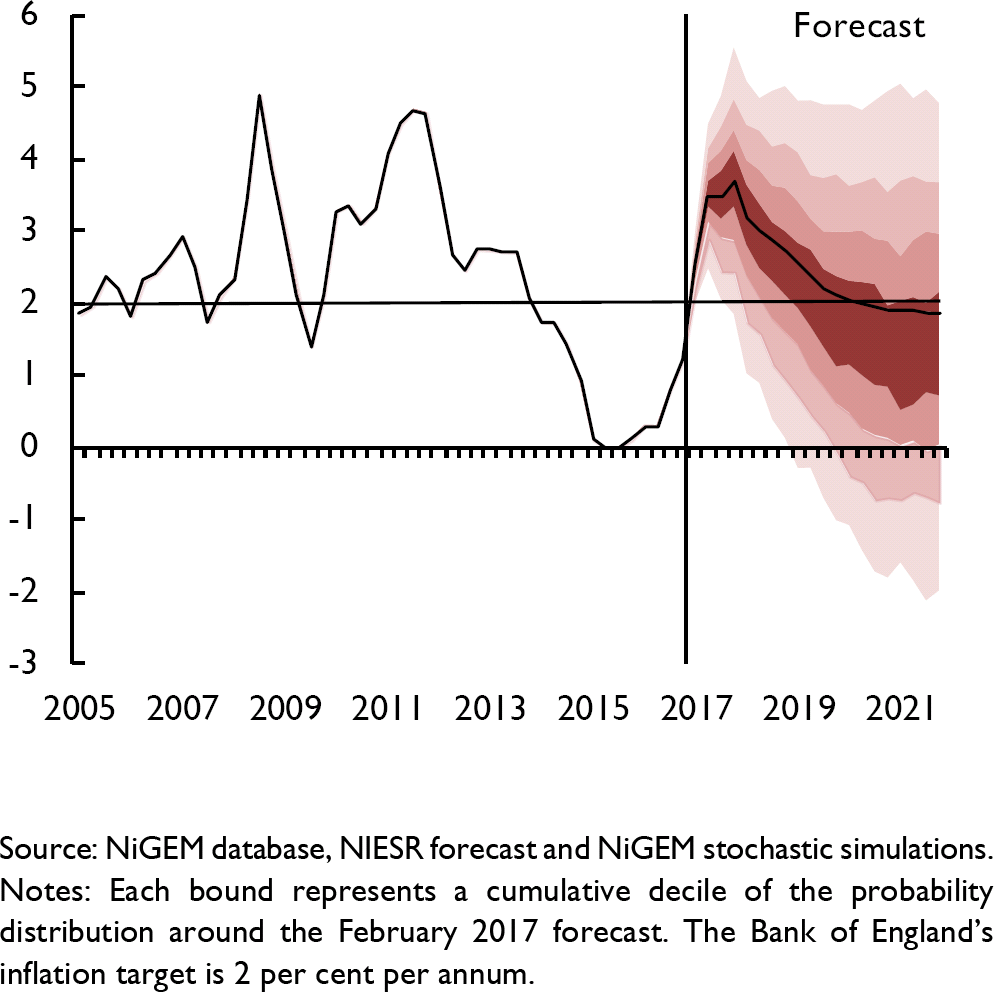
Consumer price inflation increased in each month of the final quarter, reaching 1.6 per cent in the twelve months to December, the highest rate since July 2014. Dipping underneath the headline rate we see a picture of building inflationary pressures. Producer input prices jumped markedly in the final quarter of last year, responding to sharp increases in the price of oil and imported metals. As you would expect, the sharp depreciation of sterling subsequent to the referendum has resulted in relatively quick pass-through from those commodities which trade at world prices. We expect to see further pass-through as prices continue to adjust to the depreciation of sterling. We expect the second stage of pass-through to push the rate of consumer price inflation to around 3.7 per cent per annum by the end of this year, before gradually moving back towards target in the subsequent two years (figure 3). There is uncertainty with regard to the speed and magnitude of pass-through to consumer prices. As Reference Forbes, Hjortsoe and NenovaForbes et al. (2015) highlight, the nature of the shock to the exchange rate matters. Figure 3 represents the distribution around our forecast. The risk that actual pass-through differs from what we expect is captured by this distribution.
CPI inflation rate fan chart (per cent per annum)
How helpful are new trade deals for softening the blow of hard Brexit?
Two key aspects regarding trade stand out in Theresa May's 12 point plan for negotiating with the EU: the UK will not seek membership of the single market, and the UK wishes to abandon the EU's common external tariff, in order to be free to negotiate trade agreements with third countries.
This box provides a range of projected impacts on the UK economy of these policies. In particular, we examine the impact of 1) replacing the UK's single market membership with a free trade agreement with the EU and 2) concluding new trade deals with non–EU countries. We find that if the new trade deals are similar to those already in existence, then their benefits will be expected to be very small compared to the costs from leaving the EU single market. Specifically, we expect that leaving the single market will be associated with a long–term reduction in total UK trade of between 22% and 30%, depending on whether the UK concludes an FTA with the EU or not. The estimated increases in trade from concluding FTAs with all of the BRIICS, are much smaller at just over 2%, while concluding FTAs with all the Anglo–American countries (USA, Canada, Australia and New Zealand) is associated with a long–term increase in total UK trade of less than 3%. This stark difference mainly reflects that the single market is a very deep and comprehensive trade agreement aimed at reducing non–tariff barriers, while most non–EU FTAs seem to be quite ineffective at reducing the non–tariff barriers that are important for services trade.
We first summarise the results of our previous work on the impact of trade agreements on trade. Reference EbellEbell (2016) uses data on 42 countries from 2014, and classifies each exporter–importer pair into three categories: ‘EEA’ if both are members of the EEA single market, ‘FTA’ if the country pair has a trade agreement, but at least one is not a member of the EEA single market, and ‘none’ if there is no FTA between the two countries. This allows us to estimate the decreases in trade from leaving the single market and transitioning to an FTA with the EU, and to calculate the increases to trade from negotiating an FTA with a non–EU country.
If the UK replaces single market membership with an FTA with the EU, the estimates in Reference EbellEbell (2016) indicate that trade in goods with the EU would decline by 35% in the long term, while trade in services with the EU would be even harder hit, dropping by 61% in the long term (table A1), reflecting the EU's focus on reducing non–tariff barriers for services. Taking UK trade (exports plus imports) with the EEA of £398.3 bn in goods and £150.0 bn in services for 2014 as a guide,Footnote 1 this would imply a long–run decline of £139.4 bn in goods trade and £91.5 bn in services trade, corresponding to reductions of 20% in total UK goods trade and 26% in total UK services trade (table A3).
Table A2 provides estimates of the potential increases in trade from negotiating new FTAs with either all of the BRIICS (Brazil, Russia, India, Indonesia, China and South Africa) or with all of the Anglo–American economies (USA, Canada, New Zealand and Australia).


The lack of increases in services trade from signing new FTAs stems from our finding in Reference EbellEbell (2016) that the non–EU FTAs currently in existence in our sample do not display significantly greater trade flows than do countries without any trade agreement.Footnote 2 The weak performance of non–EU FTAs may be related to a lack of efficacy at tackling non–tariff barriers, which are particularly important for services trade. The relatively small increase of 26% in long–term trade in goods also reflects that the non–EU FTAs in our sample are associated with relatively small increases in trade.
Taking UK trade in 2014 as a basis, we find that a new set of FTAs with all the BRIICS is estimated to lead to a long–run increase of £23.1 bn in goods trade, and no increase in services trade. A set of FTAs with all of the Anglo–American countries is estimated to lead to a long–run increase of £21.5 bn in goods trade, and no increase in services trade. This corresponds to increases in total UK goods trade of 3.2% for FTAs with all of the BRIICS, and 3.0% for FTAs with all of the Anglo–American countries (table A3). The combined impact of replacing single market membership with an FTA with the EU, and of signing new FTAs both with all the BRIICS and all of the Anglo–American countries is expected to be a long–term reduction of £94.8 bn in UK goods trade and of £91.5 in UK services trade.
Three things are important to note about the estimates in tables A1 and A2: first, these are the declines or increases in trade with the appropriate trading partners, not the declines in total UK trade which we present in table A3. Second, these are long–term impacts that may take 5 to 10 years or more to materialise. Third, we assume that any new FTAs negotiated by the UK – whether with the EU or with non–EU countries – are ‘average’ in the sense that we estimate the benefits from these FTAs using data on a large number of trade agreements. That is, we are not making predictions about the quality of the UK's future trade deals, rather, we are assuming that the UK's future trade deals will generate as much trade as the ‘average’ FTA in our sample. Put another way, if the UK is to replace the lost trade from leaving the single market, it will need to negotiate trade deals that are much more effective at increasing trade than the average FTA in existence today, especially for services.


Next, we input these estimated changes in trade as changes in the UK's export market shares into NiGEM. This allows us to illustrate the impact of these changes in trade policy – leaving the single market or negotiating new FTAs – on macro aggregates such as real GDP, real consumption and the effective exchange rate. The reductions in the UK's export market shares in other EU countries are phased in linearly over two years, beginning in the 2nd quarter of 2017, in line with the expected triggering of Article 50.
Table A4 summarises the results of this exercise. We examine only the impact on macro aggregates from the trade losses from leaving the single market. We find that in the long run, which we define as a horizon of 15 years, real GDP is expected to be 2.3% lower than the baseline if we move to WTO rules with the EU, and 2.1% lower than the baseline if the UK agrees an FTA with the EU. In our May 2016 scenarios in Reference Ebell and WarrenEbell and Warren (2016), we reported declines in GDP of between 2.7% and 3.7% from the baseline for the WTO scenario, but these also included the impact of reductions in FDI. We also emphasise that we do not include any reductions in productivity from the loss in openness in these exercises. Including such openness–related productivity declines would increase the impact of leaving the single market on the UK economy.
The declines in consumption are somewhat larger at 3.5% in the WTO case and 2.9% in the FTA case. This is due to the accompanying Sterling depreciation of 15.0% in the WTO case and 11.5% in the FTA case. The depreciation in Sterling leads to higher import prices, which raise the price of household consumption bundles, leading the declines in consumption to exceed those of GDP.
Next, we allow for the possibility that the UK negotiates new free trade deals. We consider two scenarios which we consider to be quite optimistic: that the UK concludes FTAs with all of the BRIICS and that the UK concludes FTAs with all of the Anglo–American countries. The impact of these new trade deals on GDP, consumption and the effective exchange rate in the case in which the UK trades on a WTO basis with the EU are presented in the lower half of table A4. Overall, the impact of new FTAs is very small. In the case of new FTAs with the Anglo–American countries, we find no measurable difference between GDP and consumption for the WTO scenario with and without the FTAs with Anglo–American countries (i.e. the impact is smaller than 0.1%), and only a very small impact of 0.1% from baseline for the effective exchange rate. In the case of FTAs with the BRIICS the impact on the results is also very small: GDP falls by 2.2% rather than 2.3% relative to baseline, while consumption drops by 3.4% rather than 3.5%. The real exchange rate does not decline as much when FTAs with the BRIICS are concluded, declining by 13.8% relative to baseline rather than by 15.0%. The very small impact of these new FTAs on GDP and consumption are in line with the very small increases in trade associated with them.
In summary, the ability of new FTAs to soften the impact of leaving the single market on the UK economy would seem to be quite limited, even under the relatively optimistic assumption that FTAs with all the BRIICS or all of the Anglo–American countries would be concluded by the time of our exit from the single market. This is not to say that FTAs are necessarily ineffective, however. We emphasise that the impact is weak for two reasons: first, the impact of new FTAs is based on the increases in trade estimated from FTAs currently in effect, which are on average not very effective at generating trade. Second, current levels of trade are quite small, particularly with the BRIICS, so that even the 26% increase in goods trade with these countries would amount to rather small absolute increases in trade. If the UK wishes to replace the trade at risk from leaving the single market, its new trade deals will need to be much more effective at generating trade than most of those currently in existence, particularly for services. Much more work remains to be done to understand what features of a trade agreement make it particularly effective at reducing non–tariff barriers and generating trade.
Notes
1 Total UK trade in goods and services is calculated from data provided in the ONS Pink Book 2016, Tables 9.4 and 9.5.
2 To be clear, by non–EU FTA we mean either an FTA between two non–EU countries, or between the EU and a non–EU country.
This box was prepared by Monique Ebell and James Warren
We expect unemployment to rise only slightly from its current low level over the coming year, increasing from 4.8 per cent to almost 5½ per cent by year end. Implicit in this forecast is that wages remain as flexible over the coming couple of years as they have done since the oil price shock of 2008, Global Financial Crisis and Great Recession of 2008–9. Were real product wages to prove more rigid than assumed, we could well see unemployment rise more sharply.
When discussing the evolving outlook for the economy, we should not forget the role that macroeconomic policy has to play. The monetary stimulus and new liquidity programme (the Term Funding Scheme (TFS)) introduced by the Bank of England have provided support to the real and financial sectors, while the recent Autumn Statement introduced a loosening in fiscal policy, in particular through a modest expansion of government capital expenditures. The counterfactual forecast, in the absence of such responses, would be for a marginally weaker outlook for the real economy over the next couple of years. Further fiscal policy changes do pose an upside risk to the economic outlook.
With the Autumn Statement, the government announced a new fiscal mandate, adjusting the target of reaching an absolute surplus by 2020–21, with an objective where the government will “return the balance back to surplus at the earliest date in the next parliament”. In terms of more precise targets, three have been created, although all refer to target dates after the next General Election in May 2020. These targets are:
to reduce cyclically-adjusted public sector net borrowing (PSNB) to below 2 per cent of GDP by 2020–21;
for public sector net debt (PSND) as a percentage of GDP to be falling in 2020–21;
to ensure that expenditure on welfare in 2021–22 is contained within a predetermined cap and margin set by the Treasury at Autumn Statement 2016.
We welcome the increased flexibility of the new fiscal mandate, and subsequently the ability of the government to respond if economic conditions worsen. However, the rule places measurement of an unobservable variable, the state of the business cycle, back at the forefront of fiscal policy. As a result the policy is perhaps less transparent than the previous rule. As Kuusi highlights with the example of Finland, in this Review, structural budget balances can actually give pro rather than countercyclical guidance to policymakers, an undesirable property at the best of times, let alone one where the economy faces significant headwinds and monetary policy has limited conventional and now ‘standard’ unconventional tools at its disposal to stabilise the economy in the face of future negative shocks.
Our forecasts suggest the government will meet its first two targets with relative ease, while we do not currently provide the disaggregation of the welfare budget necessary to evaluate the likelihood of hitting the third target. We forecast public sector net borrowing of close to 0.3 per cent of GDP in 2020–21, before any cyclical adjustment is applied. Crucially, we assume that fiscal consolidation for this Parliament continues as has been planned in successive fiscal statements.
Monetary conditions
The UK's headline measure of monetary policy, Bank Rate, remains at 0.25 per cent and, in its most recent meeting, the MPC voted to maintain the stock of government bond purchases at £435bn and the stock of corporate bond purchases at up to £10bn.
Unemployment rate fan chart (per cent of labour force)

As reported in our November Review, market expectations of UK Bank Rate have tightened since the MPC's August 2016 decision to cut Bank Rate to 0.25 per cent, as figure 5 shows. Prior to the Bank of England's monetary policy announcement on 4 August 2016, expectations for future Bank Rate implied by the instantaneous forward overnight indexed swap (OIS) curve indicated that Bank Rate would be cut to 0.1 per cent during the first half of 2017, consistent with the interest rate profile underpinning the forecast in our August Review. However, as inflationary pressures – primarily linked to the large depreciation of sterling in the second half of 2016 and the robust nature of the economy post-referendum – have become more pervasive, OIS-implied interest rate expectations have climbed. Recent market-implied interest rate expectations suggest that rates are expected to remain at their current level until early-to-mid-2019, rising gradually to just over 1 per cent by the end of 2021. This path is similar to our own view underpinning this forecast, which is conditioned on Bank Rate of 0.25 per cent until mid-2019, climbing gradually to 1.50 per cent by the end of 2021.
Interest rate expectations

Mounting inflationary pressures represent the primary challenge for UK monetary policymakers in 2017. Recent communications by the MPC reflect this. In November, the MPC's policy statement emphasised that “there are limits to the extent to which above-target inflation can be tolerated”, a point that was reiterated in Governor Carney's recent speech given at the London School of Economics on 16 January 2017 (Reference CarneyCarney, 2017).Footnote 1 With economic activity expected to be comparatively subdued this year and next, rising inflation presents a trade-off for monetary policymakers. Increasing interest rates may help to suppress inflation, but are likely to come at the cost of depressing economic activity. On the other hand, maintaining a more accommodative monetary policy stance may stimulate economic activity but, as a result, generate higher inflation.
In the near-term, the willingness of policymakers to accommodate rising inflation is likely to be linked to the cause of price increases. The most recent measure of UK inflation indicates that increases in producer input prices have primarily been driven by increases in the prices of imported materials and fuels, a result predominantly due to the sterling depreciation (for more details on exchange rate pass through see Box B in this chapter).Footnote 2 With recent inflation, and building inflationary pressure, reflecting the dramatic move of sterling in the second half of 2016, it seems likely that the MPC will be willing to look through such moves to some extent given the 1½-2-year transmission lag of monetary policy in comparison to the more temporary nature of the exchange rate shock.
The more important concern for the MPC pertains to the medium-term outlook for inflation over which there is great uncertainty, as reflected in Bank of England (2016b) and our own risk assessment (see figure 3). Looking ahead, the MPC faces an identification problem of first-order importance for the future path of monetary policy: to what extent will the UK's decision to leave the EU, and the associated process of leaving, influence demand vis-à-vis supply in the economy? The Bank of England has indicated that “the weaker medium-term outlook for activity [in recent forecasts] largely reflects a downward revision to the economy's supply capacity” (Bank of England, 2016a, pp. i). However, should demand prove to be weaker than currently forecast, then a looser monetary policy, targeted at supporting demand, may be problematic if the limited supply capacity has inflationary implications.
When set against the backdrop of rising interest rates in the US, the challenges for the UK's MPC are likely to be magnified. If, as expected, the Federal Reserve continues to tighten monetary policy, as suggested by federal funds futures market data and the Federal Open Market Committee's ‘dot plot’, the potential for a growing interest rate differential between the US and UK may have implications for both the US dollar–sterling exchange rate, and bilateral financial flows. The former might be expected to reinforce inflationary pressures, as a growing interest rate differential may place downward pressure on sterling, while the latter may pose challenges for the reversal of asset purchases in the UK, as outward portfolio flows from the UK may serve to reduce domestic asset prices.
Financial markets
Since the beginning of December 2016, sterling has depreciated only marginally relative to the US dollar and the euro. On 1 December 2016, sterling stood at $1.262 and €1.189, while the figures on 25 January 2017 were $1.261 and €1.174 respectively. Although these low frequency moves in exchange rates might indicate stability in financial markets, they mask higher frequency moves associated with the current environment of heightened uncertainty.
An important aspect of uncertainty surrounds the UK's triggering of Article 50, the negotiating objectives of the government during the process of exiting the EU, and the likely outcomes. Recent movements in financial markets indicate that, although the government has begun to communicate its negotiation objectives, there remains considerable uncertainty around them, evidenced by sizeable movements in financial market indices around government announcements.
Table 2 presents the daily changes of exchange rates (sterling to US dollar and sterling to euro), NIESR's 10-year UK government bond term premium and the FTSEs 100 and 250 around two notable events pertaining to the UK's exit from the EU. The first, on 17 January 2017, is the date on which Prime Minister Theresa May gave a speech entitled ‘The Government's Negotiating Objectives for Exiting the EU’. The second, on 19 January 2017, was the date Prime Minister May addressed the World Economic Forum in Davos on a similar topic. For comparison, table 2 includes the average absolute daily change of each of these series during January 2017 to illustrate the magnitude of these events.

Columns (1) and (2) indicate that the first speech induced a sizeable appreciation in sterling with respect to the euro and the dollar, of 1.81 per cent and 2.62 per cent respectively. These movements represented the largest daily moves in these bilateral exchange rates since 27 June 2016.
Column (3) illustrates that the absolute movements in the 10-year UK government bond term premium were above the average for the month on both dates. Following Prime Minister May's first speech on 17 January 2017, the 10-year term premium fell by 4.09bps. This, in conjunction with the appreciation of sterling, suggests that the speech buoyed financial market participants. However, the 6.17bp increase in the term premium on 19 January 2017, in tandem with sterling's depreciation against the US dollar, implies that this optimism was short-lived.
Columns (4) and (5) present the daily changes in the FTSE 100 and FTSE 250 respectively. In absolute terms, the daily changes of these indices both exceeded the average daily change for January 2017. Although the FTSE 100 fell by 1.47 per cent on 17 January 2017, this most likely reflects the exchange rate appreciation that occurred simultaneously. With a large fraction of FTSE 100 firms accruing profits denominated in dollars, a sterling appreciation can be harmful to their valuation. Since the referendum we can see the influence of the exchange rate on the FTSE 100. Although it has been rising since the referendum, when the same series is expressed in dollar terms it has been broadly flat, as figure 6 depicts.
The FTSE 100 by currency denomination

Heightened uncertainty represents a considerable downside risk to our forecast for the UK economy, but the precise timing and magnitude of movements in financial markets are difficult to know. Within our global econometric model, exchange rate movements are determined by an uncovered interest rate parity condition, adjusted for a premium which captures, among other things, unconventional monetary policy and a currency specific risk premium. This implies our forecast for the exchange rate incorporates a smaller depreciation in comparison to the November Review, in light of recent international events. Nevertheless, our current forecast is predicated of a larger depreciation than in the August Review, see figure 7 and Box C.
Effective exchange rate, trade-weighted

Prices and earnings
Consumer prices increased in all three months of the final quarter, with inflation reaching 1.6 per cent in the twelve months to December, the highest rate since July 2014. As in November, all non-food categories contributed positively, with the largest being transport and hotels and restaurants, adding 0.6 and 0.3 percentage point to the final rate, while food prices dragged marginally, subtracting 0.1 percentage point.
The depreciation of the exchange rate and resurgent commodity prices are likely to be key drivers of inflation over this year and next. Box B in this Review provides an in depth discussion on how movements in the exchange rate are passed through from input prices to production and eventually through to consumer prices.
The producer price index, measuring the cost of inputs, grew by 15.8 per cent in the twelve months to December, after growth of 14.6 per cent in November on an annual basis. While all product groups recorded inflation, the most significant contributors were crude oil, which grew by 56 per cent, and imported metals, which rose by 36.2 per cent in the twelve months to December. Global oil and metal prices both reached their nadir in the first quarter of 2016 and have since rebounded. This turnaround is largely a result of the 10½ per cent depreciation of the effective exchange rate in the latter half of 2016. An interesting feature in the inflation rate of input prices has been the jump between September and October 2016, preceding further increases, which may be indicative of short-term hedging strategies against prices coming to a conclusion and firms having to negotiate new pricing contracts.
Our oil price projections are based on those published by the Energy Information Administration. Relative to our forecast three months ago, oil prices grow at a slightly stronger rate of 25½ per cent this year instead of 21.2 per cent, while the rate of expansion moderates to a larger extent in 2018. This path implies that by the end of the year oil prices will have reached $53.48 and by the end of next year $56.16. Given these assumptions, it is likely that we will continue to see an intensification of input price inflation over the upcoming year.
From input prices, the next link in the chain is to factory gate or output prices, which grew by 2.7 per cent in the twelve months to December, recording the sixth consecutive month of inflation following two years of falling prices. All subcomponents of the index contributed positively to the overall growth rate, but the main driver was petroleum products which added 0.9 percentage point to the overall figure, more than twice as much as the next category, transport equipment, which added approximately 0.4 percentage point. The profile of output prices has roughly mirrored that of input prices. After steady increases throughout the third quarter, output price inflation jumped between September and October from 1.2 per cent to 2.1 per cent on an annual basis. This may suggest that currently the pass-through between input and output prices is occurring relatively quickly.
Exchange rate pass–through to consumer prices
Sterling has depreciated by around 10 per cent on a trade weighted basis since the UK's referendum on EU membership. In our last edition of the Review (see Box C), we analysed through the lens of our global macroeconomic model, NiGEM, the impact of sterling's depreciation on output. In this box, we discuss the inflationary implications of the recent depreciation. It is convenient to decompose the overall sterling pass–through into consumer prices into two broad stages. The first stage is the effect on import prices. The second concerns the pass–through from import prices to ‘final’ consumer prices.
The devaluation of a currency may not be fully transmitted into import prices during the first stage of pass–through for a number of reasons. First, as Reference Kirby and MeaningKirby and Meaning (2014) suggest, one needs to take into account the degree of competition in the domestic market. Firms operating in highly competitive markets may wish to adjust profit margins to absorb cost fluctuations emanating from a depreciation of sterling rather than pass them on to consumers in order to retain market share. Conversely, firms with high market power may be able to afford to maintain profit margins and fully pass the depreciation of sterling onto their prices.
Second, as mentioned in the November 2015 Inflation Report, there is evidence that foreign exporters price differentiate by country and may adjust their prices to the domestic conditions of each country. As a result, if sterling were to depreciate because of a contractionary demand shock, foreign exporters may not allow the sterling price of their products to rise by as much as the depreciation of sterling would imply. Note, however, that the strength of this channel depends on the export itself. Commodities, for instance, are traded at the global level and often do not price differentiate by countries. In such instance, one may expect almost full pass–through.
Overall, estimates from Bank of England (2015) suggest that around 60 per cent of changes in export prices are reflected in UK import prices within a year although it is acknowledged that pass–through may fluctuate over time for the reasons described above.
The speed and magnitude of second stage pass–through also depends on a range of factors. Most importantly, it depends on the import content of intermediate and final demand. All else equal, those countries who make more intensive use of imports as factors of production, or who have a larger share of their final consumption composed of imports, will experience larger fluctuations in consumer prices following movements in import prices. Bank of England (2015) estimates there is complete pass–through of import prices onto consumer prices over a three–year period. Given that non–energy imports are estimated to account for around 30 per cent of the consumer price index (CPI) basket, these estimates imply that a 1 per cent rise in import prices translates into a 0.3 per cent increase in the level of CPI after three years.
Combining the estimates from the Bank of England of first and second stage pass–through yields that, on average, a 1 per cent depreciation of sterling translates into a 0.2 per cent increase in consumer prices after three years. Reference Kirby and MeaningKirby and Meaning (2014), using our global econometric model, NiGEM, suggest that, across a range of countries, a 1 per cent depreciation of sterling induces consumer prices to rise between 0.1 and 0.4 per cent after one year.
Conditioning the previous discussion is the nature of the shock that induces the movement in the exchange rate, a point made by Reference Forbes, Hjortsoe and NenovaForbes et al. (2015). Using structural VARs, the authors show that a depreciation of sterling generates, as expected, a rise in consumer price inflation when the depreciation occurs because of a domestic supply side or monetary policy shock while it leads to a decline in consumer price inflation if the depreciation is triggered by a domestic demand shock.Footnote 1 The intuition behind the latter result rests on the impact of the dip in demand on consumer prices. While a contractionary demand shock induces a depreciation of sterling which acts to increase consumer prices, the overall decline in domestic prices driven by lower demand dominates. Reference Forbes, Hjortsoe and NenovaForbes et al. (2015) also find that global supply and demand shocks induce the largest degrees of exchange rate pass–through. Reference Kirby and MeaningKirby and Meaning (2014) produce simulations using NiGEM, which provide a view consistent with the analysis of Reference Forbes, Hjortsoe and NenovaForbes et al. (2015), suggesting that pass–through varies depending on the underlying shock driving changes in the exchange rate.
Reference Forbes, Hjortsoe and NenovaForbes et al. (2015) analysis suggests the recent spell of depreciation of sterling will have a low degree of pass–through to consumer prices. The depreciation in sterling that took place right after the referendum can be seen as a shock to the risk premia of sterling (see Reference Carreras and PiggottCarreras and Piggott, 2016). Compared to the series of shocks analysed in Reference Forbes, Hjortsoe and NenovaForbes et al. (2015), this is closest to their “pure” exchange rate shock which, according to their empirical results, implies that only 10 per cent of the depreciation gets transmitted onto consumer prices. This compares to a pass–through to consumer prices of 20 or 30 per cent that would arise from a domestic supply shock or a monetary policy shock, respectively.
There is significant evidence of impending inflationary pressures derived from the recent depreciation of sterling, especially when traced along the production chain. Figure B1 plots the annual percentage growth of producer input and output prices, consumer prices and sterling effective exchange rate. Producer input prices, which represent the prices of materials and other inputs utilised by UK producers, are the first link in the chain. These appear to correlate significantly with the effective exchange rate. The large depreciation that took place at the onset of the Great Recession was followed by a significant spike in the rate of increase of producer input prices, and the remaining price indices for that matter. Accordingly, the contractions experienced between 2014 and the first half of 2016 coincide with a period of significant appreciation of sterling. Note, however, that other factors may influence the relationship between the two. Between 2010 and 2012, producer input prices experienced growth rates in excess of 7 per cent although the effective exchange rate was broadly flat, a fact that can be explained by the sharp rise in oil prices that took place during those years.
Price inflation

Focusing on more recent developments, producer input prices have flipped and moved from significant rates of declines to growth rates of around 15 per cent as of December 2016 (figure B1). This move closely follows the turn–around point where sterling began depreciating. Indeed, analysis by the ONS suggests that the contributions of energy and imported goods have been the main drivers of this move.Footnote 2 Producer output or factory gate prices, the second stage in the chain, have closely followed the move of input prices, albeit the changes are an order of magnitude lower to those of producer input prices (figure B1). A need to maintain market share may prevent UK producers from passing to a full extent the rise in input prices to producer output prices.
The last element in the chain, consumer prices, tends to follow the dynamics of producer input and output prices and this time appears to be no different (see figure B1). A decomposition of CPI growth into the contributions coming from the non–import intensive components of the index, the import intensive ones and energy goods displayed in figure B2 supports our view that the recent pick–up of consumer price inflation is, to a certain extent, explained by the recent depreciation of sterling. According to the growth decomposition, consumer price inflation had been subdued between the end of 2014 and 2015 because of negative contributions to growth derived from the energy and import intensive components of the index. Indeed, this period coincides with a time where oil prices collapsed and sterling appreciated (figure B1). Following the halt in the decline of oil prices and the recent depreciation of sterling that has taken place since the second half of 2016, the sign of the contributions to the growth rate of the CPI index of these categories has reversed.
Contributions to the 12–month rate of CPI by import intensity

Note
1 The impulse responses reported in Reference Forbes, Hjortsoe and NenovaForbes et al. (2015) deliver an appreciation, rather than a depreciation of sterling. However, linearity of VARs imply symmetry of the results.
2 See ONS publication “UK producer price inflation: Dec 2016”.
This box was prepared by Oriol Carreras and Simon Kirby
The final step in the pass-through of the exchange rate is the link through to consumer prices; the extent to which the price increases which appear further up the chain will be passed to consumers will be determined, at least in part, by how able or willing firms are to adjust their margins in order to gain market share. We forecast that inflation will continue to increase over the upcoming year, averaging 3.3 and 2.9 in 2017 and 2018 compared with 3.5 for both years in our November forecast. The downward revision in both years reflects a stronger sterling in effective terms than we previously predicted.
The ONS announced that from 17 March, the preferred approach to measuring prices will be the CPIH measure, which includes the costs of owner occupied housing in the consumer price basket. Given that the Bank of England is mandated to target inflation as measured by the standard CPI basket at 2 per cent, figure 8 plots three alternative measures of inflation, RPIX – the former target rate, CPI – the current target rate, and CPIH. While both CPI and CPIH are highly correlated, there are however periods of divergence, namely from 2010 onwards, when the performance of the housing market dragged on the consumer price basket and would have delayed the point of letter writing for almost a year. In the more recent past, CPIH has grown at a quicker rate than CPI in the twelve months to December, albeit marginally, with a 0.1 percentage point difference in the growth rates. This change poses the question as to whether the government should restate the Bank's mandate so that it targets a national statistic that includes housing within its basket.
Consumer price inflation rates

A second change in the ONS’ publication of price series will be the cessation of publishing the RPIJ index. The standard RPI index is still used within index-linking of services to the economy and for inflation protected bonds. However, due to the use of the Carli formula, an arithmetic approach to aggregation of the series, the rate of inflation for RPI is often overstated. The RPIJ is constructed using a geometric aggregation system (Jevons) which makes the series comparable with the CPI basket; for example, RPIJ inflation was 1.8 per cent in the twelve months to December compared with 2.5 for the RPI index.
Average weekly earnings excluding bonuses increased marginally in the twelve months to November, to 2.7 per cent up from 2.6 in October, but still remain weak compared to pre-crisis levels. Between January 2001 and January 2008, average regular weekly earnings grew by 4 per cent on an annual basis. Across broad sectors, wages in the construction and consumer services sectors grew at above the aggregate level at 4 and 4.2 per cent respectively on an annual basis, while wages in business and financial services, the public sector and manufacturing all grew more slowly than the aggregate average.
Whole economy real wages grew by 1.4 per cent in the twelve months to November. Given the weak domestic demand conditions this year and next, we expect real wages to be flat, which implies nominal wage growth at the same rate as inflation. A corollary to this is that unemployment will be insensitive to output changes as households seek to protect employment outcomes rather than real wages. Should the opposite apply, we would expect to see higher real wage growth than we have forecast but then also higher unemployment.
Components of demand
The ONS's preliminary estimate of GDP suggests that output grew by 0.6 per cent in the fourth quarter of 2016. For the year as a whole, this implies output growth of 2 per cent. Growth in 2016 has been unbalanced. We expect private consumption to have contributed 1.8 percentage points to output and net trade to have deducted 0.6 percentage point. Looking ahead, we have revised our growth forecast upwards by 0.3 percentage point to 1.7 per cent in 2017 and expect GDP to expand by 1.9 per cent in 2018. Figure 9 shows the contributions of the components of GDP to our growth forecast. We expect the contribution of net trade to growth to turn positive this year and next primarily as a result of the recent devaluation in sterling.
Contributions to GDP growth

Impact on the inflation forecast from changes to key assumptions
In this box we aim to quantify how changes since our November forecast in our conditioning assumptions regarding monetary policy, exchange rates and the global price of oil have affected the outlook for UK consumer price inflation.
We use our global econometric model, NiGEM, to gauge the impact of movements in the short-term nominal interest rates in the UK, US and Euro Area. Using this model we simulate the effects of changes from three months ago in the expected paths of policy rates. The impact of on inflation from this simulation are shown by the ‘Interest rates’ bars in figure C1.
Impact of changes in key assumptions on the rate of inflation (percentage point difference from base)

The expected paths for policy rates in the UK and Euro Area have changed little in the three months since our November forecast. However, consistent with the statements of US Federal Reserve officials, and market expectations, we now assume nominal interest rates will increase at a slightly faster pace in the near term.Footnote 1 We model exchange rates using an uncovered interest rate parity condition (UIP), and such a change in interest expectations leads to modest depreciation in sterling, marginally increasing inflationary pressure, by just 0.1 percentage point this year.
Oil prices in our forecast evolve according to short-term projections from the Energy Information Administration (EIA) of the US department of Energy, updated with daily spot prices.Footnote 2 This year oil prices are forecast to be $1.50 per barrel higher than the conditioning assumption used in our November forecast. In 2018, oil prices are expected to be marginally lower than previously assumed. These have relatively muted effects on the rate of inflation; less than 0.1 percentage point (figure C1).
As noted above, we use UIP to explain exchange rate movements. In this framework, relative monetary policy developments are the key determinant of exchange rate changes. We think of the residual as capturing relative movements in currency risk premia. Exchange rates have moved markedly more than UIP would predict, which we have assumed is related to developments in relative risk premia. Sterling is around 4 per cent higher, on a trade weighted basis, than the conditioning assumption used three months ago. This is not due to a relative change against the US$; this bilateral rate has remained stable. Rather it is against a range of other currencies and in particular the euro. We expect this level effect to be maintained throughout our forecast horizon, putting downward pressure on the inflation rate, most notably in 2017 when it is around 0.6 percentage point below our November baseline.
Finally, when we run the three shocks simultaneously, it is the risk premium shock that dominates. Inflation in 2017 would be 0.4 percentage point lower compared to our November forecast. The disinflationary effect from the appreciation of sterling is supported by oil price movements in 2018 with little effect from changes in the path of interest rates. Combined, these imply an inflation rate that is around 0.2 percentage point lower than in our November forecast. While important, these conditioning assumptions are not the only changes in our forecast. Data outturns and changes to the outlook for the UK and the rest of the world combine to affect the inflation outlook, which is what is presented in the World and UK chapters of this Review.
Notes
1 See appendix A in the World Chapter of this Review for more details on these conditioning assumptions.
2 We use the EIA forecast published 12 January 2017 and spot prices available to 12 January 2017.
This box was prepared by Simon Kirby and Rebecca Piggott.
Real consumer spending has been the main engine of growth in 2012–16, with growth in excess of 2 per cent since 2014. Combined with demographic developments, these figures imply average real per capita consumption expenditure growth close to 1½ per cent over the same five-year period. As a result, by the third quarter of 2016, real per capita consumption expenditure was just 0.8 per cent below the pre-crisis peak, which compares to the trough of 8 per cent below the peak reached in the second half of 2011. We expect real consumer spending to have grown by 2.8 per cent in 2016, to slow down to 1.2 per cent in 2017 and to decline by 0.2 per cent in 2018 with growth resuming from 2019 onwards. Underpinning this forecast is a negative terms of trade shock that will erode the value of real incomes this year and next. Overall, we project real consumer expenditure to contribute 0.8 percentage point to output growth in 2017 and deduct 0.2 percentage point in 2018.
After robust growth in excess of 4 per cent per annum since 2010, private sector investment has slowed in 2016, and we estimate growth of ½ per cent, with business investment declining by 1.2 per cent and housing investment expanding by 4.4 per cent. Uncertainty emanating from the process of exiting the European Union and a softening in household demand for housing has led us to forecast private sector investment to contract by 3.3 per cent in 2017. However, as uncertainty dissipates we expect growth to resume in 2018.
Real government consumption has expanded every year since 1997, although in per capita terms there were contractions in 2010–11 and in 2013. Our forecast for real government consumption is based on spending plans as announced by the government and, in the absence of specific spending envelopes, is based on the assumptions outlined in the Office for Budget Responsibility's (OBR) latest Economic and Fiscal Outlook. Following the Autumn Statement, in which the government scrapped the previous fiscal mandate of achieving an absolute fiscal surplus by 2020–21 in favour of achieving a cyclically adjusted budget deficit of less than 2 per cent of GDP by 2021–22, we have raised our forecast of real government consumption growth in 2017 by 0.3 percentage point to 0.9 per cent. As a result, we project government consumption to contribute 0.2 percentage point to output growth in 2017.
The dynamics of government consumption expenditure cannot be fully understood without taking into account the government consumption deflator. Government spending plans are set out in nominal terms. Since around two-thirds of government expenditure is measured on an output only basis (Reference PopePope, 2013), for example the number of pupils in schools, cuts in the nominal value of government expenditure materialise in the deflator, rather than in the volume measure of government consumption. Figure 10 compares the evolution of the economy-wide deflator against that of government consumption. As can be seen, the government consumption deflator has grown at a slower pace than the GDP deflator since 2011 and we project it will continue to do so until 2022. This development may suggest that various measures to cut the government deficit, such as caps on public sector wage growth, will emerge in the deflator rather than in the volume measure of government consumption.
General government and broad economy inflation rates (in annual terms)

Net exports have deducted 1.2 percentage points from growth in the third quarter of 2016. These dynamics conform to the standard J-curve effect whereby a country's trade balance initially worsens following a devaluation of its currency because import and export prices adjust faster to the fluctuations in the exchange rate than trade volumes. The most recent data from the ONS November Trade release show that in the three months to November 2016, the total trade deficit for goods and services narrowed slightly by £0.4 billion to £11.0 billion, as the expansion in exports outpaced that of imports. The narrowing of the trade deficit can be attributed to an increase in the trade in services surplus, which is partly offset by a rise in the trade in goods deficit. In light of this data, we forecast net exports to contribute 0.2 percentage point to growth in the last quarter of 2016.
Gains in price competitiveness due to the recent depreciation of sterling combined with a decline in demand for imports, due both to weak private consumption growth and higher import prices, will translate into an improvement of the trade balance. However, weaknesses in EU growth prospects are likely to weigh on export demand, and on the capacity to expand export volumes. As a result, we expect imports to be the main channel through which the depreciation of sterling will improve the trade balance. We expect net trade to contribute 1 percentage point to growth in 2017, making a positive contribution for the first time since 2011, and to widen in 2018, contributing 1.6 percentage points to growth.
Household sector
Growth in real personal disposable income (real income henceforth) has lost momentum. After robust growth of 3.6 per cent in 2015, we project that real incomes expanded by just 1.8 per cent in 2016, arising from a disappointing data outturn in the third quarter of 2016 where real incomes contracted by 0.6 per cent due to higher tax intake and an acceleration in the rate of growth of consumer prices. Our projection of rising consumer price inflation implies real income growth will slow down to ½ per cent this year, after which we expect growth will accelerate as inflation moderates. The former is predicated on the basis that the recent negative terms of trade shock to consumer prices will have been completed by 2018 while the latter is predicated on the basis of a return to meaningful productivity growth. According to the NMG survey commissioned by the Bank of England and published in the 2016 Q4 Quarterly Bulletin, there has been a deterioration of households’ expectation for future income growth. Looking ahead, we forecast real income to grow by 1.9 per cent in 2018 and to expand on average at a rate of 2½ per cent per annum between 2019 and 2023. Taking into consideration population projections by the ONS, our forecast translates into a contraction of real income per capita of 0.2 per cent in 2017 and growth on average of 1½ per cent between 2019 and 2023.
According to our preferred measure of house prices, the UK house price index published by the ONS and the Land Registry, house prices have grown on average by 6.6 per cent in the twelve months between August and November 2016. This rate, although robust, constitutes a moderate slowdown relative to the rates registered during the first half of last year, when house prices grew by 8.3 per cent. This pattern of a moderate slowdown in the rate of house price inflation is in agreement with the information from leading indicators such as the Halifax and Nationwide house price indices. According to Halifax, house prices have grown, on a twelve month basis, by an average of 5.9 per cent between August and December 2016, which compares to an average growth rate of 9.3 per cent during the first half of last year. Nationwide reports house price inflation of 4.5 per cent in the twelve months to December 2016.
Given recent stronger than expected data outturns, we have revised our projections for house price growth upwards by 0.4 percentage point in 2016 to 8 per cent and by 1.8 percentage points in 2017 to 2½ per cent. Nevertheless, we maintain a view that house price inflation will moderate this year as housing demand softens as a result of lacklustre real income growth.
After a surge in activity in March 2016, partly driven by the April 2016 increase in Stamp Duty tax for buy-to-let properties and second homes, and the subsequent sharp drop in April 2016, data on the volume of residential property transactions from HM Revenue and Customs shows activity has resumed but it remains marginally below the average pre-referendum level. Between January 2014 and March 2016, transactions averaged 102,000 while the average since May is 95,000. Data from the November 2016 Bank of England Money and Credit Report portray a similar picture. Mortgage approvals for housing purchases have been rising steadily since reaching a trough of 61,000 in August 2016 to 67,000 in November 2016. This, however, remains below the two-year peak reached in January 2016 of 73 thousand.
Since the Bank of England cut Bank Rate by 25 basis points in August last year, time deposits, on average, have declined by 15 basis points as of November 2016, floating rates on secured credit have declined by 23 basis points and fixed rates on secured credit by 9 basis points. Given the split of mortgagees between those holding fixed and variable rate mortgages, the average wedge between deposit and borrowing rates has increased marginally. Overall, income gearing, the share of income devoted to interest rate payments, remains at historical low levels, figure A5.
Private consumer expenditure has been the main engine of growth in the third quarter of 2016, contributing 0.5 percentage point to output growth. The lion's share of the increase in private consumer expenditure was accounted for by a rise in services, while expenditure in durables slowed down to around half the rate of increase relative to that registered in 2015. Data from the December 2016 Retail Sales release, which provides a timely indicator and comprises around one third of total private expenditure, suggest consumer expenditure growth softened over the last quarter of 2016. Retail sales data has been strong since August, with growth rates exceeding 1.8 per cent in the quarterly comparison. In the three months to December, retail sales growth on a volume basis softened to 1.2 per cent. This moderation is accounted for by a decline, after stripping out seasonal effects, of 1.9 per cent in the volume of retail sales between November and December.
We maintain a view of a moderation in private consumer expenditure this year. Underpinning this is weak real income growth compounded by a negative wealth effect derived from a slowdown in the rate of house price inflation. Overall, we expect that, after growth of 2.8 per cent in 2016, private consumption growth will soften to 1.2 per cent in 2017 and decline by 0.2 per cent in 2018.
Upward revisions to the adjustment for changes in households’ net equity holdings in pension funds and insurance firms have pushed up the estimate of UK's household saving rate by 1 percentage point to 6.1 per cent in the second quarter of 2016. In the third quarter of 2016 the saving ratio has declined to 5.6 per cent. This decline has been accounted for by the rate of growth of private consumer expenditure outpacing that of real income. The saving ratio on a cash basis, an alternative measure published by the ONS which excludes imputed rentals and the adjustment for pension entitlements, fell by 1.4 percentage points to −0.8 per cent in the third quarter of 2016. Looking ahead, we expect saving as a proportion of income to remain at 5.6 per cent in 2017 and to increase gradually thereafter. By 2021, we expect the saving ratio to be around 10 per cent.
Household saving displays a high degree of co-movement with the unemployment rate, figure 11. The co-movement between these two series is likely to be driven by changes in the propensity to save for precautionary motives: as uncertainty around household incomes increases, with the unemployment rate used as a proxy here, households decide to retain a greater proportion of their current disposable income in order to build a buffer against future adverse income shocks. Such dynamics highlight a risk to our forecast, where if unemployment were to increase at a faster pace than we have pencilled in in our forecast, the saving ratio would likely follow and weigh more heavily on consumer spending than we have projected.
Unemployment and the saving rate

After peaking at around 160 per cent in the first quarter of 2009, households’ debt to income ratio declined to just below 140 per cent by the end of 2013, where it has since remained. However, robust growth in household liabilities of 1.9 per cent in the third quarter of 2016 coupled with a decline of 0.6 per cent in real incomes has meant that households’ debt to income ratio has jumped by 3 percentage points to 143.2 per cent. In light of this, it appears that the deleveraging process has come to a halt, a view that is in agreement with the latest results of the NMG survey published in the 2016 Q4 Bank of England Quarterly Bulletin, where it is reported that the proportion of mortgagors with debt to income ratios above 5 was broadly unchanged relative to the previous year. In all likelihood, households will be able to sustain such a large stock of debt relative to income due to income gearing being at historically low levels. However, this exposes households to the risk of a squeeze in their available income after deducting interest payments if rates on household credit and mortgages were to jump in response to an adverse economic shock.
Supply conditions
The unemployment rate averaged 4.8 per cent in the three months to November 2016, unchanged since the previous three-month period but down from 5.1 per cent one year ago. This is its lowest level since the three months to September 2005. In the same period the employment rate of those aged 16–64 maintained its record high of 74.5 per cent, up from 74.0 per cent one year earlier. Inactivity of those aged 16–64 increased slightly to 21.7 per cent, compared to 21.5 per cent in the previous three month period, but remains at a historically low level. We expect unemployment to rise slightly, averaging 5.1 per cent in 2017 and 5.4 per cent in 2018.
Wages have shown only a limited response to falling unemployment. ONS data show that real wages grew by only 1.5 per cent in the year to November 2016, compared to an average annual growth rate of 2.3 per cent in 2000–7. Reference SaundersSaunders (2016) suggests that this may be due to a combination of greater labour market flexibility and insecurity, an increase in the labour supply, and an increase in underemployment.
Self-employment as a percentage of total employment, which tends to be countercyclical, has been rising over the past year and a half. In September–November 2016, self-employment accounted for 15 per cent of total employment, compared to 12.4 per cent in 2000–7. In addition, there has recently been a rise in the number of employees on zero-hours contracts and those employed in the ‘gig economy’. These more flexible, less secure types of employment tend to be less well paid than full-time jobs within firms.
Improved health and life expectancy, an increase in the retirement age of women, and increased incentives to work following an expansion in in-work tax credits, are all likely to have helped boost the labour force participation rate to near record levels in recent years, putting downward pressure on wages. Measures of underemployment suggest that, despite the low unemployment rate, some slack remains in the labour market. ONS data show that in September–November 2016, 13.7 per cent of part-time workers wanted to work full-time but were unable to find a full-time job. This compares to an average of 8.6 per cent in 2000–7.
It is often suggested that poor productivity growth is behind sluggish real wage growth. This relationship can also work in the opposite direction, as lower wages lead to the substitution of labour for capital and an expansion of labour-intensive industries which tend to have lower average pay and productivity. Figure 12 plots real producer and consumer wages along with output per hour (see Reference ChadhaChadha, 2016).
Real wages and productivity

In terms of quarterly growth rates, whole economy output per hour in 2016 has returned to rates of growth that prevailed before the crisis. However, since growth in output per hour for the whole economy exceeds that of the main sectors, manufacturing and services, it must be either construction or agriculture, forestry and fishing that is driving this development. Data are not available for these sectors for 2016 and they tend to show more volatility in productivity measures than manufacturing or services, thus we do not attach much weight to this pick-up in output per hour as an indicator of continued productivity growth.
The productivity gap between the UK and other advanced economies is long-established. According to the government's green paper Building our Industrial Strategy, output per worker in the UK caught up with that in France and exceeded the level in Germany before the 2008 recession, after which it dropped significantly below levels in France and Germany. Output on an hourly basis has been below that in France and Germany since the 1970s, but the gap has widened significantly following the recession. By 2015 workers in France, Germany and the US were producing, on average, as much in four days as workers in the UK did in five according to ONS international comparisons of productivity 2015.Footnote 3
Our population forecast relies on the ONS population projections and does not account for the likelihood of decreased inward migration following the UK's exit from the EU. In contrast, the OBR (2016) assume a reduction in net migration which leads to a 0.2 per cent reduction in growth per year in 2017–20. This estimate is based purely on a reduction in the size of the labour force and does not assume any impact on productivity. Reference Boubtane, Dumont and RaultBoubtane et al. (2015) estimate that a 1 percentage point increase in the migrant share of the working age population results in an increase in productivity of 0.4–0.5 per cent, reflecting the relatively high skill level of migrants to the UK. Reference Jaumotte, Koloskova and SaxenaJaumotte et al. (2016) find a 2 per cent increase in productivity following a 1 percentage point increase in the migrant share of the total population. The stronger effect in this case is likely due to the younger average age of migrants compared to the native population.
Reference Forte and PortesForte and Portes (2016) estimate migration flows to the UK based on national insurance number registrations. In their central scenario, they assume a reduction equivalent to reversing half of the impact of introducing free movement of labour, and in their more extreme scenario they assume a complete reversal. This is equivalent to a fall in net migration of up to 91,000 over 2017–20 in the central scenario, and a reduction of up to 150,000 in the more extreme scenario.
The Bank of England Credit Conditions Survey reports that credit conditions remain benign, with the availability of credit to corporations unchanged from the previous quarter. Demand for credit by small and medium-sized businesses has fallen, while demand by large companies is unchanged after falling significantly in the previous quarter. A decrease in demand for credit may reflect a switch to alternative sources of funding, or it may be indicative of a decline in investment intentions. According to the Bank of England's Agent's Summary of Business Conditions, investment intentions were consistent with small increases in spending in the year ahead, see figure 13, with many firms looking to hold more cash in the face of uncertainty, rather than increase spending. Investment intentions have been declining over the past two years, with a notable drop-off in the services sector following the referendum on the UK's membership of the EU.
Investment intentions

Data from the CBI investment intentions survey for the fourth quarter of 2016 supports the view that uncertainty is weighing on firms’ investment intentions, with 55 per cent of respondents reporting that uncertainty over future demand is a factor limiting investment, an increase of 8 percentage points compared to the previous quarter. The other significant factor limiting investment was low net return, cited by 41 per cent of respondents, up from 36 per cent in the previous quarter. We think that uncertainty will have a larger effect on investment than current forward-looking indicators suggest, and thus we expect business investment to fall by 4.5 per cent this year before growth resumes at 3.8 per cent next year.
Public finances
Our fiscal forecasts are based on announced spending and taxation plans from the 2016 Autumn Statement. We use the spending assumptions outlined in the Office for Budgetary Responsibility's (OBR's) most recent Economic and Fiscal Outlook. We allow tax receipts and interest payments to be determined endogenously.
The Bank of England's TFS has important implications for our projections for net borrowing and net debt. Through this scheme, the Bank provides central bank reserves to eligible banks and building societies, in exchange for which they provide collateral and pay bank rate plus a premium that depends on the volume of net lending to households and corporations. According to the ONS,Footnote 4 the newly created central bank reserves are part of public sector net debt. However, the Bank will pass on the interest charged at Bank Rate for these loans to the Treasury, which in turn will lead to a reduction in public sector net borrowing. The Bank has announced that the package will be around £100 billion, implying an increase in public sector net debt to GDP of around 5 percentage points.
Our projections for net borrowing remain broadly consistent with our November Review, with a reduction in the deficit throughout our forecast period, from 3.5 in the fiscal year 2017–18 to 0.3 per cent of GDP in 2021–22. However, looser fiscal policy has meant that the government no longer reaches absolute surplus by 2020–21. According to the OBR, to meet the new target for PSNB would require halving it by the end of the current parliament. As such, it would appear that the primary target will be easily met.
Net debt in the 2015–16 fiscal year was 83.8 per cent of GDP. However, partly due to the TFS, we expect there to be a rise in net debt in the 2017–18 fiscal year to 90.3 per cent of GDP, a 6.5 percentage point increase. We expect this to be the peak of net debt as subsequently the growth in nominal GDP surpasses that of borrowing. According to our forecast, the second target will also be met; however, this is helped by the framework of the TFS. By requiring all Bank reserves to be returned in a four-year period, net debt will necessarily decline between 2020 and 2022.
As announced in the Autumn Statement, the welfare cap requires that the government does not exceed spending of £126 billion in 2021–22, with a 3 per cent margin, on a subset of welfare categories. Most importantly, the target will not be assessed until the beginning of the next parliament and as a result this is unlikely to constrain government decisions.
In Autumn Statement 2016, the Chancellor of the Exchequer unveiled a £23 billion National Productivity Investment Fund (NPIF) to be phased in gradually between 2017–18 and 2021–22 to boost government investment. In the context of the UK budget, this constitutes a marginal fiscal loosening. While we welcome the attempt by the government to address the investment deficit of the country – among the G7 group of developed countries the UK has the lowest investment to output ratio – we contend that the programme lacks the scale required to bring the UK's investment to output ratio in line with its international counterparts, see figure 14.
Gross fixed capital formation to output ratio

Saving and investment
Table A9 disaggregates the current balance of three broad sectors of the economy: household, corporate and government. A sector is a net borrower if investment in that sector is greater than saving and vice versa. The aggregation of these three sectors is the current account balance for the UK economy, which, if in deficit, implies that external finance is required to fund domestic investment plans. It is not possible to infer whether levels of capital are optimal from the position of the current account balance, just the immediate financing needs of the economy.
Since reaching a peak of 8.3 per cent in the third quarter of 2010, household saving has been gradually declining and in 2016 it averaged 4 per cent of GDP, ½ percentage point down from 2015. The recent decline in saving can be attributed to robust growth in consumer expenditure, which grew on average by 2.8 per cent in 2016, the highest annual growth rate since 2007, as well as a slight weakening in the growth of real personal disposable income, which grew by 1.8 per cent in 2016 down from 3.6 per cent in the previous year. The softening in real incomes was primarily a result of a moderation in the income earned from assets, which grew by 3 per cent in 2016 down from 7.9 per cent in the previous year. Offsetting this is real consumer wages growth which was relatively robust at 1.8 per cent per annum, up from an average contraction of 0.6 per cent per annum on average between 2010 and 2015. We forecast the saving rate to fall slightly in 2017 to 3.9 per cent of GDP, a result of weak real income growth, as the sharp uptick in inflation leads to a contraction in real consumer wages, and a softening in real consumer spending. We expect the saving rate to increase to 5.3 per cent of GDP in 2018 and to further increase from 2019 onwards as households attempt to build up a buffer of savings. By 2021 we expect households to save around 7–7 ½ per cent of GDP.
Household investment was 5 per cent of GDP in 2016, 0.1 percentage point higher than in the previous year. We expect household investment to increase gradually in 2017 and to continue to increase throughout our forecast period. By 2021, we expect household investment to be 5.7 per cent of GDP.
The projected dynamics in saving and investment imply that in 2017, households will borrow 1.2 per cent of GDP and become net lenders from 2018 onwards. By 2021, households are expected to lend around 1½ per cent of GDP to the rest of the economy.
Typically, the corporate sector would be expected to be a net borrower, using lending from the rest of the economy to fund productive investment. Yet the contrary has occurred in the UK since the second half of 1999. More recently, the corporate sector appeared to be returning to its theoretically consistent position. In 2015 the net saving position of the corporate sector was broadly in balance, however in 2016 it returned to being a net lender providing 0.4 per cent of GDP to the rest of the economy. The paths of investment and saving in our forecast imply in the near term that the corporate sector will remain a net lender to the economy in 2017 and 2018. This is predominantly driven by increases in saving as firms retain a greater proportion of profits as the economy moderates. From 2019 onwards we expect corporate saving to reduce as the economy recovers and by 2021 we expect the corporate sector to save about 9 per cent of GDP. Alongside the increase in saving we expect a slight moderation in investment, falling from 10.1 per cent of GDP in 2016 to 9.3 in 2017 and 2018 respectively, after which it remains stable throughout our forecast period. We expect the corporate sector to lend approximately ½ per cent of GDP to the rest of the economy in 2017 and 2018 and to reach balance in 2020. By 2021 we forecast the corporate sector to borrow around ½ per cent of GDP to the rest of the economy.
Government dis-saving has continued to reduce since its trough of 6.1 per cent of GDP in the third quarter of 2009. In 2016, government dis-saving was 0.8 per cent of GDP. If fiscal plans evolve as laid out in the November Autumn Statement, we expect the government sector to return to positive saving in 2018 and to increase throughout our forecast period reaching 2½ to 3 per cent of GDP by 2021. Since 2012, government investment as a proportion of GDP has been around 2½ per cent. We expect the government to maintain this ratio until 2020. This implies that the government sector remains a net borrower from the rest of the economy through much of our forecast, but reaches balance by 2021.
The aggregation of these three sectors implies that the UK is a net borrower from the rest of the world in 2017 and 2018, requiring 2.7 and ½ per cent of GDP after which it becomes a net lender. By 2021, we expect the current account balance to be in surplus by 1 per cent of GDP.
The primary income account, which measures the inward flow on income generated on assets held in foreign countries, net of outward flow of income generated on assets in the UK held by foreign entities from the respective stocks of assets and liabilities, is a key component of our forecast for the UK current account. These credits and debits would appear as saving on the net positions of the broad sectors previously described. Historically, the primary income balance has recorded a surplus, averaging ½ per cent of GDP between 1988 and 2012.
However, from 2013 onwards, a deficit in the primary income account opened up, reaching 2.4 per cent in the final quarter of 2015. As highlighted in the previous edition of the Review, the depreciation of sterling which, on a trade-weighted basis, has fallen by around 15 per cent since the beginning of 2016, will likely cause this to return to surplus through a revaluation effect. That is, the stock of foreign assets and the flow of credits, priced in sterling, increase as a result of the exchange rate depreciation, while the stock of liabilities priced in foreign currency remains the same.
The impact on the net international investment position has been to shift from a deficit of 4.6 per cent at the end of 2015 to reaching surplus of 11.2 per cent in the final quarter of 2016, in line with our November forecast, see figure 15. As a result, this has led to quicker growth in credits than debits, and a closing of the primary income account to around 0.8 per cent of GDP at the end of 2016. We expect that this will return to balance in the first quarter of 2017 and record surplus thereafter, reaching a net positive contribution to the current account of 1.9 per cent of GDP by 2021.
UK net international investment position

Medium term
Our view of the long-run path of the UK economy as it transitions from its current disequilibrium is outlined in table A10. Recent announcements by Prime Minister May, suggest that the UK government will not seek to remain in the single market. However, in the absence of hard details of the outcome of the negotiations, our assumption of the future trading arrangement between the UK and the EU, the EFTA type of arrangement from Reference Ebell and WarrenEbell and Warren (2016), remains our modal path. As the negotiations unfold and new information is released, we will continue to update our assumptions underlying our forecast.
The transition to our expected long-run equilibrium is uncertain as shocks, which are, by definition, unpredictable, buffet the economy away from the path we have forecast. We chose to illustrate this uncertainty in the form of fan charts; figure 2 has a 10 per cent probability of average growth of less than 0.6 per cent this year, as is the probability of average growth greater than 2.8 per cent.
The near-term movements in the exchange rate as measured by sterling exchange rate against a trade-weighted broad basket of currencies have largely followed the path we had predicted in the previous forecast. Looking ahead, the broad picture of the exchange rate path remains largely unchanged relative to our previous Review except that we now expect a slightly smaller depreciation for next year of 6½ per cent rather than 9.1 per cent. From 2018 onwards we forecast that the exchange rate will begin to appreciate by around 0.8 per cent in each year through our forecast period, which implies that sterling, on a trade-weighted basis, between 2022 and 2026 will remain around 11½ per cent lower than it was at its peak in 2015.
The sharp sterling depreciation through to 2016 is forecast to lead to an increase in consumer price inflation both this year and next. We have revised inflation downwards relative to our November Review as a result of the stronger sterling outlook. We now expect consumer price inflation to be slightly lower at an average of 3.3 and 2.9 per cent in 2017 and 2018, down from our previous forecast of 3.5 per cent in both years. From 2019 onwards, as pass-through to consumer prices is completed, we expect the inflation rate to return gradually towards the bank of England's mandated target. Between 2022 and 2026 we expect consumer price inflation to average 2 per cent per annum.
The depreciation is also expected to have an impact on the balance of the current account, both through an improvement in the trade and primary income balances. In the near-term, the improvement on the trade-side is largely a result of a contraction in import volumes induced by higher import prices and, to a lesser degree, by an increase in export volumes due to a gain in competitiveness. We forecast the deficit on the trade balance to shrink as the effect of the depreciation permeates through the economy, from 2.9 per cent of GDP in the first quarter of 2017 to balance in 2020 for the first time since 1997. Subsequently, we expect the trade deficit to reappear and to widen again. Between 2022 and 2026 we forecast that the deficit on the trade balance will average around ½ to 1 per cent of GDP. As a result of the revaluation effect of the exchange rate, we expect the primary income balance to return to surplus this year with a positive balance of 0.8 per cent of GDP after recording a deficit in the previous year of 1.4. We forecast that this surplus will further increase in 2018 to 1.7 per cent as a proportion of GDP, after which it will remain broadly stable throughout the rest of our forecast period. For the UK current account balance, this implies a shrinking of the deficit from 2.7 per cent of GDP in this year reaching balance at the end of 2018. We expect that on average the UK current account will be in balance between 2022 and 2026.
We maintain a view that Bank of England will look through the temporary spike in inflation caused by the depreciation of the pound. As such, our forecast is that Bank Rate will remain at 0.25 per cent until the second half of 2019 at which point monetary policy will start tightening. From here, we forecast that Bank Rate will tighten by around ½ per cent each year. Between 2022 and 2026, Bank Rate will average approximately 3 per cent per annum.
Key to long-run potential growth is productivity growth which we expect to return to meaningful rates this year. Using gross value added per hour worked as our measure of productivity, we forecast productivity growth of close to 1½ per cent this year, to soften between 2018 and 2021 at 1¼ per cent per annum and accelerate to 1.4 per cent per annum between 2022 and 2026. However, the risks around our forecast are largely toward the downside, as the weakness post-recession remains largely unexplained, so the timing or plausibility of any pick-up is difficult to assess. Furthermore, as was suggested before the referendum (see OECD, 2016, and HMT, 2016), productivity and openness may be positively connected and there may also be possible links between immigration and productivity performance. Weaker productivity growth has two implications: a lower rate of potential growth and diminished prospects for rising living standards.
As aggregate demand softens in 2017 and 2018 we expect a slight increase in the unemployment rate to 5.1 and 5.4, respectively, which tails off as GDP growth rates return to their long-run levels throughout the rest of our forecast period. The mirror to this is the growth of the labour input into production which falls in the near term from 1.4 per cent per annum to 0.4 and 0.6 in 2017 and 2018. Between 2022 and 2026 we expect growth in the labour input into production to average ½ per cent per annum.
The performance of the labour market implies that wages are the main mechanism through which the labour adjustment occurs in our forecast. We expect growth of average weekly earnings to be around 3 per cent per annum throughout our forecast period. These developments, alongside our forecast for inflation, imply weakness in real consumer wages in both the near and medium term. We forecast real wages to be flat in 2017 and 2018 followed by a relatively subdued recovery, averaging around 1 per cent per annum between 2022 and 2026, well below their historical average of 1.9 per cent per annum since 1998. Should real wages prove to be more rigid than we have forecast, then we would expect to see a greater impact on unemployment.
Our fiscal forecasts are based on assumptions outlined in the Office for Budgetary Responsibility (OBR)'s latest Economic and Fiscal Outlook, published alongside the November Autumn Statement. The key changes from the November forecast are that the government no longer has a set date to achieve absolute surplus and that fiscal policy is looser. We now project public sector net borrowing to decrease this year and next to 3½ and 2.6 per cent of GDP, respectively, reducing in each year. By 2022–26 we expect public sector net borrowing to be 0.3 per cent of GDP. This new path implies that public sector net debt peaks in 2018 at 89.7 per cent of GDP, up from 84.3 per cent in 2016, at which point it starts to decrease gradually. Between 2022 and 2026 we forecast that public sector net debt will average 72.1 per cent of GDP.
Appendix – Forecast details


Household inflation expectations for the year ahead have edged up

Private and public sector nominal wage growth


Goods exports volumes to the EU are close to levels last seen in 2007

Per capita consumer spending is expected to reach its pre–recession peak in 2020 (2007Q4=100)


Household income gearing

We expect households’ propensity to save to rise over the medium term (per cent of gross disposable incomes)

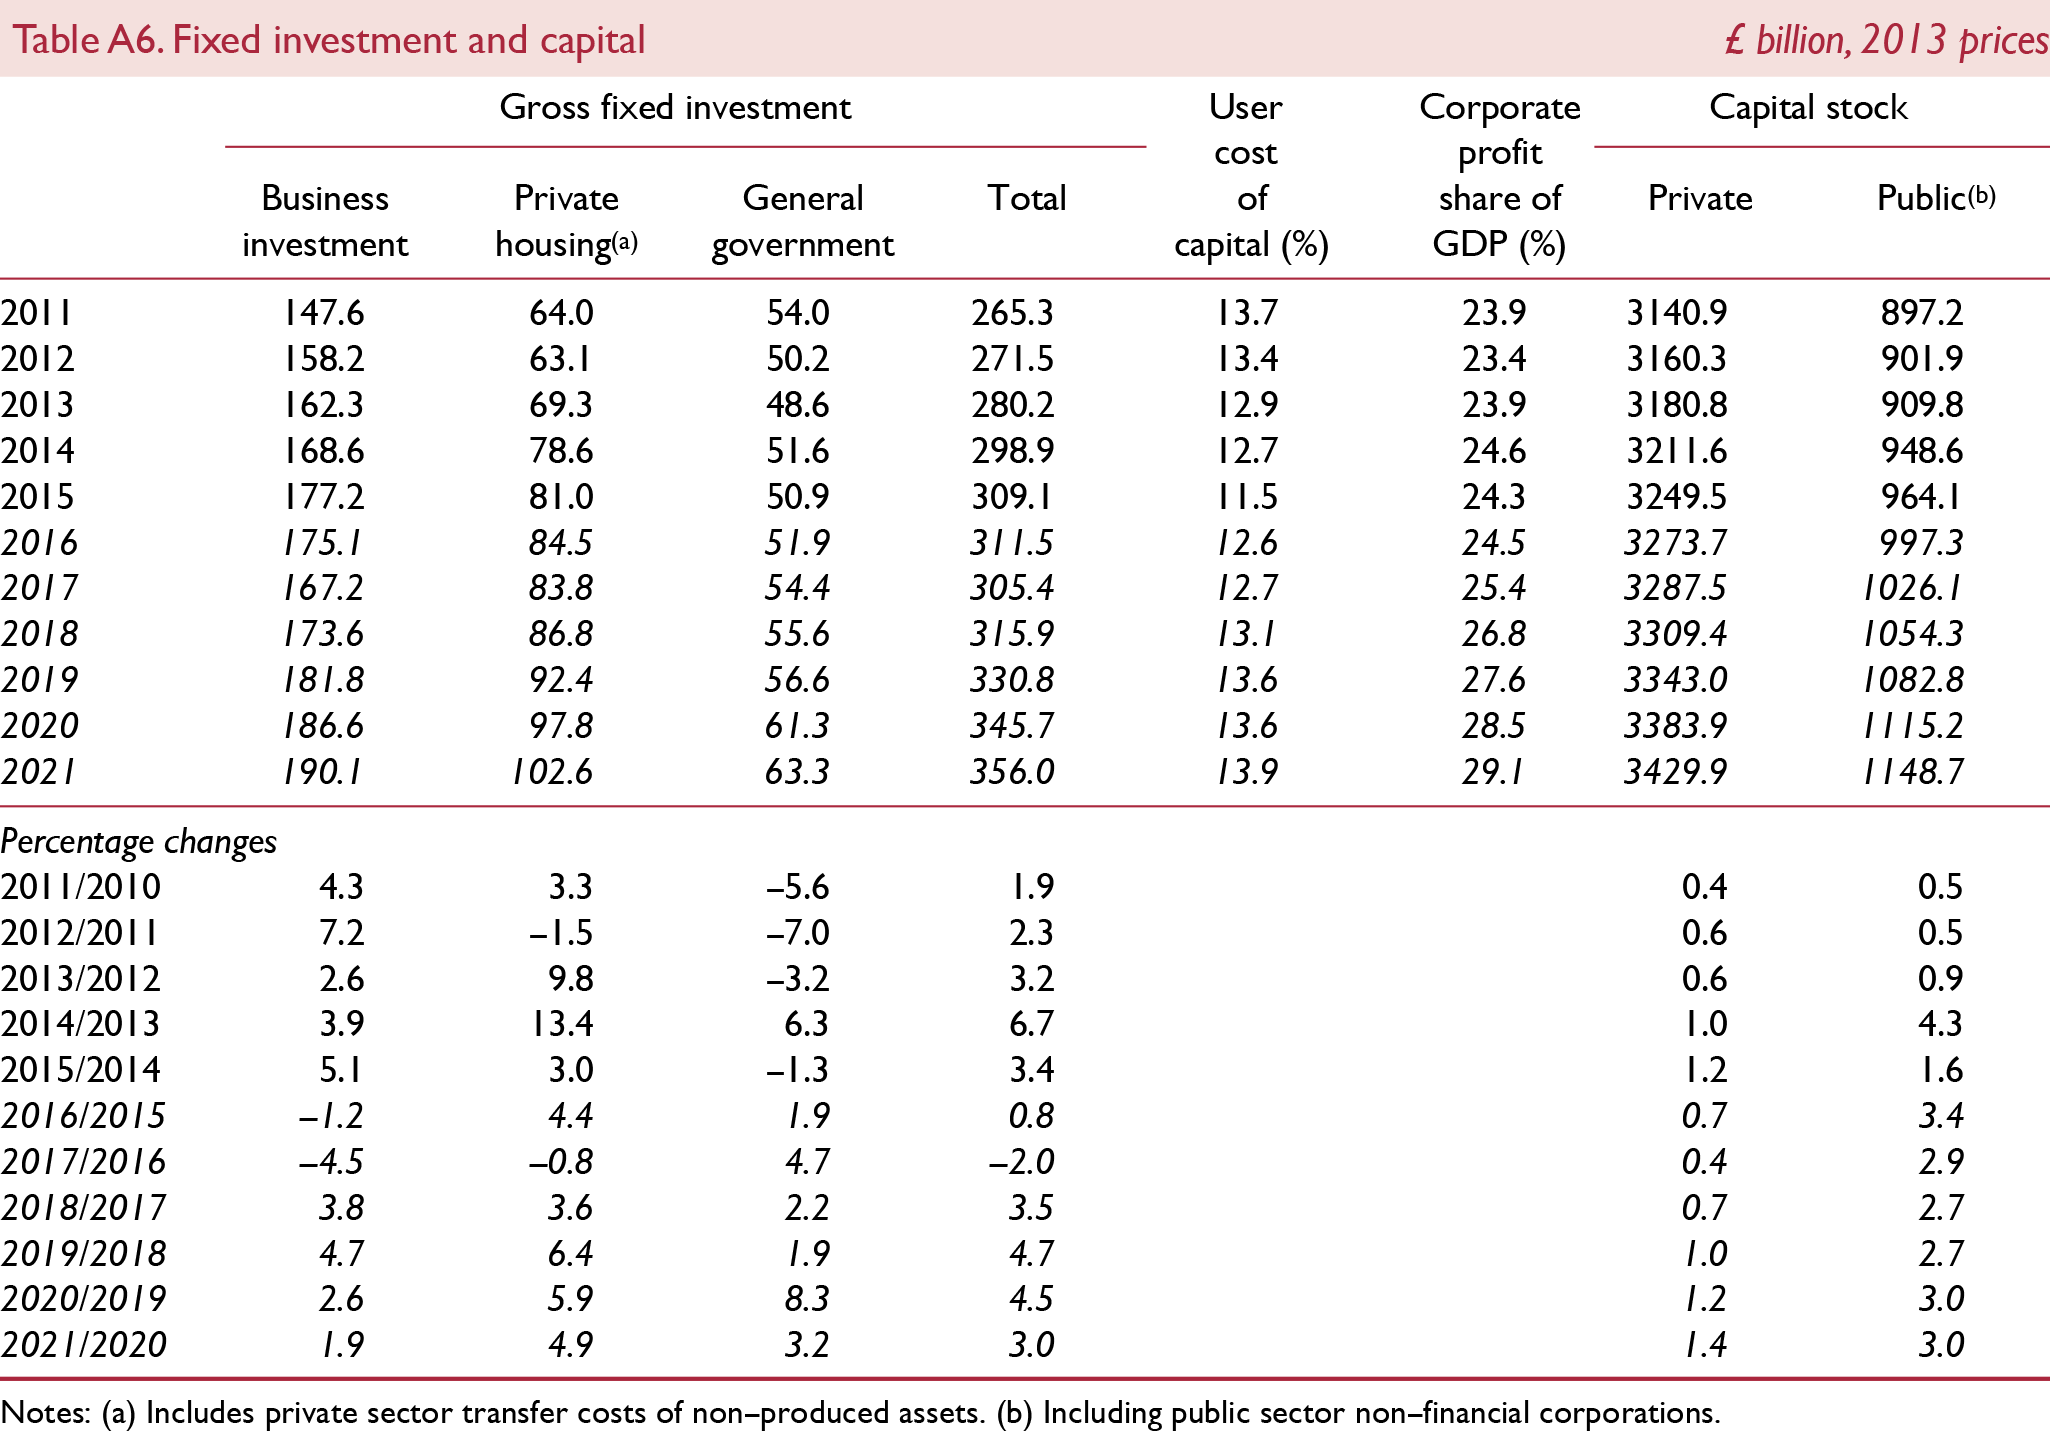
Productivity in the UK has just surpassed pre-recession levels

National saving rates (per cent of GDP)


In 2016Q4 GDP was 8.7 per cent higher than its pre–crisis peak and employment is estimated to be 7.3 per cent higher

The Beveridge curve


