


Introduction
The majority of ice flowing from the Antarctic continent drains into the sea through large ice streams and floating ice shelves, with losses occurring via iceberg calving and basal melt from ice shelves and floating ice tongues. Large Antarctic ice shelves, such as the Ross, Filchner-Ronne and Amery, are important components of the cryosphere as they form an interface between grounded continental ice and the surrounding ocean. Whilst ice shelves are in hydrostatic equilibrium and do not directly influence sea level, they provide a buttressing effect that retards coastal discharge of ice from the interior via ice streams (e.g. Reference Warner and BuddWarner and Budd, 1998;Reference Rott, Rack, Skvarca and De AngelisRott and others, 2002;Reference Rignot, Casassa, Gogineni, Krabill, Rivera and ThomasRignot and others, 2004;Reference Scambos, Bohlander, Shuman and SkvarcaScambos and others, 2004).
The complex interaction of water masses, including tidal, seasonal and bathymetric forcing, drives thermohaline circulation in ice-shelf cavities (Reference Grosfeld, Gerdes and DetermannGrosfeld and others, 1997; Reference Williams, Jenkins, Determann, Jacobs and WeissWilliams and others, 1998b). Cool, relatively fresh ice-shelf water (ISW) is formed from mixing of basal melt near the ice- shelf grounding zone, which marks the transition between grounded ice streams and the floating ice shelf. The ISW may contribute to the production of Antarctic bottom water, which is a significant component of global ocean circulation (Reference Grosfeld, Gerdes and DetermannGrosfeld and others, 1997;Reference HuhnHuhn and others, 2010). Reference Williams, Warner and BuddWilliams and others (1998a) indicate that ocean warming may strongly influence ice-shelf mass loss through basal melting. Together, these processes that link ice shelves to the global climate system via ocean circulation provide a mechanism by which changes in the global climate may influence the mass balance of the Antarctic ice sheet and vice versa.
The Amery Ice Shelf, located at ˜70° S, 70° E, is the largest ice shelf in East Antarctica (Fig. 1), with a floating ice area of ˜-60 000km2 (Reference Galton-Fenzi, Maraldi, Coleman and HunterGalton-Fenzi and others, 2008). The catchment region that drains into the Amery Ice Shelf is estimated to be 16% of the East Antarctic grounded ice-sheet area (Reference Fricker, Warner and AllisonFricker and others, 2000b). The major ice streams draining into the Amery Ice Shelf within this catchment system are Lambert, Mellor, Fisher, Scylla and Charybdis Glaciers. The ice draft at the southern limit of the Amery Ice Shelf where it becomes grounded is ˜2500m (Reference Fricker, Hyland, Coleman and YoungFricker and others, 2000a). Due to its density, cold high-salinity shelf water (HSSW), associated with the formation of sea ice in Prydz Bay off the front of the Amery Ice Shelf, descends into the sub-shelf cavity. Depression of the sea-water freezing point with depth below the ice shelf allows inflowing HSSW at or near the surface melting point to produce considerable basal melt. Combined with the local bathymetry, the ice draft produces a cavity geometry that supports a strong ice-pump mechanism (Reference Lewis and PerkinLewis and Perkins, 1986; Reference Galton-Fenzi, Maraldi, Coleman and HunterGalton-Fenzi and others, 2008). A similar process of basal melting and marine ice accumulation has been described previously for the Filchner-Ronne Ice Shelf (Reference Jenkins and DoakeJenkins and Doake, 1991;Reference OerterOerter and others, 1992). At the smaller Nansen and Hells Gate Ice Shelves marine ice formation is thought to result from both large-scale and localized ice pumps (Reference Tison, Lorrain, Bouzette, Dini, Bondesan, Stievenard and JeffriesTison and others, 1998;Reference Khazendar, Tison, Stenni, Dini and BondesanKhazendar and others, 2001).
Location of the Amery Ice Shelf in East Antarctica. Open circles indicate the location of the AM01, AM02, AM03 and AM04 boreholes drilled as part of the Amery Ice Shelf Ocean Research (AMISOR) program. Significant features of the Amery Ice Shelf region are indicated. The G1 and AM01 cores were drilled at the same site in different years (Table 1). The locations marked JP (Jetty Peninsula) and LT (Loose Tooth) are those defined by Reference Craven, Allison, Fricker and WarnerCraven and others (2009). (Figure adapted from Reference Galton-Fenzi, Maraldi, Coleman and HunterGalton-Fenzi and others, 2008.)

Reference Craven, Allison, Fricker and WarnerCraven and others (2009) estimate that 80% of the continental ice entering the Amery Ice Shelf is lost by basal melt within 240 km of the southern limit of the grounding zone. The resulting fresh meltwater contributes to the formation of less dense ISW, which may become supercooled as it flows outwards to the front of the ice shelf and rises (to lower pressure) along the shelf cavity slope (Reference Lewis and PerkinLewis and Perkins, 1986). Buoyant frazil ice platelets nucleated in the supercooled water can accumulate on the base of the ice shelf, forming what is referred to as a marine ice layer (Reference OerterOerter and others, 1992). This layer is distinct from the majority of the ice shelf, which is meteoric ice derived from inflowing grounded continental ice, local surface accumulation and refreezing of surface meltwater. In general, the accretion of marine ice onto the base of ice shelves is dependent on the platelet size, sub-ice-shelf currents and the cavity profile (Reference Bombosch and JenkinsBombosch and Jenkins, 1995; Reference Galton-Fenzi, Maraldi, Coleman and HunterGalton-Fenzi and others, 2008). Significant marine ice layers have been observed in the Filchner-Ronne, Amery, Hells Gate and Nansen Ice Shelves (e.g. Reference MorganMorgan, 1972;Reference SouchezSouchez and others, 1991; Reference OerterOerter and others, 1992; Reference Eicken, Oerter, Miller, Graf and KipfstuhlEicken and others, 1994;Reference Tison, Lorrain, Bouzette, Dini, Bondesan, Stievenard and JeffriesTison and others, 1998;Reference Khazendar, Tison, Stenni, Dini and BondesanKhazendar and others, 2001; Reference Lambrecht, Sandhager, Vaughan and MayerLambrecht and others, 2007). A comparatively smaller proportion of marine ice has been observed in the Ross Ice Shelf (Reference GowGow, 1963;Reference Zotikov, Zagorodnov and RaikovskyZotikov and others, 1980).
Here we present results from the crystallographic analysis of marine and meteoric ice cores retrieved from the Amery Ice Shelf. The relationship between observed crystal orientation fabrics and the bulk ice-shelf flow is discussed in the context of the differing origin and properties of the meteoric and marine ice layers.
The AMISOR Project
The Amery Ice Shelf Ocean Research (AMISOR) project conducted by the Australian Antarctic Division aims to quantify Amery Ice Shelf/ocean interaction and its implications on the discharge of grounded ice and the modification of water masses. This work follows on from the earlier Amery Ice Shelf Project (Reference Budd, Corry and JackaBudd and others, 1982). The multidisciplinary AMISOR project incorporates hot-water drilling through the Amery Ice Shelf to access the shelf cavity for oceanographic measurements and instrument moorings, glaciological analysis of the Amery Ice Shelf and its catchment by surface measurement and remote sensing, numerical modelling of ice-shelf dynamics and ice-shelf/ ocean interaction (Reference CravenCraven and others, 2004, 2005;Reference Leffanue and CravenLeffanue and Craven, 2004). In addition, Reference Roberts, Craven, Cai, Allison and NashRoberts and others (2007) have examined the composition of biogenic material recovered from within the marine ice layer.
The existence of a marine ice layer at the base of the Amery Ice Shelf was initially suggested by Reference BuddBudd (1966), based on mass-balance considerations. Oxygen isotope, electrical conductivity and crystallographic analysis of an ice core thermally drilled at the G1 site (69.44° S, 71.42° E) during 1968 first revealed the three-layered structure that exists in regions of the Amery Ice Shelf (Reference BuddBudd, 1972; Reference MorganMorgan, 1972;Reference Wakahama and BuddWakahama and Budd, 1976). The upper 70 m at the G1 site corresponds to low-elevation, local snow accumulation on the Amery Ice Shelf near the coast. Between depths of 70 and 270 m ice was found that had initially deposited at higher elevation, where mean annual temperatures are lower, and has since flowed into the Amery Ice Shelf. Below 270 m, Reference MorganMorgan (1972) confirmed the presence of an accreted marine ice layer.
Reference Fricker, Popov, Allison and YoungFricker and others (2001) estimated the spatial distribution of marine ice thickness using radio-echo soundings to detect the meteoric/marine ice interface, combined with total ice thicknesses derived by buoyancy from a digital elevation model. Marine ice exists in the northwestern sector of the Amery Ice Shelf in two bands oriented along the ice-flow direction, either side of the region where Charybdis and Scylla Glaciers enter the Amery Ice Shelf (Fig. 2). The eastern band (closest to the ice-shelf centre line) extends upstream as far as the Jetty Peninsula region. Amery Ice Shelf marine ice accretion occurs preferentially in basal troughs in the ice shelf, where the shelf thickness is lower (Reference Fricker, Popov, Allison and YoungFricker and others, 2001). Such troughs occur at the boundary between flowbands created when adjacent ice streams flowing into the Amery Ice Shelf merge. Similar settings for marine ice formation are reported for the Hells Gate (Reference Tison, Lorrain, Bouzette, Dini, Bondesan, Stievenard and JeffriesTison and others, 1998), Filchner-Ronne (Reference Corr, Popple and RobinsonCorr and others, 1995) and Nansen (Reference Khazendar, Tison, Stenni, Dini and BondesanKhazendar and others, 2001) Ice Shelves. Reference Fricker, Young, Coleman, Bassis and MinsterFricker and others (2005) indicate that major Amery Ice Shelf rifts are initiated at, and propagate along, such boundaries. Previous work (e.g. Reference MacAyeal, Rignot and HulbeMacAyeal and others, 1998;Reference Khazendar and JenkinsKhazendar and Jenkins, 2003; Reference Humbert, Kleiner, Mohrholz, Oelke, Greve and LangeHumbert and others, 2009; Reference Khazendar, Rignot and LarourKhazendar and others, 2009) has indicated the dynamics and stability of ice shelves may be influenced by the presence of accreted marine ice in both longitudinal basal troughs and the ice melange found in full-thickness ice-shelf rifts.
The distribution and thickness of the Amery Ice Shelf marine ice layer overlaid on a regional MODIS (Moderate-Resolution Imaging Spectroradiometer) Mosaic of Antarctica image (MOA; Reference Scambos, Haran, Fahnestock, Painter and BohlanderScambos and others, 2007). The flowline passing through the AM04– AM01 borehole sites on the eastern marine ice band is indicated. Along this flowline, marine ice accretion commences in the region of Jetty Peninsula (JP). (Figure from Reference Craven, Allison, Fricker and WarnerCraven and others, 2009.)

Amisor ice-coring sites
The hot-water drill system used in the AMISOR program has been described previously (Reference CravenCraven and others, 2004, Reference Craven2005). By exchanging the drill stem for a specialized coring attachment (similar to that described by Reference Engelhardt, Kamb and BolseyEngelhardt and others, 2000) ice cores can be retrieved from targeted depths within the borehole. Drilling within the same borehole is recommenced by reverting back to the drill stem. The nominal core diameter is 100 mm, but may be reduced to ˜60mm in sections of a core where there has been a mismatch between the coring attachment vertical velocity and the drill system water temperature. Cores vary from well-formed cylindrical samples over 1m long to 0.2 m lengths with tapered ends. Figure 1 indicates the four locations on the Amery Ice Shelf where boreholes have been drilled (to date) as part of the AMISOR project.
Boreholes drilled at the AM02 (69.71° S, 72.64° E) and AM03 (70.56° S, 72.39° E) sites during the 2000/01 and 2005/06 austral summers, respectively, are located within regions of net basal melting and ice cores were not retrieved. Table 1 summarizes the location, depth and ice type of cores recovered from the Amery Ice Shelf. Throughout this paper, AMISOR ice cores are identified using a label combining the borehole name and the core depth (e.g. AM01-240 represents a core from 240 m depth at the AM01 site). Where multiple cores were obtained from the same approximate depth via successive coring attempts a suffix (e.g. a, b, c,…) is added.
Location, depth and character of ice cores retrieved from the Amery Ice Shelf using a hot-water drill, as part of the AMISOR program. Indicated depths correspond to the top of core sections. Samples from the thermally drilled G1 ice core analysed as part of the current work are also listed. The AM01 and AM01b sites are separated by 1.6 km, due to bulk ice-shelf flow between the 2001/ 02 and 2003/04 field seasons. Locations where more than one core was obtained from the same approximate depth due to successive coring attempts are marked with an asterisk

The AM01 drilling site (2001/02) was situated in the same geographic location as G1, where a continuous 315 m ice core was thermally drilled in 1968. This site is located nearly along the centre line of the Amery Ice Shelf, ˜100 km from the shelf front. The AM04 site (2005/06) was 68 km upstream from AM01, on the same flowline (Fig. 2). The site marked JP, near Jetty Peninsula on Figure 2, is located 88.1 km upstream of AM04, along the AM01-AM04 flowline and indicates the start of the marine ice accretion zone (Reference Craven, Allison, Fricker and WarnerCraven and others, 2009). Downstream of the AM01 site, along the same flowline, the site marked LT (due to its proximity to the Amery Ice Shelf ‘Loose Tooth’ rift system;Reference Fricker, Popov, Allison and YoungFricker and others, 2001) is identified by Reference Craven, Allison, Fricker and WarnerCraven and others (2009) as a location of zero net basal melt or accretion.
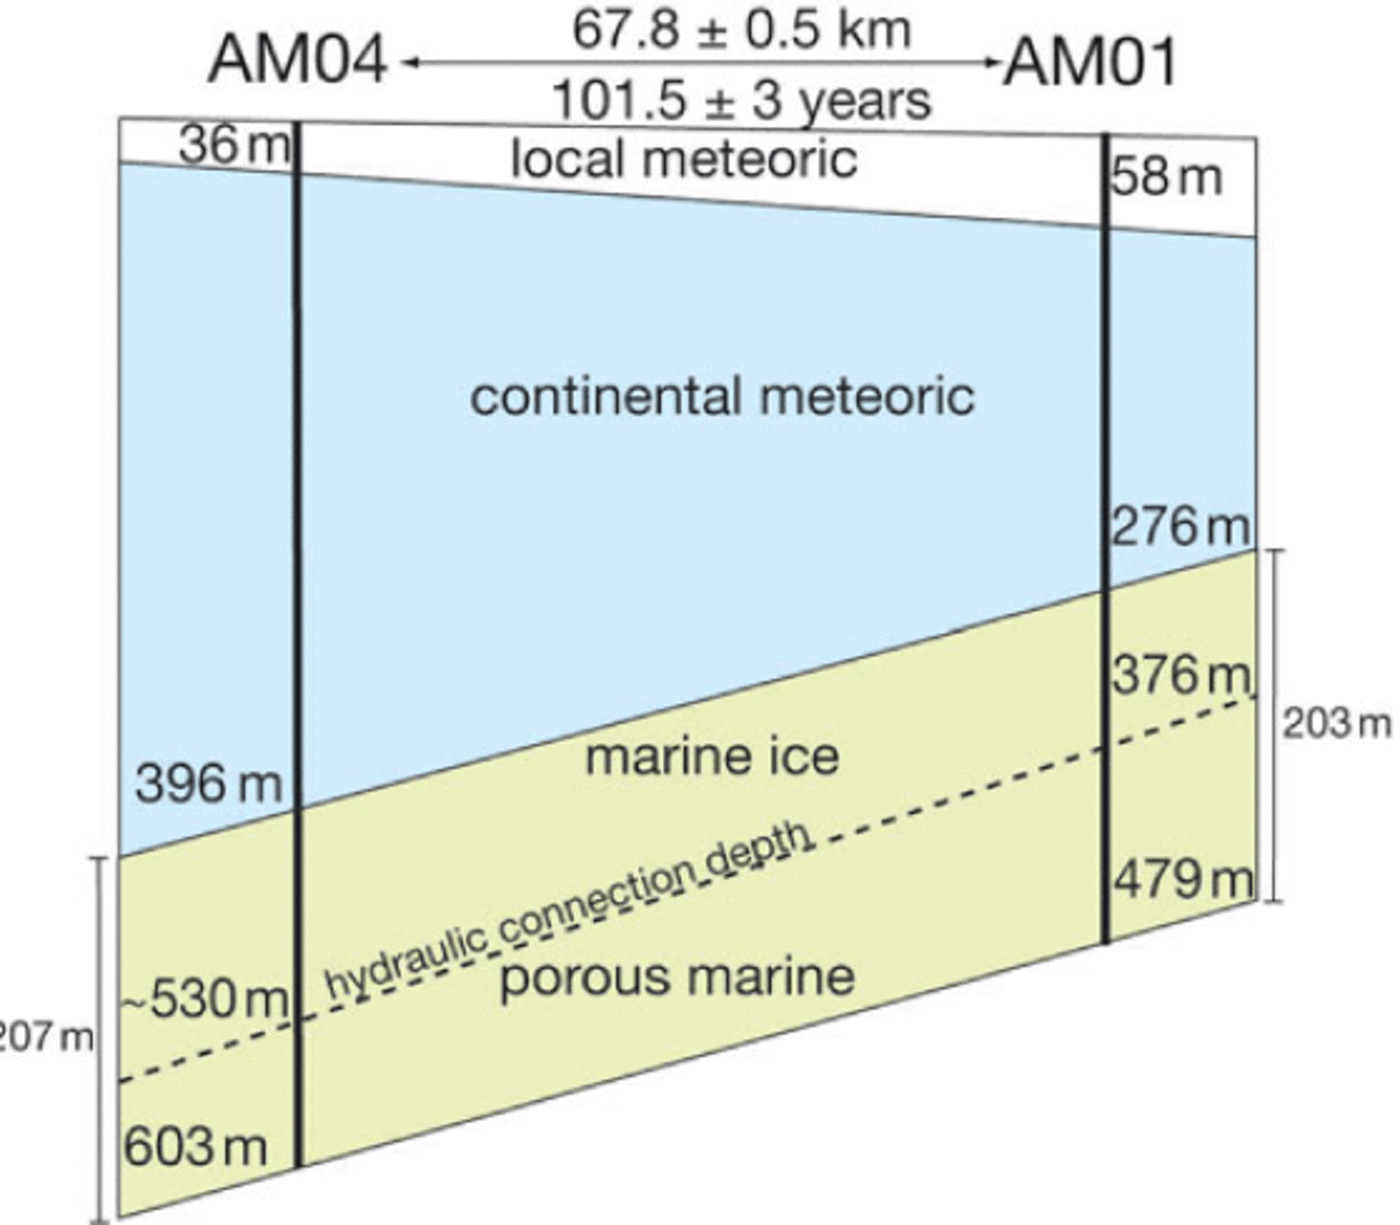
At AM01 the hot-water drill coring barrel was used to retrieve ice cores at 240 m depth within the meteoric ice and depths of 290, 360 and 390 m within the marine ice layer (Reference CravenCraven and others, 2004). Figure 3 provides a schematic illustration of the ice-shelf thickness profile and structure along the AM04-AM01 flowline and indicates a horizon within the marine ice layer, referred to as the hydraulic connection depth. Marine ice below this depth has a sufficient concentration of interconnected brine-filled pores and channels to maintain a hydraulic connection to the underlying ocean (Reference CravenCraven and others, 2004). At AM01 the measured total ice thickness is 479 m, with a hydraulic connection noted at a drill depth of 376m, suggesting the lower 103 m of marine ice is permeable (Reference CravenCraven and others, 2004). The AM01-390 marine ice core is the only ice core retrieved from within this permeable layer.
Schematic Amery Ice Shelf thickness profile along the AM04-AM01 flowline. The hydraulic connection depth was detected during hot-water drilling operations (after Reference Craven, Allison, Fricker and WarnerCraven and others, 2009).
In the 2003/04 austral summer a further borehole, AM01b, was drilled at the AM01 field site, which had moved 1.6 km northeast with the bulk ice-shelf flow since the 2001/02 drilling season. A meteoric ice core was retrieved from 255 m depth. Digital video footage from the AM01b borehole verifies the meteoric/marine ice transition at 276 m (Reference CravenCraven and others, 2004, Reference Eicken, Oerter, Miller, Graf and Kipfstuhl2005). Attempts were made to retrieve a core across the meteoric/marine ice transition, but the inherent difficulty in precisely controlling the hot-water coring barrel depth resulted in two cores from ˜280 m depth, just below the meteoric/marine ice transition. Marine ice samples from ˜280 m depth in the geographically colocated G1 core have been analysed for comparison with the corresponding AM01b samples.
Upstream, at the AM04 site, a single meteoric ice core was retrieved from 350 m. Marine ice cores were retrieved at 50 m intervals from 400, 450 and 500 m depth. The total ice- shelf thickness, of 603 m, at AM04 was measured using the borehole video system and a borehole caliper tool. Reference Craven, Allison, Fricker and WarnerCraven and others (2009) report the meteoric/marine ice interface was detected at 396 m from video observations, giving a marine ice layer thickness of 207 m. A hydraulic connection depth of 530-535 m was registered during drilling.
Temperature profiles from thermistor strings left to freeze into the Amery Ice Shelf at the AM01 and AM04 drill sites (Fig. 4) indicate that below the hydraulic connection depth marine ice is nearly isothermal at the in situ freezing point. The thickness of the ice above the permeable marine ice close-off depth strongly influences the gradient of the temperature profile (Reference Craven, Allison, Fricker and WarnerCraven and others, 2009).
Temperature profiles at the refrozen AM01 and AM04 boreholes measured by in situ thermistor strings. Data are from Reference Craven, Allison, Fricker and WarnerCraven and others (2009). Temperatures from the G1 borehole (black curve) are shown for comparison with the current AM01 data.

Observed flow at the AM01 and AM04 borehole sites
Figure 5 shows the computed distribution of Amery Ice Shelf vertical strain rates and shear strain rates transverse to the local flow direction, calculated using the inferometric synthetic aperture radar (InSAR)-derived surface velocities of Reference Young and HylandYoung and Hyland (2002). Strain-rate tensors for the AM01 and AM04 borehole sites (Fig. 5) are given in Equations (1) and (2). Local orthogonal (right-handed) coordinate systems are defined with the x-direction tangent to the flowline, a transverse y-direction and the vertical z-direction normal to the x-y plane. As noted previously, the AM04 site is ˜68km upstream from AM01 along the same flowline.


Amery Ice Shelf strain rates calculated using the InSAR-derived surface velocities of Reference Young and HylandYoung and Hyland (2002). The AM01 and AM04 boreholes and the approximate flowline passing through the two sites are indicated. (a) Vertical strain rates. Negative values (blue) indicate compression. (b) Shear strain rates,  , are aligned to the local flow direction. As Amery Ice Shelf velocities are highest near the centre of the shelf and decrease towards the margins, the sign of the transverse shear strain rate, , changes across the shelf. Horizontal and vertical axes indicate distance from the geographic South Pole.

Equation (1) indicates nearly two-dimensional flow, dominated by longitudinal extension and vertical compression, with no appreciable simple shear at the AM01 site, which is similar to the deformation described by Reference Budd, Smith, Wishart and OuraBudd and others (1967) for the geographically colocated G1 core site. The flow situation upstream at AM04, which is closer to the western margin of the shelf, is complex and differs from AM01. Figure 5 and Equation (2) indicate a significant transverse shear deformation, Exy , relative to the local flow direction due to velocity gradients across the shelf. Longitudinal extension and vertical compression strain rates are approximately equivalent at AM04. Reference Budd, Smith, Wishart and OuraBudd and others (1967) report a similar flow situation of two-dimensional compression and extension, combined with transverse shear for a location towards the margin of the Amery Ice Shelf, west of the G1/AM01 site. Furthermore, upstream of AM04 the flowline passes through a region along the ice-shelf margin dominated by transverse shear, E xy.
Equations (1) and (2) indicate that as ice flows northwards from AM04 to AM01 within the Amery Ice Shelf it accelerates and diverges, leading to significant longitudinal and (relatively lower) transverse strain rates. Due to the incompressibility of ice, there is a corresponding vertical strain rate, resulting in thinning of the ice shelf. Analysis of mass balance along the AM04-AM01 flowline by Reference Craven, Allison, Fricker and WarnerCraven and others (2009) indicates that the 207 m marine ice layer at AM04 would be reduced to 113.9m by strain thinning as it flows to AM01. As the measured marine ice thickness at AM01 is 203 m, an additional 89.1 m of ice must be added between AM04 and AM01. Because ice accumulated upstream of AM01 is also subject to strain thinning, the total accumulation between AM04 and AM01 is estimated to be 118.1 m, with an average annual accumulation rate of 1.16 ma-1 (Reference Craven, Allison, Fricker and WarnerCraven and others, 2009). Thus, nearly half of the marine ice layer present at the AM01 site is accreted downstream of AM04.
Amery Ice Shelf Meteoric Ice
Ice Crystal orientation fabrics and texture
All crystal orientation fabric data presented in this text were measured using a Russell-Head Instruments G50 automated ice crystal fabric analyser and are presented in a horizontal reference frame (lower hemisphere projection). Data were obtained from either horizontal or vertical thin sections. Where possible, horizontal thin sections were obtained from the top or bottom of well-formed cores. For cores with tapered ends and those with a large grain size relative to the core diameter, vertical thin sections were obtained from a chord section cut along the long axis of the cores. For crystal orientations obtained from vertical thin sections, the c-axis data have been rotated into the horizontal reference frame. To allow direct comparison with historical records (e.g. Reference Wakahama and KuroiwaWakahama, 1974) reported grain sizes, ga , are the arithmetic mean grain area determined from the total thin section area and number of grains, N. Histograms of c-axis colatitudes (e.g. Fig. 6a) include a solid black curve to indicate the frequency of c-axis colatitudes in an ideal isotropic distribution.
Crystal orientation fabric and texture of meteoric ice from 255m depth at the G1/AM01 site. (a) AM01b-255c vertical thin section data. N = 81 crystals, mean grain area, g a = 34:9mm2. Schmidt plot of c-axis orientations (top), colatitude frequency histogram (middle) and radial histogram of c-axis azimuths (bottom). (b) G1-255 site crystal orientation fabric data reproduced from Reference Wakahama and KuroiwaWakahama (1974). (c) Russell-Head Instruments G-50 automated fabric analyser photomicrograph of the AM01b-255c vertical thin section viewed between orthogonal-plane polarizing filters.
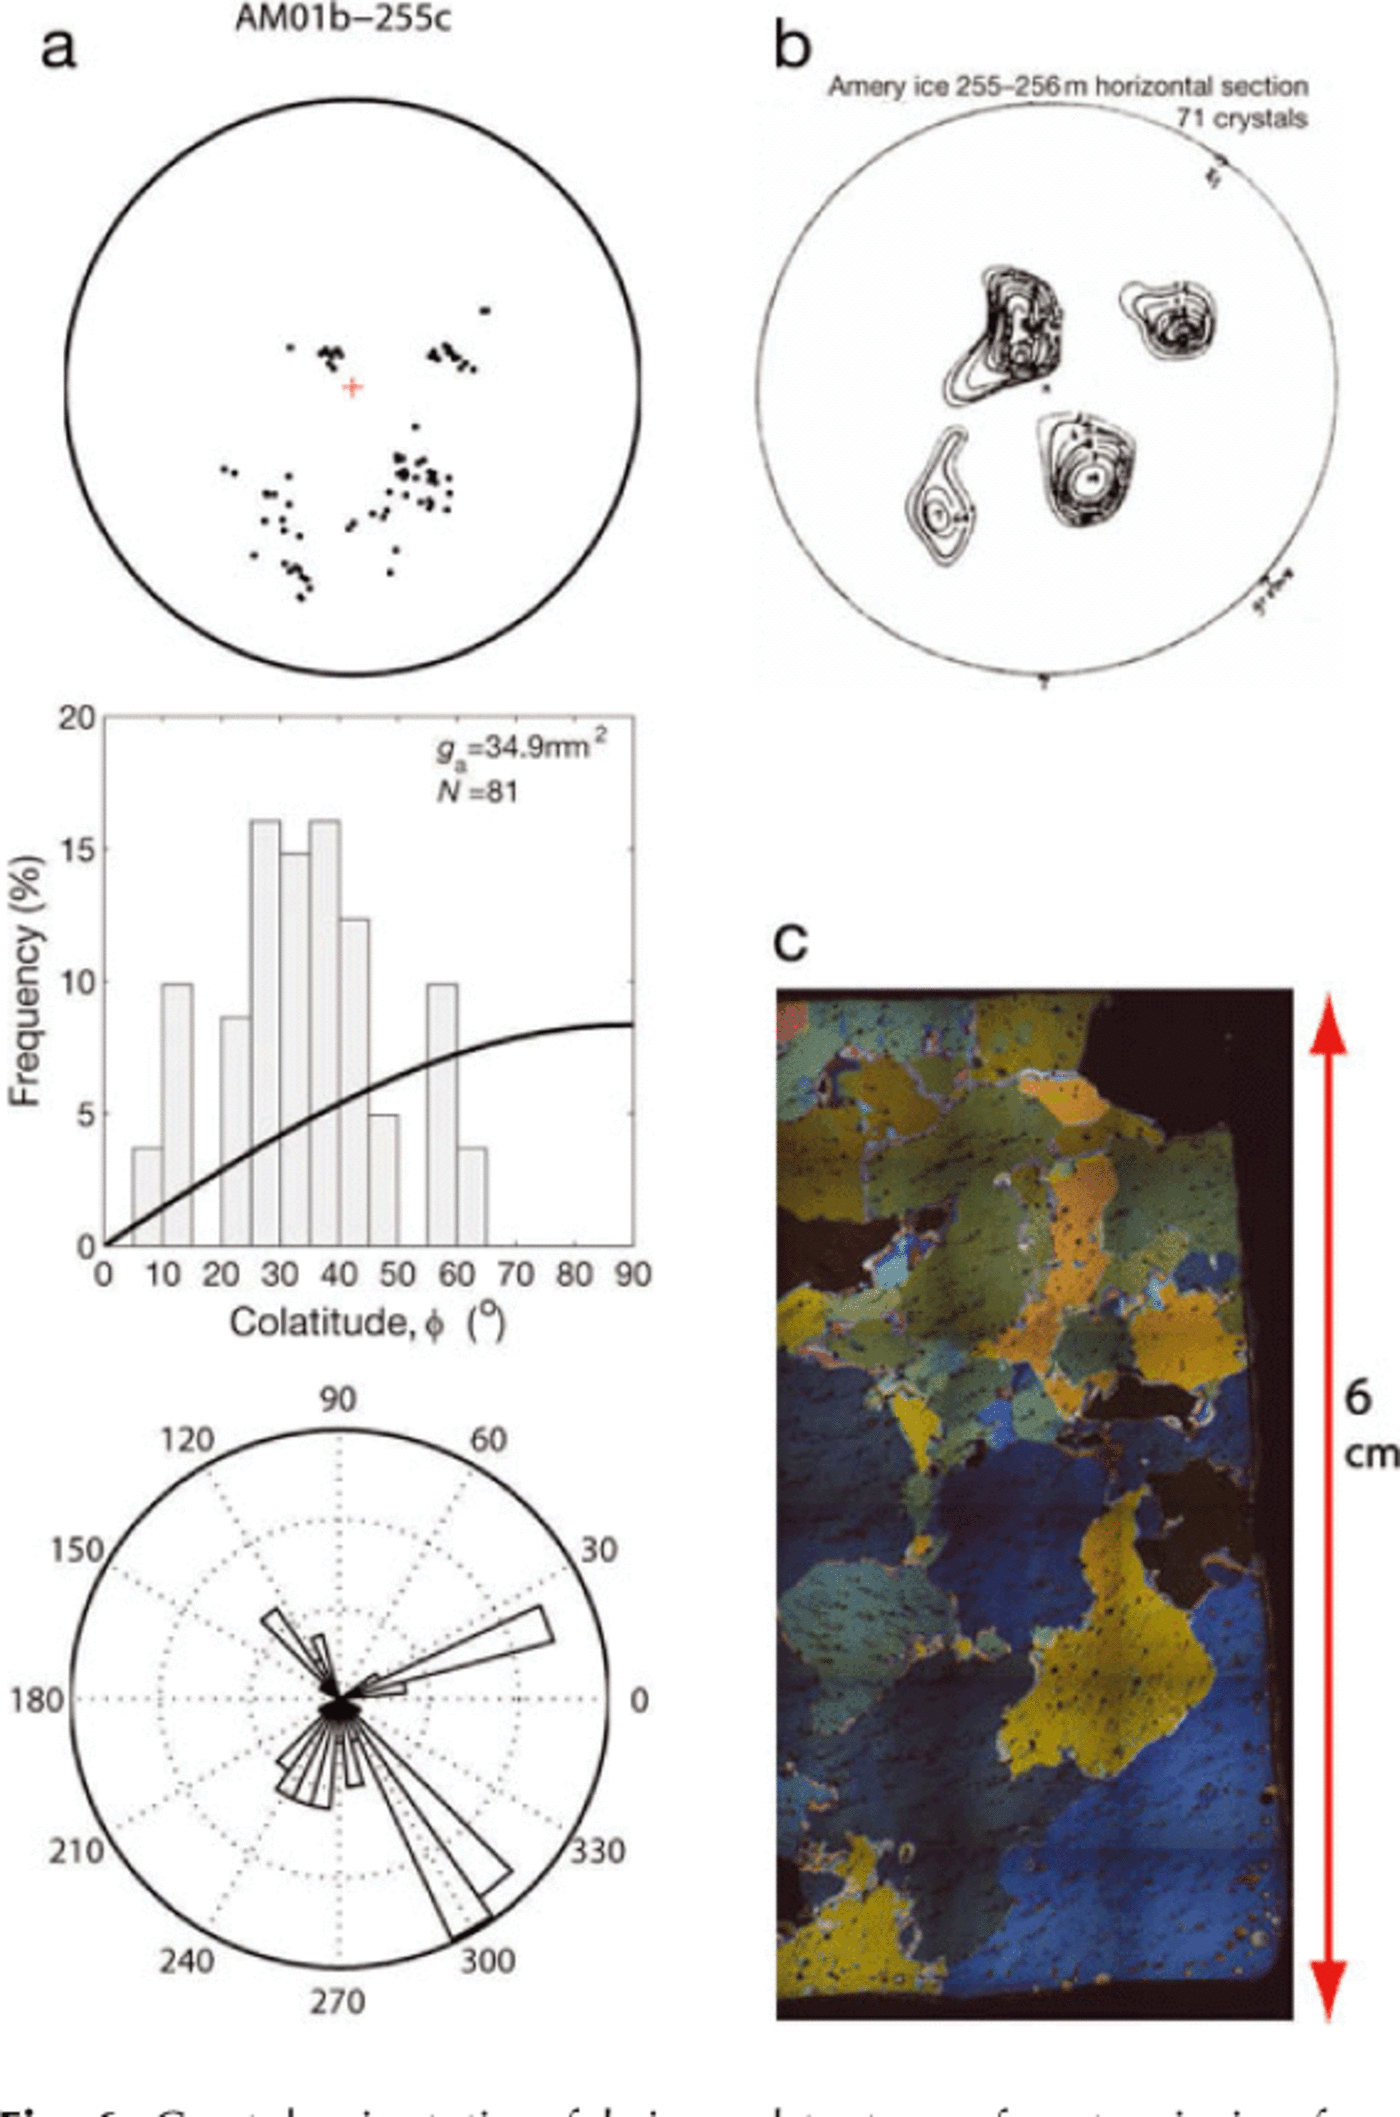
Meteoric ice samples AM01-240 and AM01b-255 display multiple-maxima crystal orientation fabrics and coarsegrained textures (Fig. 6). Multiple-maxima fabrics are characterized by low misorientation angles between adjacent or nearly adjacent grains, leading to the formation of several distinct poles of alignment. Within ice sheets such fabric patterns are typically encountered below the high shear layer (e.g. Reference Wakahama and KuroiwaWakahama, 1974;Reference Gow and WilliamsonGow and Williamson, 1976;Reference Tison, Thorsteinsson, Lorrain and KipfstuhlTison and others, 1994; Reference LiLi, 1995;Reference GowGow and others, 1997;Reference DiPrinzio, Wilen, Alley, Fitzpatrick, Spencer and GowDiPrinzio and others, 2005) in relatively warm basal ice which has undergone a stress relaxation as a result of topographically induced flow stagnation (Reference Russell-Head and BuddRussell-Head and Budd, 1979; Reference Budd and Rowden-RichBudd and Rowden-Rich, 1985). All meteoric ice core samples described in this paper are from below the layer of local accumulation and thus contain material that has entered the Amery Ice Shelf in the region of the Southern Prince Charles Mountains. As the G1 and AM01/AM01b cores were drilled at the same geographic location, thin sections obtained from corresponding depths can be directly compared. The multiple-maxima crystal orientation fabric reported by Reference Wakahama and KuroiwaWakahama (1974) for the G1 core at 255 m depth (Fig. 6) is similar to that measured for the AM01b- 255c core. Grain sizes of ˜-100mm2 for AM01/AM01b meteoric ice samples (Fig. 7) agree well with original measurements of the G1 core by Reference Wakahama and KuroiwaWakahama (1974). Due to the large mean grain size of meteoric ice at AM01 and AM04 relative to the core diameters of ˜-100mm, the number of grains included in thin sections is typically restricted to N ≈ 50—100. Such small grain counts per thin section partially account for the variability in meteoric ice mean grain-size estimates (Fig. 7).
Variation of grain size with depth for Amery Ice Shelf cores. The data of Reference Wakahama and KuroiwaWakahama (1974) for the G1 core have been plotted to allow comparison with grain sizes measured for several thin sections from the AM01/AM01b and AM04 ice cores.

Multiple-maxima crystal orientation fabrics similar to those observed in meteoric ice samples from the AM01/ AM01b site (Fig. 6) have been reported previously for the Ross (Reference GowGow, 1963) and the Ronne Ice Shelves (Reference Eicken, Oerter, Miller, Graf and KipfstuhlEicken and others, 1994). Whilst there is no azimuthal orientation control relative to the ice-shelf flow direction for the hot- water drilled cores, it is apparent that the angular distribution of the maxima differs in the Amery, Ross and Ronne Ice Shelf meteoric ice crystal orientation fabrics. Reference BuddBudd (1972) suggests such differences arise from dissimilar flow histories at each site. Meteoric ice crystal orientation fabrics from AM04-350 (Fig. 8) were characterized by a less distinct multiple-maxima pattern compared with the AM01 site. In addition to the four-maxima, Figure 8 indicates the presence of opposing clusters of near-horizontal c-axes in the AM04- 350 crystal orientation fabric. These clusters are attributed to differences in flow conditions at AM01 and AM04, which are discussed in the following subsection.
AM04 site meteoric ice crystal orientation fabric from the AM04-350 core. Vertical thin section. Schmidt equal-area c-axis plot (top left), histogram of c-axis colatitudes, ϕ(top right) and radial histogram of c-axis azimuths (bottom left).

Relationship between meteoric ice crystal orientation fabrics and ice-shelf dynamics
In the Amery Ice Shelf meteoric ice layer, which originates from grounded continental ice flowing into the shelf, the observed multiple-maxima crystal orientation fabrics and large mean grain areas are characteristic of zones in large ice masses that have undergone stress relaxation and recrystallization (e.g. Reference Budd and JackaBudd and Jacka, 1989). Laboratory stress- relaxation experiments conducted by Reference GaoGao (1989) demonstrate that for a sample in tertiary creep with an anisotropic crystal orientation fabric compatible with the applied stress configuration, a gradual reduction in stress under isothermal conditions leads to the development of multiple-maxima crystal orientation fabrics and larger mean grain sizes, similar to that observed in the AM01 meteoric ice.
Reference Budd and JackaBudd and Jacka (1989) provide tabulated octahedral shear stress/octahedral shear strain-rate data for isotropic polycrystalline ice for temperatures from -0.02°C to -50.0°C, based on experimental observations. Using these data, along with AM01 and AM04 strain rates (Equations (1) and (2)) and temperature profiles (Fig. 4), the deviatoric stresses driving deformation at AM01 and AM04 are estimated to be to ≈ 0.05 MPa. This value agrees with estimates of stresses in the Ronne Ice Shelf by Reference Eicken, Oerter, Miller, Graf and KipfstuhlEicken and others (1994). Significant basal melting of ungrounded meteoric ice entering the Amery Ice Shelf makes estimating the past maximum grounded ice depth of AM01 and AM04 meteoric ice samples difficult. Reference AllisonAllison (1979) indicates that basal shear stresses in grounded ice entering the southern region of the Amery Ice Shelf may be as high as t ≈ 0.20 MPa. It is therefore reasonable to expect that the deviatoric stresses driving deformation of the grounded ice are higher than those experienced by the same ice once afloat as part of the Amery Ice Shelf where the basal shear stress has decreased to zero. This reduction in driving stresses results in considerable relaxation of highly strained microstructures, enabling significant grain growth and fabric modification in the meteoric ice as it flows downstream through the AM04 and AM01 sites.
The AM04 meteoric ice multiple-maxima fabrics are more complex than those from AM01. The individual maxima are less distinct and the opposing clusters of nearhorizontal axes may indicate some compatibility with the transverse xy-shear component of the stress configuration evident at AM04 and increasingly upstream. Without azimuthal control of the ice cores, this interpretation is somewhat speculative. The difficulty in interpreting the AM04 fabric pattern reflects the complex stress configuration driving deformation up to AM04 and the influence of flow history, stress relaxation and grain growth on meteoric ice fabric evolution within the Amery Ice Shelf.
Amery Ice Shelf Accreted Marine Ice
Crystal orientation fabrics and texture
Digital video footage of the AM01b and AM04 boreholes (Reference CravenCraven and others, 2005) indicates the lowest 40-50 m of the permeable but consolidated marine ice layer is characterized by regions of bonded platelets and interstitial sea-water-filled cavities. Whilst the presence of platelet ice at the ice-shelf base indicates a marine ice accretion mechanism, Reference Craven, Allison, Fricker and WarnerCraven and others (2009) note that no unattached platelets were observed within the borehole during drilling, suggesting active accretion was not occurring locally during the short observation period. This is attributed to the highly seasonal cycles of temperature, salinity and flow within the Amery Ice Shelf cavity, which are thought to produce corresponding variability in marine ice accretion (Reference Leffanue and CravenLeffanue and Craven, 2004).
AM01 marine ice
Crystal orientation fabrics were measured for marine ice cores obtained from the AM01/AM01b sites at depths of 280 and 390 m. Marine ice crystal orientation fabric data from ˜280 m depth in the G1 core (Fig. 9) were obtained from new thin sections. The AM01b-280a and G1-280 crystal orientation fabrics and mean grain size (Fig. 9a and b) agree closely and are characterized by a vertical or near-vertical large circle girdle of c-axis orientations that appears as a band of orientations in the horizontal reference frame. The difference in alignment of the band of c-axis orientations is not significant, as azimuthal orientation of the cores relative to the bulk ice-shelf flow at the time of drilling is not known.
Crystal orientation fabric data for marine ice samples from _280m depth in the AM01b and G1 Amery Ice Shelf cores. (a) Vertical AM01b-280a, (b) horizontal G1-280 and (c) vertical AM01b-280b thin sections showing (top) Schmidt equal-area plot of c-axis orientations, (middle) histogram of c-axis colatitudes and (bottom) radial histogram of c-axis azimuths. (d) Artificial colour images encoding c-axis orientation directions in (top) AM01b-280a and (bottom) AM01b-280b thin sections, indicating the significant difference in mean grain area, g a. The AM01b-280a grain size is typical of the majority of Amery Ice Shelf marine ice observations.

Comparison of the new crystal orientation fabric and mean grain-area measurements (Figs 7 and 9b) for the G1- 280 core section with corresponding data originally presented by Reference BuddBudd (1972) and Reference Wakahama and KuroiwaWakahama (1974) indicates no noticeable change in these microstructural features of the G1 core in the 40years since drilling. During this time the core has been stored at or below —18°C (personal communication from T. Van Ommen, 2008). Additionally, the similarity in crystal orientation fabric and mean grain- area data for the G1 and the majority of AM01b core sections (Figs 6, 7 and 9) suggests coring with a hot-water drill system does not adversely influence these large-scale microstructural features.
The horizontal small circle girdle crystal orientation fabric of the AM01b-280b section (Fig. 9c) differs significantly from the vertical large circle girdle fabrics of the AM01b-280a and G1-280 sections (Fig. 9a and b). Furthermore, Figures 7 and 9d indicate the mean grain area for the AM01b-280b sample is approximately one order of magnitude greater than the AM01b-280a, G1 and AM04 marine ice samples. These marked differences in fabric and texture occur over a vertical separation of ˜1 m: the AM01b- 280a and AM01b-280b cores were recovered on consecutive coring attempts. The AM01b-280b fabric is a composite of nine successive, similarly oriented vertical sections obtained along the 450 mm length of the AM01b-280b core. Due to the nearly identical depth of the AM01b-280a and AM01b-280b cores, the age and strain histories of the samples are assumed to be similar, allowing variations in macroscopic deformation since accretion to be eliminated as a possible cause of the observed differences in crystal orientation fabric and grain size. Variability in the concentration of insoluble particulate inclusions as a possible cause for the marked differences between AM01b-280a and AM01b-280b crystal orientation fabrics and textures is discussed in a later section.
AM01 marine ice from below the hydraulic connection depth
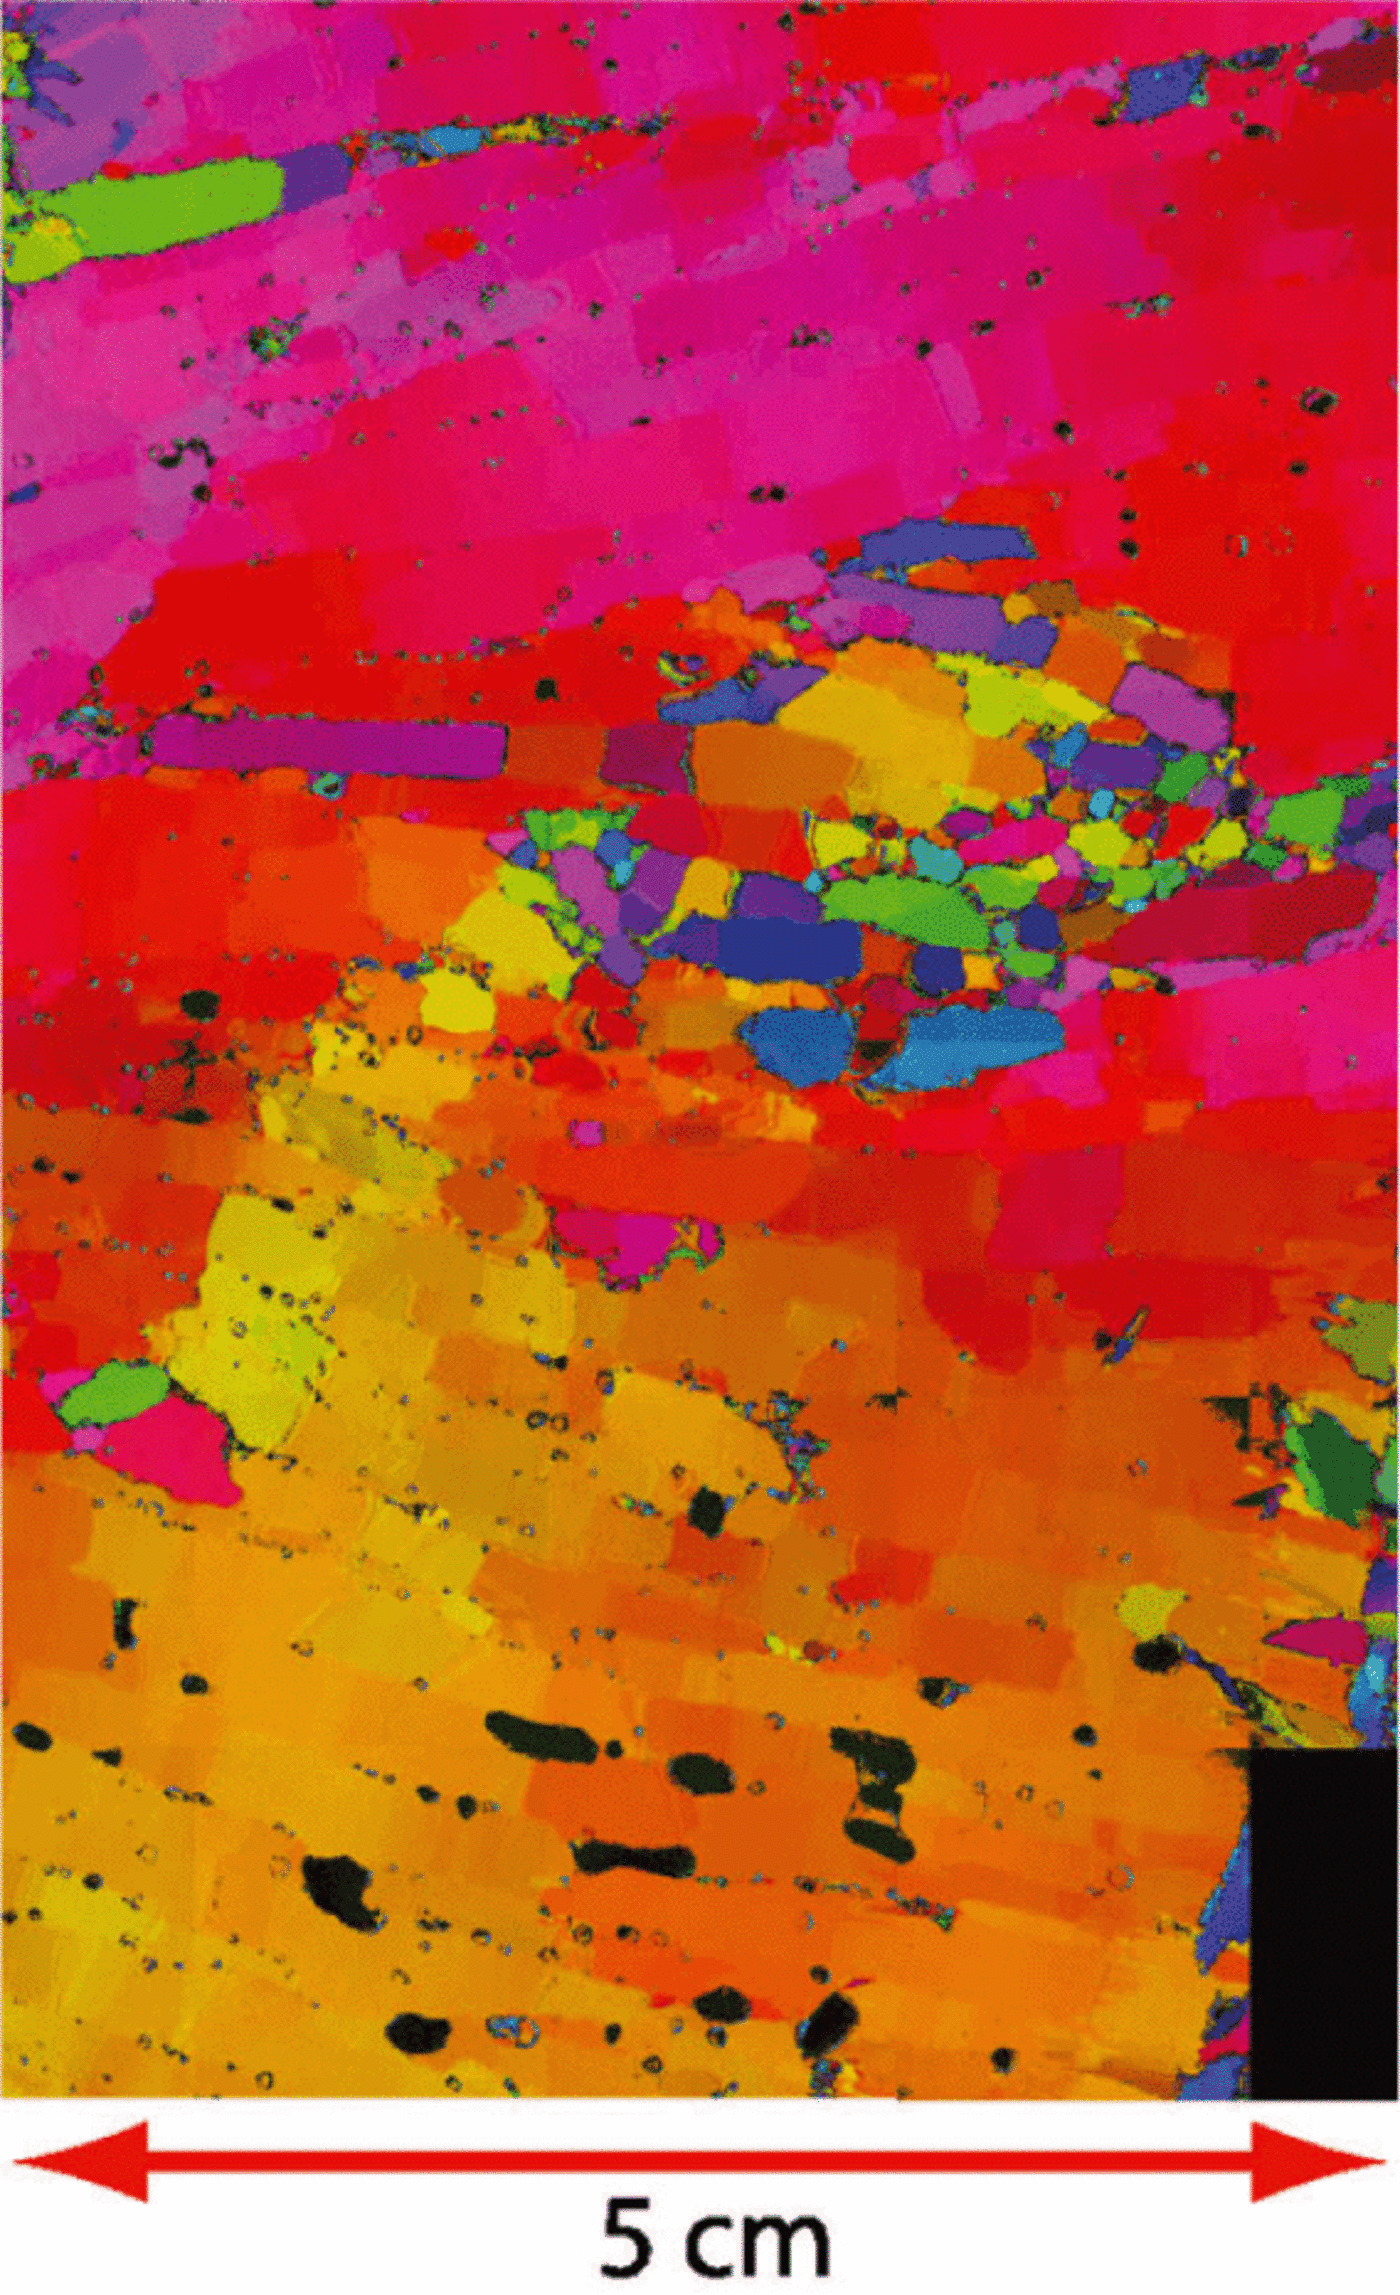
The texture of the AM01-390 sample obtained from 16m below the hydraulic connection depth (Fig. 10) is characterized by regions of elongated, nearly rectangular crosssection grains with small misorientations between adjacent grains. In this false-colour image, colour intensity represents the c-axis colatitude (most c-axes here lie in the plane of the vertical thin section), whilst the hue represents the c-axis azimuth (with similar colours indicating low neighbour- grain misorientations). The strongly vertically aligned crystal orientation fabric (Fig. 11) associated with the elongated and banded texture differs from observations of Amery Ice Shelf marine ice from above the hydraulic connection depth at AM01 and AM04. Similar banded, generally horizontally elongated textures have been reported within marine ice layers in the Hells Gate and Ronne Ice Shelves (Reference Eicken, Oerter, Miller, Graf and KipfstuhlEicken and others, 1994;Reference Tison, Lorrain, Bouzette, Dini, Bondesan, Stievenard and JeffriesTison and others, 1998). In the case of the Hells Gate Ice Shelf, Reference Tison, Lorrain, Bouzette, Dini, Bondesan, Stievenard and JeffriesTison and others (1998) also report the occurrence of strongly anisotropic, typically vertical, single pole fabrics.
Vertical thin section photomicrograph from the Amery Ice Shelf AM01-390 ice core obtained from below the hydraulic connection depth. Grain colours are c-axis orientation-dependent. Bands of elongated grains are visible. The rounded, dark features in the lower section of the diagram indicate the location of interconnected, previously brine-filled, pores and channels.
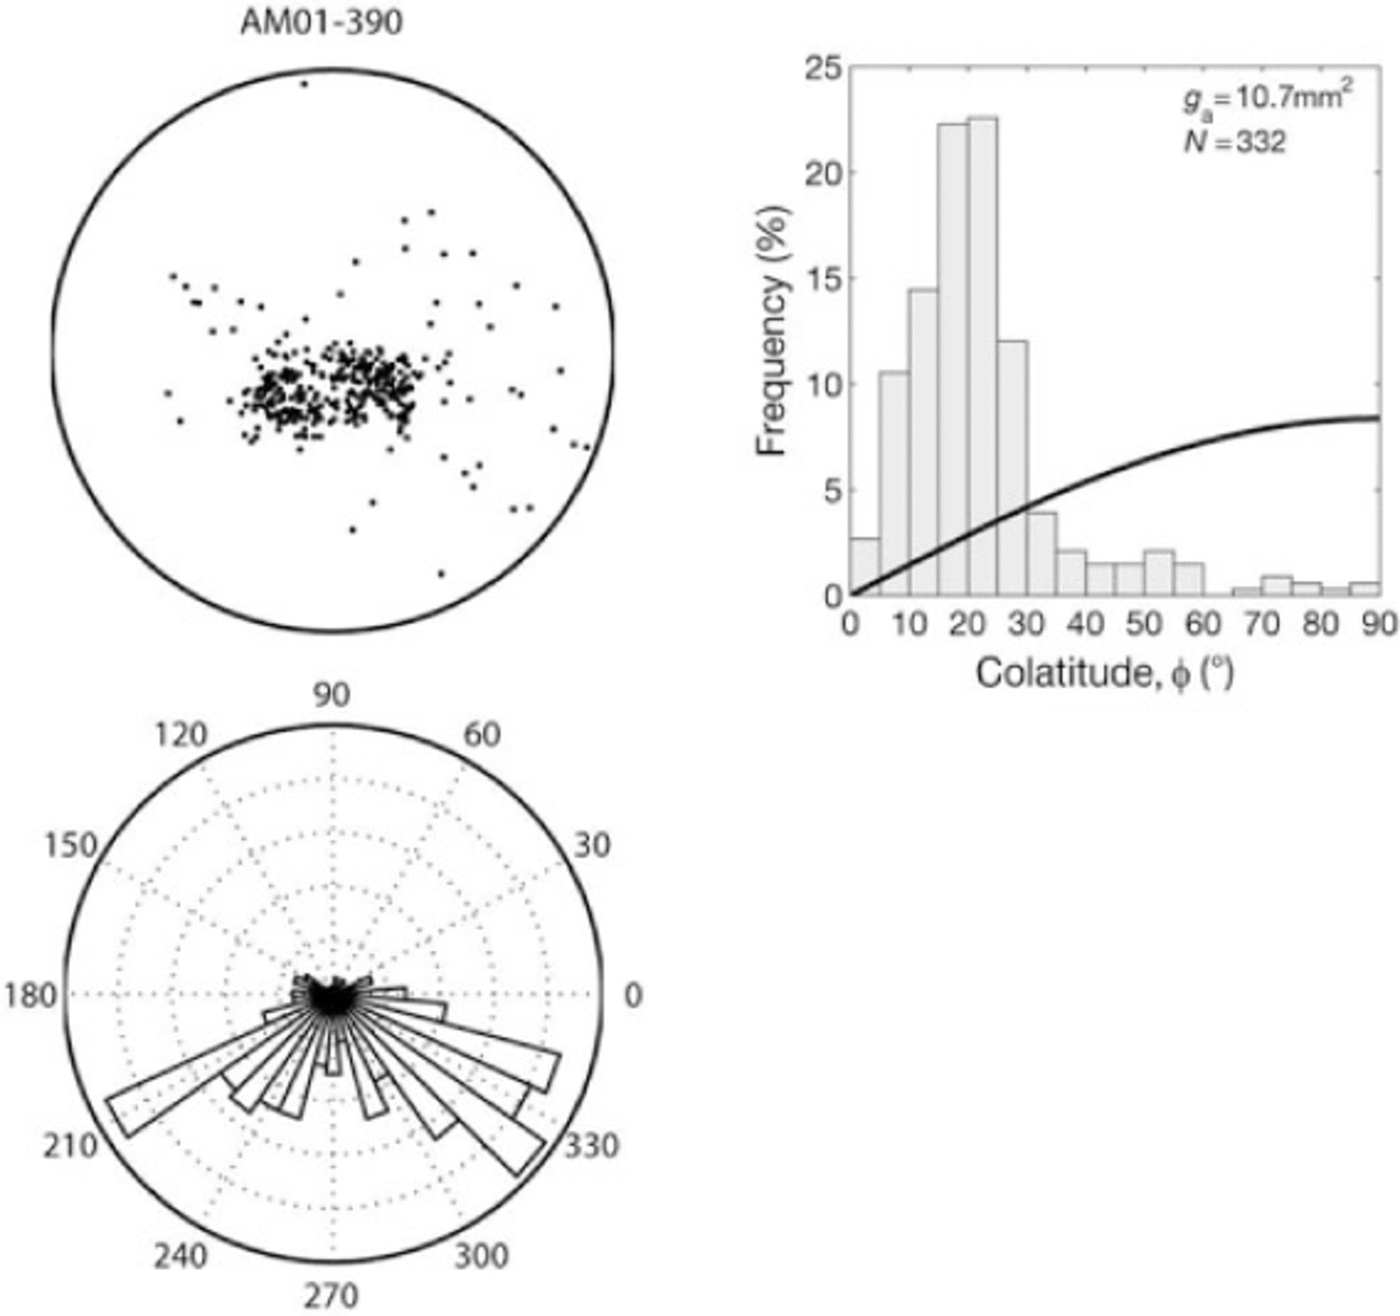
Crystal orientation fabric data for Amery Ice Shelf marine ice core AM01-390, obtained below the hydraulic connection depth of 376m at the AM01 borehole site. Data are from the AM01- 390 vertical thin section shown in Figure 10.
Several authors (Reference Engelhardt and DetermannEngelhardt and Determann, 1987;Reference OerterOerter and others, 1992;Reference Eicken, Oerter, Miller, Graf and KipfstuhlEicken and others, 1994) have suggested the Ronne Ice Shelf marine ice layer results from accretion of frazil ice platelets originating in the ocean cavity onto the ice-shelf base. Currents within the shelf cavity and buoyancy forces driving accretion onto the base of the ice shelf result in preferential platelet orientations, approximately parallel to the ice-shelf lower surface slope. Consolidation of the marine ice layer is driven by buoyancy-derived stresses produced by continued accumulation of platelet ice at the ice-shelf base, in a process analogous to firn densification (Reference Eicken, Oerter, Miller, Graf and KipfstuhlEicken and others, 1994). With time and continued accumulation the platelets become fused, with grain boundaries forming at surfaces where platelets are in contact with one another. Residual sea-water-filled voids, many of which are interconnected, enable a substantial portion of the marine ice layer to remain in hydraulic connection with the water column. Continued platelet accumulation, buoyancy- driven fragmentation and settling of platelets, plus solidification and grain growth result in a gradual reduction in porosity and permeability with distance from the base of the marine ice layer. Field observations (Reference Tison, Lorrain, Bouzette, Dini, Bondesan, Stievenard and JeffriesTison and others, 1998; Reference Khazendar, Tison, Stenni, Dini and BondesanKhazendar and others, 2001) and model studies (Reference Khazendar and JenkinsKhazendar and Jenkins, 2003) of smaller ice shelves indicate localized ice-pump mechanisms can result in the formation of relatively thin marine ice layers within ice-shelf basal crevasses and rifts. Due to the large extent and thickness of Amery Ice Shelf marine ice (Fig. 3), such localized marine ice formation processes influenced by significant local variations in the cavity profile are not considered important to marine ice formation along the AM04-AM01 flowline. Amery Ice Shelf marine ice accretion commences ˜-350km downstream of the southern limit of the grounding zone, at a point where the ice thickness has decreased to 700 m from an initial value of 2500 m, due to basal melting and strain thinning (Reference Craven, Allison, Fricker and WarnerCraven and others, 2009).
Based on borehole video footage indicating the presence of rectangular platelet structures near the base of the AM01b borehole and visual inspection of the AM01-390 ice core, Reference CravenCraven and others (2005) suggest an accretion mechanism similar to that proposed for the Ronne Ice Shelf (Reference OerterOerter and others, 1992;Reference Eicken, Oerter, Miller, Graf and KipfstuhlEicken and others, 1994) operates on the Amery Ice Shelf. The highly anisotropic AM01-390 crystal orientation fabric and horizontally elongated texture (Fig. 11) strongly reflect this mode of marine ice accretion. The remaining AM01/AM01b and AM04 marine samples from above the hydraulic connection depth display what is interpreted as modified microstructures and fabrics influenced by the dynamic and thermal history of the ice since accumulation.
The complex interaction and variability in processes contributing to frazil ice platelet formation and accretion is expected to produce small-scale differences in accreted marine ice crystal orientation fabrics and texture. The gradual shift in orientation-dependent colour intensity and hue of grains in Figure 10 corresponds to slight changes in neighbouring grain c-axis orientations. The small proportion of scattered higher colatitude c-axis orientations surrounding the vertical maximum (Fig. 11) corresponds to the distinct region of small, less regularly shaped grains visible above the centre of the AM01-390 section (Fig. 10). These crystals were most likely formed by post-depositional solidification within a sea-water-filled void created during initial platelet accretion. Reference Eicken, Oerter, Miller, Graf and KipfstuhlEicken and others (1994) described similar local variations in orientation and grain size over intervals of ˜10 mm in marine ice from the Ronne Ice Shelf. Such localized variations in c-axis anisotropy do not strongly influence large-scale trends in fabric patterns observed over spatial scales that are likely to influence ice-shelf dynamics (Reference BuddBudd, 1972;Reference Eicken, Oerter, Miller, Graf and KipfstuhlEicken and others, 1994).
AM04 marine ice
Representative crystal orientation fabric data for AM04 borehole marine ice cores from depths of 400, 450 and 500 m are presented in Figure 12. All samples were obtained above the AM04 hydraulic connection depth of 530-535 m. The AM04 marine ice fabrics display vertical or near-vertical large circle girdles, which are similar to, but generally less distinct than, those observed in the AM01b-280 and G1-280 marine ice samples. The AM04 marine ice core mean grain areas, g a = 4-10 mm2, are similar to the typical AM01b/G1 marine ice and approximately one order of magnitude lower than the AM04 meteoric ice (Fig. 7). An additional feature of the AM04 marine ice crystal orientation fabrics is the presence of a superimposed cluster of orientations within the large circle girdle.
Crystal orientation fabrics for Amery Ice Shelf marine ice cores from the AM04 borehole at approximate depths of 400, 450 and 500 m. Data are from the (a) horizontal AM04-400c, (b) horizontal AM04-450a, (c) vertical AM04-500a and (d) vertical AM04-500c thin sections.

The mean orientation of the superimposed cluster of c-axes varies considerably between the cores in an apparently non-systematic manner. This variability is illustrated by the c-axis colatitude frequency-distribution histograms (Fig. 12), and in particular by comparison of the AM04-500a and AM04-500c distributions, where the samples are vertically separated by <2 m. The possibility that the orientation of the superimposed cluster may be a consequence of the marine ice accumulation process, indicating the dominant platelet orientation at the time of accretion, is discussed in following subsections.
Insoluble particulate and brine inclusions
Particulate inclusions, present variously in linear, planar and random dispersions, have been observed in all Amery Ice Shelf marine ice cores from the G1, AM01/AM01b and AM04 borehole sites (Reference Wakahama and KuroiwaWakahama, 1974;Reference CravenCraven and others, 2004, Reference Craven2005, Reference Craven, Allison, Fricker and Warner2009). Reference Roberts, Craven, Cai, Allison and NashRoberts and others (2007) report that particulate inclusions from the AM01 cores comprised approximately two-thirds lithogenic and one-third biogenic material, although it is reasonable to expect these proportions to vary throughout the marine ice layer due to spatial and temporal variability in the accretion process and biological activity beneath the Amery Ice Shelf and in Prydz Bay, north of the ice shelf. Inclusions range in size from pm- scale to ˜1 mm particulates (Reference Roberts, Craven, Cai, Allison and NashRoberts and others, 2007), of which the latter could be clearly observed with the naked eye. Similar linear and planar distributions of particulate inclusions have been described by Reference Eicken, Oerter, Miller, Graf and KipfstuhlEicken and others (1994) for regions of the Ronne Ice Shelf marine ice layer in close proximity to the meteoric/marine ice transition.
The size and concentration of brine inclusions visibly increases with depth in the AM01 and AM04 marine ice cores (Reference Craven, Allison, Fricker and WarnerCraven and others, 2009). Below the hydraulic connection depth, brine inclusions tend to be large, often interconnected vertical or sub-vertical channels and pores (Fig. 10). Above the hydraulic connection depth, interconnections between pores are closed off by continued consolidation of the marine ice layer, but many inclusions retain a sinuous structure (Fig. 13). In older marine ice, closer to the meteoric/marine ice interface, brine inclusions become increasingly isolated and spherical. Analysis of the brine distribution in Ronne Ice Shelf marine ice cores by Reference Moore, Reid and KipfstuhlMoore and others (1994), including scanning electron microscope examination, revealed that in addition to discrete inclusions such as those observed in the Amery Ice Shelf marine ice cores, brine was also present along grain boundaries. Reference CravenCraven and others (2005) confirm the brine concentration increases with depth at AM01, with total core salinities of 0.03% at the meteoric/marine ice transition increasing to 0.56% at 390 m. Total salinities at the Amery Ice Shelf meteoric/marine ice transition are thus comparable to the upper regions of the Ronne Ice Shelf marine ice layer (Reference Eicken, Oerter, Miller, Graf and KipfstuhlEicken and others, 1994). For the comparatively thinner marine ice layer in the Hells Gate Ice Shelf, Reference Tison, Ronveaux and LorrainTison and others (1993, Reference Tison, Lorrain, Bouzette, Dini, Bondesan, Stievenard and Jeffries1998) report salinities of 0.2-0.5% for banded marine ice similar to that observed at AM01-390. For vertically banded marine ice from the Nansen Ice Shelf, Reference Khazendar, Tison, Stenni, Dini and BondesanKhazendar and others (2001) report salinities largely within the range 0.035-0.10%.
Brine inclusions in the Amery Ice Shelf marine ice core AM04-450a (i.e. 80m above the hydraulic connection depth). Composite image created from superimposed transmitted plain and plane-polarized light images from the same core section. The dark inset corresponds to the transmitted plane-polarized component of the image. Elongated sinuous inclusions extending over several centimetres are evident. Scale is indicated by millimetre gradations at the base of the image.

Examination of marine ice cores and thin sections from the G1, AM01/AM01b and AM04 boreholes between orthogonal plane-polarizing filters and in plain light has confirmed the distribution of insoluble particulate and brine inclusions along grain boundaries and triple junctions (Fig. 14). A small proportion of intragranular inclusions were also observed.
Orientation-dependent Russell-Head Instruments G50 fabric analyser artificial-colour image of the AM04-450a marine ice core. The location of linear distributions of particulates along the grain boundaries of a remnant platelet are indicated. Regions of smaller, equiaxed grains contain particulates distributed randomly along grain boundaries and triple junctions. Marine ice at AM04-450 is estimated to have undergone a minimum postdeposition octahedral shear strain of e o = 50%. Grain-boundary pinning during deformation due to high particulate inclusion contents is proposed as the cause of local restrictions in grain size: regions of comparatively smaller grains coincide with locally high levels of impurities.

For meteoric ice cores there are considerable data indicating the influence of insoluble and soluble particulate inclusions on restricting grain size and preserving highly anisotropic crystal orientation fabrics (e.g. Byrd Station: Reference Gow and WilliamsonGow and Williamson, 1976;Law Dome: Reference Li, Jacka and MorganLi and others, 1998; Siple Dome: Reference Gow and MeeseGow and Meese, 2007). Applying the theory of Reference Alley, Perepezko and BentleyAlley and others (1986) for polycrystalline ice grain growth in the presence of insoluble microparticles, Reference Eicken, Oerter, Miller, Graf and KipfstuhlEicken and others (1994) conclude the inclusion concentration of the Ronne Ice Shelf marine ice cores is sufficient to inhibit grain growth (boundary migration) due to particle drag. Based on the observation of particulate and brine inclusions in Amery Ice Shelf marine ice cores and the similarity in Ronne and Amery Ice Shelf marine ice mean grain areas and total salinities, it is reasonable to assume that particulate inclusions similarly restrict grain size and fabric development in Amery Ice Shelf marine ice (Reference Eicken, Oerter, Miller, Graf and KipfstuhlEicken and others, 1994;Reference Moore, Reid and KipfstuhlMoore and others, 1994;Reference CravenCraven and others, 2005).
Relationship between marine ice crystal orientation fabrics and ice-shelf dynamics
In general, differences in the AM01 and AM04 marine and meteoric ice crystal orientation fabrics and textures can be related to accretion processes and their influence on fabric and texture. Frazil ice platelets accreted to the base of the Amery Ice Shelf accumulate in an initially strain-free state. During the early stages of marine ice layer accumulation the only stress acting on the platelets is the buoyancy-derived deviatoric stress. With continued platelet accretion, consolidation is driven by compaction aided by freezing of entrained sea water and grain growth. Unlike Amery Ice Shelf meteoric ice, the deviatoric stress acting on marine ice during accretion and consolidation steadily increases to an estimated maximum value of r o ≈ 0.05 MPa, so the marine ice does not undergo stress-relaxation-induced grain growth and fabric modification.
The strongly anisotropic single-pole crystal orientation fabric of the AM01-390 marine ice core is assumed to reflect the process of marine ice layer formation by platelet accretion. Based on fabric observations at AM01 from below the hydraulic connection depth and borehole video footage of Reference CravenCraven and others (2005), which indicates ordered layering of platelets, it is possible that a vertical or near-vertical pole of orientations is characteristic of newly accreted Amery Ice Shelf marine ice.
If newly accreted marine ice is characterized by a distinct single pole of orientations and a rectangular banded texture with a mean grain size of ˜10mm2 (e.g. AM01-390; Fig. 11), a mechanism must exist for the development of vertical large circle girdle crystal orientation fabrics and reduced mean grain sizes of 4-6 mm2 observed in most older marine ice above the hydraulic connection depth (Figs 9 and 12). During deformation the high content of insoluble particulate inclusions in the marine ice may contribute to the pinning of mobile grain boundaries (e.g. Reference Alley, Perepezko and BentleyAlley and others, 1986). In combination with microstructural modification processes typically associated with recrystallization during deformation (e.g. grain nucleation and polygonization), grain boundary pinning may lead to the observed reduction in grain size and retard the rate of fabric evolution. Furthermore, evolution of the observed large circle girdle marine ice crystal orientation fabrics is most likely influenced by the initially highly anisotropic fabric of marine ice as accreted and the complex multi-component stress configurations that exist and evolve along the AM01- AM04 flowline (e.g. Reference Kamb, Heard, Borg, Carter and RaleighKamb, 1972).
Marine ice samples AM01-280a and AM04-400 are both from ˜5 m below the marine/meteoric ice interface and are representative of the oldest marine ice in the Amery Ice Shelf, deposited at the southern limit of the marine ice accretion zone. The total post-deposition strain for marine ice just below the meteoric/marine ice interface at AM01 is estimated to be e 0 ˜ 100%. As the AM01 and AM04 boreholes are located on approximately the same flowline, the AM01-280a (and G1-280) crystal orientation fabrics can be considered to have evolved from the AM04-400 fabric observed 100 km upstream. Clusters of c-axis orientations superimposed on the AM04 vertical large circle girdle fabric patterns (Fig. 12) are interpreted as a remnant of the highly anisotropic crystal orientation fabrics associated with newly accreted marine ice. The variable orientation of the clusters in AM04 marine ice suggests variability, over small spatial scales, in the mean orientation of newly accreted platelets. The high in situ strain accumulated downstream of AM04 towards AM01 and the absence of a superimposed cluster in the AM01-280a and G1-280 fabrics indicates microstructural evolution along the flowline is sufficient to overprint the original pole of platelet orientations. It is hoped this aspect of marine ice fabric evolution can be verified through collection of additional ice cores from various depths along the AM04-AM01 flowline in future AMISOR campaigns.
Whilst the concentration of particulate inclusions in the Amery Ice Shelf marine ice was not directly measured, visual inspection reveals a significantly lower particulate and brine inclusion concentration in the AM01b-280b core, which was obtained ˜1 m below the AM01b-280a sample. The cause of a reduced inclusion content in the AM01b-280b core is uncertain, but temporal differences in thermohaline circulation and ISW production may influence the degree of supercooling and thus the size of frazil ice platelets which are subsequently accreted on the ice-shelf base (e.g. Reference Jenkins and BomboschJenkins and Bombosch, 1995;Reference Leffanue and CravenLeffanue and Craven, 2004). Larger platelets may have a reduced capacity to scavenge particulates from the water column, thus limiting the concentration of inclusions incorporated into the marine ice layer. Figure 9 illustrates the significant differences in the AM01b-280a and AM01b-280b crystal orientation fabrics and mean grain area. As previously discussed, the high concentration of particulate inclusions strongly inhibits post-accretion grain growth and influences fabric development. Conversely, the lower inclusion content of the AM01b-280b core allows increased grain growth and fabric development;the mean grain area of g a ≈ 50 mm2 at AM01-280b is comparable to the overlying meteoric ice. Based on the data of Reference Jacka and LiJacka and Li (1994), g a = 50 mm2 is the approximate steady-state grain area for inclusion-free ice at the temperature and estimated stress conditions at 255-280 m depth at the AM01 site (i.e. r o ≈ 0.05 MPa and temperatures between -7 and -10°C). The small circle girdle crystal orientation fabric of the AM01b-280b marine ice sample indicates some clustering of orientations, but is generally similar to the patterns observed in meteoric ice where compression-dominated stress configurations exist (e.g. Reference Budd and JackaBudd and Jacka, 1989). Differences in the AM01b-255 meteoric ice and AM01-280b marine ice crystal orientation fabrics are related to their strain histories;unlike meteoric ice entering the Amery Ice Shelf, marine ice does not undergo a stress relaxation.
In addition to differing strain histories and temperature profiles, the contrasting crystal orientation fabrics and textures of meteoric and marine ice in the Amery Ice Shelf are suggestive of rheological differences arising from the presence of insoluble particulate and brine inclusions within the marine ice. In modelling the dynamics of the Ronne Ice Shelf, Reference Lange and MacAyealLange and MacAyeal (1988) introduced a marine ice softening parameter of ˜10% in order to reproduce observed velocities across the shelf front. This softening is required to account for the temperature-dependent reduction in marine ice layer viscosity, which is nearly isothermal with the sub-shelf ocean. In addition to the influence of basal marine ice layers, recent work (e.g. Reference Khazendar, Rignot and LarourKhazendar and others, 2007, 2009;Reference Humbert, Kleiner, Mohrholz, Oelke, Greve and LangeHumbert and others, 2009) illustrates how the rheology of the ice melange within ice-shelf rifts, which can include a significant proportion of localized marine ice, plays a significant role in ice-shelf dynamics and stability. It is hoped laboratory deformation experiments on Amery Ice Shelf core samples under approximately in situ conditions will provide further insights into the rheological properties of both meteoric and marine ice layers and improve the accuracy of ice-shelf dynamic models.
Summary
Crystal orientation fabrics from the Amery Ice Shelf, East Antarctica, provide additional observations of the influence of stress configurations and flow regimes on the patterns of compatible c-axis orientations that develop in natural ice masses. Within the Amery Ice Shelf, basal accretion processes result in the formation of a marine ice layer >200m thick. The following points summarize crystallographic analysis of meteoric and marine ice cores obtained from two boreholes located on approximately the same flowline:
Meteoric ice samples from the AM01 and AM04 sites are characterized by large mean grain sizes up to 100 mm2 and multiple-maxima crystal orientation fabrics; such features are indicative of grain growth and fabric development resulting from stress relaxation. The AM04 site multiple-maxima fabric patterns are less distinct, possibly due to the complex stress configurations, with a significant transverse shear component, that exist at the AM04 drill site and further upstream.
In marine ice from below the hydraulic connection depth, anisotropic single-maximum crystal orientation fabrics with an elongated, rectangular texture and mean grain area of ˜10mm2 are found. These observations provide a rare insight into marine ice accumulation by frazil ice platelet accretion in a large Antarctic ice shelf. In contrast to meteoric ice, where initially isotropic fabrics are encountered, newly formed marine ice is characterized by anisotropic crystal orientation fabrics and a significant concentration of brine and insoluble particulate inclusions.
Marine ice cores from above the hydraulic connection depth at AM01 and AM04 have complex crystal orientation fabrics and textures influenced by the accretion process, the increasingly complex stress configurations that exist upstream of the AM01 site and the high concentration of insoluble particulate inclusions that exert control over marine ice grain-size evolution by pinning grain boundaries during recrystallization. These marine ice fabric patterns are characterized by large circle vertical girdle distributions. Observations indicate that particulate and brine inclusions are preferentially located along grain boundaries and triple junctions.
The distinct differences in the inclusion content, grain size, crystal orientation fabrics and vertical temperature profile within the marine and meteoric ice layers are suggestive of differing rheological properties. Further sampling and analysis of these layers, including laboratory deformation experiments, are recommended to further investigate marine ice rheology and in particular assist with modelling the dynamics of multilayered ice shelves.
Acknowledgements
We acknowledge the logistic support of the Australian Antarctic Division (AAD) and all those who have participated in and contributed to the AMISOR field program. This work is supported by the Australian Government Cooperative Research Centres Programme, through the Antarctic Climate and Ecosystems Cooperative Research Centre (ACE CRC). We thank I. Allison, J. Roberts, S. Faria and an anonymous reviewer for their constructive and detailed comments which helped improve the manuscript. A.T. was supported by an Australian Postgraduate Award at the University of Tasmania and the ACE CRC.



