


Introduction
Over their first few years of life, children acquire a large vocabulary. While word learning situations can take many forms, researchers have invested considerable effort uncovering learning mechanisms that children, and adults, employ in ambiguous situations. Such situations, for example, arise when multiple objects act as potential referents for a novel word, a situation described as possessing referential ambiguity, or offering a mapping problem (Quine, Reference Quine1960). Researchers have described how children and adults can integrate multiple ambiguous situations to establish stable word-object mappings; a situation described as cross-situational learning (CSL). Yet, the mechanisms underlying cross-situational learning are the focus of an intense debate; do children, and adults, keep track of multiple potential word-object associations, as described in associative learning accounts (AL; Dautriche & Chemla, Reference Dautriche and Chemla2014; Smith & Yu, Reference Smith and Yu2008; Suanda, Mugwanya, & Namy, Reference Suanda, Mugwanya and Namy2014; Vlach & Johnson, Reference Vlach and Johnson2013; Yu & Smith, Reference Yu and Smith2007), do they keep track of only one single candidate referent at any time, following hypothesis testing accounts (HT; Aravind, de Villiers, Pace, Valentine, Golinkoff, Hirsh-Pasek, Iglesias & Sweig Wilson, Reference Aravind, de Villiers, Pace, Valentine, Golinkoff, Hirsh-Pasek, Iglesias and Sweig Wilson2018; Berens, Horst, & Bird, Reference Berens, Horst and Bird2018; Markman, Reference Markman1990; Medina, Snedeker, Trueswell, & Gleitman, Reference Medina, Snedeker, Trueswell and Gleitman2011; Trueswell, Medina, Hafri, & Gleitman, Reference Trueswell, Medina, Hafri and Gleitman2013), or do they use elements of both, depending on memory and attention resources (Yurovsky & Frank, Reference Yurovsky and Frank2015)?
Under the HT perspective, word learners establish a single initial mapping between a word and an object. This initial mapping is maintained (or confirmed) unless it is falsified by subsequent evidence – a propose-but-verify account (Medina et al., Reference Medina, Snedeker, Trueswell and Gleitman2011; Trueswell et al., Reference Trueswell, Medina, Hafri and Gleitman2013), recently supported with neuroimaging evidence (Berens et al., Reference Berens, Horst and Bird2018). This account has been extended to two- and three-year-olds (Woodard, Gleitman, & Trueswell, Reference Woodard, Gleitman and Trueswell2016) and suggests that children, like adults, store just one hypothesised referent for each word. This approach also echoes early views on Mutual Exclusivity (ME; Markman, Reference Markman1990; Markman & Wachtel, Reference Markman and Wachtel1988), that young children “fast-map” novel names to novel objects by initially rejecting additional associations to a name-known object, and that “mutual exclusivity would result from a more general principle, either a one-to-one mapping principle (Slobin, Reference Slobin, Ferguson and Slobin1973) or the uniqueness principle (Pinker, Reference Pinker1984; Wexler & Culicover, Reference Wexler and Culicover1980) applied to word learning” (Markman & Wachtel, Reference Markman and Wachtel1988, p.149).
This strict interpretation of ME has since been nuanced, as evidence suggests that ME should rather be seen as a tendency, modulated by communicative context or language exposure (e.g., Byers-Heinlein & Werker, Reference Byers-Heinlein and Werker2009; Houston-Price, Caloghiris, & Raviglione, Reference Houston-Price, Caloghiris and Raviglione2010; Kalashnikova, Escudero, & Kidd, Reference Kalashnikova, Escudero and Kidd2018; Kalashnikova, Mattock, & Monaghan, Reference Kalashnikova, Mattock and Monaghan2015; Malone, Kalashnikova, & Davis, Reference Malone, Kalashnikova and Davis2016), rather than a rule or a hard constraint. Similarly, HT perspectives suggest that, while young children may form a single initial mapping between a word and a referent, this initial mapping should be rejected if new evidence indicates it should be falsified. These perspectives converge insofar as, in absence of counterevidence, a single mapping between a word and a reference is expected.
In contrast, AL accounts suggest that children (Smith & Yu, Reference Smith and Yu2008; Suanda et al., Reference Suanda, Mugwanya and Namy2014; Vlach & Johnson, Reference Vlach and Johnson2013) and adults (Dautriche & Chemla, Reference Dautriche and Chemla2014; Yu & Smith, Reference Yu and Smith2007) form and maintain multiple associations between words and referents. The strengths and relative importance of these associations evolve across trials and are updated as additional evidence (e.g., co-occurrence between words and objects) is being accumulated. From this perspective, word learners maintain a network of word-object associations, rather than single mappings between words and objects, as posited by HT accounts.
Various studies have attempted to characterise the developmental trajectories associated with ME and AL. An increase in children's usage of ME as they grow older has been documented (although see Sia & Mayor, Reference Sia and Mayor2021 for counterevidence with Malay children); for instance, seven-year-olds were reportedly more likely to apply ME than six-year-olds (Merriman & Kutlesic, Reference Merriman and Kutlesic1993), who, in turn, showed stronger ME than four-year-olds (Davidson, Jergovic, Imami, & Theodos, Reference Davidson, Jergovic, Imami and Theodos1997). However, the developmental trajectories associated with the application of AL strategies have seldom been evaluated. Most studies have either recruited infants (Smith & Yu, Reference Smith and Yu2008; Vlach & Johnson, Reference Vlach and Johnson2013) or adults (Fitneva & Christiansen, Reference Fitneva and Christiansen2011; Kachergis, Yu, & Shiffrin, Reference Kachergis, Yu and Shiffrin2012; Poepsel & Weiss, Reference Poepsel and Weiss2014, Reference Poepsel and Weiss2016; Yu, Zhong, & Fricker, Reference Yu, Zhong and Fricker2012), with a few notable exceptions that compared adults and children of different age groups (Escudero, Mulak, & Vlach, Reference Escudero, Mulak and Vlach2016; Fitneva & Christiansen, Reference Fitneva and Christiansen2017; Suanda et al., Reference Suanda, Mugwanya and Namy2014). Older children appear to differ in the manifestation of word learning strategies; while four-year-olds learned word-object associations better if their initial guesses were correct, ten-year-olds performed independently from the accuracy of their initial guesses (Fitneva & Christiansen, Reference Fitneva and Christiansen2017). Yet, Suanda et al. (Reference Suanda, Mugwanya and Namy2014) did not find any differences in CSL performance between children aged five and seven years of age. In sum, the divergent characterisation of the effect of age on word learning strategies calls for further scrutiny – an objective of the present study.
The first aim of the present contribution is to test whether children establish and maintain multiple associations between words and objects – in line with AL accounts – or whether they only maintain a single association between words and objects – congruent with single-hypothesis accounts. To this end, the present study was carried out as an object-selection task, on an iPad. We presented children with two sets of “classical” ME trialsFootnote 1; in each set, two images were presented to the child – one illustrating a novel object and the other a name-known object – while a novel label is heard. It is noteworthy that ME trials present children with a potentially ambiguous learning situation, as the novel object is never explicitly (e.g., being displayed on its own) labelled using the novel word; as such, ME trials offer referential ambiguity. In fact, it is the precise intent of the current study to evaluate whether children would also map the novel label to the name-known object, thereby forming multiple word-object associations. To evaluate this possibility, we then introduce test trials, in which both name-known “distractors” are presented side-by-side while novel labels used during ME trials are being uttered.
Strict ME accounts would suggest that children should not display a preference for either object, as they should have rejected a second association to the name-known objects during ME trials. Other HT accounts would suggest that test trials falsify children's hypotheses that the novel object is the referent for the novel label (provided that this was their initial hypothesis) and would predict that children should randomly pick a new referent, as suggested by the propose-but-verify account (Medina et al., Reference Medina, Snedeker, Trueswell and Gleitman2011; Trueswell et al., Reference Trueswell, Medina, Hafri and Gleitman2013; Woodard et al., Reference Woodard, Gleitman and Trueswell2016). In contrast, preference for the matching name-known object would indicate the children have not inhibited the formation of an additional association between the name-known object and the novel label, and that, instead, they have established multiple associations between words and objects, a view congruent with AL accounts (e.g., Smith & Yu, Reference Smith and Yu2008; Suanda et al., Reference Suanda, Mugwanya and Namy2014; Vlach & Johnson, Reference Vlach and Johnson2013)Footnote 2.
The second aim of the present contribution is to evaluate whether children do, indeed, establish an association between the novel object and the novel label during ME trials, beyond “merely” displaying novelty preference for the novel object when hearing a novel label. Studies that investigated whether infants retain novel word associations following ME responses obtained varied results. Although Mervis and Bertrand (Reference Mervis and Bertrand1994) found that 16- to 20-month-old infants displayed a novelty bias during ME trials and showed evidence of word learning during test trials, Horst and Samuelson (Reference Horst and Samuelson2008) found that 24-month-old infants were only able to display a novelty bias during the ME trials, but failed to retain the novel label to novel object mappings. Mather and Plunkett (Reference Mather and Plunkett2011) and Bion, Borovsky and Fernald (Reference Bion, Borovsky and Fernald2013) conducted similar studies using eye-tracking paradigms. Mather and Plunkett's 16-month-old infants did not show an ME effect during ME trials, yet they learned novel word-object associations for one of the novel labels, while Bion et al.'s 24-month-olds displayed evidence of ME but failed to display evidence of retention. Together, this suggests that, while ME may lead to the formation of novel word-object associations, it is a fragile process that may be modulated by task difficulty and the age of participants.
The third aim is to describe the developmental trajectories associated with (a) novelty preference during ME trials, (b) the retention of novel word-object associations and (c) the potential formation of non-selective associations between novel labels and name-known objects. We focus on a wide age range, from 4 to 12 years of age, as this is when children acquire a major part of their vocabulary (Suanda et al., Reference Suanda, Mugwanya and Namy2014, argues that “the rate of vocabulary growth during middle childhood is greater than during late infancy and toddlerhood, the period typically emphasised in word learning research” [p. 397]). In addition, this age range is of a considerable interest, as Fitneva and Christiansen (Reference Fitneva and Christiansen2017) reported that children go through qualitative changes in word learning behaviour, in CSL paradigms, between 4 and 10 years of age. Since the formation of additional word-object associations requires an increased memory load (Romberg & Saffran, Reference Romberg and Saffran2010), we expect that older children will establish more robust word-object associations than younger children.
In sum, the current study aims at evaluating whether children retain word-object associations formed during ME trials, as well as testing whether such word-object associations are unique – as suggested by single-hypothesis accounts – or non-selective (additional associations are formed between novel words and name-known objects) – in line with AL accounts.
Method
Participants
One hundred and seventy-four children who participated in the Summer Scientist Week programme in The University of Nottingham were recruited in this study. Twenty-six participants who spoke more than one language at home were excluded from the analysis, to ensure that the results of the experiment would not be impacted by the number of languages spoken at home (e.g., Houston-Price et al., Reference Houston-Price, Caloghiris and Raviglione2010). Of the remaining 148 English monolingual children, 65 were boys and 83 were girls. The children's age ranged from 4 years to 12 years (M = 7.36 years, SD = 2.06). There were 11 four-year-olds, 26 five-year-olds, 14 six-year-olds, 26 seven-year-olds, 25 eight-year-olds, 25 nine-year-olds, 9 ten-year-olds, 9 eleven-year-olds and 3 twelve-year-olds. Ethics approval was granted by The University of Nottingham Institutional Ethics board (JM190315).
Stimuli
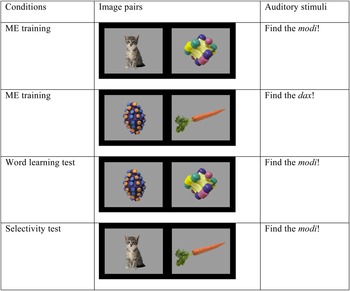
The visual stimuli were images obtained from Frank, Sugarman, Horowitz, Lewis, and Yurovsky (Reference Frank, Sugarman, Horowitz, Lewis and Yurovsky2016). Each image had a resolution of 640 x 480 pixels and depicted an object on a grey background. Following Frank et al. (Reference Frank, Sugarman, Horowitz, Lewis and Yurovsky2016), the size of the images was set to fit comfortably on an iPad screen, with the width of the image set to 400 pixels and the height set to maintain the ratio of the image. Two novel labels, dax and modi, were used. Each novel label was associated with a novel object and a familiar object (see first two rows of Figure 1). The instruction to search for an object was “find the __!”, which was recorded by a female native English-speaker in an infant-directed manner.
An example of different conditions.

Procedure
The experiment was carried out using an iPad. Before the start of the experiment, a warm-up task prompted children to tap on dots and smiley faces presented on the screen of the iPad. This task allowed children to familiarise themselves with the iPad. After the warm-up task, children were given instructions about the experiment; that they would be presented with two images, would be asked to find an object, and would have to respond by tapping one of the displayed images. Once the children had indicated that they had understood the procedure, the experiment began.
The experiment itself consisted of three conditions; ME training, a word learning test and a selectivity test (see Figure 1). In each trial, a pair of images was displayed on the screen while the instruction (the carrier sentence “find the __!”) was played. The pair of images remained on screen until the child made a response by tapping on one of the images. There was a total of 8 trials in ME training (4 trials for each novel label), 4 trials in the word learning test (2 trials for each novel label) and in the selectivity test (2 trials for each novel label). Therefore, each child received a total of 16 experimental trials.
During ME training, the pair of images presented were a name-known and a novel object, while a novel label was uttered, in line with classical ME designs. Two image pairs, modi-cat and dax-carrot allowed every child to learn, via ME, two novel labels for two novel objects (see first two rows of Figure 1).
In the word learning test, children were tested on whether they had formed an association between a novel label and the corresponding novel object; an attempt to extend Mather and Plunkett's (Reference Mather and Plunkett2011) findings that ME can lead to the formation of word-object associations. Thus, the image pairs were made up of the two novel objects shown during ME training (see third row of Figure 1), whereas the auditory stimuli were the novel labels modi and dax.
In the selectivity test, the two name-known objects used during ME training (typically referred to as distractors in ME experiments) were displayed while, in each trial, one of the novel labels used during ME training was uttered (see last row of Figure 1). Target selection (that is, tapping on the name-known image from the same training pair) was taken as evidence that an association between the name-known object and a second label was not inhibited during ME training. The order of presentation of the word learning test and the selectivity test was counterbalanced across participants. A total of 73 children completed the word learning test before the selectivity test whereas the remaining 75 children completed the experiment in the reverse order.
Filler trials, consisting of pairs of familiar objects (different from those used in ME training), were presented between every two experimental trials, so as not to discourage the children by presenting only trials with novel labels. The familiar objects that were named were car, dog, lion and train. Attention getters were introduced between each condition so as to capture the attention of the participants.
Analysis
Response accuracy was analysed using a binomial mixed-effect logistic regression using the lme4 package in R (Version 3.3.1; Bates, Mächler, Bolker & Walker, Reference Bates, Mächler, Bolker and Walker2015), where selecting target objects was coded as 1 and distractor objects as 0. The model included participants as random effects, condition (ME training, word learning test, selectivity test), age in months, test order (retention test or selectivity test first) and interaction between age and condition as fixed effects.
Results
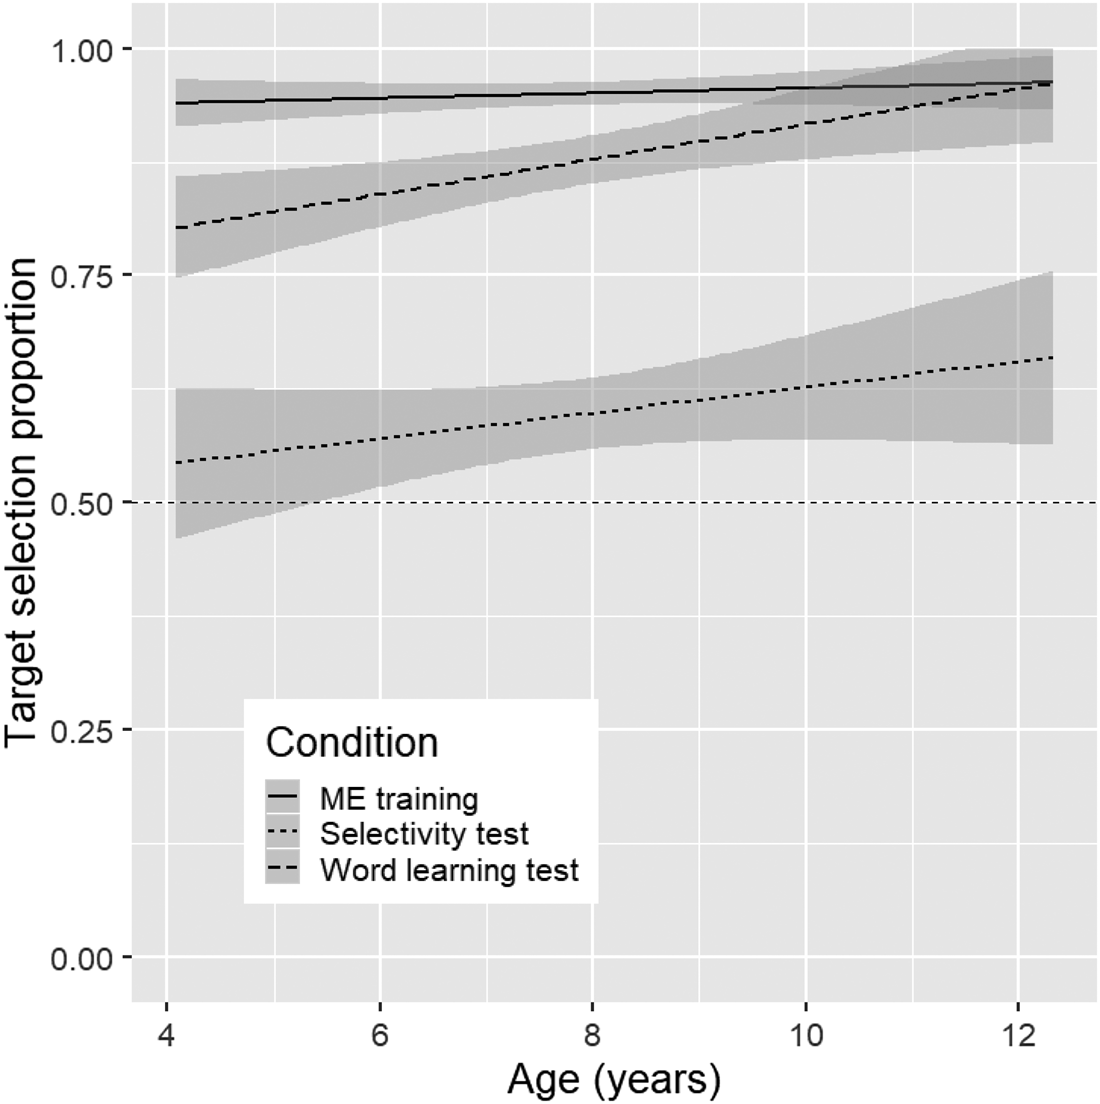
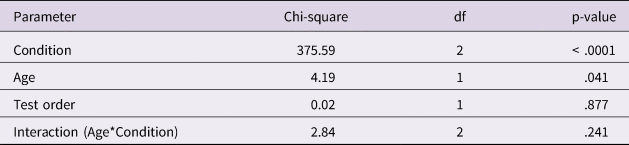
Figure 2 illustrates the effect of age on response accuracy for all conditions, along with the 95% confidence intervals. The model revealed a main effect of condition (see Table 1). Post-hoc Tukey pairwise comparisons (corrected for multiple testing) between conditions revealed that children performed significantly better (all ps < .0001) in ME training (M = .95, SD = .22) than in the word learning test (M = .88, SD = .33) and in the selectivity test (M = .60, SD = .49), and that they performed significantly better in the word learning test than in the selectivity test (p < .0001). Children performed significantly above chance in all conditionsFootnote 3; in ME training (z = 5.65, p < .0001), in the word learning test (z = 7.34, p < .0001), as well as in the selectivity test (z = 2.86, p < .004). The model also revealed a main effect of age, but no main effect of test order nor an effect of interaction between condition and age (see Table 1).
Linear regressions of the proportions of correct responses in each condition, as a function of age. Dotted horizontal line refers to chance at .50. Shaded areas indicate the 95% confidence intervals.
Chi-square estimates, degrees of freedom and p-value of each fixed effect. The full model was Response ~ (1|Participant) + Test_order + Age*Condition.
Exploratory analyses of the selectivity test using a binomial mixed-effect logistic regression, with participants as random effects and age in months, determined the age at which children display evidence of having formed associations between the novel labels and name-known objects. We conducted these analyses only for the selectivity test since there was a main effect of age but no age-condition interaction: yet, as is presented in Figure 2, children's performance in ME training and word learning test were clearly above chance. Hence, we look into the possibility that the main effect of age is driven by children's improvement in the selectivity test as they grow older. The intercept becomes significantly different from chance from 6.5 years of age and older (z = 2.02, p = .043). In other words, children from 6.5 years of age selected the matching name-known distractor significantly above chance.
Discussion
Children, and adults, frequently encounter new words when multiple potential referents are present in their visual scene. The nature of learning mechanisms in such ambiguous naming situations has been under scrutiny over decades and theories fall essentially into two groups. The first group argues that learners establish and maintain a single hypothesis that is either confirmed or falsified with additional information (in which case a new, single, hypothesis is established). HT accounts can be considered to include early descriptions of learning mechanisms; the one-to-one mapping principle (Slobin, Reference Slobin, Ferguson and Slobin1973), the uniqueness principle (Pinker, Reference Pinker1984; Wexler & Culicover, Reference Wexler and Culicover1980), as well as early accounts of ME (Markman & Wachtel, Reference Markman and Wachtel1988). These views have gained recent traction and are supported by additional evidence (Aravind et al., Reference Aravind, de Villiers, Pace, Valentine, Golinkoff, Hirsh-Pasek, Iglesias and Sweig Wilson2018; Berens et al., Reference Berens, Horst and Bird2018; Medina et al., Reference Medina, Snedeker, Trueswell and Gleitman2011; Trueswell et al., Reference Trueswell, Medina, Hafri and Gleitman2013; Woodard et al., Reference Woodard, Gleitman and Trueswell2016). In contrast, AL accounts suggest that children (Smith & Yu, Reference Smith and Yu2008; Suanda et al., Reference Suanda, Mugwanya and Namy2014), and adults (Dautriche & Chemla, Reference Dautriche and Chemla2014; Yu & Smith, Reference Yu and Smith2007) create and maintain a rich network of multiple associations between words and objects. The strength and relative importance of these associations are modulated when additional evidence is gained.
Yet, AL accounts typically present participants with sets of novel objects, thus making initial hypotheses, or associations, equiprobable. What if children are presented with an initial situation that favours one hypothesis? Would they still entertain the possibility that other hypotheses can hold, and create additional associations? To find out, we presented 4- to 12-year-old children with two sets of ME training trials, thus offering them the possibility of establishing two novel word-object associations. Subsequent test trials investigated whether children displayed evidence that they had also retained associations between the novel labels and the name-known distractors – a view congruent with AL accounts – or not – thus suggesting that they only tracked a single hypothesis.
Children displayed a strong bias for the novel object in ME training trials (in line with, e.g., Golinkoff, Hirsh-Pasek, Bailey, & Wenger, Reference Golinkoff, Hirsh-Pasek, Bailey and Wenger1992; Mather & Plunkett, Reference Mather and Plunkett2011). HT accounts would suggest that children have established an initial hypothesis; that the novel object is the referent for the novel label. Indeed, younger children (four and five years old) in the study failed to select the appropriate name-known distractor in the selectivity test, thus suggesting they have established and retained a single hypothesis, in line with propose-but-verify (Berens et al., Reference Berens, Horst and Bird2018; Medina et al., Reference Medina, Snedeker, Trueswell and Gleitman2011; Trueswell et al., Reference Trueswell, Medina, Hafri and Gleitman2013; Woodard et al., Reference Woodard, Gleitman and Trueswell2016) and ME accounts (Markman, Reference Markman1990; Markman & Wachtel, Reference Markman and Wachtel1988).
Yet, children aged 6.5 years and older displayed a preference for the matching name-known object during selectivity test trials, when hearing novel labels used during ME training trials. This situation, with older children, does not sit well with HT accounts; when the initial hypothesis is falsified by test trials (the novel label is uttered while the novel object is not present), children should randomly generate a new hypothesis, as suggested by the propose-but-verify account (Berens et al., Reference Berens, Horst and Bird2018; Medina et al., Reference Medina, Snedeker, Trueswell and Gleitman2011; Trueswell et al., Reference Trueswell, Medina, Hafri and Gleitman2013; Woodard et al., Reference Woodard, Gleitman and Trueswell2016), and should not display a preference for either object presented during test trials.
In contrast, older children's preference for the matching name-known object when hearing novel labels suggest that they have established multiple word-object associations during ME training trials, despite their initial preference for the novel object. These non-selective associations between words and objects align well with a low-level association-based account of the CSL type that would also operate when name-known objects are presented to the child, and not only when novel objects are used. In other words, our results suggest that older children form multiple associations based on co-occurrences between words and multiple objects in their sight. Kachergis et al. (Reference Kachergis, Yu and Shiffrin2012) and Smith, Smith, and Blythe (Reference Smith, Smith and Blythe2011) argued that word learners only store more than one word-object associations if there are several potential referents for a label. Older children in our study appear to entertain that possibility. This pattern of results is also congruent with qualitative changes in CSL word learning reported by Fitneva and Christiansen (Reference Fitneva and Christiansen2017) between four-year olds and adults.
However, our results should also be examined from the perspective of children's regular, quantitative, improvements in cognitive resources. For example, Vlach and DeBrock (Reference Vlach and DeBrock2017) showed that children from two to five years of age differ in their ability to learn words in an ambiguous situation, as they differ in terms of their memory capacity. Romberg and Saffran (Reference Romberg and Saffran2010) highlighted the cognitive cost of creating novel word-object associations and Yurovsky and Frank (Reference Yurovsky and Frank2015) shed light on the role of processing constraints on CSL performance. From this viewpoint, our design does not pose challenges to children aged six years and above; older children can form multiple word-object associations, in turn allowing them to remain flexible with word meanings and interpretations. In contrast, younger children possess more limited processing resources – in particular, when it comes to forming and retaining additional word-object associations – thus, merely retaining a single word-object association at a time.
An alternative explanation to our findings is that older children have formed associative relations between the co-occurring target and distractor (e.g., modi and cat) during ME training: hence, through cascaded activation, they selected the related familiar object in the selectivity test without having formed more than just one word-object associations. In other words, although older children were target-oriented in the selectivity test, this may not be inconsistent with HT accounts that word learners form single word-object mappings. Fixating related objects when the target is not present is reported in various eye-tracking studies that recruited either young children (Chow, Davies, & Plunkett, Reference Chow, Davies and Plunkett2017; Johnson & Huettig, Reference Johnson and Huettig2011) or adults (e.g., Huettig & Altmann, Reference Huettig and Altmann2005; Mirman & Graziano, Reference Mirman and Graziano2012). Future work will aim at teasing apart these two alternative possibilities, as the current design does not enable us to determine the exact mechanism that allows older children to be target-oriented in the selectivity test.
Yet, children of all ages performed well in the word learning test, thus providing evidence that they retained, at least temporarily, word-object associations formed during ME, in line with Mather and Plunkett (Reference Mather and Plunkett2011) and Mervis and Bertrand (Reference Mervis and Bertrand1994). While children throughout the age range displayed evidence of retention of novel label to novel object associations, the positive age trend suggests that older children are stronger at learning novel names for novel objects. The parallel improvements with age (and the lack of interactions between age and condition) in forming associations between novel labels and both novel and name-known objects again points towards general cognitive improvements – older children form stronger word-object associations in general, and non-selective word-object associations in particular.
Children performed less robustly in the selectivity test than in the word learning test – which suggests that associations between novel labels and novel objects are stronger than associations between novel labels and name-known objects. Weaker performance in the selectivity test is again congruent with a low-level association-based account of the CSL type; the initial bias for the novel object in ME training trials establishes differing levels of attention towards each object. Higher attention towards an object (e.g., in our case, the novel object during ME training) leads to a stronger association between the word and the object, and weaker associations between the same word and other objects (in our case, the name-known object), in turn translating into a weaker performance in the selectivity test that reflects the initial relative preference for the novel object during ME training.
While we know that young children may have the capacity to form multiple word-object associations when potential referents are equated for novelty (e.g., from 12 months of age in Smith & Yu, Reference Smith and Yu2008), the youngest children in the present study (at four years of age) may not be able to overcome their initial preference for the novel object in the ME trials, nor “invest” sufficient time and cognitive resources to fixate and process the name-known distractor so that it can result in the formation of an additional word-object association. One possible reason is that our design presents a challenge to children – as the lack of contextual diversity (the same name-known object is always paired with the same novel object) is known to hinder cross-situational word learning (Kachergis, Shiffrin, & Yu, Reference Kachergis, Shiffrin, Yu, Taatgen, Van Rijn, Nerbonne and Schomaker2009; Suanda & Namy, Reference Suanda and Namy2012).
It should be noted that the absence of evidence of the formation of non-selective word-object associations, with the youngest children in our study, should not be interpreted as that they cannot form multiple associations (e.g., when all items are equally novel, as in most CSL designs). Similarly, the positive evidence that older children in our study form multiple word-object associations should not imply that older children, and adults, will not engage into leaner HT strategies at times – for example, when the complexity of the task requires it (Yurovsky & Frank, Reference Yurovsky and Frank2015; Smith et al., Reference Smith, Smith and Blythe2011; Berens et al., Reference Berens, Horst and Bird2018).
Furthermore, the observed preference for a novel object in a ME learning situation should not necessarily be taken as evidence for the rejection of additional associations between novel words and name-known objects. Indeed, the older children in our study appear to track multiple word-object associations, despite showing an initial preference for the novel object in ME training. This finding aligns with Kucker, McMurray and Samuelson's (Reference Kucker, McMurray and Samuelson2015) argument that two processes are at play; while fast-mapping (e.g., using ME) helps the child disambiguate between objects in a given naming situation, a slower accumulation of word-object mappings (e.g., through AL) contributes to a gradual vocabulary learning via repeated exposure with words. Thus, although HT and AL accounts appear to be at odds with each other, older children in our study appear to rely on both strategies to their advantage. Although the formation of multiple mappings from a word to multiple objects in the visual scene cannot contribute to a reduction of the hypothesis space in ambiguous learning situations, it can provide the child with the capacity to entertain the possibility that multiple words can refer to the same object, a skill necessary to expand further her lexicon.


 Open access