


Management Implications
Removal of Rhamnus cathartica (European buckthorn) promotes strong native herbaceous recovery but also alters ground conditions in ways that can favor secondary invaders. At Tifft Nature Preserve, removal corresponded with a 10-fold increase in herbaceous cover and native plant richness, yet it also corresponded with thicker, more persistent leaf litter layers that appeared to support high densities of invasive Myrmica rubra (European fire ant). The elevated ant abundance coincided with reduced pollinator abundance, suggesting that post-removal habitat changes can constrain faunal taxa even as vegetation rebounds. Whereas effective R. cathartica management already requires follow-up chemical treatment to prevent resprouting, comparable, landscape-scale control options for invasive ants are limited. Consequently, managers might weigh the benefits of vegetation recovery against the risk of secondary invasion and prioritize integrated post-removal monitoring of both plants and fauna. Where invasive ants are present, targeted local suppression may help preserve restoration gains; where suppression is infeasible, managers may face a trade-off between tolerating an invasive shrub or accepting invasive ants as the lesser of two evils.
Introduction
Invasive, non-native plants can form dense, homogeneous patches that displace native flora and alter ecosystem structure (Archibold et al. Reference Archibold, Brooks and Delanoy1997; Ferdinands et al. Reference Ferdinands, Beggs and Whitehead2005; Jo et al. Reference Jo, Fridley and Frank2017). By monopolizing light, space, and soil resources, often aided by enemy release and altered biotic interactions, invaders suppress seedling regeneration and shift community composition (Broadbent et al. Reference Broadbent, Stevens, Peltzer, Ostle and Orwin2018; Tanner and Gange Reference Tanner and Gange2013; Warren et al. Reference Warren, Labatore and Candeias2017). This structural homogenization reduces biodiversity and restructures trophic interactions across ecosystems, with cascading effects on pollinators, herbivores, predators, and decomposers (Holl et al. Reference Holl, Luong and Brancalion2022; McKinney and Lockwood Reference McKinney and Lockwood1999; Olden and Rooney Reference Olden and Rooney2006). Ecosystem dynamics can be further altered when invasive plants are removed (Pearson et al. Reference Pearson, Ortega, Runyon and Butler2016; Rivas-Torres et al. Reference Rivas-Torres, Wilson, Loiselle and Luke Flory2024; Shen et al. Reference Shen, Chen, Zhang, He, Wan, Wang, Tao, Huang and Siemann2023). As a disturbance, removal redistributes light, water, and nutrients, potentially facilitating opportunistic secondary invasions (Flory and Bauer Reference Flory and Bauer2014; Mack et al. Reference Mack, Simberloff, Lonsdale, Evans, Clout and Bazzaz2000; Pearson et al. Reference Pearson, Ortega, Runyon and Butler2016).
Invader-induced changes in structure and resources extend beyond vegetation, cascading through higher trophic levels as invaders alter herbivore foraging, pollinator visitation, and decomposer pathways (Grunzweig et al. Reference Grunzweig, Spiering, Labatore and Warren2015; Iqbal et al. Reference Iqbal, Feng, Feng, Liu and Lu2021; Tallamy and Shropshire Reference Tallamy and Shropshire2009). The absence of specialist herbivores can enhance invader success by allowing greater allocation to growth and reproduction (Joshi and Vrieling Reference Joshi and Vrieling2005; Sun et al. Reference Sun, Sun, Cao, Zhai, Callaway, Wan, Flory, Huang and Ding2023; Tallamy and Shropshire Reference Tallamy and Shropshire2009). At the same time, palatable native plants often receive disproportionate browsing pressure when generalist herbivores avoid invasive species, intensifying damage and reducing their competitive ability (Eschtruth and Battles Reference Eschtruth and Battles2009; Haffey and Gorchov Reference Haffey and Gorchov2019; Warren et al. Reference Warren, Goodrich, Cochran and Spiering2025).
Invasive plants can also disrupt native plant reproduction by reshaping pollinator assemblages (Brett et al. Reference Brett, Strauss, van Wyk, Vaughan and Memmott2024; Wang et al. Reference Wang, Huang, Dai, Yang and Duan2024; Yang et al. Reference Yang, Ignatieva, Gaynor and Chen2024). Such shifts often reflect evolutionary mismatches, as floral cues, morphology, or resource quality of invaders fail to meet native pollinator requirements (Aizen et al. Reference Aizen, Morales and Morales2008; Howard and Symonds Reference Howard and Symonds2023; Parra-Tabla et al. Reference Parra-Tabla, Munguía-Rosas, Campos-Navarrete and Ramos-Zapata2015). Invaders that produce abundant floral rewards may attract large numbers of pollinators but, in doing so, divert them from native plants (Brett et al. Reference Brett, Strauss, van Wyk, Vaughan and Memmott2024; Cuadra-Valdés et al. Reference Cuadra-Valdés, Vizentin-Bugoni and Fontúrbel2021; Wang et al. Reference Wang, Fu, Shi, Zhao, Li and Tu2023). These effects can be further compounded when invasive plants form dense stands that shade native flowers and degrade habitat quality for thermophilic pollinators (Herrera Reference Herrera1997; Valladares et al. Reference Valladares, Allen and Pearcy1997; Wiatrowska et al. Reference Wiatrowska, Kurek, Moroń, Celary, Chrzanowski, Trzciński and Piechnik2023).
Plant defensive chemistry also can reshape detrital pathways. Non-native leaf litter can be unpalatable when defensive compounds persist after senescence or when nitrogen content is low (Di Sabatino et al. Reference Di Sabatino, Cicolani, Miccoli and Cristiano2020; Guo et al. Reference Guo, Zhang, Wu, Richards, Bossdorf, Li and Ju2023; Mayer et al. Reference Mayer, Tunnell, Engle, Jorgensen and Nunn2005). Some invaders actually accelerate decomposition by producing nitrogen-rich foliage, altering soil nutrient dynamics and favoring themselves and other non-natives (Allison and Vitousek Reference Allison and Vitousek2004; Heneghan et al. Reference Heneghan, Fatemi, Umek, Grady, Fagen and Workman2006; Li et al. Reference Li, Wei, Huangfu, Chen and Yang2017). Although high-nitrogen litter can briefly boost detritivore abundance, such pulses may shift arthropod community composition and lead to long-term declines (Heneghan et al. Reference Heneghan, Clay and Brundage2002; Litt et al. Reference Litt, Cord, Fulbright and Schuster2014; Woodworth et al. Reference Woodworth, Ward and Carr2020).
By altering understory food resources, litter, and protective cover, invasive plants can also affect seed predators and other small mammals. Dense invasive cover can increase rodent activity by providing refuge from predators (Johnson and León Reference Johnson and León2015; Mattos and Orrock Reference Mattos and Orrock2010). Where non-native seeds and fruits are avoided, seed predators such as the white-footed/deer mouse (Peromyscus spp.) may concentrate foraging on native seeds, further constraining native regeneration (Knight et al. Reference Knight, Kurylo, Endress, Stewart and Reich2007; Shahid et al. Reference Shahid, Garneau and McCay2009). Increased rodent activity can also reshape lower trophic levels through predation on soil arthropods, with consequences that propagate through the food web (Hamilton Reference Hamilton1941; McCay and Storm Reference McCay and Storm1997).
European buckthorn (Rhamnus cathartica L.) is a woody species introduced to North America in the 1800s for medicinal and ornamental purposes (Kurylo and Endress Reference Kurylo and Endress2012). It vigorously invades forest understories, forming dense monotypic stands that monopolize light and space and are associated with declines in native plant richness and abundance and shifts in community composition (Klionsky et al. Reference Klionsky, Amatangelo and Waller2011; Knight et al. Reference Knight, Kurylo, Endress, Stewart and Reich2007; Mascaro and Schnitzer Reference Mascaro and Schnitzer2007). Rhamnus cathartica produces nitrogen-rich leaves that decompose rapidly, accelerating nutrient cycling and releasing nitrogen into the soil (Heneghan et al. Reference Heneghan, Fatemi, Umek, Grady, Fagen and Workman2006; Klionsky et al. Reference Klionsky, Amatangelo and Waller2011). Together, these traits restructure microhabitats and food webs, reducing the abundance of native plants and animals and motivating management removal efforts (Lamb et al. Reference Lamb, Havens, Holloway, Steffen, Zeldin and Kramer2022; Schuster et al. Reference Schuster, Wragg, Roth and Reich2024; Wragg et al. Reference Wragg, Schuster, Roth, Bockenstedt, Frelich and Reich2021).
European fire ant (Myrmica rubra), native to Europe and parts of Asia, has established invasive populations in North America, particularly in the northeastern United States and southeastern Canada (Groden et al. Reference Groden, Drummond, Garnas and Franceour2005; Wetterer Reference Wetterer2011; Wheeler Reference Wheeler1908). It prefers moist, shaded habitats such as woodlands and gardens but can persist in disturbed areas that do not become excessively dry (Chen and Adams Reference Chen and Adams2018; Groden et al. Reference Groden, Drummond, Garnas and Franceour2005; Warren et al. Reference Warren, Bayba, Krupp and Spiering2019). Its invasion has been associated with declines of up to 90% in native ant populations, as well as reductions in some native arthropods on which it preys (Gammans et al. Reference Gammans, Drummond and Groden2018; Goodman and Warren Reference Goodman and Warren2019; Reznikova and Panteleeva Reference Reznikova and Panteleeva2001).
We evaluated how R. cathartica removal alters multi-trophic interactions among plants, arthropods, pollinators, and rodents, focusing on whether removal-driven changes in vegetation structure and litter dynamics affect the invasive M. rubra and cascade across trophic levels. This field study in a single postindustrial forest system tests mechanistic links among management, habitat structure, and faunal responses. We predicted that reduced canopy cover following removal would lower M. rubra abundance given its preference for moist, shaded microhabitats, and that release from R. cathartica suppression would increase herbaceous cover and richness, enhancing floral resources for pollinators and structural microhabitats for other arthropods. For higher trophic levels, we tested competing mechanisms: pollinators would increase with greater floral availability but could decline if removal eliminated an attractive generalist resource, detritivores would increase if chemically defended litter was removed but could decline if loss of nitrogen-rich litter reduced resource quality, and rodents would increase with greater plant and arthropod resources but could decrease if reduced cover elevated predation risk.
Materials and Methods
Study Site
Tifft Nature Preserve is a 107-ha forest and wetland complex near the eastern shore of Lake Erie in Buffalo, NY, USA (42.84651°N, 78.85951°W). The site was historically a floodplain wetland, later converted to farmland, then used as an industrial transshipment and storage area where bulk materials such as iron ore, lumber, and coal were unloaded, stored, and redistributed. Subsequently, Tifft was used as an industrial and municipal dumping site before restoration as a nature preserve in the 1970s. The terrestrial soils are highly modified and mapped primarily as urban land, Haplaquolls, and covered landfill (Soil Survey Staff 2018). Consistent with this classification, the soil base includes mixed natural and man-made materials so that soil components and properties are variable across the preserve and can change dramatically over short distances, both horizontally and vertically; however, the alkaline soils have a narrow pH range (7.6 to 7.8) and consistently high calcium concentrations (Spiering Reference Spiering2009).
The woodland canopy is dominated by eastern cottonwood (Populus deltoides W. Bartram ex Marshall) with some willow (Salix spp.) and tree-of-heaven [Ailanthus altissima (Mill.) Swingle]. The understory is dominated by R. cathartica (with alder buckthorn [Frangula alnus Mill.] in wetter areas), Japanese knotweed (Polygonum cuspidatum Siebold & Zucc.; syn.: Reynoutria japonica Houtt.), dogwood (Cornus spp.), and honeysuckle (Lonicera spp.), with limited natural regeneration of native woody species (Labatore et al. Reference Labatore, Spiering, Potts and Warren2017). White-tailed deer (Odocoileus virginianus) are overabundant at Tifft and in surrounding urban and suburban areas (Booth-Binczik and Hurst Reference Booth-Binczik and Hurst2018; Spiering Reference Spiering2009). Invasive M. rubra has colonized mesic areas in the preserve (Warren et al. Reference Warren, Bayba, Krupp and Spiering2019). As part of a site restoration plan implemented between 2010 and 2013, there were 31 native tree species planted across 40 ha of forested areas following mechanical removal of R. cathartica.
Study Plots
In June 2021, we established 18 plots (10 by 10 m, 100 m2; mean inter-plot distance = 75 m) at Tifft, distributed among three R. cathartica management treatments (n = 6 per treatment) Supplementary Material 1 (site map). Treatments were stratified by preexisting management units and site logistics, a common outcome within established land management frameworks (Wragg et al. Reference Wragg, Schuster, Roth, Bockenstedt, Frelich and Reich2021). Plots were located to fall entirely within a single management unit, avoid obvious edge effects and active disturbance, and span the range of canopy cover and ground-layer conditions present within each unit. “Not-treated” plots were areas where R. cathartica was never removed and had matured into tree-dominated stands with minimal understory vegetation Supplementary Material 2 (plot photos). “Regrown” plots were areas mechanically cut in 2012 but not subsequently treated, resulting in dense regrowth by 2021. “Managed” plots were areas mechanically cut and mulched in 2020, followed by targeted cut-stump herbicide treatment in which Pathfinder II™ (triclopyr ester; Corteva Agriscience, Indianapolis, IN, USA) was directly applied to freshly cut R. cathartica stumps at 100% concentration. In early 2021, resprouting R. cathartica was treated using spot application to foliage with Garlon 3A™ (triclopyr amine salt; Corteva Agriscience) at 5%, avoiding broadcast application to the surrounding vegetation. Treatments therefore differed in both removal approach and time since intervention, with regrown plots last treated in 2012 and managed plots treated in 2020 to 2021. All plots contained native trees planted between 2010 and 2013 as part of restoration efforts, and approximately 90% of the surviving native trees were planted individuals (primarily maple [Acer], but also oak [Quercus], basswood [Tilia], and birch [Betula]), with limited volunteer native tree recruitment (primarily P. deltoides).
Floral and Faunal Surveys
Plot vegetation was sampled in June and September 2021. Diameter at breast height (DBH) and stem counts for small-diameter woody stems (DBH < 10 cm) were measured along a 14-m plot-diagonal transect using a caliper, and tree-sized stems (DBH ≥ 10 cm) were measured with a DBH tape. Herbaceous-layer vegetation was sampled in four 0.25-m2 subplots per plot, positioned 1 m inward from each corner. Litter biomass was quantified from the same four 0.25-m2 subplots by collecting leaf material at the litter–soil interface, removing coarse woody fragments (e.g., twigs, bark), drying samples for 72 h at 65 C, and weighing to obtain dry mass. At the time of sampling, no coarse remnants of R. cathartica mulch were evident.
Pollinators were collected three times (June, July, and August 2021) using blue vane traps (SpringStar, Woodinville, WA, USA). Each trap consisted of a plastic container (15-cm diameter by 15-cm height) with a blue screw funnel and cross vanes, filled with water plus a drop of detergent, and suspended 1.2 m above ground using a shepherd’s hook. One trap was deployed per plot per sampling period and remained in place for 7 consecutive days (18 traps per period; 54 trap deployments total). Tree-dwelling arthropods were collected three times (June, July, and August 2021) using a 1-m2 canvas beat sheet placed beneath low branches of three focal trees per plot (54 beat sheet samples per period); the same trees were sampled each period. A PVC stick was used to shake four branches for 15 s each to dislodge arthropods onto the canvas for collection. Leaf litter arthropods were sampled three times (June, July, and August 2021) by collecting leaf litter and decaying organic material at the litter–soil interface from the four 0.25-m2 vegetation subplots per plot and pooling material into a single sample per plot per period (54 pooled litter samples total). Samples were processed using Berlese-Tullgren funnels under tungsten bulbs for 7 d, and extracted arthropods were preserved in alcohol. Myrmica rubra foragers were collected arboreally in the beat-sheet sampling and terrestrially in the leaf-litter samples.
Rodents were live-trapped twice (June and July 2021) for 1 night per sampling period using Sherman traps (H.B. Sherman, Tallahassee, FL, USA). Four traps were placed 1 m inward from each plot corner at dusk and checked at dawn (144 trap-nights total). Traps were baited with a seed mixture and freeze-dried mealworms. Captured rodents were transferred to a cloth bag, identified as Peromyscus spp. and released at the point of capture; individuals were not marked, so captures were interpreted as relative activity. All trapping and handling procedures were approved by the New York State Department of Environmental Conservation (License to Collect), the Buffalo Museum of Science, and the Buffalo State Institutional Animal Care and Use Committee. Fauna were identified to order (pollinators to family) and flora to family (Bland and Jaques Reference Bland and Jaques1978; Brown Reference Brown2020; Del Tredici Reference Del Tredici2020; Neal et al. Reference Neal, Uva, DiTomaso and DiTommaso2023)
Data Analysis
We analyzed vegetation richness and herbaceous cover as functions of R. cathartica treatment using generalized linear mixed models (GLMMs) in the R statistical program (R Core Team 2025). Treatment was included as a fixed effect and plot as a random intercept to account for plot-level heterogeneity. Fixed effects were evaluated with type II Wald χ2 tests (car package), model fit was assessed using dispersion parameters, and pairwise differences among treatments were evaluated with Tukey post hoc comparisons (multcomp package). We did not include M. rubra abundance as a predictor in vegetation models because we had no a priori expectation that ant abundance would directly influence plant cover or richness. Vegetation responses were modeled with Poisson GLMMs, whereas faunal responses were modeled with negative binomial GLMMs to accommodate aggregation and excess variance typical of animal count data.
We modeled M. rubra abundance as a function of treatment, centered and scaled litter biomass (g), and their interaction using a negative binomial GLMM, with a random intercept for plot. We also fit an additive model without the interaction term to evaluate the partial effect of litter while controlling for treatment. For both models, fixed effects were evaluated with type II Wald χ2 tests, and Tukey post hoc comparisons were used to examine treatment differences where appropriate. Marginal and conditional pseudo-R2 values were calculated using the MuMIn package.
Arthropod, pollinator, detritivore, and rodent capture responses were analyzed using negative binomial GLMMs with fixed effects for R. cathartica treatment, centered and scaled M. rubra abundance, and their interaction and a random intercept for plot. Total arthropod abundance was modeled as before, and arthropod taxonomic richness was analyzed using a parallel zero-inflated model fit with glmmTMB. Pollinator abundance was defined as the summed abundance of bees from four families (Apidae, Megachilidae, Andrenidae, and Halictidae) captured in blue vane traps. Detritivore abundance was defined as the combined abundance of Diplopoda, Isopoda, and terrestrial Gastropoda; and rodent activity was quantified as total Peromyscus captures across trapping sessions.
Because not-treated habitat occurred primarily within one portion of the site, 5/6 not-treated plots were located within the same general area and not fully interspersed with the other treatments. As such, we conducted two sensitivity analyses to evaluate whether results were driven by unusually homogeneous or influential plots. First, we compared within-plot variability in M. rubra abundance among treatments using a Fligner-Killeen test applied to plot-level variances. Second, we conducted a leave-one-plot-out analysis in which the primary model was refit after removing each plot in turn. Treatment inference was considered robust if the treatment effect remained supported across all refits and if the direction of treatment coefficients remained consistent.
Results and Discussion
Plant Communities
Native woody basal area was negligible across treatments (<0.01 m2 ha−1). In contrast, R. cathartica basal area was higher in regrown plots (mean ± SE; 18.95 ± 1.04 m2 ha−1) than in not-treated plots (0.73 ± 0.06 m2 ha−1), and it was absent from managed plots. Leaf litter biomass was similar in managed (201.54 ± 13.62 g m−2) and regrown (212.65 ± 4.51 g m−2) plots but lower in not-treated plots (98.31 ± 7.96 g m−2).
Herbaceous layer cover was highest in managed plots (mean ± SE; 96.33 ± 1.98%), intermediate in not-treated plots (36.66 ± 10.89%), and lowest in regrown plots (1.33 ± 0.72%; χ2 = 27.345, df = 2, P-value < 0.001). Herbaceous species richness showed the same pattern, with the highest richness in managed plots (14.33 ± 1.09 species), intermediate in not-treated plots (6.16 ± 1.22 species), and lowest in regrown plots (0.50 ± 0.18 species) (χ2 = 36.285, df = 2, P-value < 0.001). Managed plots were dominated by native species (87%) such as marsh horsetail (Equisetum palustre L.; 26% cover), foxtail (Setaria sp.; 18%), and slender rush (Juncus tenuis Willd.; 11%), each exceeding 10% cover. Not-treated plots were dominated by introduced species and invasive natives (95%), primarily fescue (Festuca spp.; 31% cover), catchweed bedstraw (Galium aparine L.; 27%), birdsfoot trefoil (Lotus corniculatus L.; 21%), and orchardgrass (Dactylis glomerata L.; 12%). Vegetation was nearly absent in regrown plots, with sparse cover of eastern enchanter’s nightshade [Circaea canadensis (L.) Hill; 7%] and bulbous buttercup (Ranunculus bulbosus L.; 1%).
Rhamnus cathartica by European Ant Impacts
Rhamnus cathartica treatment and leaf litter biomass both influenced M. rubra abundance, with no evidence of a treatment by litter interaction (χ2 = 1.285, df = 2, P-value = 0.525). Managed plots supported higher (mean ± SE) M. rubra abundance (Figure 1A; 43.9 ± 8.5 workers m−2; Tukey P-value < 0.012) than the regrown (16.4 ± 4.5 workers m−2) and not-treated (7.8 ± 2.3 workers m−2) plots, which did not differ (Tukey P-value < 0.117) (χ2 = 13.829, df = 2, P-value < 0.001). Myrmica rubra abundance also increased with leaf litter biomass (Figure 1B; χ2 = 4.804, df = 1, P-value < 0.028), which explained approximately 16% to 25% of the variance in M. rubra counts (pseudo-R2). After treatment effects were accounted for, leaf litter remained a positive predictor of M. rubra abundance (χ2 = 4.680, df = 1, P-value = 0.030), indicating that the litter effect was independent of treatment differences.
Myrmica rubra abundance (mean ± SE) as a function of (A) Rhamnus cathartica treatment and (B) leaf litter biomass. The R. cathartica treatments were: regrown (R. cathartica removed and resprouted as dense shrubbery), not-treated (mature R. cathartica untreated), and managed (R. cathartica mechanically and then chemically removed). Letters summarize Tukey-adjusted pairwise comparisons controlling the family-wise error rate at α = 0.05. Myrmica rubra abundance was higher in managed plots than in regrown and not-treated plots and increased with leaf litter biomass.

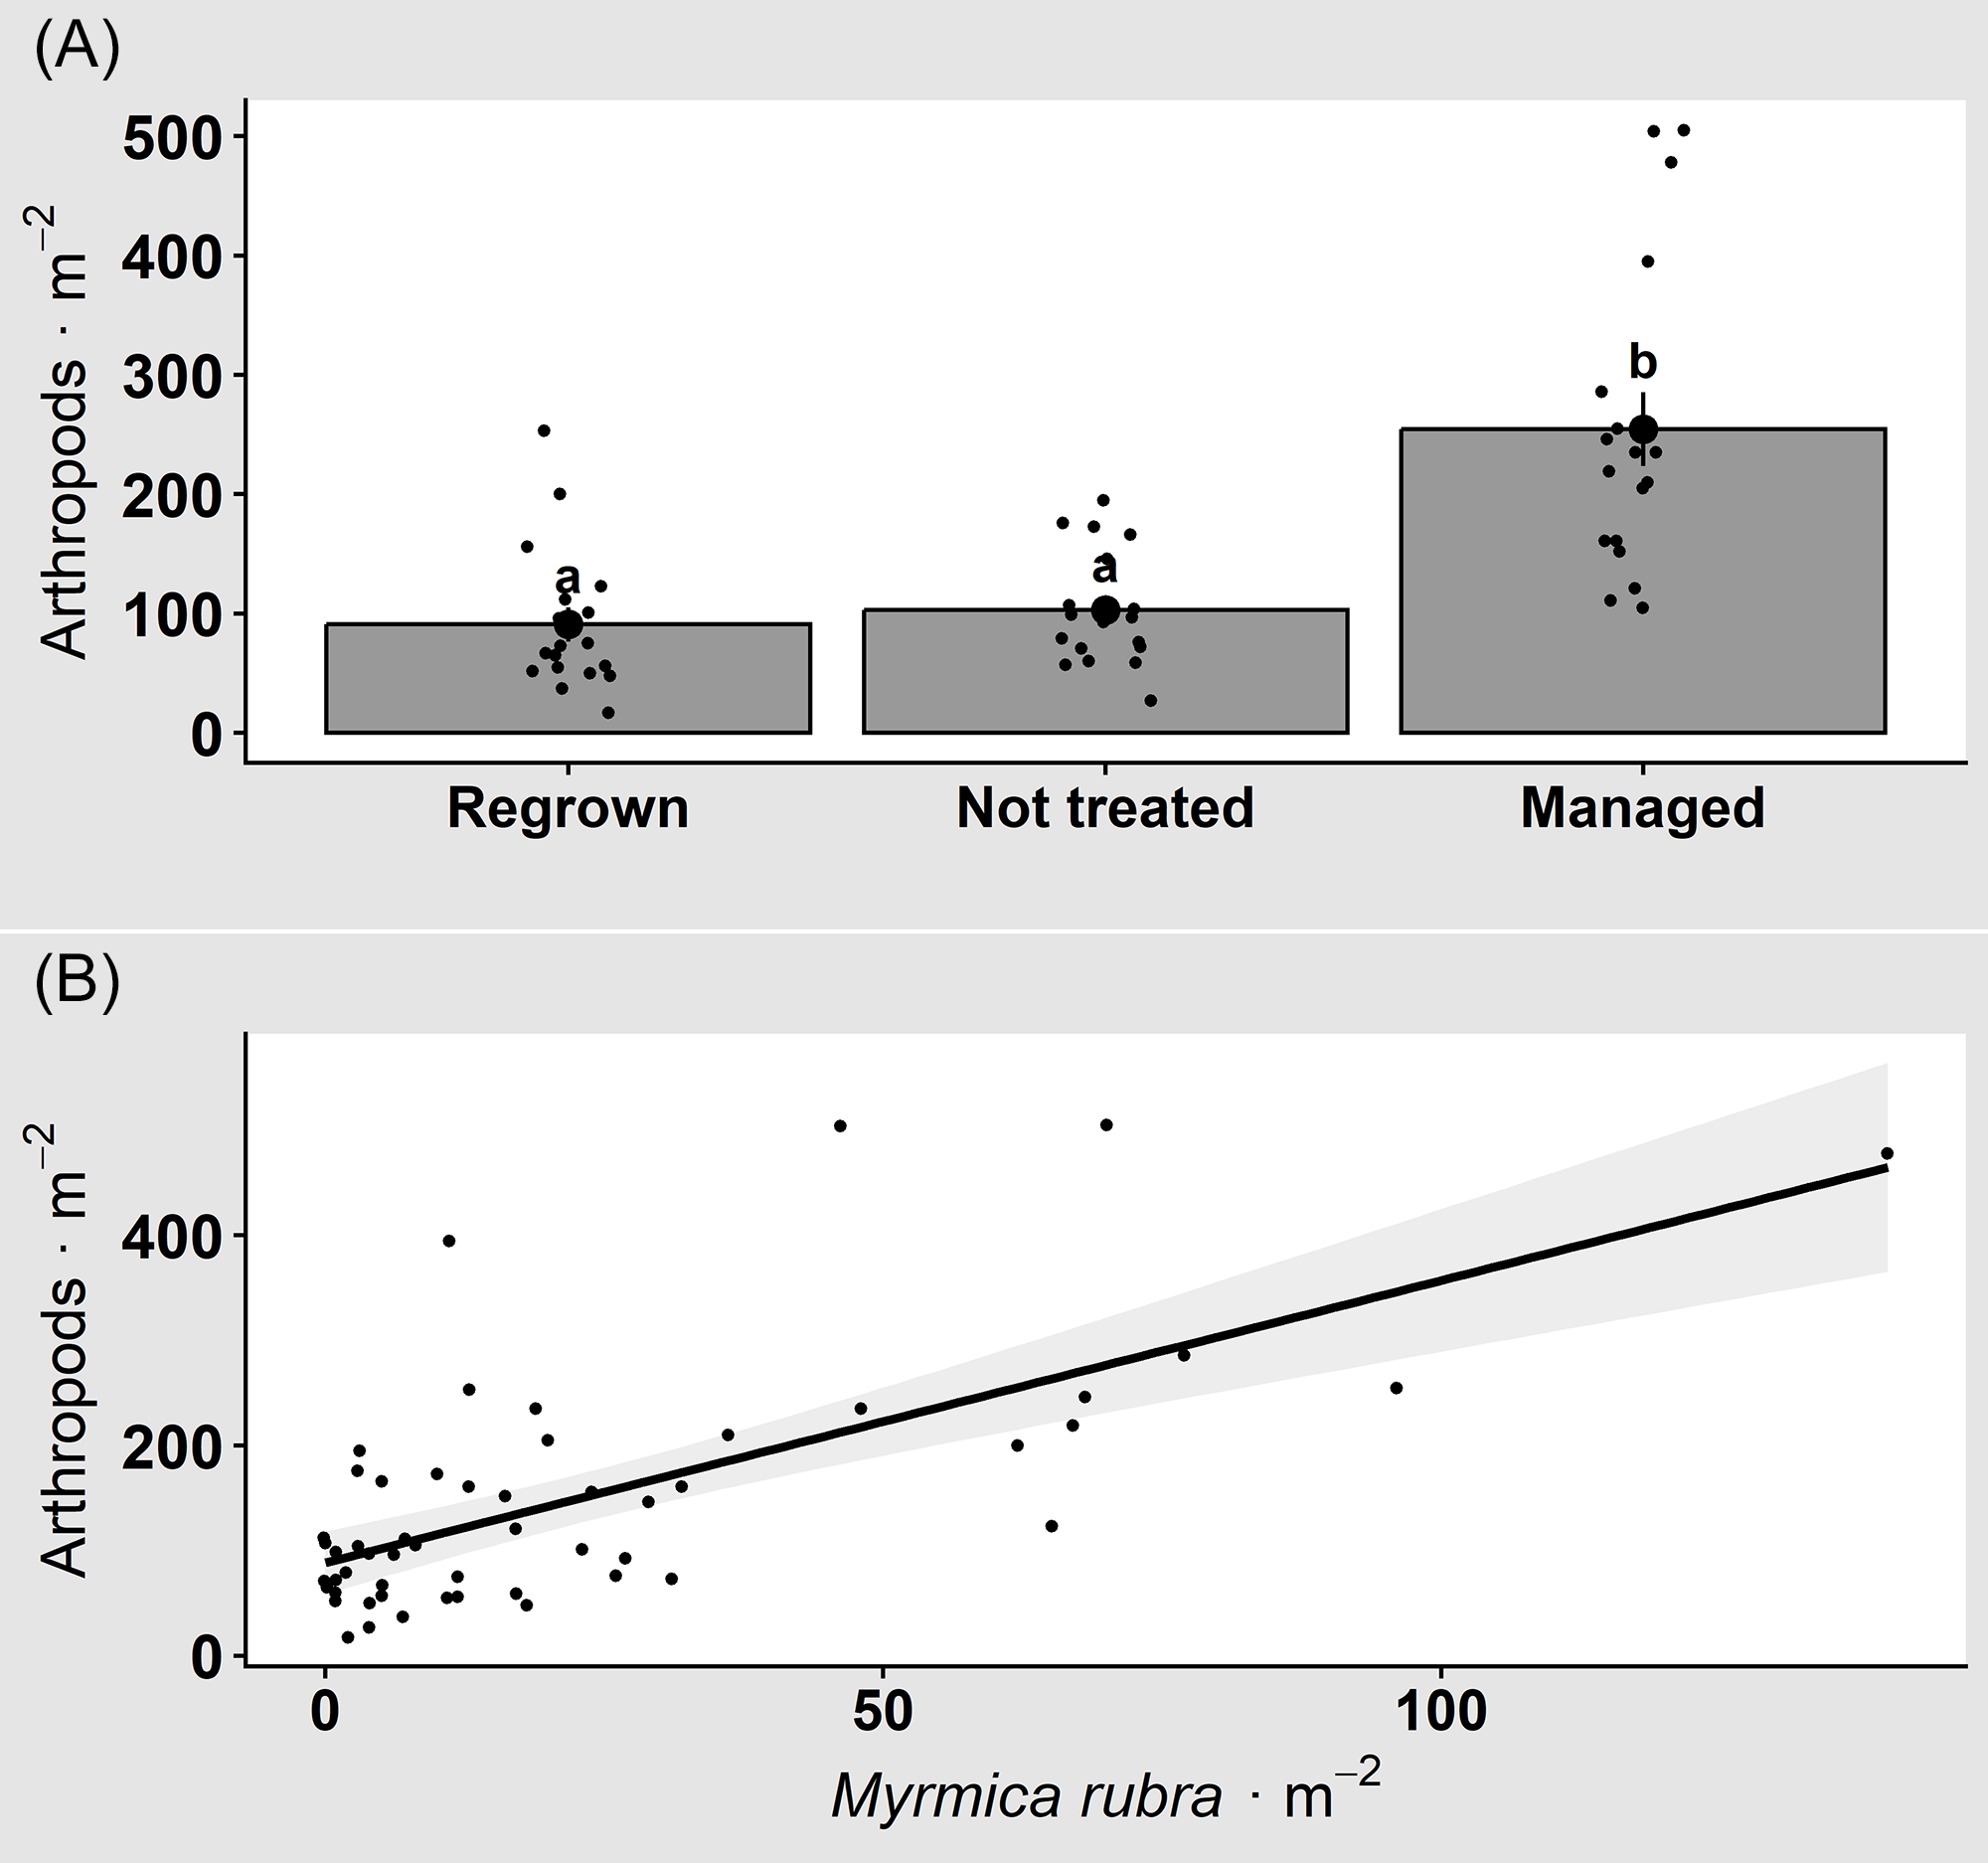
Rhamnus cathartica treatment and M. rubra abundance both influenced arthropod abundance, but there was no interaction between the two (χ2 = 1.178, df = 2, P-value = 0.554). Arthropod abundance (mean ± SE) was higher (Tukey P-value < 0.001) in managed plots (Figure 2A; 254.6 ± 30.8 individuals m−2) compared with both regrown (90.8 ± 14.2 individuals m−2) and not-treated plots (103.1 ± 11.3 individuals m−2), which did not differ (Tukey P-value = 0.316) (χ2 = 20.131, df = 2, P-value < 0.001). Arthropod abundance also increased with M. rubra abundance (Figure 2B; χ2 = 10.417, df = 1, P-value = 0.001) and explained approximately 31% to 36% of the variance in arthropod counts (pseudo-R2). Arthropod richness was influenced by R. cathartica treatment (χ2 = 8.263, df = 2, P-value < 0.001), but it was not affected by M. rubra abundance (χ2 = 0.095, df = 1, P-value = 0.757), and there was no interaction between the two (χ2 = 1.406, df = 2, P-value = 0.495). Arthropod richness was higher in the managed (12.3 ± 0.3) than in the regrown (8.7 ± 0.5) plots (Tukey P-value = 0.003) but did not differ compared with the not-treated plots (10.2 ± 0.4; Tukey P-value = 0.143), nor was there a difference between the regrown and not-treated plots (Tukey P-value = 0.338).
Arthropod abundance (mean ± SE) in relation to (A) Rhamnus cathartica treatment and (B) Myrmica rubra abundance. Letters summarize Tukey-adjusted pairwise comparisons controlling the family-wise error rate at α = 0.05. Arthropod abundance was highest in managed plots and was positively associated with M. rubra abundance.

There was marginal evidence for an R. cathartica treatment by M. rubra interaction, suggesting that the relationship between pollinator abundance and M. rubra abundance differed among treatments (Figure 3; χ2 = 5.778, df = 2, P-value = 0.055). In not-treated plots, pollinator abundance (0.06 ± 0.06 individuals trap−1) declined steeply with increasing M. rubra abundance, whereas in regrown plots, pollinator abundance (9.16 ± 4.15 individuals trap−1) was consistently low regardless of M. rubra density. Managed plots supported higher pollinator numbers overall, but pollinator abundance (16.05 ± 2.28 individuals trap−1) also declined with increasing M. rubra abundance.
Pollinator abundance in relation to Myrmica rubra abundance across Rhamnus cathartica treatments. Pollinator abundance was highest in managed plots, intermediate in not-treated plots, and nearly absent in densely regrown plots. Pollinator abundance tended to decline with increasing M. rubra abundance, with the steepest decline in not-treated plots. Managed plots supported higher pollinator abundance overall, but pollinator abundance also decreased as M. rubra abundance increased.

Detritivore abundance varied among R. cathartica treatments (Figure 4; χ2 = 22.118, df = 2, P-value < 0.001) but was not related to M. rubra abundance (χ2 = 0.504, df = 1, P-value = 0.477), and there was no treatment by M. rubra interaction (χ2 = 1.730, df = 2, P-value = 0.420). Detritivores were less abundant in not-treated plots (1.9 ± 0.7 individuals m−2) compared with both regrown plots (15.9 ± 3.4 individuals m−2; Tukey P-value < 0.001) and managed plots (18.1 ± 4 individuals m−2; Tukey P-value < 0.001). Managed and regrown plots did not differ in detritivore abundance (Tukey P-value = 0.921).
Detritivore abundance (mean ± SE) across Rhamnus cathartica treatments. Detritivores were less abundant in not-treated plots than in regrown or managed plots. Letters summarize Tukey-adjusted pairwise comparisons controlling the family-wise error rate at α = 0.05. Individual observations are shown with jittered residuals to avoid overplotting.

Rodent captures (n = 28 Peromyscus spp., 1 Microtus sp.) varied among R. cathartica treatments (Figure 5; χ2 = 13.387, df = 2, P-value = 0.001) but were not related to M. rubra abundance (χ2 = 2.474, df = 2, P-value = 0.115), and there was no treatment by M. rubra interaction (χ2 = 2.254, df = 2, P-value = 0.323). Rodent captures were higher in regrown plots (1.1 ± 0.2 individuals trap−1) compared with both not-treated plots (0.1 ± 0.1 individuals trap−1; Tukey P-value = 0.004) and managed plots (0.2 ± 0.1 individuals trap−1; Tukey P-value = 0.010). Managed and not-treated plots did not differ (Tukey P-value = 0.758).
Rodent abundance (mean ± SE) across Rhamnus cathartica treatments. Rodents were most abundant in densely regrown plots. Letters summarize Tukey-adjusted pairwise comparisons controlling the family-wise error rate at α = 0.05. Individual observations are shown with jittered residuals to avoid overplotting.

Within-plot variance in M. rubra abundance did not differ among treatments (Fligner-Killeen; χ2 = 5.11, df = 2, P-value = 0.078). Leave-one-plot-out sensitivity analysis indicated that the treatment effect was robust to removal of any single plot (P-value range = <0.001 to 0.004; median = 0.002). Treatment coefficient estimates were directionally consistent across refits.
Rhamnus cathartica removal reshaped communities across trophic levels, yielding both restorative and unexpected outcomes. As predicted, removal promoted strong vegetation recovery, with herbaceous cover and species richness increasing more than 10-fold relative to invaded plots. This rebound was accompanied by higher pollinator and arthropod abundance, consistent with increased light availability and altered litter conditions that improved habitat structure and resource availability. However, these gains coincided with a 3- to 6-fold increase in invasive M. rubra ants, which were most abundant in recently managed plots. Rather than declining with the increased openness following removal, M. rubra appeared to exploit the thicker litter layers that developed after R. cathartica removal. These results indicate that invader removal can simultaneously foster native recovery and facilitate secondary invasion, suggesting that restoration in already-invaded ecosystems may redirect, rather than reverse, invasion-driven community change.
Contrary to expectations, M. rubra was three to six times more abundant in managed plots than in R. cathartica–dominated areas. Rather than declining after R. cathartica removal, M. rubra abundance was positively associated with leaf litter accumulation, which increased in managed plots. Rhamnus cathartica leaves decompose rapidly due to their high nitrogen content (Heneghan et al. Reference Heneghan, Clay and Brundage2002), producing little litter buildup in invaded areas, whereas managed plots accumulated thicker, more stable litter layers that provide ant nesting substrate and microclimatic buffering (Groc et al. Reference Groc, Orivel, Dejean, Martin, Etienne, Corbara and Delabie2009; Vasconcelos et al. Reference Vasconcelos, Pacheco, Silva, Vasconcelos, Lopes, Costa and Bruna2009). Overall arthropod abundance increased with M. rubra density, consistent with shared habitat preferences rather than facilitation. Pollinator abundance, in contrast, declined with increased M. rubra, suggesting potential interference or avoidance effects, whereas detritivores were largely unaffected. Together, these patterns indicate that R. cathartica removal improved habitat conditions that supported greater arthropod abundance overall, but the simultaneous rise of M. rubra produced mixed responses across trophic groups. Similar context-dependent outcomes have been reported elsewhere, where invasive ants, including M. rubra, have effects on native arthropods that range from strongly negative (Holway et al. Reference Holway, Lach, Suarez, Tsutsui and Case2002; Lach Reference Lach2007) to neutral or even positive depending on habitat and resource structure (Garnas et al. Reference Garnas, Groden and Drummond2014; Goodman and Warren Reference Goodman and Warren2019; Krushelnycky and Gillespie Reference Krushelnycky and Gillespie2008).
Herbaceous cover and species richness increased in managed plots relative to R. cathartica–dominated areas, and vegetation shifted toward native dominance, consistent with R. cathartica removal facilitating plant community recovery (Lamb et al. Reference Lamb, Havens, Holloway, Steffen, Zeldin and Kramer2022; Larkin et al. Reference Larkin, Steffen, Gentile and Zirbel2014; Wragg et al. Reference Wragg, Schuster, Roth, Bockenstedt, Frelich and Reich2021). In contrast, plots where R. cathartica regrew after earlier removal supported sparse, depauperate vegetation, indicating that sustained management is essential to prevent reinvasion (Lamb et al. Reference Lamb, Havens, Holloway, Steffen, Zeldin and Kramer2022; Wragg et al. Reference Wragg, Schuster, Roth, Bockenstedt, Frelich and Reich2021). In our study, herbaceous cover and richness in removal plots were more than twice those in not-treated plots and roughly 14 times those in regrown plots, and vegetation composition shifted from 95% non-native in not-treated plots to 87% native in removal plots. The not-treated plots were dominated by non-native Festuca spp., G. aparine, and L. corniculatus, suggesting that self-thinning of mature R. cathartica canopies (Knight et al. Reference Knight, Kurylo, Endress, Stewart and Reich2007; Schuster et al. Reference Schuster, Wragg, Roth, Bockenstedt, Frelich and Reich2022) may allow secondary colonization by disturbance-tolerant herbs but not native perennials. At Tifft, O. virginianus appears to use not-treated stands for bedding, which may further suppress palatable herbaceous species through selective browsing (Warren et al. Reference Warren, Goodrich, Cochran and Spiering2025). These patterns suggest that post-removal plant community composition is shaped by both residual R. cathartica legacies and herbivore pressure.
Given the strong links between floral diversity and pollinator communities, we expected pollinator abundance and richness to increase following R. cathartica removal. Pollinator abundance and richness were indeed higher in managed plots than in not-treated or regrown plots, with abundance in managed plots more than triple that in not-treated plots and over an order of magnitude higher than in densely regrown plots. This pattern mirrors results from removal of other invasive shrubs, including F. alnus, Amur honeysuckle [Lonicera maackii (Rupr.) Maxim.], and Chinese privet (Ligustrum sinense Lour.), where pollinators and native plant communities rebounded rapidly (Fiedler et al. Reference Fiedler, Landis and Arduser2012; Hanula and Horn Reference Hanula and Horn2011; Hartman and McCarthy Reference Hartman and McCarthy2004). Although studies directly testing pollinator responses to R. cathartica removal appear limited, removal of the closely related F. alnus has been associated with increases in generalist pollinators, consistent with rapid recolonization after shrub removal (Fiedler et al. Reference Fiedler, Landis and Arduser2012).
At our site, M. rubra forms large foraging swarms that blanket the ground and extend into woody vegetation, a pattern consistent with invasive ants that disrupt native arthropod communities. High densities of invasive ants can restructure co-occurring arthropod communities, particularly pollinators that nest in or forage near the ground (Goodman and Warren Reference Goodman and Warren2019; Lach Reference Lach2007; Plentovich et al. Reference Plentovich, Graham, Haines and King2021). For example, invasive ants were a primary cause of nest failure in the endangered yellow-faced bee (Hylaeus anthracinus) (Plentovich et al. Reference Plentovich, Graham, Haines and King2021), and the invasive Asian needle ant (Brachyponera chinensis) appears linked to declines in bees and butterflies (Ulyshen and Horn Reference Ulyshen and Horn2023). In our study, R. cathartica removal coincided with increased pollinator abundance, but higher M. rubra abundance within those plots appeared to dampen these gains. Whereas both M. rubra and pollinators increased with R. cathartica removal, pollinator abundance declined as ant abundance increased, suggesting that secondary invasion by invasive ants can constrain restoration benefits.
The spatial independence of pollinator samples depends on pollinator foraging range, trap attractiveness, and landscape heterogeneity. Our 75-m plot spacing falls within the 50- to 100-m range used in comparable field studies (Kremen et al. Reference Kremen, Williams and Thorp2002; Williams et al. Reference Williams, Crone, Roulston, Minckley, Packer and Potts2010) and below the 100- to 300-m foraging distances typical of many native bees (Greenleaf et al. Reference Greenleaf, Williams, Winfree and Kremen2007; Zurbuchen et al. Reference Zurbuchen, Landert, Klaiber, Müller, Hein and Dorn2010). However, blue vane traps have relatively limited effective attraction radii (approximately 25 to 50 m) and largely intercept local bee activity rather than drawing individuals from long distances (Cane et al. Reference Cane, Minckley and Kervin2000; Kimoto et al. Reference Kimoto, DeBano, Thorp, Taylor, Schmalz, DelCurto, Johnson, Kennedy and Rao2012). In heterogeneous landscapes, vegetation structure can further localize bee movement, with foraging in dense vegetation and along forest edges occurring over shorter distances than in open habitats (Kimoto et al. Reference Kimoto, DeBano, Thorp, Taylor, Schmalz, DelCurto, Johnson, Kennedy and Rao2012; Steffan-Dewenter and Tscharntke Reference Steffan-Dewenter and Tscharntke2000; Taki et al. Reference Taki, Kevan and Ascher2007). Thus, in our structurally diverse system, 75-m spacing likely captured distinct pollinator assemblages. However, because blue vane traps are biased toward bees, Lepidopteran pollinators likely were underrepresented (Short et al. Reference Short, Burns, Bell and Tronstad2023; Westerberg et al. Reference Westerberg, Berglund, Jonason and Milberg2021).
We found that leaf litter biomass was roughly half as great in not-treated plots as in managed and regrown plots. Although R. cathartica leaves decompose rapidly due to their high nitrogen content (Ewing et al. Reference Ewing, Lauko and Anderson2015; Heneghan et al. Reference Heneghan, Fatemi, Umek, Grady, Fagen and Workman2006; Knight et al. Reference Knight, Kurylo, Endress, Stewart and Reich2007), managed plots accumulated more leaf litter despite supporting substantially less woody cover, suggesting longer persistence of native tree litter. Managed plots accumulated predominantly native tree litter, which likely is more recalcitrant than R. cathartica litter and therefore persisted longer, forming thicker layers. Consistent with these patterns, detritivore abundance tracked litter accumulation, with not-treated plots supporting about half the detritivore abundance of regrown and managed plots. Myrmica rubra abundance increased with litter biomass, but detritivores did not respond to M. rubra, suggesting that variation in litter biomass acted as the primary driver of detritivore abundance across treatments.
Rhamnus cathartica invasion has been linked to reduced mammal abundance where rodents avoid its unpalatable non-native seeds and fruits (Knight et al. Reference Knight, Kurylo, Endress, Stewart and Reich2007; Shahid et al. Reference Shahid, Garneau and McCay2009; Vernon et al. Reference Vernon, Magle, Lehrer and Bramble2014). Because ground-dwelling arthropods are a key food resource for omnivorous rodents, and we expected increased arthropod abundance following R. cathartica removal, we expected higher rodent (Peromyscus spp. in this case) activity in managed plots. Instead, rodents were most abundant in densely regrown plots, likely because R. cathartica regrowth provides thick understory cover that reduces predation risk (Johnson and León Reference Johnson and León2015; Mattos and Orrock Reference Mattos and Orrock2010).
Although mulched R. cathartica material was left on-site following removal, R. cathartica litter decomposes rapidly due to its high nitrogen content, suggesting that elevated litter biomass in managed plots within the first year after treatment reflected accumulation of native tree litter and persistent ground-layer detritus rather than residual R. cathartica debris. Consistent with this interpretation, R. cathartica–dominated plots exhibited lower litter biomass despite continuous R. cathartica leaf input, indicating that decomposition rates, rather than litter production per se, governed standing litter biomass. Although herbicide application may have influenced vegetation dynamics, several factors suggest it was not the primary driver of observed patterns. Application consisted of cut-stump treatments after mechanical R. cathartica removal rather than broadcast spraying. Managed plots supported the highest herbaceous cover (96%) and richness (14 species), with 87% native composition—a pattern more consistent with competitive release from R. cathartica than herbicide-induced suppression. However, because managed and regrown plots differed in both herbicide use and time since treatment, we cannot fully separate the effects of chemical follow-up from recovery time. Because of the management history constraints on study design, our treatment plots were imperfectly interspersed, but our sensitivity checks indicated that inference was not driven by unusually low within-plot variability in the clustered treatment or by any single influential plot.
Our inferences derive from a single, postindustrial preserve with alkaline soils, deer overabundance, and an established M. rubra population. As such, our study clarifies general processes, but not general magnitudes. The key pathway we documented is that R. cathartica removal increased herbaceous cover and litter mass, which likely provided nesting substrate and a buffered microclimate favoring M. rubra. At the same time, increased openness and light availability increased arthropod and pollinator abundance. Responses documented here reflect relatively early post-removal dynamics. Vegetation recovery, litter accumulation, and faunal responses may continue to shift as succession proceeds, R. cathartica resprouts are suppressed or recolonization continues, and litter inputs stabilize under regenerating canopy conditions. Some responses observed here, such as elevated herbaceous cover or increased abundance of disturbance-associated fauna, may strengthen or reverse as competitive interactions and habitat structure change. Long-term monitoring will be necessary to determine whether these early patterns persist or shift toward later-stage community trajectories.
These results illustrate that invader removal can function as an ecological disturbance that reorganizes community structure rather than simply reversing the effects of invasion. The post-removal proliferation of M. rubra suggests that removal can generate new resource regimes and habitat configurations that favor disturbance-adapted or opportunistic species. This outcome aligns with models of secondary invasion and succession, in which restoration-driven shifts in light, litter, and soil conditions act as disturbance pulses that reset competitive hierarchies and open colonization windows (Flory and Bauer Reference Flory and Bauer2014; Mack et al. Reference Mack, Simberloff, Lonsdale, Evans, Clout and Bazzaz2000; Pearson et al. Reference Pearson, Ortega, Runyon and Butler2016). In this sense, restoration and invasion represent linked phases of ecosystem reorganization: both redistribute resources, restructure trophic interactions, and initiate novel successional pathways. The patterns observed here emphasize that post-removal community trajectories are governed less by a return to preinvasion states than by emergent post-disturbance assembly dynamics.
Supplementary material
To view supplementary material for this article, please visit https://doi.org/10.1017/inp.2026.10041
Acknowledgments
We thank Leander Ruhl, Alicia Addams, and Vel Gebbert for field assistance and Joe Armstrong, Marcus Kenline, and Jonathan Promowicz for laboratory assistance. We also thank two anonymous reviewers and the associate editor for helpful comments that improved the clarity of the article.
Funding statement
This research received no specific grant from any funding agency or the commercial or not-for-profit sectors.
Competing interests
The authors declare no conflicts of interest.


 Open access