

Singing along with a crowd during the chorus of a well-known song at a concert, walking side-by-side with a loved one, and dancing in pairs are all examples of synchronous activities that trigger positive individual and collective experiences (e.g., Grinspun et al., Reference Grinspun, Landesman, García and Rabinowitch2025). Likewise, seeing a marching band parading down an avenue, watching the Olympic finals of the synchronized swimming, or appreciating the precise coupling of rowing crews are good examples of synchronous activities whose mere observation triggers further positive individual appraisals and experiences (Hu et al., Reference Hu, Cheng, Pan and Hu2022).
Interpersonal synchrony is the automatic process of alignment and entrainment occurring between individuals’ physiological, neurological, motor, and verbal activities, which shapes how social systems behave and endure (Mogan et al., Reference Mogan, Fischer and Bulbulia2017). Interpersonal synchrony is a fundamental process for social understanding (Wheatley et al., Reference Wheatley, Kang, Parkinson and Looser2012) and co-regulation (Semin & Cacioppo, Reference Semin, Cacioppo and Pineda2008), and it is a key concept in influential theories of embodied cognition and social cognition (Cacioppo et al., Reference Cacioppo, Zhou, Monteleone, Majka, Quinn, Ball, Norman, Semin and Cacioppo2014; Semin & Cacioppo, Reference Semin, Cacioppo and Pineda2008). One of the basic tenets of socially embodied cognition theory is that it is through the synchronization dynamics of interacting individuals that social cognition develops, interpersonal ties form, and cooperation is made possible (Cacioppo et al., Reference Cacioppo, Zhou, Monteleone, Majka, Quinn, Ball, Norman, Semin and Cacioppo2014; daSilva & Wood, Reference daSilva and Wood2024; Gorman & Wiltshire, Reference Gorman and Wiltshire2024).
Interpersonal synchrony is an evolved, heritable foundation of communication, grounded in the dynamic coupling of at least two nervous systems and musculoskeletal structures that map onto each other in time. Such synchronization often occurs in the absence of explicit communicative intent. By entraining movements, (unintentional) partners jointly recruit time-locked sensory–motor processes that generate a state of correspondence, reducing psychological distance and fostering proximity, rapport, and affiliation (Hu et al., Reference Hu, Cheng, Pan and Hu2022). This explains why synchronous interactions elicit cognitions (e.g., trust; Launay et al., Reference Launay, Dean and Bailes2013 ), as well as affective states that reinforce cooperation—effects observed in contexts as diverse as mother–infant dyads, romantic couples, and strangers dancing in a crowd (Cirelli, Reference Cirelli2018).
In this research, we focus on interpersonal motor synchrony, that is, the smooth meshing in time of the simultaneous rhythmic motor activity of two actors (Bernieri & Rosenthal, Reference Bernieri, Rosenthal, Feldman and Rime1991). Research on interpersonal motor synchrony (interpersonal synchrony for the remainder of the manuscript) suggests that it positively predicts cohesion (Hove & Risen, Reference Hove and Risen2009), entitativity (Lakens, Reference Lakens2010), positive affect (Tschacher et al., Reference Tschacher, Rees and Ramseyer2014), collaboration (Valdesolo et al., Reference Valdesolo, Ouyang and DeSteno2010), and conversational quality (Carnevali et al., Reference Carnevali, Valori, Mason, Altoè and Farroni2024) in dyads. Interpersonal synchrony is a building block of social cognition, a distinctive process that makes the movements of others both intelligible and socially meaningful to the point they can provide dyad and non-dyad members enough information to drive the elaboration of cognitions, affects, and motivations toward the other party (Semin & Cacioppo, Reference Semin, Cacioppo and Pineda2008). Whereas most empirical studies on interpersonal synchrony have focused on synchrony within dyadic interaction, an exceptionally smaller number of empirical studies have looked at the broader social effect of dyads’ interpersonal synchrony, by looking at the extent to which it shapes other people’s beliefs and intentions toward members of the dyads. Indeed, some studies have gathered initial evidence suggesting that synchronous groups are perceived by others as having greater entitativity (i.e., they are more likely to be seen as a unit), their members are thought to have rapport, work well together, be more cooperant with one another, and bystanders feel more willing to affiliate with them (Caporael, Reference Caporael1997; Jex & Bliese, Reference Jex and Bliese1999; Lakens, Reference Lakens2010; Lakens & Stel, Reference Lakens and Stel2011; Marques-Quinteiro et al., Reference Marques-Quinteiro, Mata, Simão, Gaspar and Farias2019; McEllin & Sebanz, Reference McEllin and Sebanz2024; Miles et al., Reference Miles, Nind, Henderson and Macrae2010; Valdesolo et al., Reference Valdesolo, Ouyang and DeSteno2010; Vicary et al., Reference Vicary, Sperling, Von Zimmermann, Richardson and Orgs2017).
Specifically, in previous research (Marques-Quinteiro et al., Reference Marques-Quinteiro, Mata, Simão, Gaspar and Farias2019), participants were exposed to videos showing pairs of individuals whose interaction timing was fully locked in either synchronous or asynchronous fashion (i.e., extreme synchrony or asynchrony, with no other cues provided). The goal of this previous research was to determine whether the manipulation of dyads’ interpersonal synchrony would influence bystanders’ perceptions of dyad’s collective efficacy (i.e., operationalized through observers’ perceptions of dyad’s capacity to work well together; Jex & Bliese, Reference Jex and Bliese1999) and trigger greater bystanders’ motivation to join the dyad and form a group (i.e., affiliation intentions; Wang et al., Reference Wang, Oppewal and Thomas2014). This was beneficial in terms of establishing causality because the independent variable was manipulated prior to the evaluation of the intended dependent variables.
However, it remains to be determined the extent to which synchrony is a cue that people naturally pick up on, and which informs their beliefs and attitudes outside the lab. In this study, our goal is to further examine the laboratory findings reported by Marques-Quinteiro et al. (Reference Marques-Quinteiro, Mata, Simão, Gaspar and Farias2019) in a naturalistic setting where synchrony is a much subtler cue among many other competing cues, such as gender, age, or participants’ height (Macpherson et al., Reference Macpherson, Fay and Miles2020). Therefore, any research findings cannot be attributed to demand effects that might have resulted from a blatant and extreme (i.e., all-or-nothing) synchrony manipulation (i.e., the manipulation is so obvious that research participants might pick up on its goal and respond accordingly).
Thus, one question of interest is whether people pick up on perceived synchrony as a cue to infer attributes of the dyads and the experience and its members. If so, another question is whether those inferences are correct or not. For instance, synchrony has been shown to promote performance, group belonging, and so forth. Are lay beliefs in line with those effects (i.e., is perceived synchrony expected to have the same positive effects that synchrony actually produces)? In asking this question, we position our work within a broader universe of research where experience is compared with lay beliefs. Just to give a few examples: (1) In affective forecasting studies (Wilson & Gilbert, Reference Wilson and Gilbert2005), forecasters (i.e., people imagining what it would be like to experience something) think they would be much happier (or sadder) if they won the lottery (or became paraplegic) than actually happens. (2) In work by Epley and Schroeder (Reference Epley and Schroeder2014), people mispredict they would be happier if they made a public transportation trip alone than if they sat next to someone and interacted with them, but actual results show that experience tends to be more positive in the latter case. (3) In recent research more related to the attribute under study here (perceived competence), workers believe that if they are monitored more frequently, they will make a better impression on their supervisor, but in reality, the opposite holds (Vaz et al., Reference Vaz, Mata and Critcher2025). Thus, lay beliefs about psychology sometimes diverge from reality, which raises the question: If people pick up on perceived synchrony as a cue to make inferences about the dyad, are those inferences in line with what research shows about the effects of experienced synchrony?
In summary, the primary goal of the current research is, therefore, to examine whether the relationships observed by Marques-Quinteiro et al. (Reference Marques-Quinteiro, Mata, Simão, Gaspar and Farias2019) between perceived interpersonal synchrony, collective efficacy, and affiliation intentions also hold for stimuli presented in a naturalistic setting where interpersonal synchrony is a naturally varying cue among others, rather than in a (purposefully) artificial setting where interpersonal synchrony is isolated and experimentally manipulated. We anticipated that the extent to which dyads are perceived as synchronous would be positively correlated with (1) bystanders’ estimations of the dyads’ ability to work well together on a collaborative task and (2) the extent to which bystanders will be willing to affiliate with the dyads (Hu et al., Reference Hu, Cheng, Pan and Hu2022; Macpherson et al., Reference Macpherson, Fay and Miles2020; Marques-Quinteiro et al., Reference Marques-Quinteiro, Mata, Simão, Gaspar and Farias2019). Based on a fixed-effect internal meta-analysis of the four experiments conducted by Marques-Quinteiro et al. (Reference Marques-Quinteiro, Mata, Simão, Gaspar and Farias2019), we expect small-to-moderate within-dyad associations between interpersonal synchrony, collective efficacy, and affiliation intentions, with effect sizes ranging from r = .09 to r = .28. Specifically, we hypothesized the following:
Hypothesis 1: Bystanders’ perceptions of dyads’ interpersonal synchrony are positively correlated with observers’ estimations of dyads’ collective efficacy.
Hypothesis 2: Bystanders’ perceptions of dyads’ interpersonal synchrony are positively correlated with observers’ affiliation intention toward dyads.
Hypothesis 3: Bystanders’ perceptions of dyads’ collective efficacy are positively correlated with observers’ affiliation intention toward dyads.
Additionally, in the present studies, we test two novel hypotheses: First, in Studies 1 and 2, we explored whether the dyads’ performance at the TV show correlates with observers’ estimations of dyads’ interpersonal synchrony, collective efficacy, and their affiliation intention toward dyads. Thus, this study tested whether the perception of synchrony or the beliefs that it promotes would have relevant consequences for social agents (both the dyad members and those observing them)—that is, it tested whether perceived synchrony is a cue that people believe to predict success in collective endeavors. Second, in Study 2, we tested whether perceived synchrony affects an entirely different dimension of social perception: warmth (i.e., how much observers like the synchronous dyad members).
Study 1
Method
Participants
Sample size was determined following recommendations by Bakdash and Marusich (Reference Bakdash and Marusich2017) concerning the adequate sample size for repeated-measures correlation studies and following the correlations reported in Marques-Quinteiro et al. (Reference Marques-Quinteiro, Mata, Simão, Gaspar and Farias2019). For a medium effect size, with an r = .28, 15 observations per research participant, and 80% power, approximately 20 participants are required. In this study, we used a convenience sample of 22 Portuguese psychology students, who enrolled in the study in return for course credit. Seventy-seven percent of the participants had professional experience, 82% of the participants were female, and their ages ranged from 21 to 55 years (M = 32.27; SD = 10.73). No data analysis was performed prior to the completion of data collection.
Procedure
Participants were informed that the study was about human interactions. Participants were presented 15 videos, showing pairs of real dyads walking side-by-side during the TV show Shark Tank. Each participant saw the 15 videos, and the display order was fully randomized across participants. After each video, participants were asked about interpersonal synchrony, collective efficacy, and affiliation intentions. This was repeated 15 times, once after each video, thus rendering 330 observations. We report all measures, manipulations, and participants’ exclusions for all studies. The research protocol for this study was pre-approved by the first author’s former institution under Ethical Approval Number I/027/11/2019.
Materials
Perceived interpersonal synchrony. Four items were selected from Lakens and Stel (Reference Lakens and Stel2011): “these people were aware of each other presence while walking,” “these people felt connected while walking,” “these people felt the same while walking,” and “these people felt as if they belong together.” Responses were given on a scale from 1 (totally disagree) to 5 (totally agree). Internal consistency was assessed using both Cronbach’s alpha and McDonald’s omega total. Omega was computed using the SPSS macro developed by Hayes and Coutts (Reference Hayes and Coutts2020) for single-factor variables, based on principal axis factoring. This provided a more robust estimate of reliability by accounting for the strength of factor loadings among items (α t1–t15 ≥ .63; Ω t1–t15 ≥ .73; see Table 1).
Statistical descriptives and internal consistency using Cronbach’s alpha and McDonald’s omega total

Collective efficacy. Three items were used, adapted from Jex and Bliese (Reference Jex and Bliese1999): “On a scale of 1 to 5, where 1 means ‘very badly’ and 5 means ‘very well’, how would you expect these two people to work together,” “On a scale of 1 to 5, where 1 means ‘totally ineffective’ and 5 means ‘totally effective’, how effective would you expect these people to be at working together,” and “On a scale of 1 to 5, where 1 means ‘totally disagree’ and 5 means ‘totally agree’, please say to what extent to you agree that, together, these people can achieve more than if separated” (Cronbach α t1–t15 ≥ .81; Ω t1–t15 ≥ .78; see Table 1).
Affiliation intention. One item was created to be used: “On a scale of 1 to 5, where 1 means ‘very unlikely’ and 5 means ‘very likely’, if the two people you saw in the video invited you to join them to manage a business, how likely would you be to accept their invitation?”
Dyad performance. The goals of the TV show include that (a) entrepreneurs and business owners persuade at least one business investor to invest in the dyads’ business (or business idea), and that (b) entrepreneurs and business owners accept at least one business offer that is made to them. Hence, dyad performance was operationalized as the dyad receiving (coded as “1”) versus not receiving a business offer (coded as “0”), the number of offers received (ranging between “0” and “5”), and the dyad accepting (coded as “1”) versus not accepting (coded as “0”) a business offer.
Videos. The videos used in this study were retrieved online from publicly available videos from the TV show Shark Tank, where people pitch their business ideas in search for potential investors. The videos were muted, lasted between 5 and 15 seconds, and all references to brands or labels were removed. The camera images across videos were not standardized, and different videos could show dyads from different angles (e.g., front camera, side camera, and back camera). The study participants did not see any footage beyond the corridor, nor were they informed of the outcome of the dyads’ business idea presentation. Regarding the composition of the dyads, there were 10 male dyads and 5 male–female dyads. Their age was unknown. The order of the 15 videos was randomized across participants to mitigate potential order effects and stimulus-specific confounds. This procedure aligns with recommendations for treating stimuli as random factors in repeated-measures designs (e.g., Westfall et al., Reference Westfall, Kenny and Judd2014). Finally, while 15 participants reported recognizing the reality TV show in which the dyads appeared, all participants indicated that they did not personally know any of the individuals depicted.
Design
The study design was a within-subjects repeated-measures design, where the order of the stimuli materials display was fully randomized. No experimental manipulations were performed (the goal was to assess whether people pick up on natural variations in synchrony, and whether those subtle variations affect their judgments).
Analysis
Hypotheses were tested using the R package rmcorr for repeated-measures correlation analysis (Bakdash & Marusich, Reference Bakdash and Marusich2017). This method is specifically designed to account for the non-independence of repeated observations within individuals. Unlike traditional Pearson correlations, repeated-measures correlation estimates the common within-person association between two variables across time points, while statistically adjusting for inter-individual differences using an ANCOVA framework. It does so by fitting parallel regression lines (identical slopes but varying intercepts) for each participant, thereby isolating the within-subject relationship of interest. The resulting coefficient, r_rm, reflects the strength and direction of this intra-individual association and can be interpreted similarly to a Pearson correlation coefficient (r) as an effect size.
The use of repeated-measures correlation is well suited to our study design, as it captures within-dyad associations across multiple time points while controlling for between-dyad variability. Although r_rm is derived from a different statistical model than Pearson’s r, it can be interpreted analogously as an effect size. To provide a meaningful benchmark for interpreting the observed correlations, we drew on findings from a prior fixed-effects meta-analysis of four studies using similar variables and procedures. That analysis yielded average correlations ranging from r = .09 to r = .28, with the strongest association observed for perceived synchrony (r = .28). These values informed our expectations and serve as reference points for evaluating the strength of effects in the present study.
For details on the preliminary assumption tests concerning our data, see the Appendix.
Results
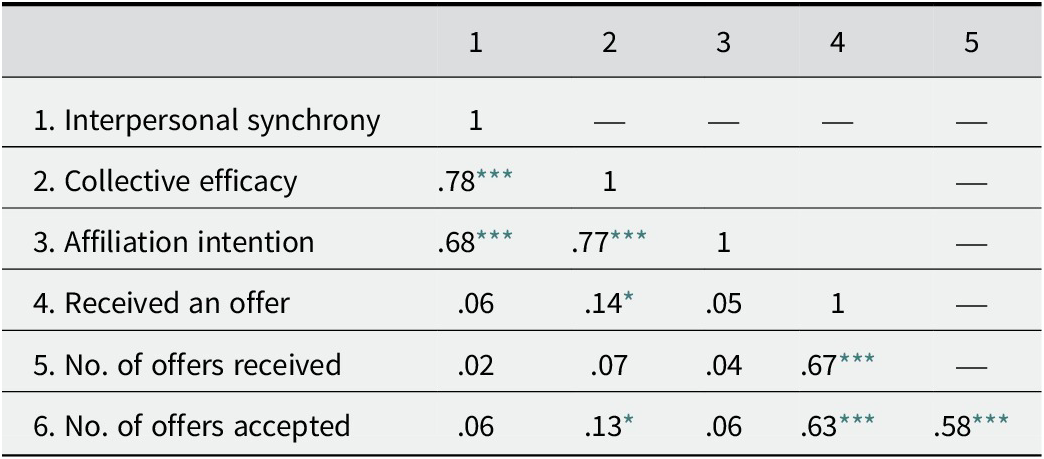
Table 2 shows the repeated-measures correlations for the research variables. The perceptions of dyads’ interpersonal synchrony correlated positively with estimations of dyads’ collective efficacy, r = .78, p < .001, 95% CI [0.737, 0.824], as well as with their affiliation intention toward dyads, r = .68, p < .001, 95% CI [0.611, 0.733]. Bystanders’ estimations of dyads’ collective efficacy also correlated positively with affiliation intention toward dyads, r = .77, p < .001, 95% CI [0.718, 0.810]. These findings support Hypotheses 1–3.
Repeated-measures correlations for the research variables in Study 1

Note: Received an offer was coded as “yes” (1) or “no” (0). Dyad performance was operationalized as the dyad receiving (coded as “1”) versus not receiving (coded as “0”) a business offer, the number of offers received (ranging between “0” and “5”), and the dyad accepting (coded as “1”) versus not accepting (coded as “0”) a business offer.
* p < .05.
*** p < .001.
Moreover, we examined whether bystanders’ responses correlated with dyads’ performance at the TV show. The results suggested that observers’ perceptions of dyads’ interpersonal synchrony, r ≤ .06, p > .05, 95% CI [≤−0.048, ≥0.134], and affiliation intentions, r ≤ .06, p > .05, 95% CI [≤−0.049, ≥0.164], were uncorrelated with dyads’ accepting and receiving an offer, and the number of offers received. Interestingly, however, observers’ perceptions of dyads’ collective efficacy were positively correlated with dyads’ accepting, r = .13, p = .021, 95% CI [0.019, 0.239], and receiving, r = .14, p = .014, 95% CI [0.028, 0.247], an offer.
Discussion
Study 1 aimed to replicate previous findings from Marques-Quinteiro et al. (Reference Marques-Quinteiro, Mata, Simão, Gaspar and Farias2019) in a naturalistic setting. As hypothesized, the results suggest that a change in interpersonal synchrony is positively correlated with a change in collective efficacy and affiliation intentions. These findings suggest that even when interpersonal synchrony is presented as a subtle clue, it can still be implicitly picked up by subjects.
Study 2
We conducted a second study that aimed to replicate the results from Study 1 with a larger sample: The sample size recruited in Study 2 is over five times as larger as that of Study 1, which affords more statistical power to test the same hypotheses as in Study 1, as well as a new hypothesis concerning likability.
Assessing the relationship between perceived synchrony and likability is relevant for different motives. First, it tests for potential outcomes that are conceptually more distal from the independent variable. Outcomes such as collective efficacy and affiliation intention are (a) more closely related to perceived synchrony (i.e., if one perceives the dyad as synchronous, then it might make sense to infer that these people would work well together, and to want to join their business), and (b) both related to competence. However, competence is only one dimension of social perception. Moreover, this conceptual overlap might raise concerns about common method variance (CMV; Podsakoff et al., Reference Podsakoff, Podsakoff, Williams, Huang and Yang2024). To (a) assuage such methodological concerns and (b) test for effects on fundamentally different dimensions, Study 2 assessed the relationship between perceived synchrony and likeability.
Likeability, or warmth, is another fundamental dimension of social perception in the influential Big Two model of social cognition (Cuddy et al., Reference Cuddy, Fiske and Glick2008; Fiske et al., Reference Fiske, Cuddy and Glick2007), and thus we test the two fundamental dimensions of social perception: competence and warmth (with some authors arguing that warmth is even more important/fundamental than competence in social decision-making; Eisenbruch & Krasnow, Reference Eisenbruch and Krasnow2022). In the context of the current research, this implies that we are looking at the relationship between perceptions of interpersonal synchrony and two fundamental criteria for the establishment of cooperation in humans: competence and warmth; therefore, the current research contributes to further clarifying the importance that interpersonal synchrony plays in shaping human (pro)sociality. As an example, recent work explored how the body posture affects interpersonal perception of dyad members in a similar Big Two analysis (i.e., dyad members assessed themselves and their dyadic partner with regard to both competence and warmth; Abele & Yzerbyt, Reference Abele and Yzerbyt2021), but that work did not study either synchrony or perception by extra-dyadic observers. Thus, this is yet another contribution of the present work: to test for the first time the effects of synchrony on perceived warmth. Finally, it is important to note that these dimensions (competence and warmth) have been shown to be orthogonal (Cuddy et al., Reference Cuddy, Fiske and Glick2008; Fiske et al., Reference Fiske, Cuddy and Glick2007), which also serves to mitigate concerns about CMV (Podsakoff et al., Reference Podsakoff, Podsakoff, Williams, Huang and Yang2024).
Method
The research procedure, design, and analysis were the same as in Study 1.
Participants
In the current study, we collected a convenience sample of 116 Psychology students from a psychology course in Portugal, who enrolled in the study in return for course credit. Eighty-five percent of the participants were female, and their ages ranged from 18 to 66 years (M = 23.63; SD = 9.29). No further demographic information was collected, and no data analysis was performed prior to the completion of data collection.
Materials
In Study 2, perceived interpersonal synchrony, dyad performance, and videos were the same as in Study 1. Collective efficacy and affiliation intentions were measured using a single item each (collective efficacy: “On a scale of 1 to 5, where 1 means ‘totally ineffective’ and 5 means ‘totally effective’, how effective would you expect these people to be at working together?”; affiliation intentions: “On a scale of 1 to 5, where 1 means ‘very unlikely’ and 5 means ‘very likely’, if the two people you saw in the video invited you to join them to manage a business, how likely would you be to accept their invitation?”).
Likability. Likability was measured using the 11 items of the Reysen likability scale (Reysen, Reference Reysen2005), using a Likert-type scale ranging from 1 (“totally disagree”) to 5 (“totally agree”). A sample item is “These people are friendly.” (Cronbach α t1–t15 ≥ .88; Ω t1–t15 ≥ .87; see Table 1).
Results
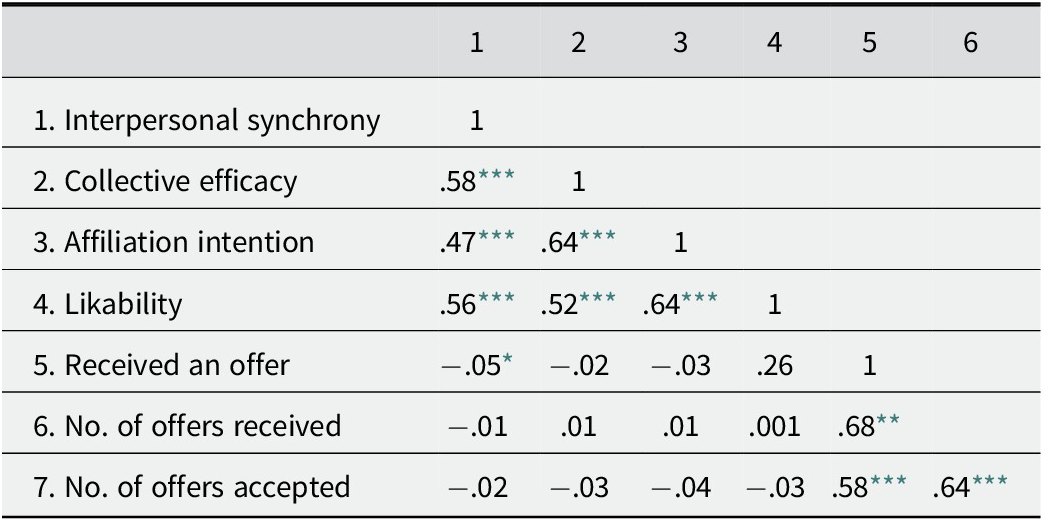
Table 3 shows the repeated-measures correlations for the research variables. The perceptions of dyads’ interpersonal synchrony correlated positively with estimations of dyads’ collective efficacy, r = .58, p < .001, 95% CI [0.551, 0.615], affiliation intentions, r = .47, p < .001, 95% CI [0.429, 0.504], and likability, r = .56, p < .001, 95% CI [0.529, 0.596]. The results also suggest that likability was positively correlated with collective efficacy, r = .52, p < .001, 95% CI [0.479, 0.550], and affiliation intentions, r = .64, p < .001, 95% CI [0.609, 0.667]. Additionally, and different from Study 1, the results suggest that observers’ perceptions of dyads’ interpersonal synchrony were negatively correlated with the extent to which dyads received an offer, r = −.05, p = .036, 95% CI [−0.100, −0.003].
Repeated-measures correlations for the research variables in Study 2

Note. Received an offer was coded as “yes” (1) or “no” (0). Dyad performance was operationalized as the dyad receiving (coded as “1”) versus not receiving (coded as “0”) a business offer, the number of offers received (ranging between “0” and “5”), and the dyad accepting (coded as “1”) versus not accepting (coded as “0”) a business offer.
* p < .05.
** p < .01.
*** p < .001.
Although the results of the repeated-measures correlations involving dyads’ performance were distinct from the results found in Study 1, the remaining findings further replicate and extend what had been previously reported, and in so doing, they offer additional strength to the relationship between interpersonal synchrony, collective efficacy, affiliation intentions, and likability.
General Discussion
The current research examined how bystanders’ perceptions of dyads’ interpersonal synchrony shape bystanders’ estimations of dyad collective efficacy, their intention to affiliate with dyads (Studies 1 and 2), and the likability of dyad members (Study 2). Our findings suggest a positive association between bystanders’ perceptions of interpersonal synchrony, collective efficacy, affiliation intentions, and likability. Across two studies, the results supported the prediction that interpersonal synchrony influences how external observers think and feel about dyads in a real setting.
The outcomes of this research replicate and extend the research findings reported in Marques-Quinteiro et al. (Reference Marques-Quinteiro, Mata, Simão, Gaspar and Farias2019), but they do so in a naturalistic setting where the synchrony in dyads’ movements was a much subtler cue, which was harder to perceive and competed with other factors such as the age, gender, ethnicity, and confidence (among other features) of the members of the dyads. In a time where social psychology has been criticized for underutilizing studies in naturally occurring settings (Baumeister et al., Reference Baumeister, Vohs and Funder2007; Cialdini, Reference Cialdini2009), it is worth noting that this study goes beyond laboratorial settings (with debatable ecological validity) to provide additional support to the general claim that interpersonal synchrony plays a fundamental part in the promotion of sociality and cooperation in human beings. Moreover, it also shows that its effects extend to the dyads’ proximate social-physical context.
Moreover, Study 1’s results also provide the first evidence that observers’ perceptions of dyads’ attributes before they perform a collaborative task (i.e., pitching a business idea and obtaining funding) is correlated with the outcome of that task (e.g., whether their pitch is met with a satisfactory investment offer). However, this result did not replicate in Study 2, and therefore future research should further explore the possibility that perceived synchrony (or at least other proximal cues that it predicts) influences observers’ judgments and consequential behavior toward the dyads, and not merely beliefs and attitudes about them. We suspect that one simple reason why these effects were not consistent is that we tested for the relationship between the performance of dyad members and the perceptions of how synchronous those members were at the eyes of people other than the ones who judged their performance: The data on perceived synchrony and investment decision came from different people. Had both types of data been collected from the same participants, a more robust effect might be observed.
In Study 2, we found evidence (this time clearer evidence, supported by robust correlations) of yet another novel finding: perceived synchrony predicts the likability of the dyad. This extends previous research on the effects of perceived synchrony to a quite distinct but equally fundamental dimension of social perception: warmth (Cuddy et al., Reference Cuddy, Fiske and Glick2008; Fiske et al., Reference Fiske, Cuddy and Glick2007). Thus, it is not merely that people judge synchronous teams as competent; they also see them as likeable. This suggests that the effects of perceived synchrony stretch beyond proximal inferences about how team members might work together; they also inspire affective reactions in those who observe them.
Previous research suggested that “through nonverbal behaviors that subtly communicate warmth and competence information, people can manage the impressions they make on colleagues, potential employers, and possible investors” (Cuddy et al., Reference Cuddy, Wilmuth, Yap and Carney2015). The present results suggests that synchrony is one such cue.
Limitations and Future Directions
There are at least four main limitations that we identify in our research, which can be addressed in future studies. First, possible relevant characteristics of the research participants, such as age or gender, as well as salient features of dyads’ members like ethnicity, gender, and status cues (e.g., clothing), were not controlled. Considering previous research showing that research participants might pick up on irrelevant cues that bias perceptions of interpersonal synchrony (Macpherson et al., Reference Macpherson, Fay and Miles2020), future extensions of our work could explore ways to investigate how such characteristics influence the temporal relationship between the variables investigated here. The second limitation regards the fact that all the research participants were Caucasians and from a single nationality, which limits the generalizability of our findings to a very specific population. Therefore, we encourage future studies that can look into how interpersonal synchrony is perceived across different ethnicities and cultures.
Third, the correlational design precludes us from making causal effect inferences that could determine the direction of the effects (although the experimental treatments implemented by Marques-Quinteiro et al., Reference Marques-Quinteiro, Mata, Simão, Gaspar and Farias2019, provide clearer evidence in this respect). Furthermore, this design raises concerns about the risk of CMV, which can artificially inflate observed correlations. We took several steps to minimize this risk following recommendations by Podsakoff et al. (Reference Podsakoff, Podsakoff, Williams, Huang and Yang2024) and Jordan and Troth (Reference Jordan and Troth2020): specifically, we enhanced item clarity through simple, concise language, varied response scale anchors to reduce shared scale properties, and introduced a short temporal gap between video stimuli and response items. Additionally, participants evaluated dyads rather than themselves, reducing the likelihood of self-report biases such as social desirability or implicit theories. The study also preserved participant anonymity and fully randomized the order of video presentation to control order effects. However, due to time constraints and practical considerations, we were unable to randomize the order of scale items or introduce distractor tasks between evaluations, both of which could have further reduced CMV. Future studies may benefit from incorporating these additional procedural remedies to more comprehensively control for method bias. Still, we note two further aspects in our methods that assuage potential concerns about CMV: (1) the investment decisions were made by people different from our study participants, and (2) Study 2 tested effects on a fundamentally different dimension: warmth.
Finally, a fourth limitation concerns the measurement of collective efficacy. Although the items demonstrated good internal consistency, the scale was slightly adapted for the purposes of this research. While the practice of adapting validated instruments is not uncommon in social psychology, it nonetheless raises legitimate concerns regarding the comparability of findings across studies and the preservation of construct validity. Future research would benefit from replicating these results with the original items, or by undertaking additional validation procedures of the adapted scale to ensure the robustness and generalizability of the conclusions.
Conclusion
The findings from the two studies presented here reinforce the relevance of perceived interpersonal synchrony as a powerful social signal that shapes third-party perceptions of human dyads in naturalistic contexts. The evidence suggests that perceived synchrony influences not only beliefs about dyads’ collective efficacy, affiliation intentions, and likability, but also affect toward the dyad members, as well as (though less conclusively) collaborative success in real tasks. This research contributes to a growing body of literature that positions interpersonal synchrony as a powerful cue in social cognition, while also highlighting the importance of examining this phenomenon in ecologically valid and socially complex settings.
Despite the limitations identified, this work demonstrates that subtle nonverbal behaviors such as interpersonal synchrony can be studied meaningfully in real-world environments without compromising analytical rigor. Together, these studies extend our understanding of the social consequences of synchrony and open the door to future research using experimental, cross-cultural, and multi-method approaches to deepen our knowledge of how coordinated behavior shapes emergent social cognition.
Data availability statement
Data and video stimuli are available from the corresponding author upon reasonable request.
Author contribution
Conceptualization: P.M.-Q.; Data curation: P.M.-Q.; Formal analysis: P.M.-Q.; Methodology: P.M.-Q.; Resources: P.M.-Q., A.R.F.; Software: A.R.F.; Writing—original draft: P.M.-Q., A.M.; Writing—review and editing: all authors.
Funding statement
This work is supported by national funds through the FCT—Portuguese Foundation for Science and Technology under project UIDB/04011/2020 (https://doi.org/10.54499/UIDB/04011/2020). It was also funded by Fundação para a Ciência e Tecnologia (FCT) under HEI-Lab R&D Unit UIDB/05380/2020 (https://doi.org/10.54499/UIDB/05380/2020).
Competing interests
The authors declare no competing interests.
Appendix: Tests of Preliminary Assumptions
Study 1
The first step in our analytical procedure was to determine if there was any statistically significant variability in participants’ responses over time. This analysis was performed using a within-subjects, repeated-measures analysis of variance (ANOVA). The findings reported in Table A1 pertain to the outcomes of the Shapiro–Wilk test for the dependent variables. It was used to determine whether the variables under investigation have a normal distribution (Razali & Wah, Reference Razali and Wah2011). The findings suggest that interpersonal synchrony was normally distributed for every measurement, Shapiro–Wilk (22) ≥ .89, p ≥ .068, except at Time 11, Shapiro–Wilk (22) = .89, p = .016. Similarly, collective efficacy was normally distributed for every measurement, Shapiro–Wilk (22) ≥ .91, p ≥ .050, except at Time 1, Shapiro–Wilk (22) = .79, p < .001, Time 5, Shapiro–Wilk (22) = .89, p = .021, and Time 15, Shapiro–Wilk (22) = .91, p = 040. Finally, the findings suggest that affiliation intentions were not normally distributed for every measurement that was done, Shapiro–Wilk (22) ≤ .91, p ≤ .020, except at Time 10, Shapiro–Wilk (22) = .91, p = .052. Overall, these results suggest that while interpersonal synchrony and collective efficacy did not show a consistent violation of the normality assumption, affiliation intentions did. Nevertheless, Schmider et al. (Reference Schmider, Ziegler, Danay, Beyer and Buhner2010) found that the empirical type I error α and the empirical type II error β in the ANOVA remain identical even if the normalcy assumption is broken. Accordingly, any deviation from normality should not be viewed as detrimental because the ANOVA test is resilient to such deviations (Schmider et al., Reference Schmider, Ziegler, Danay, Beyer and Buhner2010). Therefore, and since the Levene test of homogeneity does not apply to within-subjects repeated-measures designs, we proceeded with the performing of the within-subjects repeated-measures ANOVA. The Mauchly Test of Sphericity revealed that the sphericity principle was violated for interpersonal synchrony, χ 2(104) = 157.61, p = .001, and affiliation intentions, χ 2(104) = 153.98, p = .003, but not for collective efficacy, χ 2(104) = 127.70, p = .100. Hence, the Greenhouse–Geisser correction was used for interpersonal synchrony and affiliation intentions (O’Brien & Kaiser, Reference O’Brien and Kaiser1985).
Shapiro–Wilk Normality Test

The outcome of the within-subjects repeated-measures ANOVA suggests that interpersonal synchrony, F (6.52, 150.89) = 5.62, p < .001, collective efficacy, F (14, 159.61) = 5.16, p < .001, and affiliation intentions, F (6.52, 131.20) = 5.61, p < .001, significantly changed over time. These results indicate that participants responded differently to the dependent variables based on the video stimuli presented.
Study 2
The first step in our analytical procedure was to determine if there was any statistically significant variability in participants responses over time, while controlling for possible covariates such as age and gender. This analysis was performed using a within-subjects, repeated-measures ANOVA. The Shapiro–Wilk test revealed that interpersonal synchrony was not normally distributed for every measurement that was done, Shapiro–Wilk (116) ≥ .96, p ≤ .047, except at Time 5, Shapiro–Wilk (116) = .99, p = .291, and Time 6, Shapiro–Wilk (116) = .98, p = .120. Similarly, collective efficacy, Shapiro–Wilk (116) ≥ .84, p < .001, and affiliation intentions, Shapiro–Wilk (116) ≥ .85, p < .001, were not normally distributed for every measurement that was done. Finally, the findings for likability were mixed as four measurements violated the normality assumption, Shapiro–Wilk (116) ≤ .98, p ≤ .045, against 11 measurements which did not, Shapiro–Wilk (116) ≥ .98, p ≥ .052.
Overall, these results suggest that while interpersonal synchrony and likability did not show a consistent violation of the normality assumption, collective efficacy and affiliation intentions did. Nevertheless, in line with our approach in Study 1, we proceeded with the performing of the within-subjects, repeated-measures ANOVA.
The Mauchly’s Test of Sphericity revealed that the sphericity principle was violated for interpersonal synchrony, χ 2(104) = 241.70, p < .001, collective efficacy, χ 2(104) = 174.53, p < .001, affiliation intentions, χ 2(104) = 205.39, p < .001, and likability, χ 2(104) = 222.54, p < .001, and therefore the Greenhouse–Geisser correction was used (O’Brien & Kaiser, Reference O’Brien and Kaiser1985).
The analysis suggests that interpersonal synchrony, F (10.62, 1221.13) = 16.24, p < .001, collective efficacy, F (11.32, 1302.88) = 21.78, p < .001, affiliation intentions, F (11.08, 1273.81) = 13.30, p < .001, and likability, F (10.85, 1247.98) = 21.96, p < .001, significantly changed over time.