





1. Introduction
Global warming implies melting of the world’s more than 200 000 glaciers outside the Greenland and Antarctic ice sheet (RGI Consortium, 2023), which amounted to 0.74 ± 0.04 mm sea level equivalent (SLE) per year during 2000–2019 (Hugonnet and others, Reference Hugonnet2021). Under future warming scenarios of 1.5∘C and 4∘C (corresponding approximately to Representative Concentration Pathways RCP2.6 and RCP8.5), estimates for SLE by the year 2100 and relative to 2015 range from 1.06 ± 0.3 mm a−1 to 1.81 ± 0.52 mm a−1 (Rounce and others, Reference Rounce2023), with similar values reported by Marzeion and others Reference Marzeion(2020). Such warmer futures may imply the complete disappearance of many glaciers in all regions. Recently, the Global Land Ice Measurements from Space (GLIMS) initiative has started highlighting already extinct glaciers (glims.org/MapsAndDocs/extinct_glaciers_guide.html), with first entries from central Europe, Canada and North America.
Measurements of front variations were among the first metrics employed to characterize glacier change (Forel, Reference Forel1895; Kasser, Reference Kasser1967) and continue to be highly relevant (Thorsteinsson and others, Reference Thorsteinsson, Abermann, Andreassen, Fierz and Huss2023). Firstly, because of the legacy in glacier length change, typically measured along a central flowline and ending at a glacier terminus. Such measurements comprise the main body of glacier change data collected since the initial phases of coordinated international glacier observations. Moreover, the temporal extensiveness and continuation of these datasets enable assessments of the representativeness of individual glacier mass-balance programs (Nussbaumer and others, Reference Nussbaumer, Hoelzle, Hüsler, Huggel, Salzmann and Zemp2017). Secondly, because remotely sensed glacier mass balance is not yet available at all regional or sub-regional to local scales. Thirdly, because frontal variation, displaying either glacier length change or more specific aspects of frontal changes, or both, is a concept that is intuitively comprehensible. When visualized, imagery of frontal variation can play a pivotal role in raising awareness among broad audiences for glaciers as sensitive climate indicators potentially facing widespread extinction and also for mountain regions and their ecosystems. Perhaps most importantly, however, is that assessing frontal variation using the approach by Paul and others (Reference Paul, Kääb, Maisch, Kellenberger and Haeberli2002, Reference Paul2013) adopted here also renders glacier outlines from which glacier area can be derived straightforwardly.
This provides a twofold opportunity: On the one hand, to continue and extend on traditional front variation investigations. Indeed, in Sweden, reports of glacier front variation date back to the work of Hamberg (Reference Hamberg1901, Reference Hamberg1908, Reference Hamberg1910) in the Sarek massif, at Mihkájiegna and Suottasjiegna. By 1951, investigations had broadened to include further seven glaciers in the Sarek and Kebnekaise massifs, as well as Sálajiegna in the Sulitelma massif (thus with a total of ten glaciers in the Swedish Front Variation Program, FVP). In the early 1960s, the International Commission on Snow and Ice issued a call encouraging every glacierized country of the world to increase glacier observations in both number and frequency (Ward, Reference Ward1961; Reference Ward1962; Glen, Reference Glen1963; Schytt and others, Reference Schytt, Jonsson and Cederstrand1963). In Sweden, this led to the initiation of front observations at additional ten glaciers by 1971, and later at Moarhmmáglaciären (in 1991) and at Kebnepakteglaciären (in 2022). Thus, 22 glaciers in total are now measured within the FVP (cf. Table 1), where measurements over time have been, and continue to be, conducted, by staff of Tarfala Research Station at Stockholm University. This provides motivation to determine the frontal variation of Swedish glaciers for the period 2017–2023. The starting year was chosen because of the release, in October 2016, of atmospherically corrected Sentinel-2 products, most suitable for the semi-automated procedure employed later in our analysis. Frontal variation was derived from combining Sentinel-2 imagery with the semi-automated mapping algorithm by Paul and others (Reference Paul, Kääb, Maisch, Kellenberger and Haeberli2002, Reference Paul2013) and the Margin Change Quantification Tool (MaQiT) (Lea, Reference Lea2018). For the 22 FVP glaciers, manual mapping was also performed, allowing for a comparison to the semi-automated mapping tool. Furthermore, frontal mapping accuracy was investigated by contrasting Sentinel-2-mapped fronts to fronts mapped in situ using Global Navigation Satellite System (GNSS), a total station (TS) and an uncrewed aerial vehicle (UAV) at four glaciers.
Swedish glaciers included in the Front Variation Program (FVP). A superscript R to the left of a glacier name indicates a reference-glacier, according to WGMS (2024). See Figure 1 for location

a Measurement/year; total number of measurements divided by the number of years since the reference year.
b Since 1967 or start year, if after 1967.
On the other hand, the frontal variation analysis presented the opportunity to provide updated glacier areas to existing databases. For instance, the Randolph Glacier Inventory (RGI) 7.0 (RGI Consortium, 2023) provides a comprehensive dataset of glacier outlines and derived glacier area with reference to their state around the year 2000. Specifically, it contains 3410 glacier outlines in its Scandinavia section (Section 08 in RGI 7.0 terminology), of which 270 are located entirely or partly in Sweden. However, the number of Swedish glaciers differs across inventories. The World Glacier Inventory (WGI) (WGMS and National Snow and Ice Data Centre, 2012) reports 303 glacier locations (identified at the latest in the year 2003), while 278 Swedish glacier locations can be sourced from WGMS (2024). There is a need for an updated national inventory of the current state of Swedish glaciers. In this study, we use Sentinel images to assess changes in glacier area and length, complementing recent similar work for Norwegian glaciers (Andreassen and others, Reference Andreassen, Elvehøy, Kjøllmoen and Belart2020, Reference Andreassen, Nagy, Kjøllmoen and Leigh2022).
2. Regional setting
Swedish glaciers are located along the mountain chain spanning across the Swedish-Norwegian border (Fig. 1). Sweden’s two northernmost glaciers are located in the Riksgränsen (Fig. 1e) area—Beaivvečohkka (at 68∘32′ N, 18∘19′ E) and Cunujökel (at 68∘34′ N, 18∘26′ E). Sweden’s southernmost glacier (Helagsglaciären) is located at 62∘54′ N, 12∘27′ E (Fig. 1h). The 22 FVP glaciers are located in northern Sweden: Seven glaciers are located in the Sarek region, thirteen in the wider Kebnekaise region, one in the Sulitelma region and one in the Riksgränsen-Abisko region (Fig. 1, Table 1).
(a) Location of Swedish glaciers. Map section corresponds to blue area on wider map of Sweden. Black squares labelled (b–h) indicate regions detailed in (b–h). The villages of Abisko, Hemavan, Kiruna and Östersund, as well as the location of Tarfala Research Station (TRS), are indicated for orientation (in yellow and orange text, respectively). (b–h) Details of the studied regions: (b) Kaitum, (c) Kebnekaise, (d) Sarek, (e) Riksgränsen-Abisko, (f) Sulitelma, (g) Vindelfjällen, (h) Helagsfjället. Glaciers are indicated as filled shapes. White shapes indicate semi-automatically sensed glaciers listed in RGI 7.0 (RGI Consortium, 2023), pink ones (in panels, b, c, f) those that were mapped in the same way but sourced from other inventories. Light blue shapes with IDs as in Zemp and others Reference Zemp, Gärtner-Roer, Nussbaumer, Welty, Dussaillant and Bannwart(2023) indicate glaciers from the FVP that were also manually mapped, dark blue shapes with these IDs indicate glaciers that were also observed in situ in the framework of this study. Background images for all panels from Google Earth, and DEM (50 m resolution) used for topography illustration and hillshading is from Lantmäteriet, geographical coordinates are WGS84 (ESPG:4326). Note that ‘north’ (indicated by a white arrow) and therefore also, coordinate markers, vary between panels.

Glaciers investigated in the framework of the FVP were revisited with varying frequency (Table 1). Measurement frequency has increased at Gorsajiekna, Reaiddá-, Västra Bossos-, Moarhmmá- and Kebnepakteglaciären, where frontal variation was assessed based on ground surveys and airborne photogrammetry at one or several instances during 2016–2023. With the launch of European Space Agency (ESA’s) multispectral Sentinel-2 mission in 2015 which provides satellite images at 10 m spatial resolution, glacier front observation is rendered comparatively easy as compared to previous in situ, ground-based investigations. The frontal positions of Storglaciären, Kebnepakteglaciären, Sydöstra Kaskasatjåkkaglaciären and Moarhmmáglaciären were mapped during the summer of 2022.
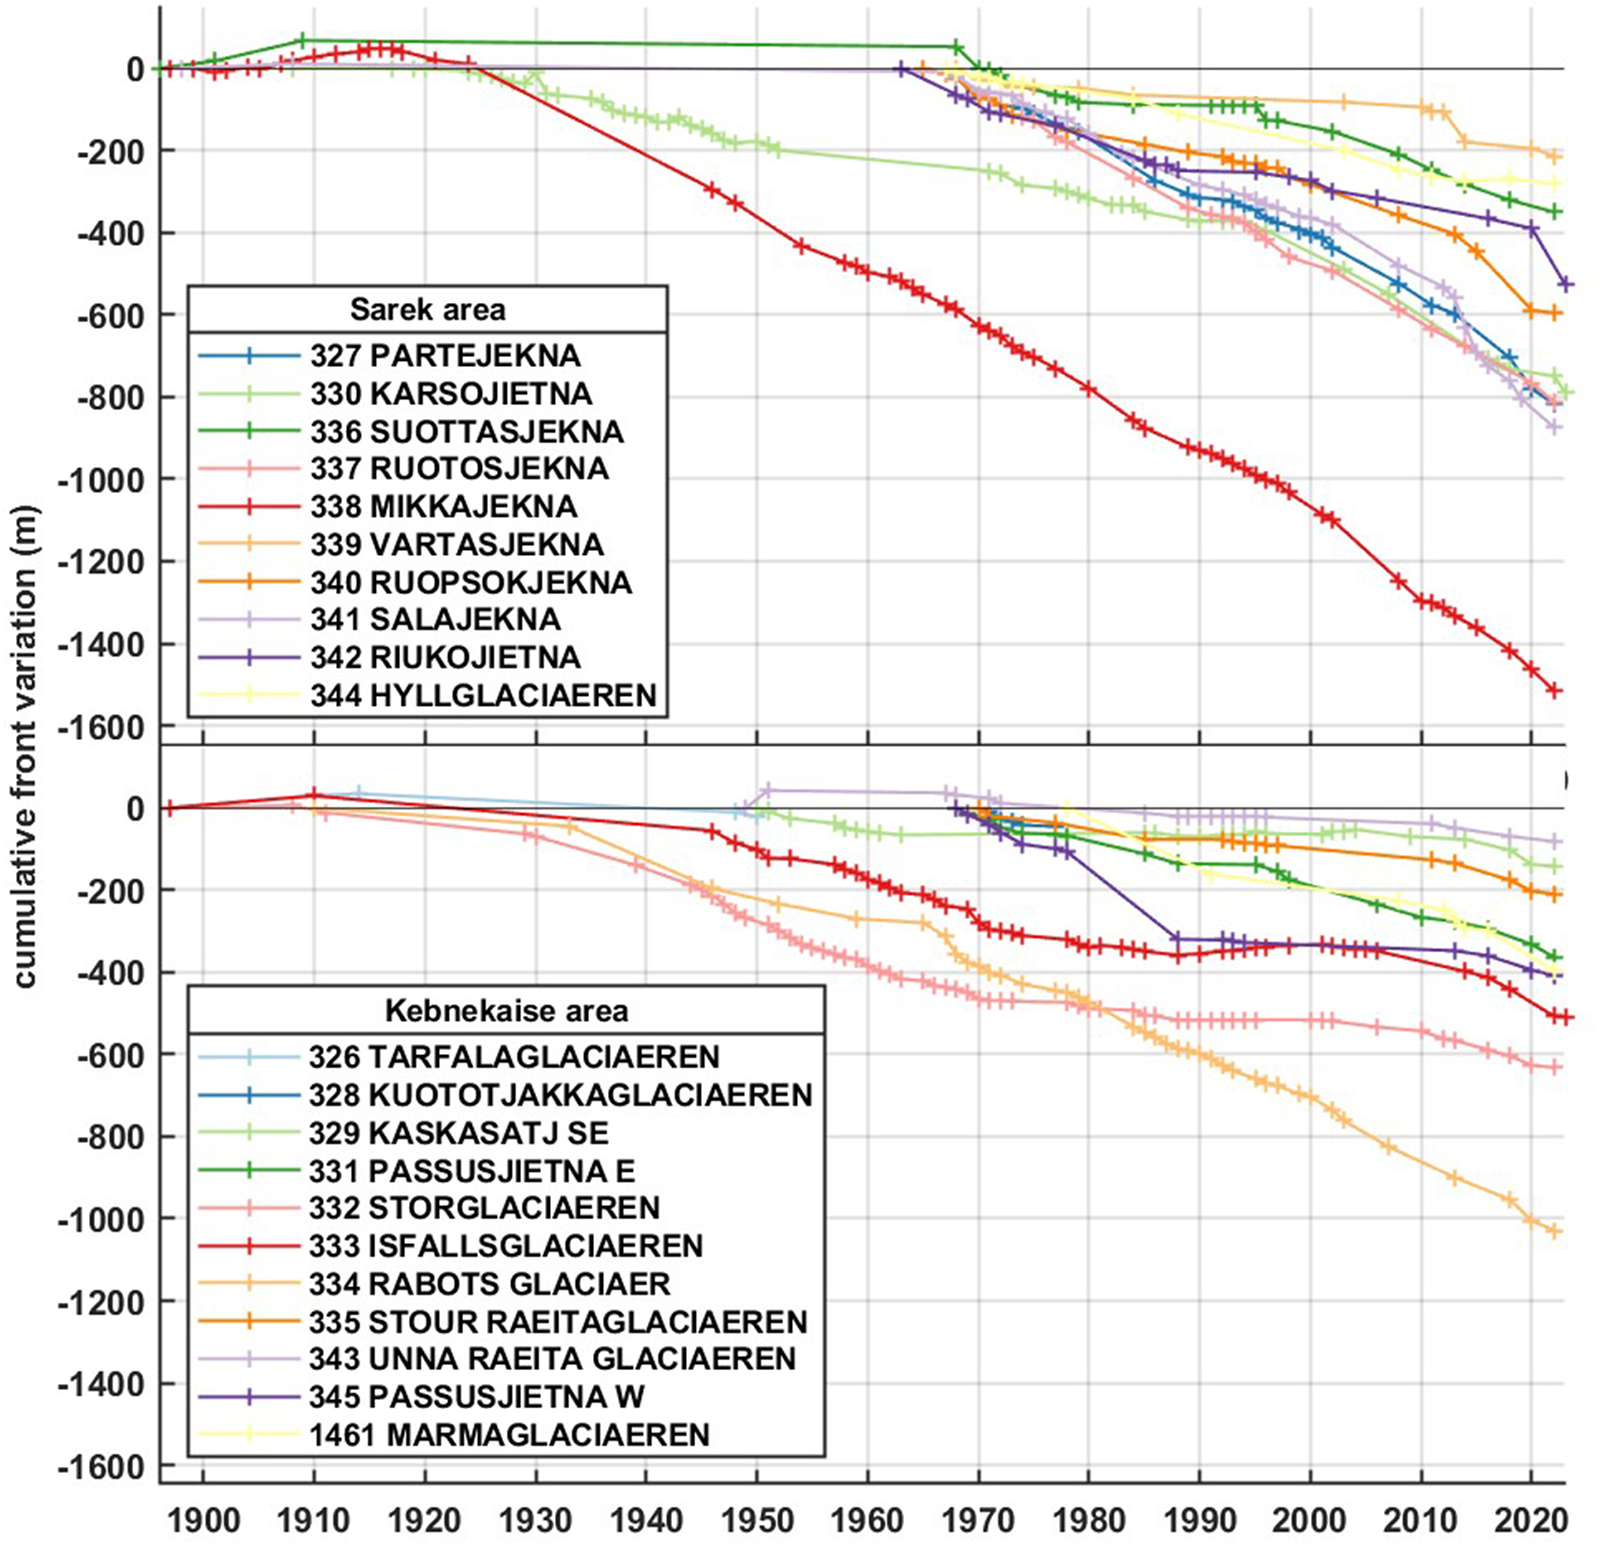
Over time, different methods were used to assess frontal variation (Schytt and others, Reference Schytt, Jonsson and Cederstrand1963; Schytt, Reference Schytt1964; Klingbjer, Reference Klingbjer2002), with measurements of the FVP glaciers reported to the Permanent Service on the Fluctuation of Glaciers, later embodied in the World Glacier Monitoring Service (wgms.ch) in Switzerland (Kasser, Reference Kasser1967). Including the most recent results from 2023, cumulative frontal variation for the Swedish FVP glaciers is visualized in Figure 2, sourced from WGMS (2024). Similarly, different methods were used over time to establish various Swedish glacier inventories, and with it, numbers of glaciers and glacierized area varied. For instance, Schytt Reference Schytt(1959) reports 237 Swedish glaciers with a combined area of 310 km2 based on aerial photography; Vilborg Reference Vilborg(1962) mentions 287 glaciers in Sweden during 1959–1961, with a combined area of 329 km2; Østrem and others Reference Østrem, Haakense and Melander(1973) specify 294 glaciers with a combined area of 314 km2. The RGI 7.0 (RGI Consortium, 2023) reports—as of the year 2002—270 Swedish glaciers with a combined area of ∼274 km2, while the study by Hamré Reference Hamré(2015) concludes at 265 Swedish glaciers as of the year 2008, with a combined area of 247 km2. The WGI and WGMS inventories (WGMS and National Snow and Ice Data Centre, 2012; WGMS, 2024) of Swedish glaciers (303 and 278 in number, respectively) do not provide glacier area.
Cumulative frontal variation until and including 2023. Top: Glaciers in the Sarek area, and three additional glaciers with IDs 330, 341, 342 (WGMS, 2024). Bottom: Glaciers in the Kebnekaise area. Glacier names as in WGMS (2024), cf. also Table 1. Note that Kebnepakteglaciären is not included, as it only became part of the Swedish FVP in 2022.
3. Materials and methods
3.1. Glacier inventories and glacier front variation data until and including 2023
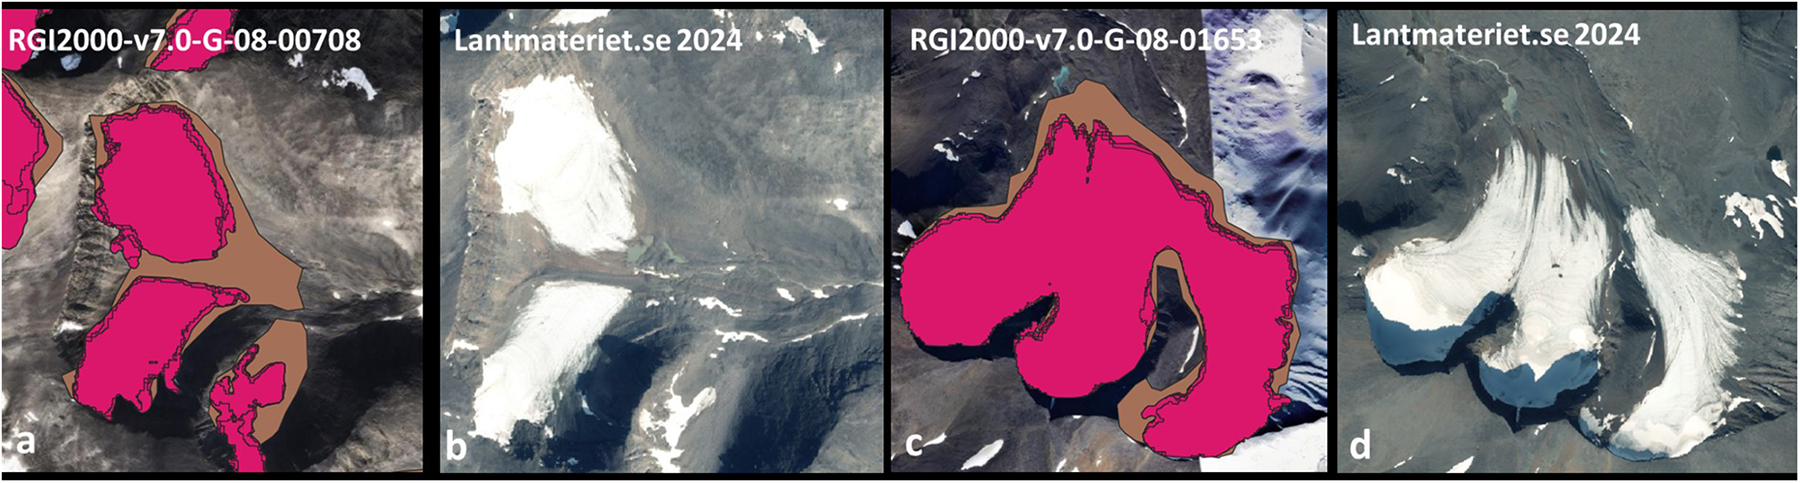
The first source to turn to for identification of Swedish glaciers was the Scandinavia-section of the RGI 7.0 (RGI Consortium, 2023). In this version, previously erroneous spatial referencing of some glacier outlines (cf. specifically submission 812Footnote 1) in the Kebnekaise area is corrected (Maussion and others, Reference Maussion2023). Counting glaciers located within (entirely or partly) Sweden, 270 glaciers (including the 22 FVP glaciers) were identified as Swedish by manual inspection from RGI 7.0 (RGI Consortium, 2023). However, an unnamed glacier in RGI Consortium (2023) (RGI2000-v7.0-G-08-00705, referred to as Östra Kallaktjåkka in Swedish) has split into two glaciers, rendering an updated number of 271 glaciers to be considered based on RGI Consortium (2023). Another glacier, Kuototjåkkaglaciären (one of the FVP glaciers, Table 1) is likely to split in the foreseeable future; however, currently, it is assessed to still be connected through debris-covered frontal ice (Fig. A1).
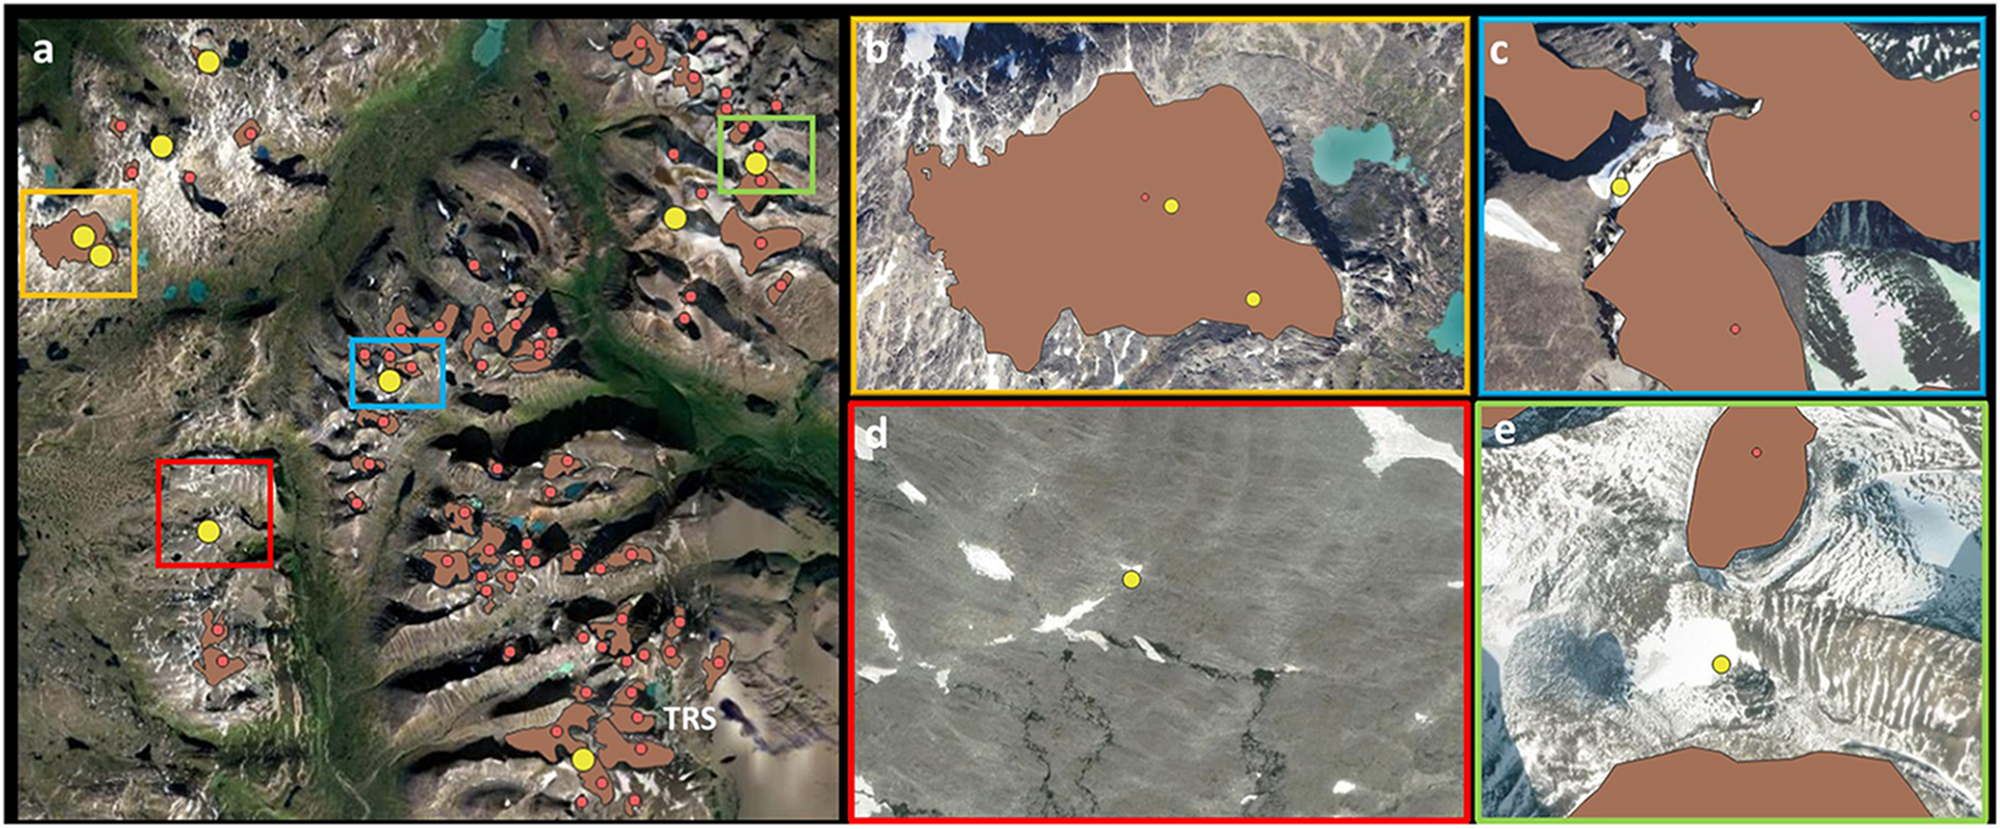
Furthermore, the WGI and WGMS inventories (WGMS and National Snow and Ice Data Centre, 2012; WGMS, 2024) were investigated with a focus on Swedish glaciers. Combining these inventories, a total of 60 Swedish glacier locations was identified which are not contained in RGI 7.0 (RGI Consortium, 2023). These 60 glacier locations were then inspected manually using satellite imagery provided by Google Earth (earth.google.com) and Lantmäteriet (lantmateriet.se). Among these locations, several were discarded as doublettes (multiple points on the same glacier), while others were discarded because the feature was not regarded a glacier any more based either on visual inspection of the satellite imagery or from in situ observations in the field (Fig. A2). At two locations, glaciers listed in the WGI and WGMS inventories (WGMS and National Snow and Ice Data Centre, 2012; WGMS, 2024) had split, rendering new glaciers to consider. In summary, at six locations, the features were assessed as representing glaciers and hence amended to the group of 271 glaciers from the RGI 7.0 (RGI Consortium, 2023), rendering a total of 277 glaciers to be analysed here (Table S1, Supplementary material).
Frontal variation data for Swedish FVP glaciers (Table 1) were retrieved from WGMS (2024). Data were visualized using Matlab R2024a and QGIS (qgis.org).
3.2. Sentinel-2 imagery and orthoimages
True colour, red (band 4), and shortwave infrared (SWIR, band 11) images from ESA’s Sentinel-2 mission, available at 10 m spatial resolution (except for band 11, available at 20 m spatial resolution), were manually downloaded from ESA (apps/sentinel-hub.co/eo-browser). For 2017–2023, and for each glacier, one image was chosen that fulfilled the following criteria: no cloud cover, minimum snow cover at the glacier terminus, image acquisition as late as possible during the melt season. Images from years where the glacier margins were partially snow covered were not excluded from the analysis, because a systematic approach was followed to handle glacier outlines mapped for these years (see below, Semi-automated and manual glacier centre line and glacier front delineation). Once longer time series of front and area variation emerge, this approach may be revised though without risking the dataset to become too sparse. The images were used to delineate glacier outlines and multi-centre lines and, eventually, frontal variation using MaQiT (cf. below). High-resolution orthophotos (0.48 m ground resolution, lantmateriet.se) acquired on 28 and 29 July 2018 (Table S2, Supplementary material) covering the FVP glaciers were used in analyses of mapping accuracy and planning of field surveys.
3.3. Semi-automated and manual glacier centre line and glacier front and outline delineation
Glacier centre lines were retrieved from the RGI 7.0 (RGI Consortium, 2023) and corrected manually when their inspection against Sentinel-2 true colour imagery for the years 2017–2023 suggested that modifications were necessary. For the seven additional Swedish glaciers included in this study, centre lines were not available and were thus digitized manually based on interpretation of orthophotos and digital elevation models (lantmateriet.se). The following approach was chosen to achieve as consistent and nonsubjective as possible delineations of glacier fronts across the large number of glaciers analysed here:
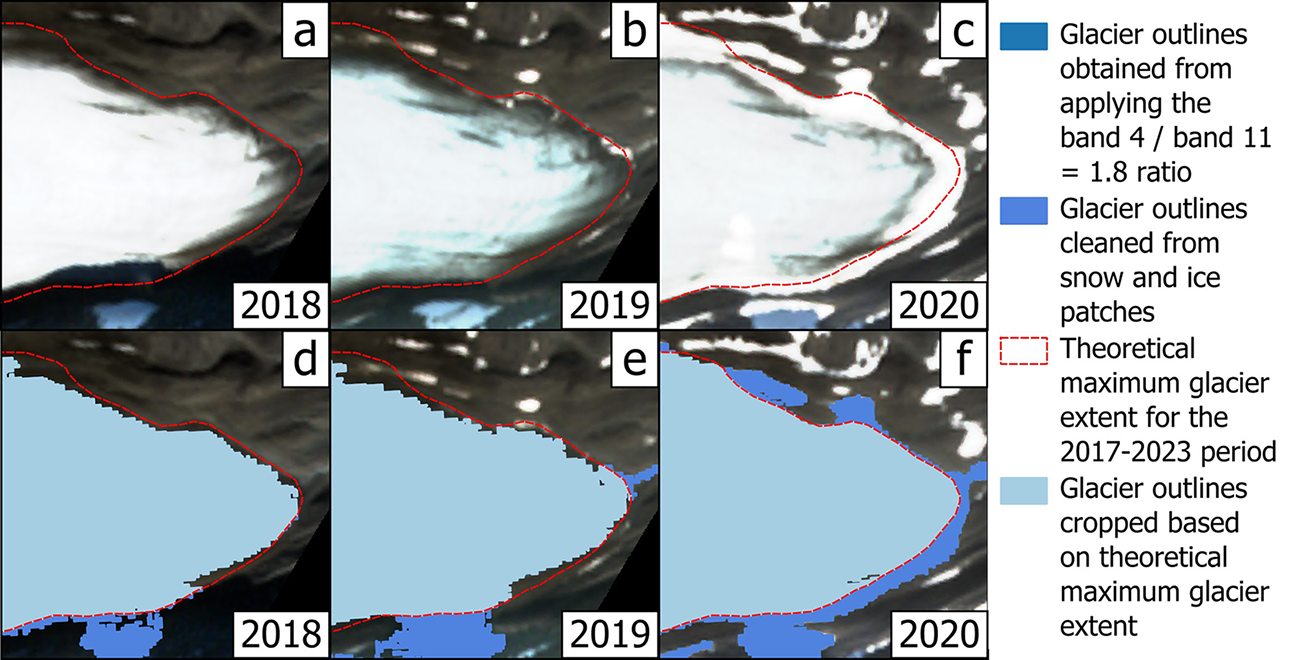
First, glacier outlines of all 277 Swedish glaciers were derived in the semi-automated process developed by Paul and others (Reference Paul, Kääb, Maisch, Kellenberger and Haeberli2002, Reference Paul2013), based on Sentinel-2 images for each year between and including 2017 and 2023 (Fig. A3). From the red (band 4, equivalent to Landsat TM band 3 used in Paul and others Reference Paul(2013)) and SWIR (band 11, equivalent to Landsat TM band 5 used in Paul and others Reference Paul(2013)) Sentinel-2 images, a raster file was generated in which each pixel was assigned the ratio of the corresponding red band pixel value to the SWIR band pixel value if this ratio was above a threshold value set to 1.8 (Paul and others, Reference Paul2013) and left blank otherwise. For Norwegian glaciers, this method has been applied using both Landsat (30 m resolution) and Sentinel images (10 m resolution) revealing uncertainties within 3% for overall glacier inventory, but for the smallest glaciers relative uncertainties can be larger (e.g. Andreassen and others (Reference Andreassen, Paul, Kääb and Hausberg2008, Reference Andreassen, Nagy, Kjøllmoen and Leigh2022)). This raster file was then converted into a shape file turning all pixel swarms into polygons. The polygons were then compared against glacier outlines in RGI 7.0 (Fig. A4, and RGI Consortium (2023)) which allowed the discriminating of polygons representing snow and ice surfaces that are not glaciers. This required some care with regard to snow surfaces adjacent to a glacier, especially in its accumulation area and in years where no snow-free images were available. Therefore, an outline was manually delineated following the surface of the first year with snow free images available (2017 or 2018, depending on the glaciers), but with an outward buffer of ca 10 m to avoid potential biasing towards too small glaciers surfaces. This outline was then used to crop the glacier polygons of the following years (Fig. 3). Moreover, water-terminating and debris-covered fronts were inspected manually and corrected based on true colour images in cases where water surfaces were incorrectly considered as glacier surfaces and debris-covered areas were incorrectly not considered as glacier surfaces. The so-derived glacier polygons were then converted in glacier outlines, from which glacier fronts were delineated manually in QGIS (qgis.org).
Example from Storglaciären, illustrating processing steps in the derivation of glacier outlines for selected years. Background image is from Sentinel-2 in all panels. (a) and (d) are ‘easy’ derivation, (b) and (e) are ‘moderately difficult derivation’, (c) and (f) are ‘difficult derivation’.
In addition, the 22 FVP glacier fronts were delineated manually for each year between and including 2017 and 2023 in QGIS (qgis.org), based on true colour images. This was done to conduct a comparison between the semi-automated process and the manual process for a subset of all Swedish glaciers.
3.4. Frontal variation calculations with the MaQiT
MaQiT (Lea, Reference Lea2018) was used to calculate frontal variation between successive years. MaQiT requires shape-files of the glacier fronts for each year, as well as a shapefile for the glacier’s centre line and n > 1 additional parallel lines to compute the variation (distance) between margins in successive years. Here, multi-centre lines were created (Fig. 4) based on the modified (see above) RGI 7.0 centre lines (RGI Consortium, 2023). The spacing of the multi-centre lines was set in MaQiT to 10 m, starting at the centre line and extending across the glacier width. The final number of multi-centre lines resulted from the decision (made by visual inspection of true colour Sentinel-2 imagery) which of the multi-centre lines is the last, on either side of the centre line, to be located on the glacier front.
(a) Schematic illustration of the multi-centreline method. Centre line (black, long dashed) and multi-centre lines (grey, solid) at Storglaciären, and change (here: retreat, yellow) of (dark red) frontal position f (with centreline position f0 and lateral margin positions f− and f+) to new (blue) frontal position g. Background is a 2018 airborne orthoimage of the Storglaciären terminus from the Land Survey of Sweden (lantmateriet.se). (b) Simplified illustration of Storglaciären’s 2018 front as manually digitized from the orthoimage (front labelled ‘O’) and the Sentinel-2 image (front labelled ‘S’), with ‘0, −, +’ denoting centre and margins as in (a). Stippled line is centre line, thin solid lines are multi-centre lines. (c) Example illustrating frontal mapping accuracy at Storglaciären, between front position as digitized from orthoimage (front ‘O’ in panel (b) and from the Sentinel-2 image (front ‘S’ in panel b), and along the front (from O− via O0 to O+, and S− via S0 to S+, respectively). Top panel: Directional mapping accuracy (overshooting or undershooting) with respect to the reference frontline ‘O’, at each multi-centre line, from MaQiT. Middle panel: As in top panel, but with outliers removed. Bottom panel: Mapping accuracy based on filtered data, of which then absolute (nondirectional, only containing information about magnitude) values are taken instead of directional accuracy.
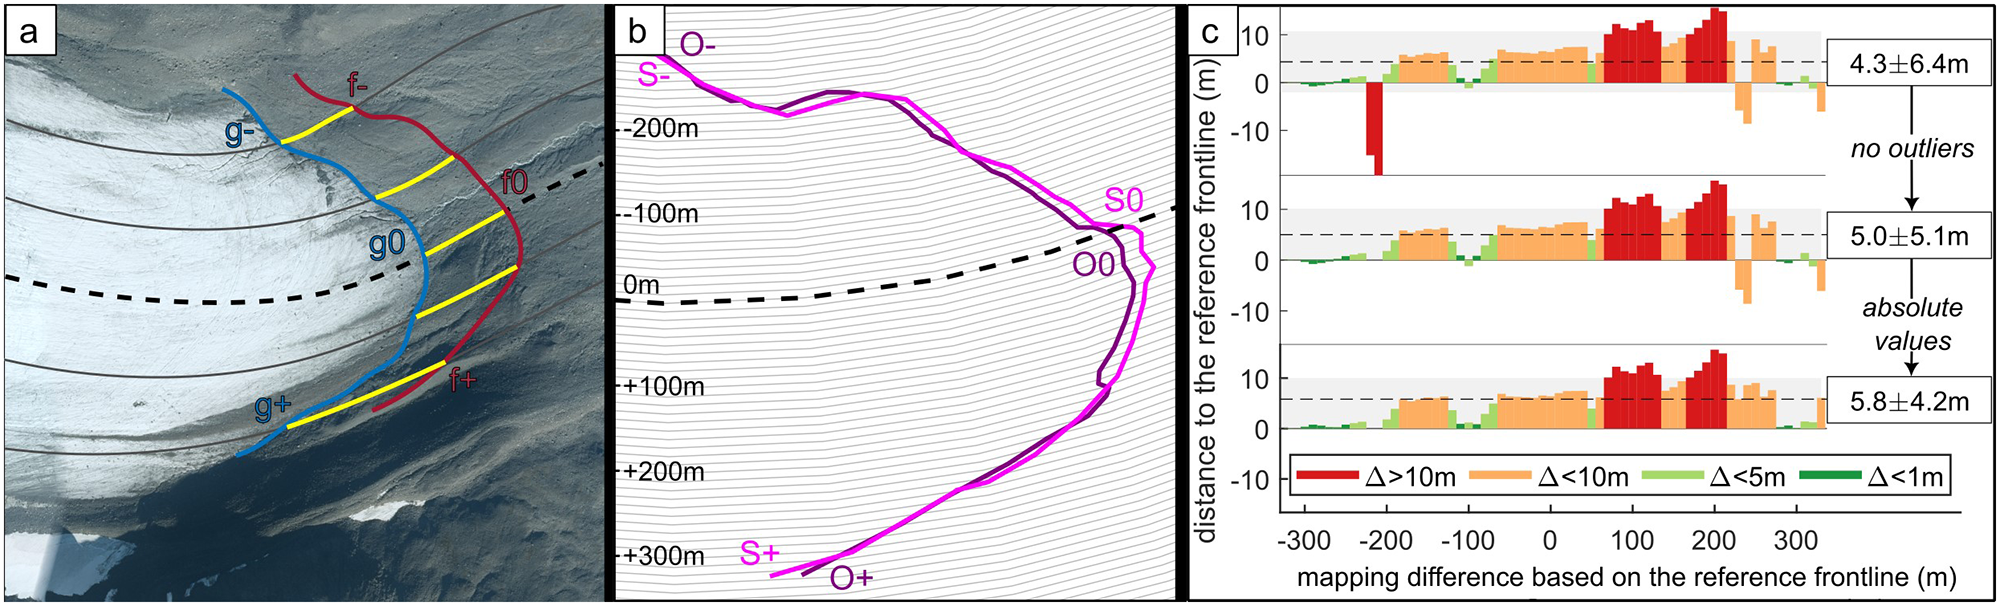
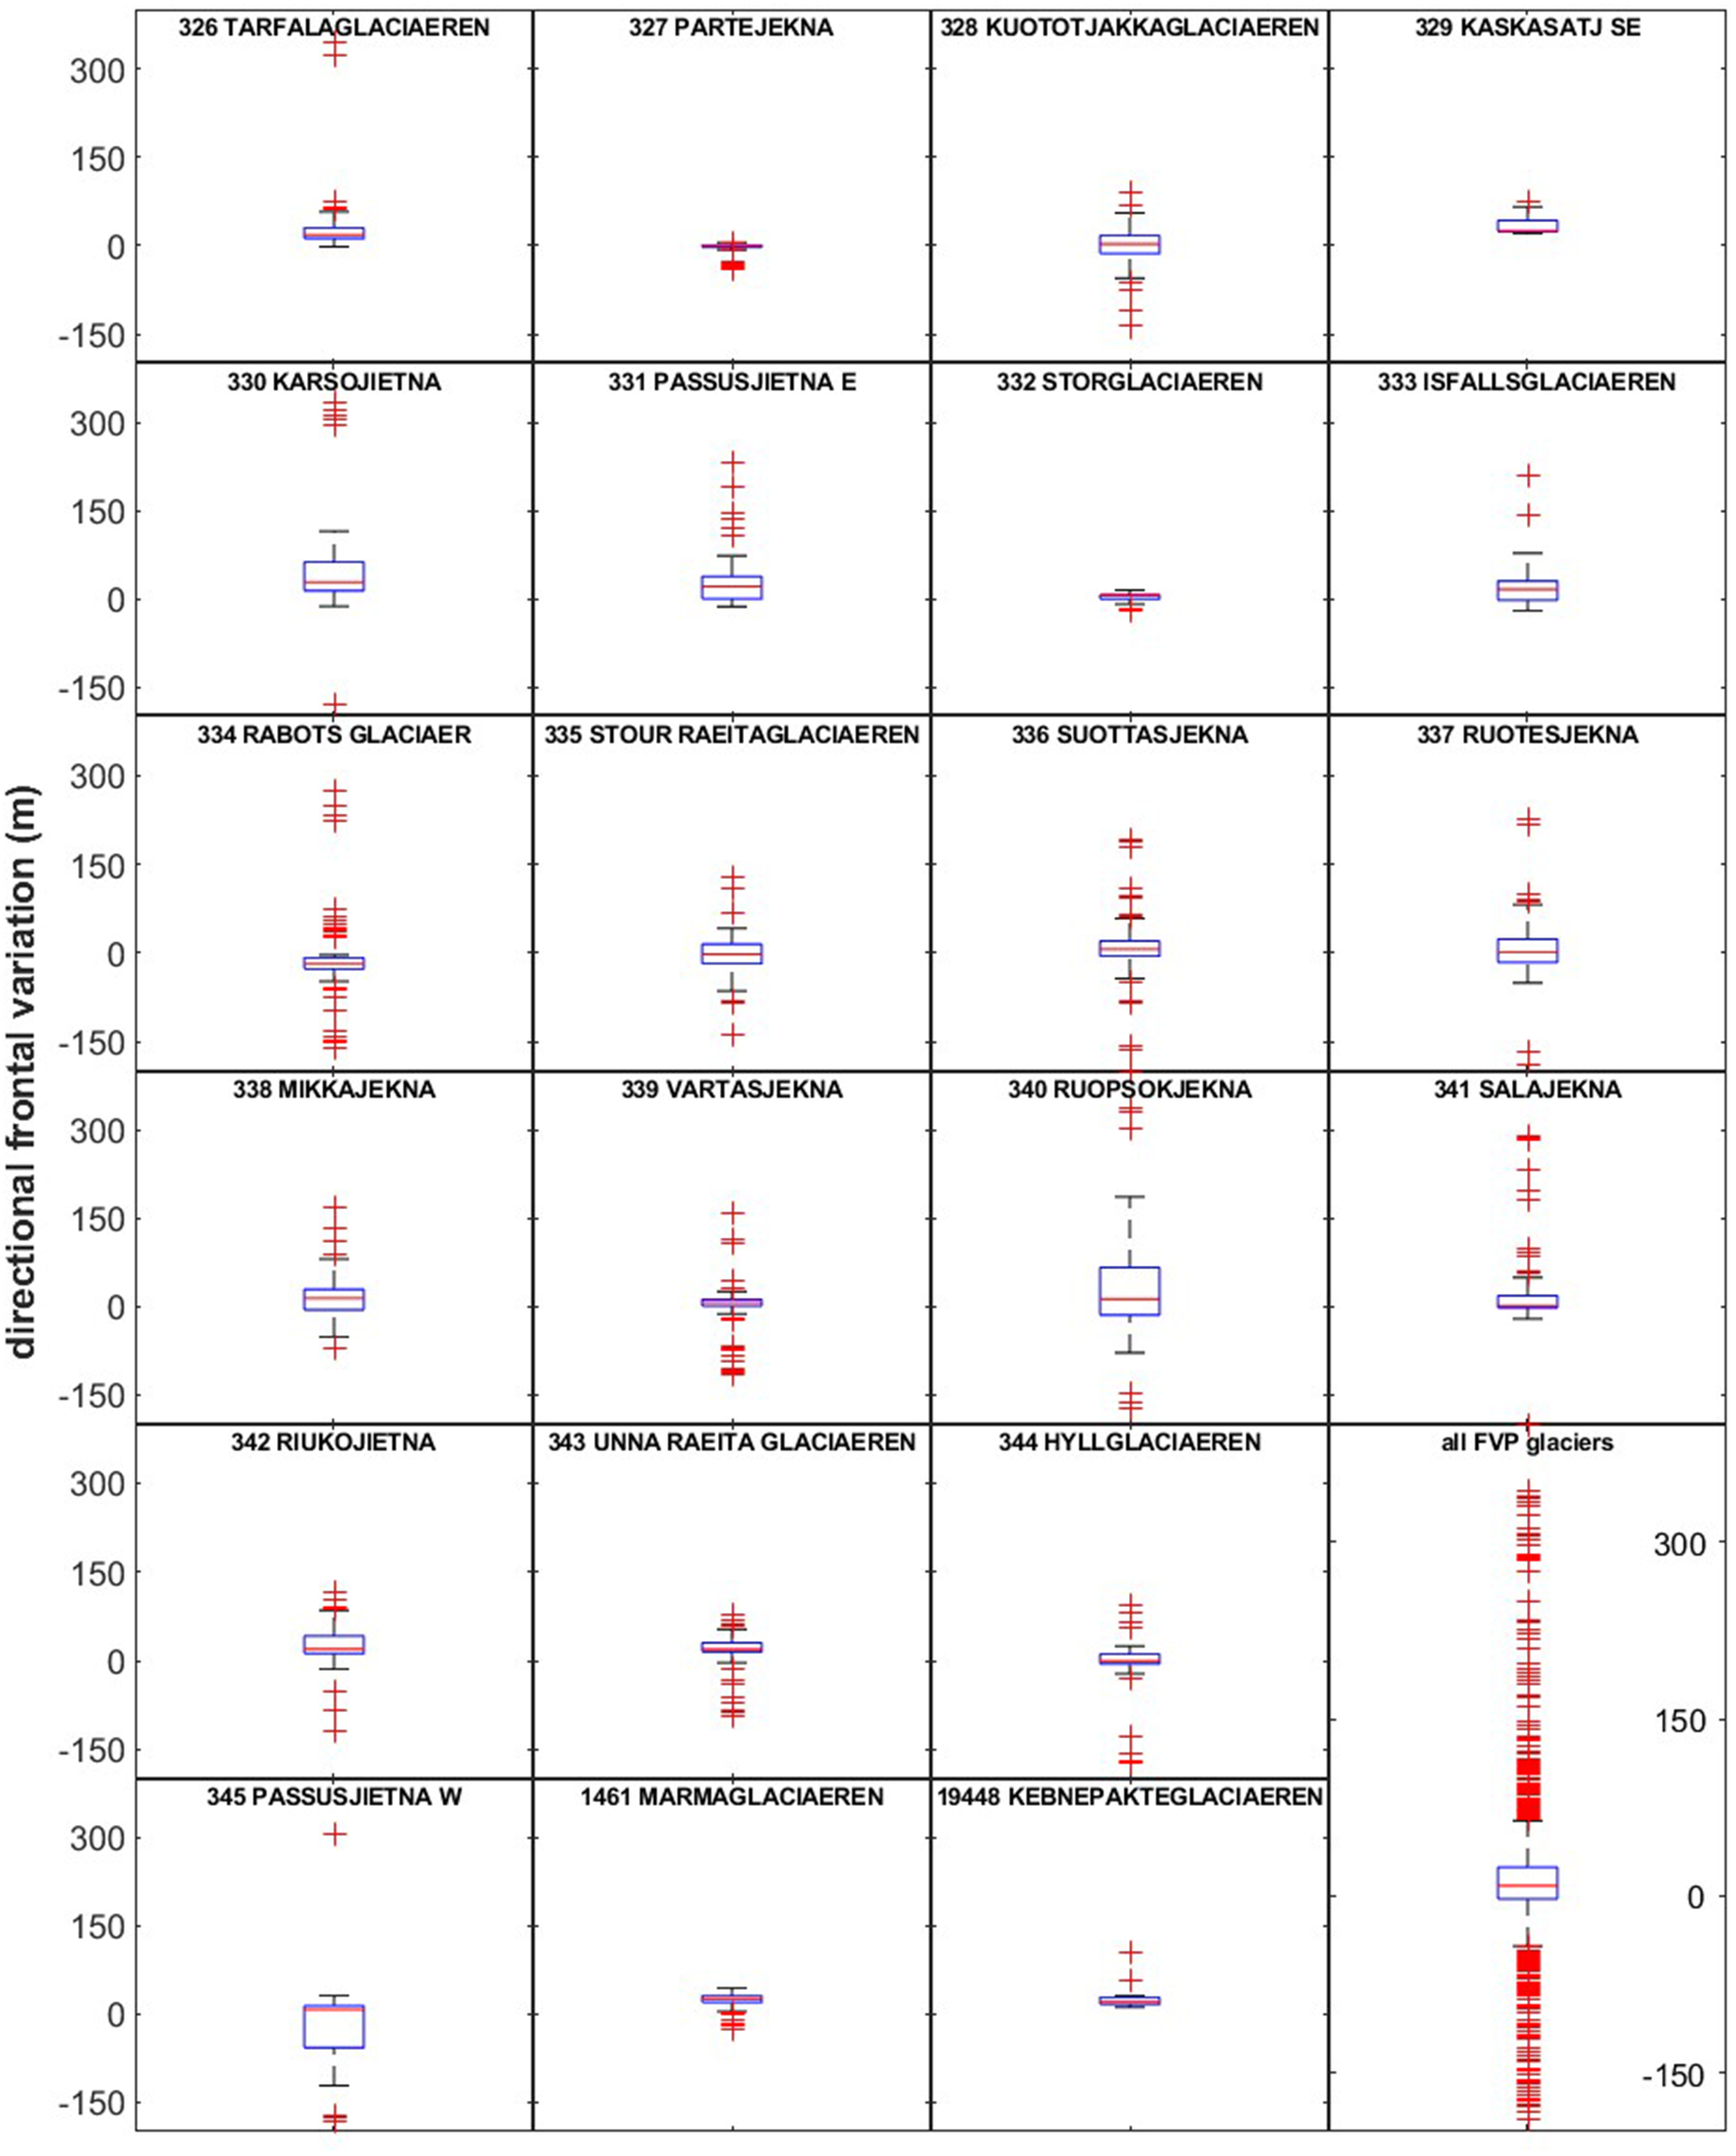
Frontal variation was computed in two different ways. When frontal variation was assessed over time, then, for each year, the arithmetic mean of the (directional) variation  $\Delta c$ along the centre line, and the n lines parallel to it ( $\Delta i, i = 1, \dots, n$) was computed, thus accounting for the possibility that parts of a front may have receded along a flowline (negative change) while others have advanced (positive change). Frontal variation is hence given by $\mu = (\Delta c + \sum \Delta i) / (n+1)$, where summing is from $i = 1, \dots, n$. When mapping accuracy (cf. below) was to be assessed, then, for a given year, an arithmetic mean of the absolute values of the variation, rather than the directional ones, was used, in order to better reflect the magnitude of the change: $ (\| \Delta c \| + \sum \| \Delta i \| ) /(n+1), i = 1, \dots , n$. Note that before applying either one, data outliers (values larger than 1.5 times the interquartile range) were removed (Fig. A5).
3.5. Field mapping techniques
3.5.1. Handheld GNSS mapping
The glacier front was mapped using GNSS while walking along the glacier front (Table 2), recording positions every 10 m where the glacier front showed little variation, and every 1 m where the front was very variable. A Trimble Geo7X GNSS rover was used in the field, combined with a Zephyr 2 antenna, which allowed for decimetre to centimetre accuracy with regard to position measurements (Trimble, 2013). The measurements were postprocessed using corrections from the network RTK (Real-Time Kinematics) service provided by the Land Survey of Sweden (swepos.lantmateriet.se). Postprocessing was conducted using the Trimble Pathfinder Office software. Where parts of the glacier front could not be accessed, linear interpolations were made between nearest available points along the front.
Glacier front mapping techniques applied in situ during 2022, to determine frontal mapping accuracy. Bold rendered entries indicate measurement and technology regarded to render the true glacier front position, against which mapping accuracy of the other methods is evaluated

3.5.2. TS mapping
TS surveys were performed in the field (Table 2) using a Trimble Total Station S7 and a TSC3 controller, rendering millimetre measurement precision (Trimble, 2024). For each glacier, TS measurements of individual points along the glacier front were made from two relatively elevated (with respect to the surroundings) locations that together offered an unobstructed view of as large parts of the glacier front as possible. These locations were identified from the 0.48 m spatial resolution orthophotos and a 1 m spatial resolution Digital Elevation Model (DEM) from the Land Survey of Sweden (lantmateriet.se) prior to the survey. When the suitability of the locations was confirmed in the field, the TS was set up there and georeferenced using three GNSS measured, temporary reference points (see above).
3.5.3. UAV mapping
UAV georeferenced imaging surveys were conducted in the field (Table 2) using a four-propeller 3DR Solo drone equipped with an unstabilized Parrot sequoia multispectral camera. Ground control points (GCPs) were laid out and georeferenced (using GNSS, see above) in advance to ensure accurate georeferencing of the UAV derived mapping. UAV missions operated at flight speed of 6 m/s and at flight heights of 40–120 m above ground, along paths determined with the help of the 0.48 m spatial resolution orthoimages and using the open-source software Mission Planner (ardupilot.org). Images were acquired every other second during flighttime and later postprocessed with Agisoft Metashape v5 (agisoft.com), following Agisoft’s standard procedure for orthomosaic generation. This involved an automatic alignment of the images, based on identifying common features across images, before the georeferenced GCPs were identified manually in every image they appear. Then, a re-calibration of the image alignment was carried out, based on the GCPs. After that, a 3-D mesh was generated, onto which the images were projected adopting a zenithal view. The orthomosaics have a spatial resolution in the centimetre range (0.02–0.04 m, depending on survey), from which glacier front positions were delineated manually.
3.6. Frontal mapping accuracy
Here, accuracy refers to how much a mapped glacier front differs from its true (or: reference) position in the field. Mapping accuracy thus depends on the mapping method and on knowing (or assuming) the true frontal position. To investigate this, two approaches were employed:
First, the termini of Storglaciären, Moarhmmá-, Kebnepakte- and Sydöstra Kaskasatjåkkaglaciären were surveyed in situ during 2022 using all or some of the following techniques (see below): handheld GNSS, TS, UAV. Then, the distance between glacier fronts as delineated in the field and as derived from the Sentinel-2 imagery was calculated using MaQiT’s modified (absolute variation values, see above) multi-centreline method. Generally, a frontal position as established by handheld GNSS mapping was regarded as the most accurate, because measurements were taken closest possible to the front, and allowed for its in situ determination even when there was some (thin) debris cover. Moreover, UAV and TS mapping rely on the GNSS referencing of the GCPs and are hence not considered more accurate than GNSS. A frontal position mapped by handheld GNSS served hence as a reference position against which accuracy of the other methods was assessed. An exception was Moarhmmáglaciären, where neither a handheld GNSS nor a TS survey could be performed and where the UAV mapped front served as reference to assess mapping accuracy (Table 2).
Second, the (near) time synchronous frontal positions of all 22 FVP glaciers except Sálajiegna, (Table 1) were mapped for the year 2018, as both Sentinel-2 and high-resolution orthoimages were available. While the orthophotos were taken on 28 and 29 July 2018, the Sentinel-2 imagery closest in time to these dates is from August and September 2018 (Table S2, Supplementary material). Glacier fronts delineated using the high resolution spatial orthophotos were used as a reference to assess the mapping accuracy.
4. Results
4.1. Glacier front mapping accuracy
When assessing mapping accuracy, fronts mapped by a handheld GNSS device were considered most accurate (see Section 3). Comparison with the other field techniques, UAV and TS, reveals that all three methods render comparable results, while they differ from those obtained by Sentinel-2 based mapping (Fig. 5). However, the difference between frontal positions mapped by GNSS and UAV was so small that UAV mapped fronts could likewise be considered the most accurate during future mapping campaigns.
FVP glacier front delineation. (a) Storglaciären (332) with centre line and multi-centre lines, and frontal positions as mapped from handheld GNSS, TS, UAV photogrammetry and Sentinel-2 in 2022. (b) Storglaciären’s frontal position as mapped from Sentinel-2 and orthophotographs by Lantmäteriet (lantmateriet.se) in 2018. Multi-centre lines as in (a). (c) Glacier specific and averaged (over all four glaciers studied in situ in the field) frontal mapping accuracy. Top: Sentinel-2 vs reference; Middle: TS vs reference; Bottom: UAV vs reference. Reference position is from GNSS except for Moarhmmáglaciären (1461) where it is from UAV, cf. Table 2. Glaciers are labelled using their WGMS IDs (Table 1). (d) Glacier specific and averaged (over all 22 FVP glaciers except Sálajiegna for which no orthophoto from 2018 is available) frontal mapping accuracy, for Sentinel-2 vs orthophoto front 2018. Glaciers are labelled using their WGMS IDs (Table 1).

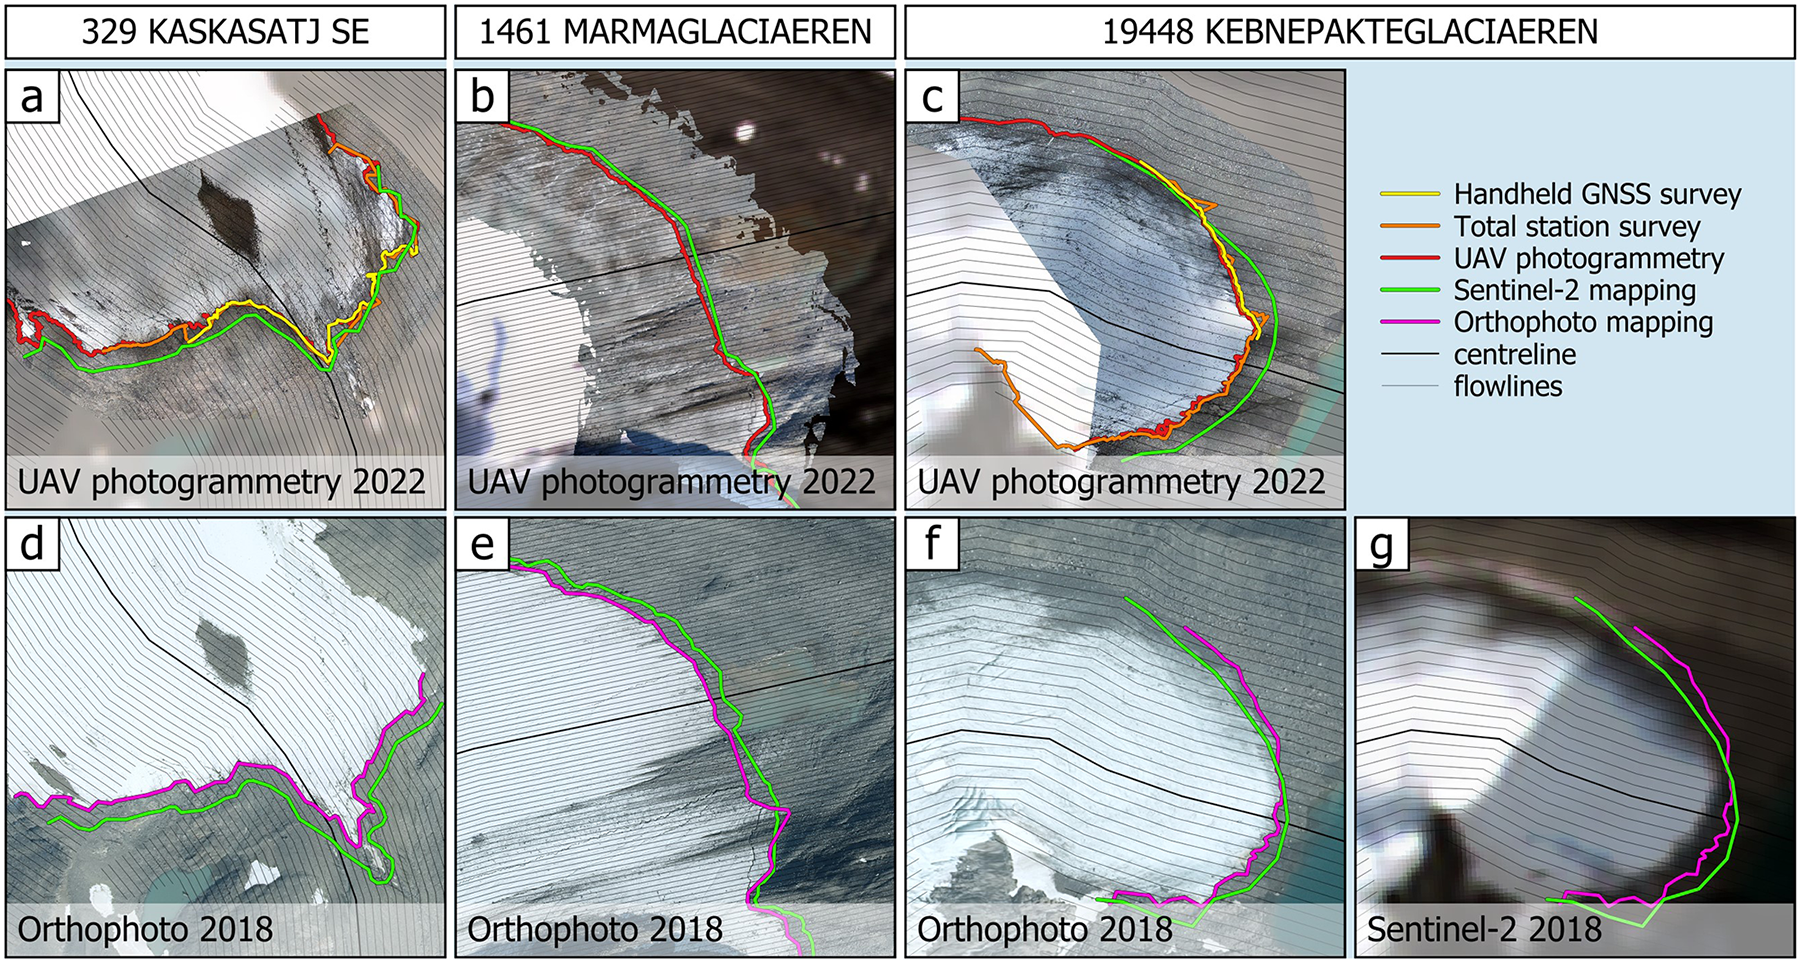
At Storglaciären, the 2022 glacier terminus position was mapped with four different techniques, within a period of 16 days (Table 2, Fig. 5a). While all frontal positions mapped in the field match closely, the Sentinel-2 mapped front differs by ±3 m (Fig. 5a,c). Similar is observed at Moarhmmá-, Kebnepakte- and Sydöstra Kaskasatjåkkaglaciären (Figs A6 and A7); however, the Sentinel-2 mapped fronts differ by ±10 m at Moarhmmáglaciären and by ±18–20 m at Sydöstra Kaskasatjåkka- and Kebnepakteglaciären (Fig. 5c). On average, frontal mapping accuracy, and its standard deviation, is as follows (Fig. 5c, Table 2): Sentinel-2 mapped fronts are located 11.7 ± 0.6 m apart from their reference locations. TS mapped fronts are located 2.4 ± 0.3 m apart from their reference positions, while UAV mapped fronts are located 1.1 ± 0.1 m apart from their reference positions.
Extending the analysis to all 22 FVP glaciers except Sálajiegna (Table 1) shows that glacier front positions as mapped in 2018 based on Sentinel-2 differ on average by 18.8 ± 0.5 m from their reference positions as mapped from orthoimages taken during the summer (Fig. 5d, Table S2, Supplementary material). The uncertainty derived for the four field glaciers and the 22 FVP glaciers except Sálajiegna needs to be assumed as an educated guess for the mapping uncertainty of all Swedish glaciers.
4.2. Glacier front variations and area changes, 2017–2023, from semi-automated mapping
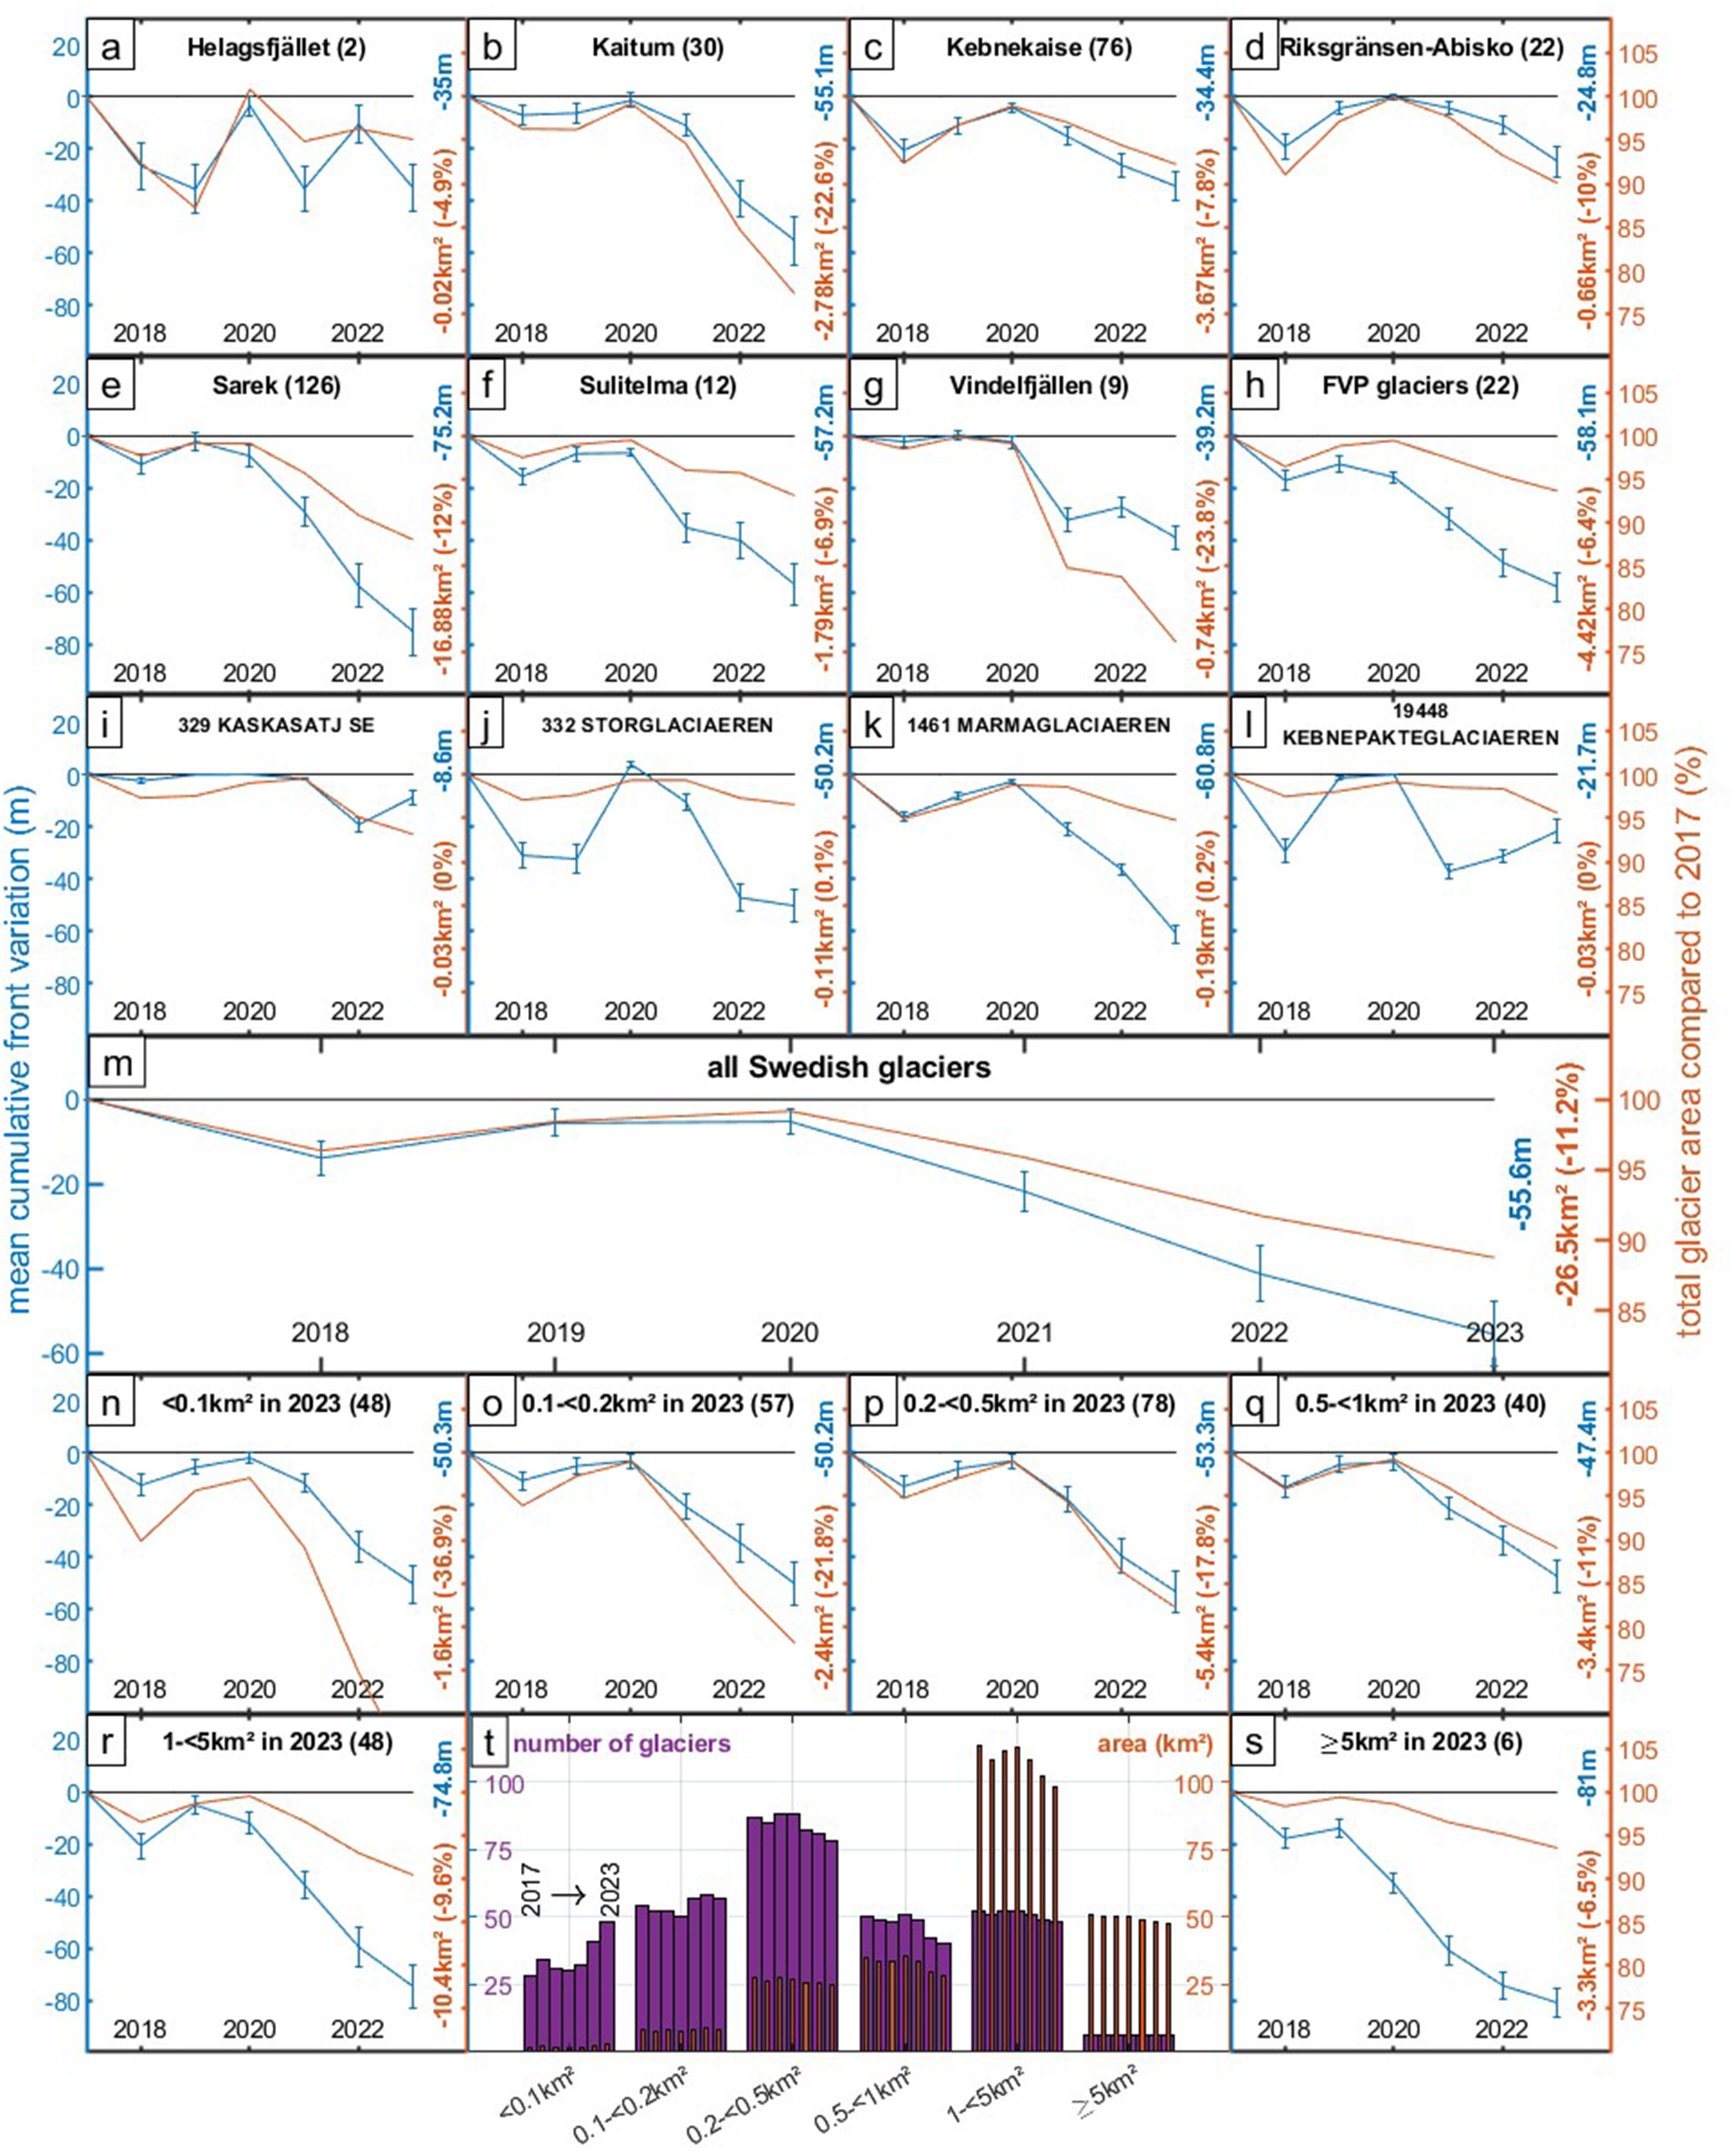
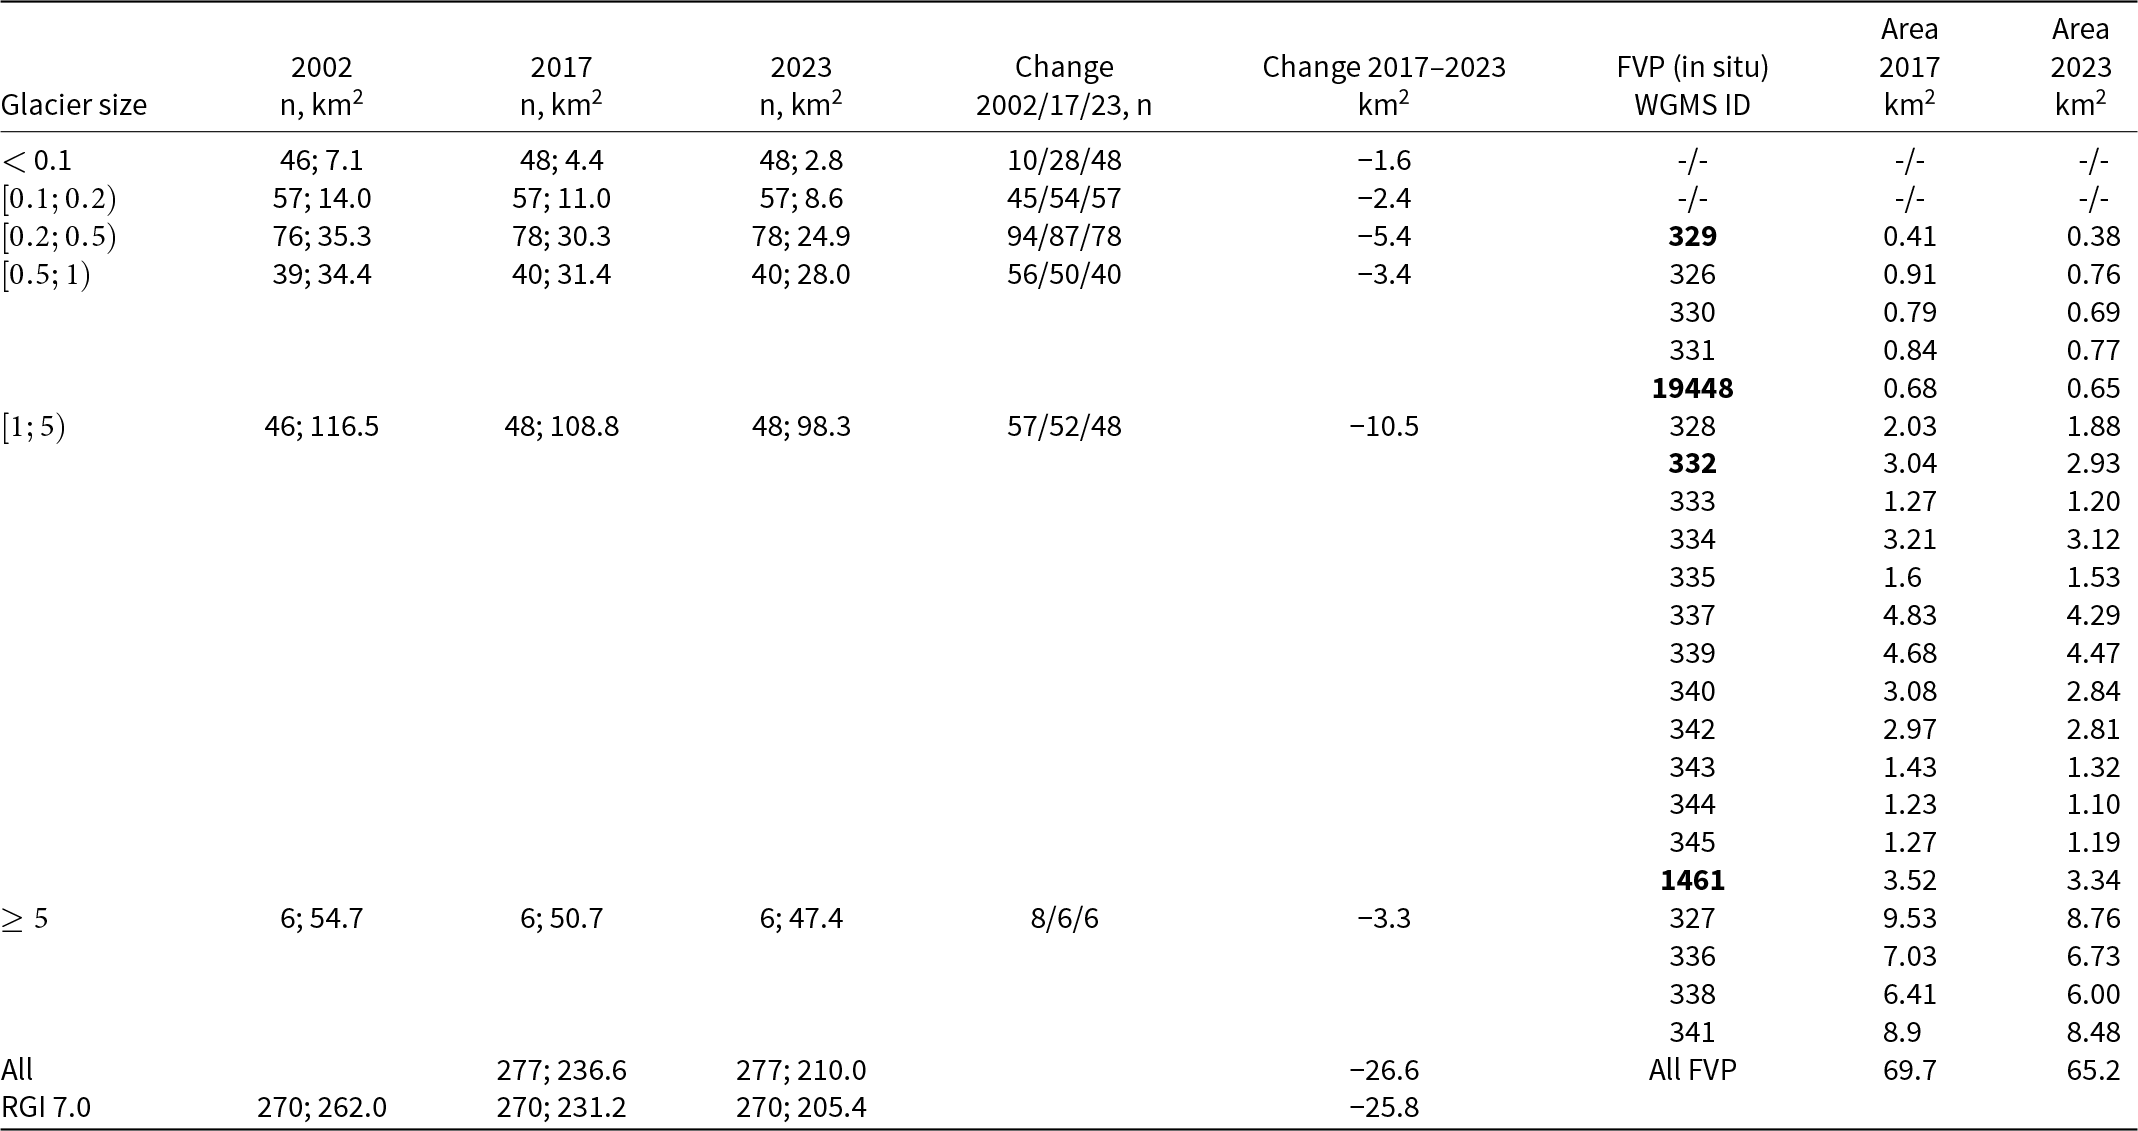
Annual and cumulative front variation as obtained from semi-automated mapping of all Swedish glaciers is presented with a country-wide, regional, individual and FVP focus (Fig. 6a–m). Since mapping frontal variation also rendered glacier area, glaciers were grouped according to their size into the following categories: Glacier surface area  $ \lt 0.1\, {\rm km}^2$ or contained in either of the intervals $[0.1 \, {\rm km}^2; 0.2 \, {\rm km}^2)$, $[0.2 \, {\rm km} ^2; 0.5 \, {\rm km}^2)$, $[0.5 \, {\rm km}^2; 1 \, {\rm km}^2)$, $[1\, {\rm km}^2; 5 \, {\rm km}^2)$ or $ \gt 5 \, {\rm km}^2$. Figure 6n–s show annual and cumulative frontal variation for each size-category of glaciers. There, the size of each glacier in the year 2023 determines to which class it is assigned, while mapping its area change in consecutive years. Note that over time, a glacier can move from one size-category to another (Fig. 6t, Table 3).
Frontal (blue) and area (orange) variation of the Swedish glaciers. Blue solid lines: Linearly interpolated (between years, with annual, noncumulative error bars for measurements) frontal variation. Blue numbers at right panel margins: Cumulative frontal retreat in metres, see blue axis at left panel margin. Orange solid lines: Area variation in per cent (%) of the area in 2017, see orange axis at right panel margin. Orange numbers at right panel margins: nominal and relative area loss. (a–g) Regional change, with regions as in Figure 1. (h) Change at the 22 FVP glaciers. (i–l) Change at four in situ observed glaciers. (m) Change at all Swedish glaciers. (n–s) Change for size-based glacier classification. (t) Summary of (n–s). Purple: (Change of) number of glaciers over time per size category. Orange: (Change of) area covered by glaciers in specific size-categories.
Area change for Swedish glaciers. Column 1: Glacier size category. Columns 2–4: Number (n) of glaciers in the particular size category as per 2023, and their combined area, in 2002, 2017 and 2023, respectively. Column 5: Variation of n over time (see Figure 6t). Column 6: Area change 2017–2023. Column 7: FVP glacier with WGMS ID, rendered bold if studied in situ during 2022. Columns 8 and 9: Area of the FVP glaciers in 2017 and 2023, respectively
The country-wide average cumulative frontal variation is −55.6 m (Fig. 6m), obtained from the regionally weighted (Fig. 6a–g, with weights corresponding to the number of glaciers in the regions) variations. The largest cumulative frontal variation during 2017–2023 occurs in the Sarek area (−75.2 m, Fig. 6e) and the smallest one in the Riksgränsen-Abisko area (−24.8 m, Fig. 6d). Average cumulative frontal variation of the FVP glaciers is −58.1 m (Fig. 6h), while it ranges between −8.6 m and −60.8 m for the four in situ investigated glaciers (Fig. 6i–l). Across glacier-size categories, average cumulative frontal variation is in the range of  $\sim-$50 m for all glaciers with surface areas up to 1 km2 but increases to $\sim-$80 m for larger glaciers (Fig. 6n–s).
Glacier area of the 277 Swedish glaciers reduces from ∼237 km2 in 2017 to 210 km2 in 2023. This corresponds to a loss of ∼27 km2 or ∼11% of their 2017 area (Fig. 6m, Table 3). Compared to the area of Swedish glaciers as in 2002, the RGI 7.0 (RGI Consortium, 2023) has only 270 glaciers, which have an area of ∼262 km2. These 270 glaciers have an area of ∼231 km2 in 2017 (reduction of 31 km2 or 12% since 2002) and an area of 205 km2 in 2023 (reduction of 26 km2 or 11% since 2017) (Table 3).
Regional area losses are nominally smallest in Helagsfjället (two glaciers, combined loss 0.02 km2) and largest in Sarek (126 glaciers, combined loss 16.88 km2). Relative losses are smallest in Helagsfjället (4.9%) and largest in Vindelfjällen (9 glaciers, 23.8%) (Fig. 6a–g). FVP glacier area in 2017 is 69.7 km2 and reduced with 4.5 km2 to 65.2 km2 in 2023, which corresponds to a relative area loss of ∼6% (Fig. 6h). At the four glaciers studied in the field, nominal glacier area loss ranges between 0.03 and 0.19 km2, or 0–0.2%, during 2017–2023 (Fig. 6i–l, Table 3).
The group of smallest glaciers (size  $ \lt \!\! 0.1\, {\rm km}^2$) exhibits the largest relative area loss (36.9%) between 2017 and 2023 (Fig. 6n, Table 3). With increasing glacier size, relative area losses become increasingly smaller, e.g. 17.8% or a total reduction of 5.4 km2 between 2017 and 2023, for the glaciers in size group $[0.2 \, {\rm km}^2; 0.5 \, {\rm km}^2$). Even smaller numbers are obtained for the six glaciers that are larger than 5 km2: 6.5% reduction in size (corresponding to a loss of 3.3 km2) during 2017–2023 (Fig. 6o–s). The total area loss of ∼27 km2 is dominated by losses from glaciers in the size class $[1 \, {\rm km}^2; 5 \, {\rm km}^2)$ which contribute with a nominal loss of 10.5 km2 between 2017 and 2023, corresponding to a reduction of ∼10% compared to their 2017 area (Fig. 6t, Table 3).
4.3. FVP glacier front variations and area changes, 2017–2023, from semi-automated and manual mapping
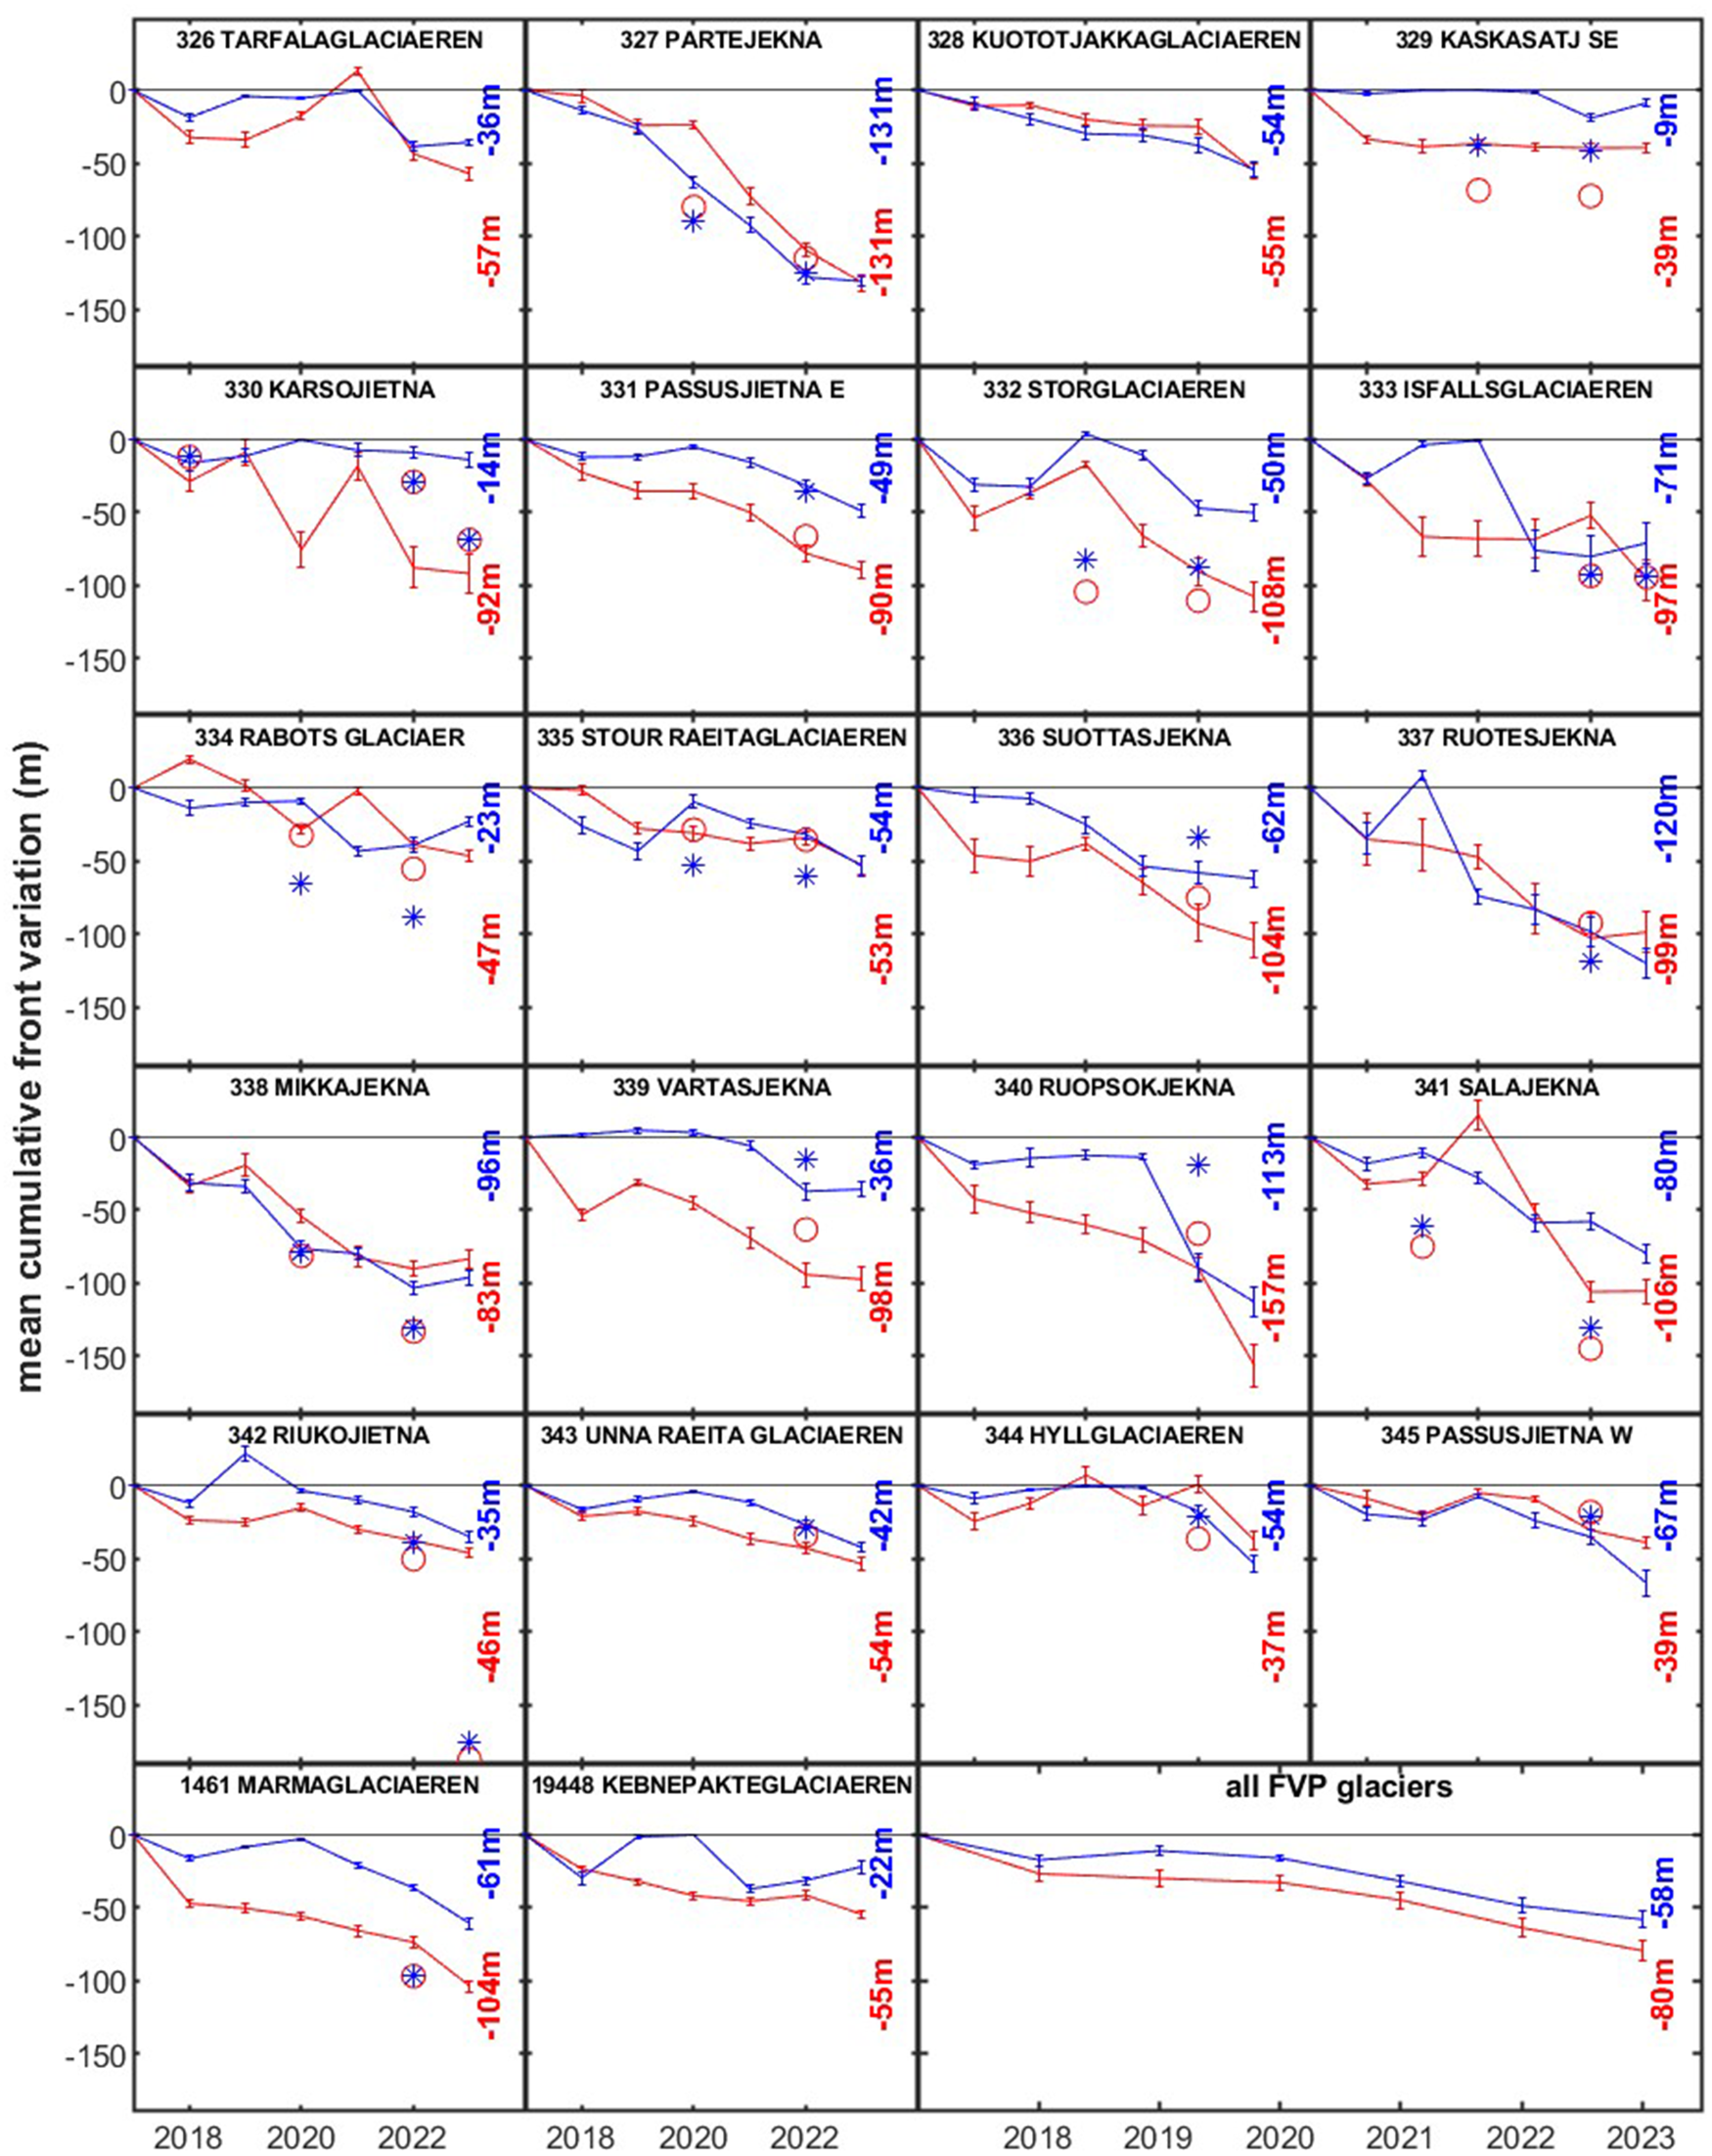
From 2017 to 2023, all FVP glacier fronts experience a cumulative retreat, irrespective of whether manual or semi-automated mapping was performed (Fig. 7). However, the amount of cumulative retreat varies across glaciers, and also depending on whether they were assessed based on purely manual mapping or semi-automated mapping: Based on manual mapping, the smallest and largest cumulative frontal retreats between 2017 and 2023 are derived for Hyllglaciären (ID 344, −37.4 m) and Ruopsokjekna (ID 340, −156.7 m). For semi-automated mapping, the smallest and largest cumulative frontal variations are seen at Sydöstra Kaskasatjåkkaglaciären (−8.6 m) and Bårddejiegna (−130.6 m). Across the FVP glaciers, the averaged cumulative frontal variation is −58.1 m (semi-automated mapping) and −79.5 m (manual mapping). The widespread retreat is also seen in other front variation records (WGMS, 2024) and ranges from being within what is assessed here (e.g. for Reaiddáglaciären, WGMS ID 343), to overshooting it (e.g. for Rivgojiehkki, WGMS ID 342) and to undershooting it (e.g. for Västra Bossosglaciären, WGMS ID 345). For example, a retreat of 13 m is reported (WGMS, 2024) in 2022 with respect to the year 2018 at Reaiddáglaciären. This retreat is shown in Figure 7 (panel 343 Unna Raeitaglaciaeren) by the red circle and the blue star, the positions of which are obtained by adding the reported retreat of 13 m to the accumulated retreat as of the year 2018 as obtained here from the manual and semi-automated mapping, respectively. Similarly, a retreat of 35 m is reported at Rivgojiehkki in 2022 with respect to the year 2020, followed by a retreat of 137 m in 2023 with respect to 2022. This is shown in the Figure 7 (panel 342 Riukojietna), by the red circles and blue stars in 2022 and 2023, the 2022 positions of which are obtained by subtracting them from the 2020 cumulative frontal retreat as mapped by the manual and the semi-automated approach, respectively. The 2023 positions are obtained likewise, but with respect to 2022.
Frontal variation at of each of the 22 FVP glaciers (cf. Table 1) during 2017–2023, from manual mapping (red) and semi-automated mapping (blue). Stars and circles denote frontal variation as reported in WGMS (2024), and where the first values are with reference to frontal positions as mapped by the semi-automated (blue star) and manual (red circle) method, for various years as follows (format: WGMS ID—reference year, cf. also Figure 2): 327—2018; 329—2018; 330—2017; 331—2020; 332—2018; 333—2018; 334—2018; 335—2018; 336—2018; 337—2020; 338—2018; 339—2020; 340—2020; 341—2018; 342—2020; 343—2018; 344—2018; 345—2020; 1461—2017. Frontal variation is plotted for each year linearly interpolated between measurements and complemented by error bars indicating its standard deviation. Cumulative frontal variation by 2023 is given as numbers at the right panel margins.
5. Discussion
5.1. Inventories, semi-automated mapping, centreline spacing and outliers in MaQiT
A challenge with glacier inventories is that glaciers are dynamic over time (they can shrink and/or split) and that decision-making in the mapping process can be subjective. An example of the latter is when a glacier comprising of different sectors is considered as one glacier in one inventory, but two or more in another, or when sectors of a glacier are included in one inventory, but excluded in another (Figs A1 and A2). Mapping usually relies on remote sensing products and possibilities for ground truthing are few, implying that there remains uncertainty as to whether the features observed and mapped from remote sensing are correctly mapped and classified.
With a growing number of small glaciers (Fig. 6t), with glaciers starting to split (Fig. A1) and hence the associated challenges of mapping those glaciers (Fig. A4), the use of the semi-automated mapping procedure, and standardized approaches such as MaQiT, is advocated. It allows for a higher degree of consistency during mapping, eliminates possible errors induced by subjective assessments during manual mapping and facilitates the processing of a larger number of glaciers than possible with manual mapping. Semi-automated mapping based on satellite imagery should, however, continue to be complemented by some direct measurements, as these are indispensable for validation as well as evaluation of emerging new methods (Nussbaumer and others, Reference Nussbaumer, Hoelzle, Hüsler, Huggel, Salzmann and Zemp2017). In MaQiT, we chose a multi-centreline spacing of 10 m across each glacier. This number was used because it is considered to render a sufficiently dense spacing. A systematic analysis focusing on how sensitive frontal variation results are to multi-centreline spacing could be performed in the future but is not carried out here where the focus is instead on accessing mapping accuracy by comparing to in situ measurements (at four selected glaciers) and high-resolution orthophotos (for all 22 FVP glaciers except Sálajiegna). Similarly, when removing outliers from the raw frontal variation data, it could be investigated systematically what impact the multiple (here chosen as 1.5, cf. Fig. A5) of the interquartile range has on the final assessment of frontal variation. As data show very different characteristics across glaciers (some have few outliers, some have many), it is suggested that glaciers with many outliers are investigated in more detail first with the aim to find possible explanations for the large number of outliers. Such a study could provide useful information regarding individual glacier behaviour and perhaps also methodological insights regarding potential limitations of the MaQiT tool (Lea, Reference Lea2018). Yet, it is not expected to change the overall picture of country-wide glacier retreat that emerged from the analysis presented here.
5.2. Frontal variation mapping accuracy
If glacier fronts are to be investigated regularly for all of Sweden’s glaciers, it will have to rely on remote sensing products and semi-automated processes described above. It is thus important to be aware of the accuracy of results obtained by such an approach. Frontal mapping of large numbers of glaciers based on Sentinel-2 imagery is likely providing the best temporal and spatial coverage although the averaged deviation is in the range of 11.7 ± 0.6 m to 18.8 ± 0.5 m as compared to what is regarded as the true glacier front. This translates to an accuracy of 2 pixels in a Sentinel-2 image, and a standard deviation of less than 1 pixel. Based on the results obtained here, it is suggested that frontal mapping using either GNSS or UAV can be regarded as yielding true glacier fronts (Fig. 5).
In the assessment of mapping accuracy, temporally synchronous measurements are desirable but pose a challenge: for instance, the 2018 Sentinel-2 images for the 22 FVP glaciers except Sálajiegna are from a 1–2 month later time than the orthophotos they are compared to (Table S2, Supplementary material), which implies that glacier dynamics will likely affect the frontal position and therefore impact the stated mapping accuracy (Fig. 5). Also, mapping accuracy may be impacted when no satellite images are available on which the entire glacier margin is snow-free. Here, we have proposed a systematic approach to deal with this issue (Fig. A3), rather than excluding these images and potentially rendering the dataset too sparse and adding uncertainty related to data gaps. However, with the possibility of future regular updates of the inventory, the exclusion of snow-covered imagery from the analysis should be re-evaluated. An updated future inventory of glacier front variation will also allow to study whether mapping accuracy can be related to glacier size. Currently, no pattern is identified that would hint at whether mapping accuracy is better for larger glaciers than for smaller ones (Fig. 5c,d, Table 1).
The semi-automated procedure results in slightly less pronounced mapped glacier front retreat as compared to manual mapping (Fig. 7). It is thus suggested that the results from the semi-automated mapping may be regarded as conservative when compared to results from manual mapping, and that the added value of ground truthing at selected locations in time and space should not be underestimated (Fig. A7).
5.3. Frontal variation of Swedish glaciers during 2017–2023
Cumulative frontal retreat across all 277 Swedish glaciers assessed with the semi-automated mapping methods amounts to 56 m, between and including 2017 and 2023. Regional deviation is up to ∼50% (25 m cumulative retreat in the Riksgränsen-Abisko region and 75 m in the Sarek region). For the subset of the 22 FVP glaciers, the cumulative frontal retreat is with 58 m comparable to the country-wide average. However, when assessed from manual mapping, cumulative frontal retreat at the FVP glaciers is about 30% larger (80 m) than country-wide average (Figs 6 and 7). This indicates that the 22 FVP glaciers may still be representative of all 277 Swedish glaciers in the context of the semi-automated mapping approach, but also, that the semi-automated mapping approach may underestimate the actual general retreat. All FVP glaciers are currently larger than 0.2  ${\rm km^2}$, implying that the two smallest glacier categories, < 0.1 ${\rm km^2}$ and [0.1 ${\rm km^2}$; 0.2 ${\rm km^2}$), are not represented among the FVP glaciers. Because 38% (105 of 277) of all Swedish glaciers are currently in these two categories (which also have the highest relative area losses, Fig. 6, and may partly be threatened by extinction (Table S2, Supplementary material)), future expansions of the FVP should include a representative glacier with area less than 0.2 ${\rm km^2}$, especially since Sentinel-2 images have here been demonstrated to be a valuable source to monitor area and frontal changes of these smallest glaciers.
On the level of individual glaciers, a complex picture emerges as the following examples show (Fig. 7): Both mapping methods can yield very similar cumulative frontal variations (such as at Bårddejiegna and Reaiddáglaciäen where the differences are less than 1 m), but also slightly different ones (such as at Rivgojiehkki, where the difference is 11 m), and also very different ones (such as at Sydöstra Kaskasatjåkkaglaciären where the difference is 31 m, and at Gorsajiekna where the difference is 78 m).
A further comparison focuses on front variation data sourced from WGMS (2024), where the majority of the frontal variation observations for the FVP glaciers comprise of ‘tG/aP’ (WGMS terminology for: terrestrial-ground/airborne-photogrammetry) observations, all reported with an uncertainty of 1 m. At Bårddejiegna and Reaiddáglaciäen, cumulative retreat sourced from WGMS (2024) amounts to 111 m and 34 m, respectively, since 2018. This fits well with the cumulative frontal retreat of c. 130 m and 53 m, respectively, derived here for 2017–2023. At Rivgojiehkki, however, retreat sourced from WGMS (2024) since 2020 amounts to 172 m, which is more than threefold compared to cumulative retreats derived here, and with respect to a shorter time span. At Sydöstra Kaskasatjåkkaglaciären, cumulative retreat sourced from WGMS (2024) is 39 m since 2018, which fits well with its counterpart derived here from manual mapping (37 m, during 2017–2023 though) but not with results obtained from semi-automated mapping (9 m). Similarly, at Gorsajiekna, cumulative frontal retreat sourced from WGMS (2024) is 69 m as per 2017. This implies a 23 m offset to the manually mapped cumulative frontal variation during the same time span and a 56 m offset to the semi-automatically mapped cumulative frontal variation (Fig. 7). The observed differences in cumulative frontal retreat raise questions concerning their attribution: Are the differences related to the object of study per se—such as a glacier’s size, morphology, location and immediate environment? Or are they related to the mapping method applied—is the semi-automated method challenged by certain types of glaciers, and/or is an individual conducting the manual mapping challenged by certain (same or different?) types of glaciers? However, disentangling the relation between cause and effect is beyond the scope of the work presented here and could—now that all relevant mapping methodology is in place—be an interesting subject of further future studies.
5.4. Surface area loss of Swedish glaciers during 2017–2023
The pervasive frontal retreat of Swedish glaciers during 2017–2023 goes along with widespread surface area loss (Fig. 6, Table 3), irrespective of geographical location or size of the glaciers. Area loss for all Swedish glaciers by 2023 amounts to 11% with respect to the year 2017 or 1.8% a−1. This rate is more than the fourfold compared to the area loss of Swedish glaciers during the period 1960–2002 (0.4% a−1, based Vilborg Reference Vilborg(1962) and RGI Consortium (2023)). It is also almost twice the rate compared to 2002–2017 (ca. 1%, Table 3). There will always be challenges in comparing inventories due to difference in snow conditions, human interpretations and sources used. We noted examples that the glacier area in RGI 7.0 (RGI Consortium, 2023) may both be slightly underestimated for some glaciers (Fig. A2) and likely overestimated for other glaciers (Fig. A4). Notably, area loss at the 22 Swedish FVP glaciers (1% a−1) appears to underestimate glacier area loss across all Swedish glaciers (1.8% a−1) over the period 2017–2023. It should be noted that none of the 22 FVP glaciers are in the two smallest glacier size categories which show the largest relative area losses and contain an increasing number of glaciers (Table 3, Fig. 6n,o,t). Our findings emphasize the importance of repeat mapping of all glaciers to assess the overall absolute and relative changes in glacier area. Our study reveals 20 glaciers including Sydöstra Kaskasapakteglaciären (RGI2000-v7-0-G438 08-00754) and Sydvästra Kaskasatjåkkaglaciären (RGI2000-v7-0-G-08- 00755) in the Tarfala Valley and 18 glaciers in other regions that have shrunk in size below the  $ \lt 0.1\,{\rm km}^{2}$ threshold during 2017–2023 (Table S1, Supplementary material).
Comparing surface area loss of Swedish glaciers over the period 2017–2023 to losses observed in other geographical regions is challenged by the lack of time-synchronous data. According to Andreassen and others (Reference Andreassen, Winsvold, Paul and Hausberg2012, Reference Andreassen, Nagy, Kjøllmoen and Leigh2022), Norwegian glaciers reduced in surface area at a rate of ca. 1% a−1 between 1999/2006 and 2018/2019. Based on our findings for area loss at large Swedish glaciers (smallest relative area losses among all glacier size categories, Fig. 6s,t), we speculate that the lower Norwegian glacier area retreat rate may be related to a greater number of large glaciers in Norway as compared to Sweden. The loss of 20 Norwegian glaciers between 1999/2006 and 2018/2019 is important to notice (Andreassen, Reference Andreassen2022) but since they were small, they were likely not affecting the country-wide averaged glacier area reduction rate noticeably.
Glacier frontal variation appears to be a good indicator for area change at the 118 glaciers in the size categories [0.2  ${\rm km^2}$, 0.5 ${\rm km^2}$) and [0.5 ${\rm km^2}$, 1.0 ${\rm km^2}$) (Fig. 6p,q). This is in contrast to small and large glaciers (Fig. 6n,o,s,t) and confirmed by observations at individual glaciers (Fig. 6i–k); however, exceptions are noted (Fig. 6l). This may explain challenges with relating frontal retreat and area loss to geographical regions, where glaciers of different size are encountered. It needs to remain a task for future investigations to establish a more quantitative description, if possible, of the relation between frontal variation and area change at Swedish glaciers. Likewise, it remains to entangle how accuracy in frontal variation mapping propagates to accuracy in area mapping. This is because currently, accuracy assessment is based on the absolute values of the variation, rather than directional ones, implying that area could be overestimated or underestimated. However, we argue that area could be underestimated. We reason that the semi-automated mapping of frontal variation renders a cumulative retreat of all FVP glaciers of ∼58 m, while the manually mapped variation gives a retreat of ∼79 m. The difference of ∼20 m is very close to the assessed accuracy of semi-automated mapping (after comparing results to high resolution orthophotos, Fig. 5). This seems to indicate that the semi-automated mapping in combination with the Sentinel-2 images is conservative and as such underestimates frontal variation. If this is the case, it is plausible to assume that this underestimation transgresses into the assessment of area loss. With larger amounts of data emerging from possible future updates of the here presented record, grounds would be laid for a more in-depth statistical analysis of this matter. However, until then, it is suggested that a ±3% overall uncertainty regarding the here reported total glacier area of 2017 and 2023 is assumed, in line with Andreassen and others (Reference Andreassen, Paul, Kääb and Hausberg2008, Reference Andreassen, Nagy, Kjøllmoen and Leigh2022).
6. Conclusions
Results were presented concerning frontal variation, and surface area change, of 277 Swedish glaciers during 2017–2023. Among them is a subset of 22 glaciers included in the Swedish FVP. The analysis of all 277 Swedish glaciers is possible by combining Sentinel-2 imagery, a semi-automated glacier outline mapping procedure (Paul and others, Reference Paul, Kääb, Maisch, Kellenberger and Haeberli2002, Reference Paul2013) and the MaQiT tool (Lea, Reference Lea2018). The main findings are as follows:
• Six glaciers identified as Swedish were added to the 270 Swedish glaciers in RGI 7.0 (RGI Consortium, 2023), of which one is confirmed to have split in two. This renders a total number of 277 Swedish glaciers as of 2023.
• A widespread retreat of all Swedish glaciers is observed: Cumulative frontal variation across all Swedish glaciers is −56 m during 2017–2023, corresponding to an average retreat of 9.3 m a−1, as derived from the semi-automated mapping method.
• The cumulative frontal variation at the 22 FVP glaciers amounts to −58 m (semi-automated mapping, translating to an average retreat of 9.7 m a−1) and −80 m (manual mapping, translating to an average retreat of 13.3 m a−1) during 2017–2023. Our results suggest that the semi-automated mapping underestimates overall glacier retreat.
• Widespread surface area loss is observed across all 277 Swedish glaciers during 2017–2023. The total area loss amounts to ∼27 km2, or 11%, from 2017 to 2023. The subset of the 270 glaciers contained in RGI Consortium (2023) reduced from an area of 262 km2 in 2002 to an area of 205 km2 in 2023, corresponding to a loss of 22%. Glacier area change rates vary across geographical regions and across glacier size categories and may underestimate actual area reduction.
• The number of glaciers with a surface area less than $ 0.1 \, {\rm km}^2$ has increased from 10 in 2002 to 26 in 2017 and to 46 in 2023. Glaciers with areas below this threshold are considered to be threatened by extinction in a foreseeable future.
• Ground truthing measurements were used to assess the accuracy of frontal variation as mapped by remote-sensing and semi-automated approaches. Four Swedish glacier fronts were mapped in situ in 2022, by means of a handheld GNSS devices, a TS and orthophoto from UAV. The results revealed that glacier fronts as mapped from Sentinel-2 of 10 m resolution were located ∼12 m apart from their (considered true) GNSS mapped positions. When GNSS mapped positions were not available, glacier fronts mapped from Sentinel-2 were located ∼19 m from their positions as mapped from high-resolution orthoimages.

Supplementary material
The supplementary material for this article can be found at https://doi.org/10.1017/jog.2025.10057.
Data availability statement
Data are currently prepared for publication in the Bolin Centre Database (bolin.su.se/data). A link to the published dataset will be made available as soon as possible. Likewise, submission of the glacier outlines to GLIMS (https://www.glims.org/) is in preparation. Until then, requests for data can be addressed to the corresponding author.
Acknowledgements
Financial support for field work and manuscript writing was provided to MH by the Dept. of Physical Geography at Stockholm University, and by Tarfala Research Station, and is gratefully acknowledged. The constructive feedback of A. Rabatel and two anonymous reviewers as well as the scientific editor L.M. Andreassen and associate chief editor H. Jiskoot helped to improve the manuscript and is gratefully acknowledged.
Competing interests
The authors declare none.
Appendix.
This appendix contains Figures A1–A7.
Glaciers RGI2000-v7.0-G-08-00708 (‘Östra Kallaktjåkka’ in Swedish but unnamed in RGI 7.0 (RGI Consortium, 2023)) and RGI2000-v7.0-G-08-01653 (Kuototjåkkaglaciären, FVP glacier, WGMS ID 328) from RGI 7.0, the semi-automated mapping presented here for the years 2017–2023, and from orthoimages (lantmateriet.se, 2024). (a) Östra Kallaktjåkka. Brown shape—glacier outline as in RGI 7.0. Red shapes–outlines from the mapping performed here. (b) Östra Kallaktjåkka from Lantmäteriets 2024 orthoimage. The glacier has split into what is suggested to be referred to as ‘Östra Kallaktjåkka North’ and ‘Östra Kallaktjåkka South’. (c) Kuototjåkka. Brown shape—glacier outline as in RGI 7.0. Red shapes—outlines from the mapping performed here. (d) Kuototjåkka from Lantmäteriets 2024 orthoimage. The glacier front is still connected by what is assessed a debris-covered ice mass but is likely to split in a foreseeable future.
Differences between Swedish Glacier inventories, exemplified for the Kebnekaise region (Figure 1). Inventories are from: RGI 7.0, WGI and WGMS (WGMS and National Snow and Ice Data Centre, 2012; RGI Consortium, 2023; WGMS, 2024), images are from Google Earth. (a) Brown shapes: Glacier outlines from RGI 7.0. Red dots: Glacier locations reported in both RGI 7.0 and WGI and/or WGMS. Yellow dots: Glacier locations not reported in RGI 7.0 but in WGI and/or WGMS. Coloured boxes refer to areas displayed in (b–e). The location of Tarfala Research Station (TRS) is given as additional spatial reference. (b) Rivgojiehhki is contained in RGI 7.0 (brown shape) and also in WGI and WGMS (yellow and red dots, though with doublettes). (c) Sydtoppen is not contained in RGI 7.0 but in WGI (yellow dot). Sydtoppen is not considered a glacier, although it is referred to as ‘toppglaciär’ (peak glacier) in common Swedish. (d) Unnamed location where WGI indicates a glacier not contained in RGI 7.0. As in RGI 7.0, this feature is not considered a glacier. (e) Unnamed location where WGI indicates as glacier not contained in RGI 7.0. Although small, this feature is considered a glacier and hence included in the list of Swedish glaciers (Table S1, Supplementary material).
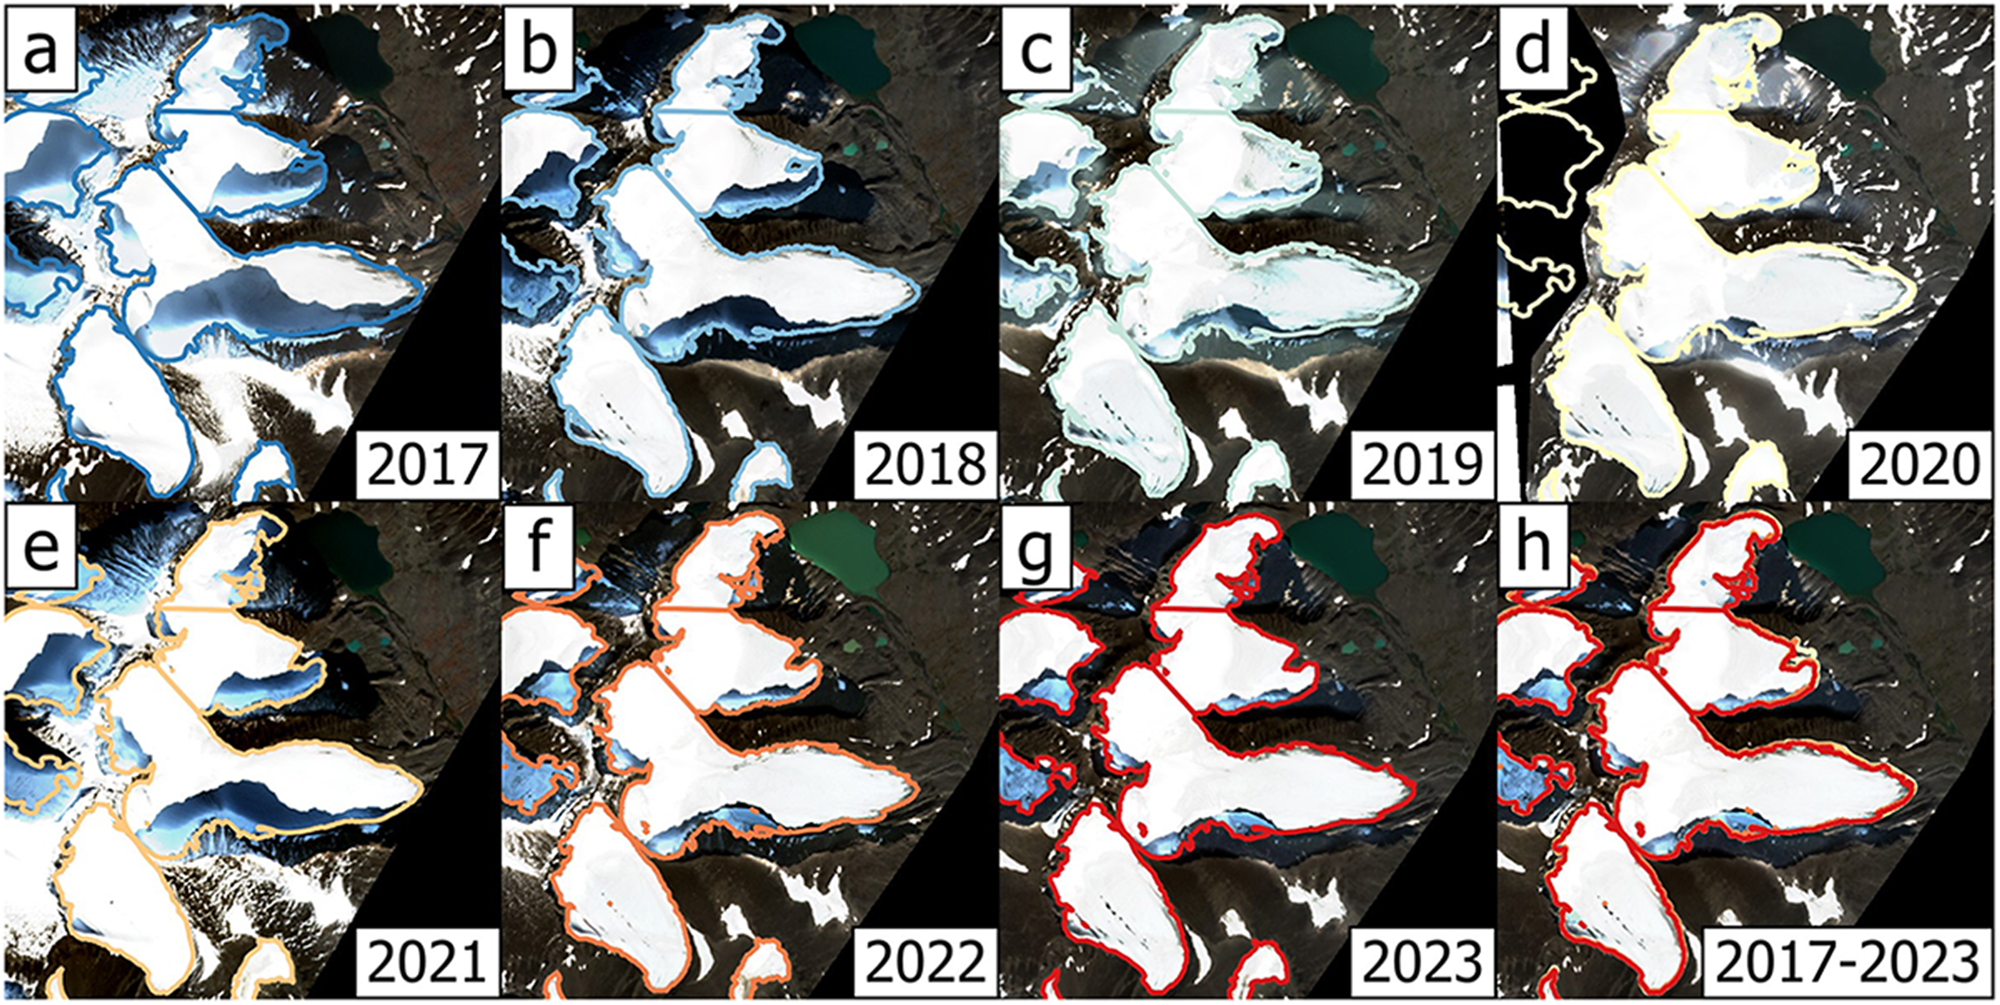
Sequence of Sentinel-2 images for the years 2017–2023, overlain by glacier outlines (here centred on Storglaciären and surrounding glaciers, cf. Figure 1c), illustrating frontal variation. (a–g) show individual years, while (h) displays a synoptic summary of glacier outline variation by overlaying outlines from 2017 to 2023.
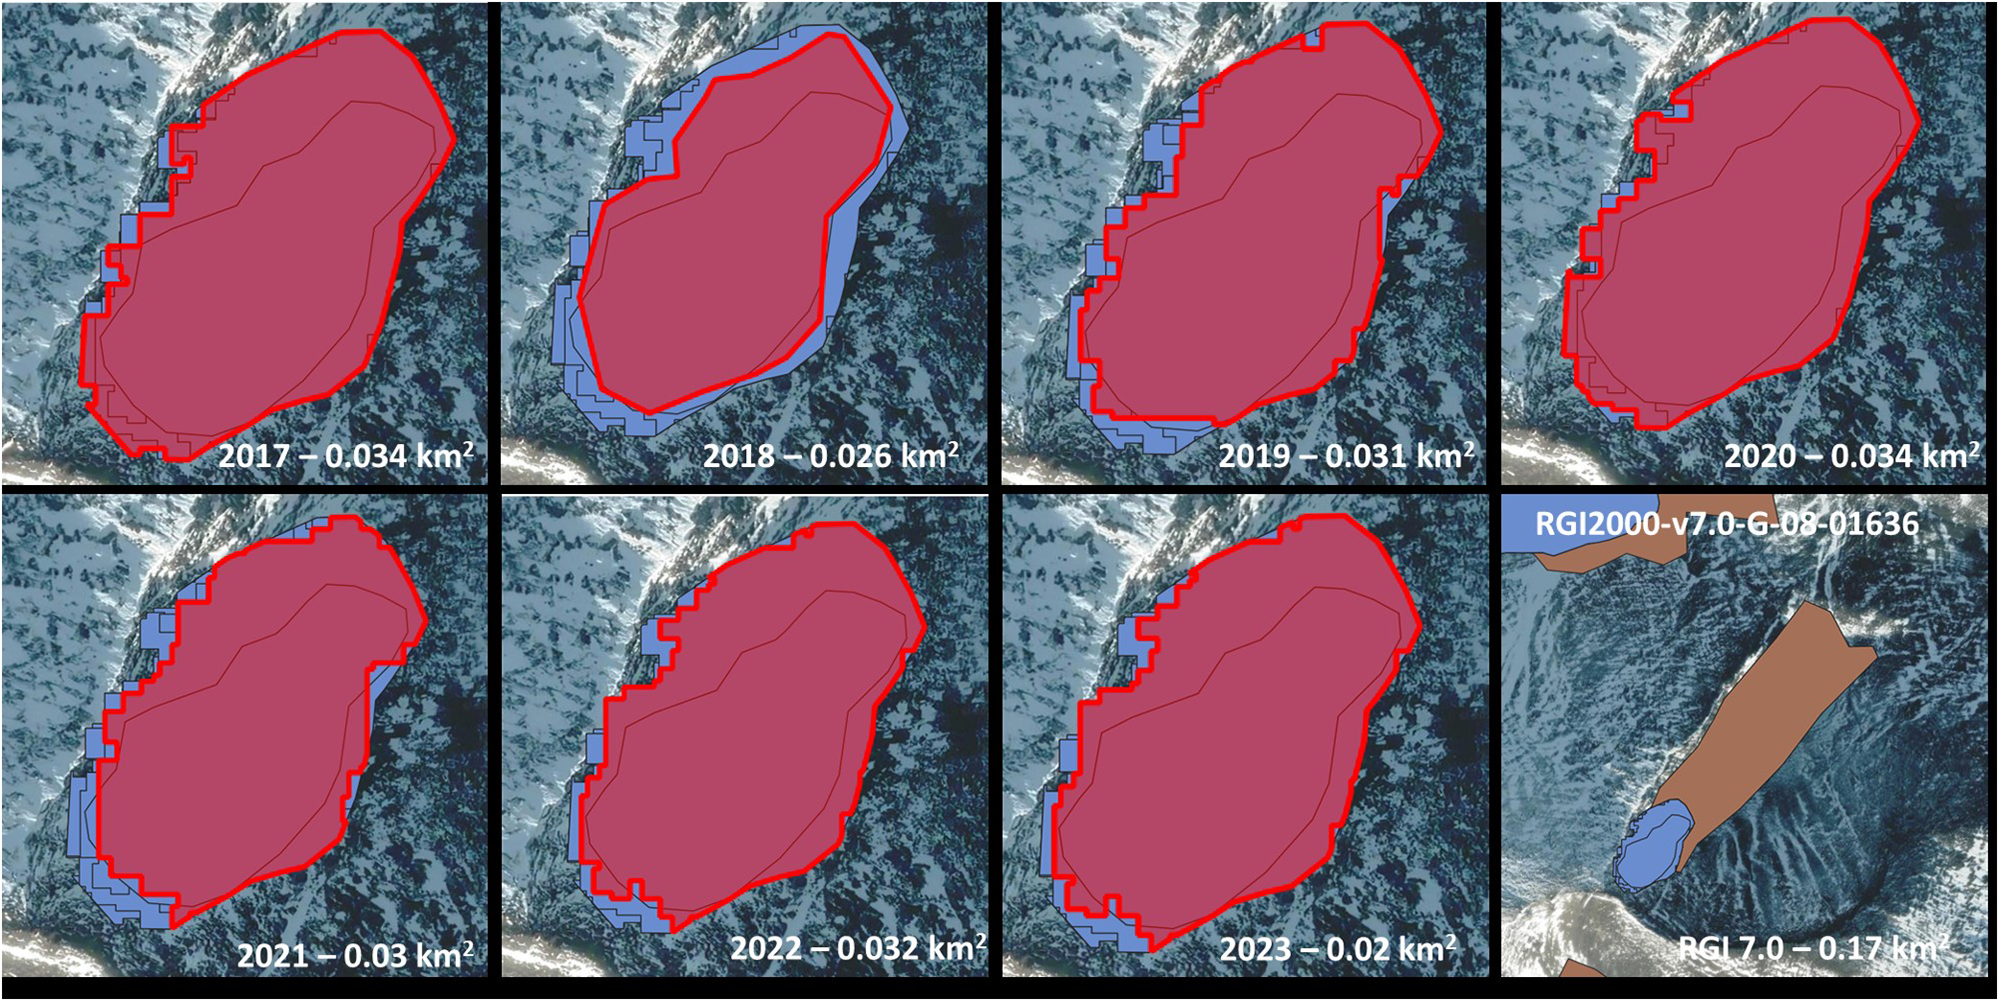
Example of glacier outlines mapped for a small glacier (RGI2000-v7.0-6-08-01636) for the years 2017–2023 with the semi-automated process (red shape in each panel, amended by year and area) compared to the outline of the same glacier as in RGI 7.0 (brown shape, lower right panel, note the difference in scale) with area as of 2002 (note the difference in scale).
Box plots of the directional frontal variation (in metres, at vertical axes), exemplified for the 22 FVP glaciers (cf. Table 1). Lower and upper edges of the blue boxes indicate the 25th and 75th percentiles. Within the blue box, the mean of the data is indicated by a red line. The difference of the 75th and 25th percentile, the interquartile range, is multiplied by a factor of 1.5 to render the whiskers (black marks). Data points outside the range defined by the upper and lower whiskers are considered outliers (marked as red crosses).
Glacier front mapping in 2022. Frontal positions, centre- and multi-centre flowlines are colour-coded according to method used and stated in the legend-panel. Top row (a–c): Background images are from UAV surveys during 2022. Bottom row: Background images are from 2018 orthoimages (d–f) and from a Sentinel-2 image (g), for comparison with Figure 5b. (a) Sydöstra Kaskasatjåkkaglaciären (mapped between 27 August and 11 September 2022). (b) Moarhmmáglaciären (mapped on 4 and 8 September 2022). (c) Kebnepakteglaciären (mapped between 20 August and 10 September 2022). (d) Sydöstra Kaskasatjåkkaglaciären with 2018 fronts as from orthoimage and Sentinel-2. (e) Moarhmmáglaciären with 2018 fronts as from orthoimage and Sentinel-2. (f) Kebnepakteglaciären with 2018 fronts as from orthoimage and Sentinel-2. (g) Kebnepakteglaciären with 2018 fronts as from on orthoimage and Sentinel-2, but against a Sentinel-2 image.
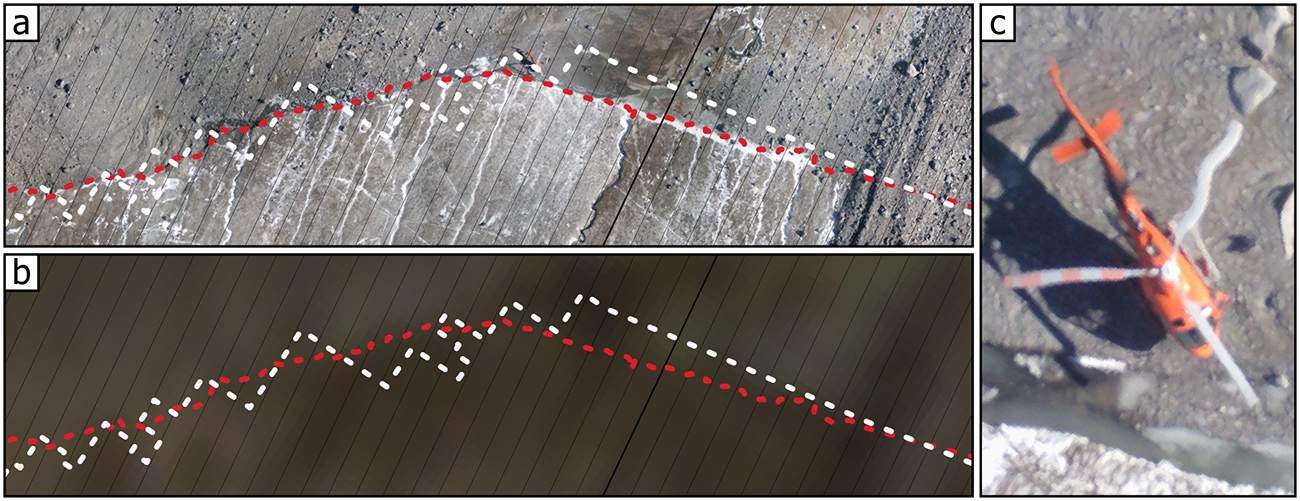
Challenges of glacier front delineation. (a) Image taken during UAV survey, detailing (b) of Figure A6. The surface of the glacier’s frontal region (at the bottom of the picture) is almost of the same colour as the glacier forefield (at the top of the picture). Because of debris cover, glacier and forefield can have exactly the same colour (to the right in the picture). Red stippled line: glacier front as mapped during the UAV survey. White stippled line: Glacier front as mapped from the Sentinel-2 image. (b) Sentinel-2 (true colour) image of the same area shown in (a). The comparatively low spatial resolution prohibits clear distinction of regions based on colour. (c) UAV image of the helicopter, parked at the glacier front in the centre of (a). Due to a malfunctioning camera stabilizer, wind can affect the quality of the acquired images, as illustrated by the apparent distortion of the rotor blades.


 Open access

