


INTRODUCTION
Tuberculosis (TB) is one of the oldest and most widely distributed infectious diseases in the world. The World Health Organization (WHO)-recommended TB strategy known as directly observed treatment short course (DOTS) has resulted in major achievements in TB care and control. Globally, the TB mortality rate has fallen by 41% since 1990 and the world is on track to reach the global target of a 50% reduction by 2015 [1].
Understanding the seasonality of TB epidemics may identify potentially modifiable risk factors and suggest new therapeutics, and many studies have reported the seasonality of TB epidemics [Reference Nelson2, Reference Comstock, O'Brien, Evans and Brachman3]. Previous studies have found that the seasonality of TB epidemics is highest in spring in some locations [Reference Thorpe4–Reference Chi10]. One dominant hypothesis for the cause of a spring peak in TB epidemics is that an increase in the active mass in poorly ventilated and humid rooms facilitates TB transmission [Reference Fares11]. Another alternative hypothesis proposes that vitamin D deficiency resulting from limited sunlight exposure leads to an impairment of host immunological defence against latent bacteria from a winter TB infection [Reference Chan12–Reference Li17]. Identifying risk factors for the seasonality of TB epidemics is imperative for informing people about the importance of proper housing ventilation and the benefits of healthy dietary habits, including a diet rich in vitamin D [Reference Holick16].
Data reported by the WHO's 182 Member States and a total of 204 countries and territories in 2012 indicated that in people diagnosed with TB for the first time, 2·6 million (47%) had sputum smear positive (SSP) pulmonary TB, 1·9 million (35%) had sputum smear negative (SSN) pulmonary TB, 0·2 million (3%) did not have a sputum smear performed and 0·8 million (15%) had extrapulmonary TB [18]. Of the new cases of pulmonary TB, 56% were SSP. One of the primary targets for TB control established by the WHO is to cure 85% of SSP pulmonary TB cases detected, as these are the most infectious cases of TB [1]. In addition, SSP pulmonary TB has traditionally been the focus of both efforts to monitor treatment outcomes and studies using the available data on treatment outcomes in TB patients diagnosed with multidrug-resistant TB. To prevent and predict epidemics of SSP pulmonary TB cases, there is considerable interest in comparing the seasonality of SSP and SSN pulmonary TB cases [Reference Fares11]. To investigate the seasonality of SSP and SSN pulmonary TB cases in detail, it is necessary to apply time-series analysis to time-series data of the number of SSP and SSN pulmonary TB cases.
In China, following the severe acute respiratory syndrome (SARS) outbreak in 2003, a nationwide internet-based infectious diseases reporting system was established, and has accumulated good-quality surveillance data for SSP and SSN pulmonary TB cases [Reference Wang19]. China is one of 22 countries with high rates of TB, with the total number of cases ranking second in the world after India. An investigation of seasonality in SSP and SSN data collected in China might have great significance in the development of worldwide TB control programmes. In the present study, we investigated the seasonality of SSP and SSN pulmonary TB cases in Wuhan, in the centre of China, from 2006 to 2010, with a time-series analysis consisting of maximum entropy method (MEM) spectral analysis and the least squares method (LSM).
METHODS
Data
Notifiable prevalence data of TB
All suspected and confirmed cases of TB observed in Wuhan's hospitals were reported daily to the Chinese Infectious Diseases Reporting System, Wuhan Center for Disease Prevention and Control, using the internet-based infectious disease electronic reporting system [Reference Wang19]. We used daily notifiable data on SSP and SSN pulmonary TB cases in Wuhan, China. The daily data were gathered for a total of 1826 days, from 2006 to 2010 (1826 data points) and included patients' age and sex. Using the daily data gathered from 2006 to 2010, we calculated two types of datasets for the present analysis: (i) weekly notifiable prevalence data (per 100 000 population) calculated with the daily data per week (262 data points) and (ii) monthly data obtained by a count of the daily data per month (12 data points).
Figure 1 indicates the location of Wuhan, China. Wuhan is located in a subtropical wet monsoon climate area where the rainfall is heavy and four seasons are very clearly defined. Based on the assumption of seasons coinciding with weather and temperature patterns in Wuhan, seasons were defined as spring (April), summer (May–September), autumn (October) and winter (November–March).
Locations of Wuhan, Linxia and Guiyang in China.

The process of TB diagnosis
A schematic diagram of the process of diagnosing SSP and SSN pulmonary TB, according to the national TB diagnosis and reporting critera [20] is shown in Figure 2. A patient with pulmonary TB respiratory clinical symptoms [Fig. 2, box (a)] has a sputum smear (SS) test and chest X-ray [box (b)]. Patients were diagnosed with SSP pulmonary TB [Fig. 2, box (A)] based on the following results: (i) a positive SS test and chest X-ray [box (c)] or (ii) a positive SS test and SS cultivation test [box (d)]. A patient with a negative SS test and positive chest X-ray [box (e)] received diagnostic anti-infective treatment [box (f)]. If there was no improvement in clinical symptoms, following diagnostic anti-infective treatment [box (g)], the benefit of treatment was assessed based on the clinical symptoms and chest X-ray [box (h)] and the patient was diagnosed with SSN pulmonary TB [box (B)] or as a pulmonary TB excluded case [box (C)]. A patient whose clinical symptoms improved with anti-infective treatment [box (i)] was excluded from the possibility of being a pulmonary TB case [box (C)]. The number of cases of SSP pulmonary TB [box (A)], SSN pulmonary TB [box (B)], and pulmonary TB excluded cases [box (C)] are regularly reported along with patients' age and sex to the Chinese Infectious Diseases Reporting System, Wuhan Center for Disease Prevention and Control, where the reported numbers in boxes (A–C) are collected and stored.
Schematic diagram of the process of sputum smear (SS) positive and sputum smear negative pulmonary tuberculosis (TB) diagnosis in Wuhan, China. PTB, Pulmonary tuberculosis.

Analysis
Time-series analysis
Spectral analysis
We assumed that the time-series data x(t) (where t = time) were composed of systematic and fluctuating parts [Reference Armitage, Berry and Matthews21]
 $$x( t) = {\rm systematic \ part} + {\rm fluctuating \ part}.$$
To investigate temporal patterns of x(t) in the pulmonary TB prevalence, spectral analysis based on MEM was used to detect periodicities in the time-series data. MEM spectral analysis has a high degree of resolution and is useful to elucidate periodicities within short time series, such as the infectious disease surveillance data used in the present study [Reference Saito22–Reference Sumi25]. MEM spectral analysis produces a power spectral density (PSD) from which we can obtain a power value representing the amount of amplitude of the prevalence data at each frequency (note the reciprocal relationship between the scales for frequency and period). We calculated the power in the small interval of frequencies (f, f + ∆f) (where f = frequency) by integrating the PSD over the interval ∆f. A large magnitude of power at a frequency of 0·25 (1/year), for example, would indicate that a large portion of the amount of amplitude of the prevalence data is expressed as a wave that repeats itself every 4 years. The formulation of MEM-PSD is described in the Appendix.
The validity of the results of MEM spectral analysis was confirmed by calculation of the least squares fitting (LSF) curve X(t) (where t = time) to the original time-series data, with the MEM-estimated periods. The formulation of the LSF curve is described as
 $$X(t) = a_0 + \sum\limits_{n = 1}^{Np} {\left\{ {a_n \sin (2\pi f_n t) + b_n \cos (2\pi f_n t)} \right\},} $$
which is calculated using the LSM for the original time-series data with unknown parameters f n , a 0, a n and b n (n = 1, 2, 3, …, N p ), where f n ( = 1/T n ; Tn is the period) is the frequency of the nth component, a 0 is a constant indicating the average value of the time-series data, a n and b n indicate the amplitude, and N p indicates the total number of components.
The LSM using equation (2) must be nonlinear. Linearization of this nonlinearity is required to obtain unique optimum values of these parameters. In the present analysis, linearization was achieved using the MEM-estimated periods (T n ). The optimum values of parameters a 0, a n and b n (n = 1, 2, 3, …, N p ) in equation (1), with the exception of N p , were determined exactly from the optimum LSF curve [equation (2)] calculated with T n . MEM spectral analysis and the LSM were performed in MemCalc (Suwa-Trust, Japan) [Reference Saito22]. The detailed theoretical background of MemCalc is described in Ohtomo et al. [Reference Ohtomo26].
An outline of the analysis procedure for prediction analysis is described as follows. The details of the procedure for the method were described in our previous work [Reference Sumi25].
-
(1) Setting up time-series data for the analysis. Equal sampling time intervals were chosen, lack of data compensated for, outliers corrected, logarithm transformation performed, and removal of long-term trends within the data performed, if necessary.
-
(2) Determination of f n (MEM spectral analysis). A spectral analysis based on MEM was conducted, and the PSD was obtained. The values of f n in equation (2) were determined by the position of the spectral peak in the PSD.
-
(3) Determination of N p . From the PSD, periodic modes constructing seasonal variations of time-series data were determined.
-
(4) Determination of a 0, a n , and bn (LSF analysis). Using the estimated values of N p and f n , the optimum values of parameters a 0, a n , and b n (n = 1, 2, …, N p ) in equation (2) were determined exactly using the LSM. As a result, the optimum LSF curve for time-series data was obtained.
Statistical calculations
Statistical analysis was performed using SPSS version 15.01J (SPSS Inc., USA), and Pearson's correlation coefficient (γ) and the χ 2 test were used. A P value of 0·05 was considered significant.
RESULTS
Weekly prevalence data of SSP and SSN pulmonary TB
The weekly prevalence data of SSP and SSN pulmonary TB cases, diagnosed according to the process shown in Figure 2, are displayed in Figure 3(a,b), respectively. Therein, the prevalence data for both SSP and SSN indicate a 1·0-year cycle, i.e. the seasonal cycle of disease epidemics, which is largely modulated by irregular shorter-term variations rather than a 1·0-year cycle.
Weekly prevalence data for tuberculosis (TB) cases per 100 000 in Wuhan, China from January 2006 to December 2010. (a) Sputum smear positive (SSP) pulmonary TB cases; (b) sputum smear negative (SSN) pulmonary TB cases.

Age and sex distribution
In Figure 4, the ratios of the prevalence of SSP and SSN pulmonary TB cases to total pulmonary TB cases by age group from 2006 to 2010 are shown. The interval of the age groups in Figure 4 is shown according to the data-recording format used to collect prevalence data for SSP and SSN pulmonary TB cases (Fig. 3). As shown in Figure 4, SSN pulmonary TB cases in children aged <10 years accounted for about 70% of all cases within that age group, and the ratio declined with age. Approaching the 50–70 years age group, the ratios of SSP and SSN pulmonary TB cases to total pulmonary cases became approximately equal. A highly significant statistical correlation was observed between pulmonary TB cases and age (P < 0·05; ⩾85 years): γ = 0·83 for SSP pulmonary TB cases and γ = −0·83 for SSN pulmonary TB cases.
Ratio of sputum smear positive (SSP) pulmonary tuberculosis (TB) cases and sputum smear negative (SSN) pulmonary TB cases to the total number of TB cases by age group in Wuhan, China from January 2006 to December 2010.

The prevalence data for pulmonary TB cases by age group and sex from 2006 to 2010 are displayed in Figure 5 (⩾85 years). As shown, for each sex, the curve of the prevalence data began to rise in the 10–14 years age group, and the first peak of the curve appeared in the 20–24 years age group. Both curves contained troughs in the 25–29 years age group. The curve for males increased with age gradually, whereas that for females remained constant at around 50 cases. The curve for males was higher than that of females for each age group aged >15 years, and the difference in the curves between males and females increased with age. A highly significant correlation was observed between pulmonary TB cases and age for males (γ = 0·93, P < 0·05). By contrast, there was no significant correlation for females (γ = 0·45, P < 0·05).
Prevalence data of sputum smear positive (SSP) and sputum smear negative (SSN) pulmonary TB cases per 100 000 by age and gender in Wuhan, China from January 2006 to December 2010.

Periodic structures of the prevalence of SSP and SSN pulmonary TB
The MEM-PSDs for the prevalence data of SSP and SSN pulmonary TB were calculated, and the semi-log plots of the PSDs (f⩽6·0) are shown in Figure 6(a,b), respectively (unit of f: 1/year). In each PSD, many well-defined spectral peaks were observed. Dominant spectral peak-frequency modes in f⩽12·0 (1 month) were selected in descending order of power of spectral peak and were summarized with the corresponding period and power for each spectral peak in Table 1.
Maximum entropy method-power spectral density (PSD) for the weekly prevalence data for pulmonary TB cases per 100 000 in Wuhan, China from January 2006 to December 2010 (f⩽6·0). (a) Sputum smear positive (SSP) pulmonary TB cases; (b) sputum smear negative (SSN) pulmonary TB cases.

Characteristics of the dominant spectral peaks (f⩽12·0) of PSD (Fig. 6) for SSP and SSN pulmonary tuberculosis in Wuhan, China from January 2006 to December 2010

PSD, Power spectral density; SSP, sputum smear positive; SSN, sputum smear negative.
For both PSDs, prominent spectral peaks were observed at f = 1·0 ( = f 1), corresponding to a 1·0-year period (Table 1). For SSP pulmonary TB, the power of a 6·0-month (0·49-year) cycle was comparable to that of a 1·0-year cycle (Table 1). This result produces the question of whether the 6·0-month periodic mode originates from the harmonics of f 1, the seasonal variation, or a superimposition of both. For SSN pulmonary TB, the power of the 6·0-month (0·5-year) cycle was relatively smaller than that of SSP pulmonary TB (Table 1).
LSF curves
Using equation (1), LSF curves for SSP and SSN pulmonary TB were calculated with 1·0- and 0·5-year periodic modes. The LSF curve for SSP pulmonary TB (Fig. 7 a) had approximately the same amplitude in spring (April) and summer (August–September). The LSF curve for SSN pulmonary TB (Fig. 7 b) demonstrated a bi-modal seasonal cycle, with a dominant peak in spring (April) and a second peak in summer (August–September).
The least squares fitting (LSF) curve calculated with 1·0- and 0·5-year periodic modes for the weekly prevalence data for pulmonary tuberculosis (TB) cases per 100 000 in Wuhan, China from January 2006 to December 2010. (a) Sputum smear positive (SSP) pulmonary TB cases; (b) sputum smear negative (SSN) pulmonary TB cases.

Seasonality of SSP and SSN pulmonary TB cases by age group
To further investigate the seasonality of SSP and SSN pulmonary TB cases, we examined the monthly prevalence data of SSP and SSN pulmonary TB cases from 2006 to 2010 by age group in Figure 8(a,b), respectively: children (0–9 years), youth (10–24 years), middle aged (25–49 years) and the elderly (⩾50 years). The source of the monthly data (Fig. 8) was same as that of the weekly data (Fig. 3). In cases of both SSP and SSN pulmonary TB (Fig. 8 a,b, respectively), the monthly data for youth (10–24 years), middle aged (25–49 years) and the elderly (⩾50 years) demonstrated that they are prevalent throughout the year. With respect to children (0–9 years), the monthly data for both SSP and SSN pulmonary TB (Fig. 8 a,b) indicated very small numbers of cases throughout the year.
Monthly reported number of pulmonary tuberculosis (TB) cases by age group in Wuhan, China from January 2006 to December 2010. (a) Sputum smear positive (SSP) pulmonary TB cases; (b) sputum smear negative (SSN) pulmonary TB cases.

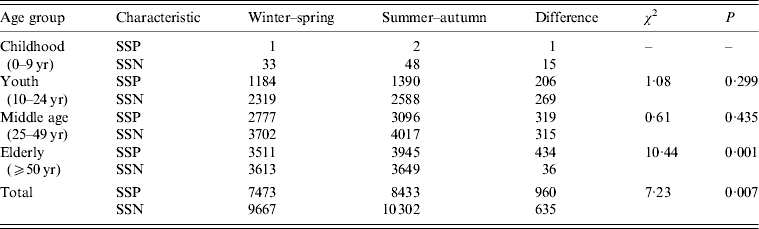
It is notable that, in the case of SSP pulmonary TB (Fig. 8 a), the monthly data for the elderly (⩾50 years) demonstrated the highest prevalence throughout the year compared to the other age groups. For SSN pulmonary TB (Fig. 8 b), the monthly data for the elderly (⩾50 years) peaked in spring (April) and gradually declined towards winter with a slight increase in summer (September). For the elderly, the monthly data for winter–spring (November–April) and summer–autumn (May–October) showed a significant difference between SSP and SSN pulmonary TB cases (χ 2 = 10·44, P < 0·05) (Table 2). By contrast for youth (10–24 years) and the middle aged (25–49 years), the monthly data for winter-spring (November–April) and summer–autumn (May–October) showed no significant difference between SSP and SSN pulmonary TB cases (χ 2 = 1·08 for youth, χ 2 = 0·61 for middle aged; P < 0·05).
χ 2 test for the difference in seasonal distribution between the case of winter–spring (November–April) and that of summer–autumn (May–October) of SSP and SSN pulmonary tuberculosis by age group
SSP, Sputum smear positive; SSN, sputum smear negative.
DISCUSSION
In China, TB is one of the most frequently reported infectious diseases along with hepatitis and dysentery; however, a marked reduction in TB cases and related deaths has been achieved. Between 1990 and 2010, the prevalence rate was halved, the mortality rate was cut by almost 80% and the incidence rate fell by 3·4% per year. A previous observational investigation of the seasonality of TB in China visually confirmed that higher numbers of TB infections were reported during winter–spring [Reference Yang27]. In contrast, the present analysis enabled us to elucidate multiple periodicities of seasonal variations in SSP and SSN pulmonary TB cases in detail (Table 1). As a result, we obtained a significant result indicating that the seasonality of SSP and SSN pulmonary TB cases in Wuhan differs (Fig. 7 a,b); in SSP pulmonary TB cases, the height of the summer peak approximated that of the spring peak (Fig. 7 a), and in SSN pulmonary TB cases (Fig. 7 b), the summer peak was lower than the spring peak. Similar to Wuhan (Fig. 7 a,b), spring peaks of SSP and SSN pulmonary TB epidemics have been observed in other countries and regions, including North India [Reference Thorpe4], Spain [Reference Luquero5], Ciskei of Central Africa [Reference Shennan6], Kuwait [Reference Akhtar and Mohammad7], Japan [Reference Nagayama and Ohmori8], South Africa [Reference Naranbat9] and Mongolia [Reference Chi10]. Regarding the cause of the spring peak of TB epidemics in Wuhan (Fig. 7), the following reasons can be considered in view of the environmental conditions in Wuhan in winter: (i) an increase in the active mass in poorly ventilated and humid rooms [Reference Fares11] and (ii) vitamin D deficiency resulting from limited sunlight exposure [Reference Chan12–Reference Li17].
(i) An increase in active mass in poorly ventilated and humid rooms. In Wuhan, poorly ventilated and humid rooms are most prevalent in rural areas, whereas in urban areas, the majority of the population have air conditioning to maintain room ventilation. Wuhan consists of 13 districts, with a total population of 10·0 million in 2011. Of the 13 districts in Wuhan, seven are urban areas with about 6·5 million residents. To investigate the contribution of the environmental conditions to the seasonality of TB epidemics in Wuhan, it is important to examine the environmental conditions of the urban and rural areas. Thus, there is the possibility of conducting time-series analyses of prevalence data for SSP and SSN pulmonary TB cases in the 13 districts in Wuhan.
(ii) Vitamin D deficiency resulting from limited sunlight exposure. Vitamin D status is generally assessed by measuring circulating concentrations of 25-hydroxyvitamin D (25(OH)D) [Reference Lin28]. A low level of serum 25(OH)D concentration resulting from limited sunlight exposure can impair the host's immunological defence against latent TB from a winter TB infection [Reference Chan12–Reference Li17]. Latitude is clearly associated with sunlight exposure [Reference Ponsonby29], and a negligible level of serum 25(OH)D concentration occurs during the winter months for people living at latitudes higher than 40° N [Reference Calvo and Whiting30]. More recently, it was pointed out that the serum 25(OH)D concentration depends on the incident angle of the sun and thus on latitude [Reference Wacker and Holick31]. As a result, above a latitude of about 33° N, the serum 25(OH)D concentration is very low or absent during most of the winter. China extends from latitude 47° N to 23° N; as a consequence, incident sunlight intensity and serum 25(OH)D concentrations vary widely. No study has reported the level of serum 25(OH)D concentrations for the population in Wuhan, which is located at 30° N, although some studies have focused on other populations in China. In the case of the population in Guiyang (26° N, Fig. 1), which is located below Wuhan, the high 25(OH)D level was commonly found in healthy adult males [Reference Zhang32]. For the population in Linxia (36° N, Fig. 1), which is located above Wuhan, the 25(OH)D level was not associated with all-cause or cause-specific mortality rates [Reference Lin28]. Thus, it is possible that the 25(OH)D level does not vary with latitude in China, indicating that no latitude gradient exists for the seasonality of TB. This lack of latitude gradient at the 25(OH)D level may be because air pollution in China absorbs ultraviolet B radiation and thus even living at lower latitude with significant air pollution can markedly reduce the 25(OH)D level throughout the year. For Chinese mega-cities including Wuhan, air quality has improved despite the rapid growth of the economy, whereas particulate concentrations of particular matter (PM) such as PM2·5 and PM10 are still far above the World Health Organization's Air Quality Guidelines [Reference Chan and Yao33–Reference Qian35]. To understand the effect of the 25(OH)D level on the prevalence of TB in China, it is necessary to conduct a systematic study to examine the effect of latitude on TB seasonality for all of China.
Recently, it was noted that a clinical respiratory infection, such as influenza, may increase susceptibility to TB infection and/or disease progression [Reference Willis36]. In Wuhan and most cities of southern China, influenza epidemics peak in summer (August–September) in addition to winter (January–February) [Reference Nelson15]. Thus, the dominant summer peak of SSP pulmonary TB cases (Fig. 7 a) may be associated with the temporal patterns of influenza epidemics in Wuhan. Based on the result shown in Figure 8 a, in which monthly data show the highest prevalence throughout the year for the elderly (⩾50 years), the large peaks observed in summer for SSP pulmonary TB (Fig. 7 a) may result from elderly patients with subclinical SSP pulmonary TB presenting with severe respiratory symptoms because of summer influenza infection (Fig. 7 a). Further time-series analyses of the prevalence of SSP pulmonary TB and influenza in other regions of the world may elucidate the possible relationship between the two diseases or other disease-modulating factors. This hypothesis should be investigated in future research.
As shown in Figure 5, males demonstrated higher prevalence rates than females, but the reasons are not very clearly understood [37]. Possible explanations could be offered in terms of social and behavioural differences between males and females in Wuhan. For example, males have more chances to work outside and to acquire TB infections than females. In addition, males are more likely to smoke, drink alcohol, and take drugs, which can stimulate latent TB infection to become symptomatic. However, female TB patients are not likely to seek medical advice, leading to the underestimation of TB cases [Reference Holmes38–Reference Rhines40]. The hypothesis that the risk of TB infections is associated with social and behavioural differences between the sexes needs to be tested in future research.
The purpose of the present study is to extract practical implication as seasonal variations from the prevalence data for SSP and SSN pulmonary TB cases in Wuhan, including a variety of complex phenomena, by using MemCalc [Reference Wang19]. Most surveillance data are gathered by passive surveillance, which is the most common type of surveillance in humanitarian emergencies, although there are different risk factors contributing significantly to the causation of SSP and SSN pulmonary TB, e.g. malnutrition, crowded housing, poverty, latent period, etc. [Reference Kaslow, Evans, Evans and Kaslow41]. With a mechanism of SSP and SSN pulmonary TB transmissions in Wuhan, it is possible that the risk factors can affect the SSP and SSN pulmonary TB epidemics and play an important role in the temporal epidemic patterns. To understand the underlying cause of SSP and SSN pulmonary TB in Wuhan, it is necessary to conduct a systematic study to investigate the impact of the risk factors on SSP and SSN pulmonary TB epidemic patterns. For this, it is considered that the Susceptible-Exposed-Infective-Recovered (SEIR) model, which is a well-known mathematical model of infectious disease epidemics, might be useful. By using the SEIR model, Aron & Schwartz interpreted the biennial cycle for measles epidemics as the effect of seasonal variation in contract rate in school-aged children [Reference Aron and Schwartz42]. It is thus expected in the future that some kind of theoretical procedure such as the SEIR model will contribute to the investigation of risk factors of SSP and SSN pulmonary TB transmissions and the estimation of their correlations with SSP and SSN pulmonary TB epidemics.
In conclusion, we confirmed differences in the seasonality of the prevalence data for SSP and SSN pulmonary TB cases in Wuhan (Fig. 7 a,b, respectively). To control SSP pulmonary TB cases, which are a particularly important source of infection, it is necessary to investigate the periodic structures of the temporal patterns of SSP and SSN pulmonary TB cases individually, as conducted in the present study. It is anticipated that the present method of time-series analysis consisting of MEM spectral analysis and the LSM will further contribute to the investigation of the seasonality of SSP and SSN pulmonary TB epidemics.
APPENDIX
MEM-PSD [P(f), where f represents frequency] for the time series with equal sampling interval ∆t, can be expressed by
 $$P\left( f \right) = \displaystyle{{P_m \Delta t} \over {\left| {1 + \sum\limits_{k = - m}^m {\gamma _{m.k} \exp \left[ { - i2\pi fk\Delta t} \right]}} \right|^2}}, $$
where the value of P m is the output power of a prediction-error filter of order m and γ m,k is the corresponding filter order. The value of the MEM-estimated period of the nth peak component T n = 1/f n (where f n is the frequency of the nth peak component) can be determined by the positions of the peaks in the MEM-PSD.
ACKNOWLEDGEMENTS
This study was supported in part by a Grant-in-Aid of Scientific Research (grant nos. 25 460 769 and 22 406 017) from the Ministry of Education, Culture, Sports, Science, and Technology of Japan.
DECLARATION OF INTEREST
None.



