

Between 2009 and 2013, U.S. farm incomes grew rapidly, but in 2014, after global commodity prices began to soften, net farm incomes started to decline (Patrick, Kuhns and Borchers Reference Patrick, Kuhns and Borchers2016). Improvements in traditional financial indicators in the previous period, such as rate of return on assets (ROA) and debt-to-asset (D/A) ratios, quickly eroded as a result of these lower commodity prices (particularly in the crop sector) coupled with stable sector expenses. Farms and ranches that were highly leveraged (a number near 20-year highs) were left at risk (Patrick, Kuhns and Borchers Reference Patrick, Kuhns and Borchers2016). This historically repeating cycle of “booms and busts,” commonly affiliated with the globalization of commodity prices, is a model that some farm operations have chosen to move away from, either through diversification, high-value crops, or business models that require more labor-intensive marketing practices (Hoppe and MacDonald Reference Hoppe and MacDonald2015).
Both direct (e.g., farmers markets, road side stands, community-supported agriculture) and intermediated (e.g., sales to retail, institutions or regional distributors) markets are examples of market diversification that may be appropriate for differentiated, specialty, or value-added crop and livestock enterprises. In 2012, 7.8 percent of U.S. agricultural producers participated in direct or intermediated markets (Low et al. Reference Low, Adalja, Beaulieu, Key, Martinez, Melton, Perez, Ralston, Stewart, Shuttles, Vogel and Jablonski2015). This trend is notable because the agricultural sector is increasingly defined by its bimodal structure, with a few large farms supplying high-volume channels that reward economies of scale, while a much greater number of small farms may be more focused on local and regional or other highly differentiated markets. Indeed, 85 percent of farms that participated in direct and intermediated markets in 2012 had gross cash farm income under $75,000 (Low et al. Reference Low, Adalja, Beaulieu, Key, Martinez, Melton, Perez, Ralston, Stewart, Shuttles, Vogel and Jablonski2015).
Direct and intermediated markets are purported to provide viable markets for farms and ranches that need to derive a premium over commodity prices because they do not have the scale to participate in the traditional supply chain. However, there is evidence of the heterogeneous performance of these markets. While local and regional food markets as a whole have experienced significant growth since 2002, growth in some subsectors appears to be slowing, particularly in direct-to-consumer outlets. Indeed, despite a 5.5 percent increase in the number of farms using direct-to-consumer marketing outlets between 2007 and 2012, there was no change in overall sales (Low et al. Reference Low, Adalja, Beaulieu, Key, Martinez, Melton, Perez, Ralston, Stewart, Shuttles, Vogel and Jablonski2015).
Given the slowing growth and challenges of direct-to-consumer marketing (Tropp, Ragland, and Barham Reference Tropp, Ragland and Barham2008), accessing intermediated markets that are more likely to provide adequate returns on investment is key. Yet, it may be difficult for small and mid-sized farms to scale up as supply chains become more vertically integrated and consolidated (e.g., Richards and Pofahl Reference Richards and Pofahl2010, Sexton Reference Sexton2010). To facilitate market access for small- and mid-scale farms, public agencies and private foundations are increasingly financing and promoting food value chain businesses that operate post farmgate. Between 2009 and 2014, the U.S. Department of Agriculture (USDA) invested over $1B, supporting over 44,000 local food projects nationwide, many of which are focused on developing appropriately scaled infrastructure to support intermediated sales (Vilsack Reference Vilsack2016). Indeed, the largest area of growth in local food sales is attributed to sales through intermediated marketing channels such as cooperatives and food hubs (accounting for $3,349,000 of $6,113,000 in total local food sales in 2012) (Low et al. Reference Low, Adalja, Beaulieu, Key, Martinez, Melton, Perez, Ralston, Stewart, Shuttles, Vogel and Jablonski2015).
Understanding the financial implications for farms and ranches selling through these differentiated channels has been difficult historically due to the lack of data. For traditional marketing channels, financial indicators are reported each year in the USDA Agricultural Resource Management Survey (ARMS). Before 2008, data were reported by state and by commodity, but not by market channel. Accordingly, available evidence of market performance for these direct and intermediated channels was limited to a handful of case studies that examined differential farm expenditures and sales by market channel (Hardesty and Leff Reference Hardesty and Leff2010, LeRoux et al. Reference LeRoux, Schmit, Roth and Streeter2010, and Jablonski and Schmit Reference Jablonski and Schmit2015) and a study that examined the impact of participation in direct marketing on the distribution of farm sales (Park Reference Park2015).
Recently, however, the ARMS sample size for farms and ranches participating in direct and intermediated marketing channels became large enough to conduct more detailed analyses of financial indicators. Low et al. (Reference Low, Adalja, Beaulieu, Key, Martinez, Melton, Perez, Ralston, Stewart, Shuttles, Vogel and Jablonski2015) use ARMS data to examine the impacts on financial performance of participation in these markets and present conflicting evidence: all farms, regardless of scale, are significantly more likely to survive (defined by the USDA as a farm business with positive sales in both 2007 and 2012) if they have local food sales as part of their marketing portfolio; however, above the $9,999 sales category, farms grew at a significantly slower rate compared to farms that did not use these channels.
The objective of this research is to explore how key factors (i.e., scale, commodity and location) and participation in direct and intermediated marketing channels influence the financial performance of farms and ranches. Accordingly, we divide the sample of local and regional food marketers into quartiles segmented by their profitability performance (defined as ROA) as an initial exploration of how strong and weak performance may vary across scale, location, and choice of direct and intermediated channels.
In addition, several other key financial metrics that vary by scale-based quartiles are presented to inform the discussion. For example, this research gives more focused attention to the role of debt and labor in order to understand whether or not those operations focused on more marketing-intensive strategies exhibit different behavior than traditional farm operations. Overall, this benchmark analysis provides insights into whether or not there is evidence that those choosing to operate in local and regional food markets have business strategies that alter the underlying financial, cost, and scale efficiencies using high and low performers as indicators of success and failure.
Background Research and Literature
Structure of U.S. Farms
The USDA has a long history of tracking the structure of U.S. farms, and there has been a consistent trend towards a bimodal pattern. Hoppe (Reference Hoppe2014) reported that small family farms make up 90 percent of the U.S. farm count but produce a 26-percent share of farm output, whereas midsize and large-scale family farms account for eight percent of U.S. farms but 60 percent of the value of production. Despite their modest share of farm output, small farms operate half of U.S. farmland and play key roles in several commodities, including producing roughly half of poultry, hay, and other livestock commodities (Hoppe Reference Hoppe2014). Accordingly, there is focused attention on the financial performance of these operations.
Hoppe and MacDonald (Reference Hoppe and MacDonald2015) find a strong relationship between farm scale and operating profit margin (OPM, the ratio of operating profit to gross farm income)—a measure commonly used to assess financial performance. In 2013, 69 percent of all U.S. farms were in the OPM critical zone (defined as less than 10 percent of the farm's gross cash farm income from the sale of commodities and other farm-related goods and services, together with government payments), of these, 87 percent had gross cash farm income less than $100,000. In general, small farms (under $350,000 in gross cash farm income) are less profitable than larger farms due to large farms’ abilities to take advantage of economies of scale. Hoppe and MacDonald (Reference Hoppe and MacDonald2015) provide two key elements of how these small-scale operators are able to remain in business given the large number in the OPM critical zone: (1) undervaluing operator labor and (2) receiving substantial off-farm income. We posit another potential factor: choice of marketing channels.
The USDA ERS, in a 2014 report on farm structure and finances, found that family farms become more diversified as their size increases: between 35 and 58 percent of family farms with gross cash farm income of $150,000 or more produced four or more varieties, compared to less than 10 percent of smaller family farms (Hoppe Reference Hoppe2014). However, they do not consider market channel selection in their consideration of diversification, and market diversification may have a differential influence on financial outcomes depending on the scale of operation, reflecting an important point of consideration. Selling through local markets may be a means through which small-scale operators can secure higher per-unit value for their products (Hardesty and Leff Reference Hardesty and Leff2010, LeRoux et al. Reference LeRoux, Schmit, Roth and Streeter2010).
Exploring Comparative Advantage for Small-Scale Firms
There is a substantial literature that considers comparative advantage for small-scale firms. Hammeresh, Anderson, and Harris (Reference Hammeresh, Anderson and Harris1978) found that a small market share is not necessarily a handicap; it can be a significant advantage that enables a company to compete in ways that are unavailable to its larger rivals. The authors identify and analyze characteristics that help explain how firms with low market share are able to be financially successful and note that these firms compete only in areas where their particular strengths are most highly valued and eschew growth for growth's sake. As most businesses must compete in a limited number of segments within their industry, they must choose these segments carefully: most successful companies define market segments in unique and creative ways. For example, in addition to products and customers, a market can be segmented by level of customer service, stage of production, price performance characteristics, credit arrangements with customers, location of plants, characteristics of manufacturing equipment, channels of distribution, and financial policies.
Kim and Lee (Reference Kim and Lee2010) consider how a responsive supply chain that adds value to customer satisfaction, quality improvements, new product introduction, service level improvements, and lead-time reduction could be a comparative advantage for small-scale enterprises. Strategic collaboration can support a responsive supply chain as collaboration between supply chain partners at the strategic level indicates a strong commitment to buyers and encourages a more responsive supply chain. Value chain models of market intermediation, developed in part to enhance small- and mid-scale producers’ ability to capture price premiums in the marketplace for the environmental, economic, and social benefits embedded in the products, suggest these are some of the actions increasingly present in local and regional food systems (Hardesty et al. Reference Hardesty, Feenstra, Visher, Lerman, Thilmany McFadden, Bauman, Gillpatrick and Nurse-Rainbolt2014).
Farm Debt Usage, Survivability, and Scale
One major concern for the USDA is small family farms’ ability to access and appropriately use capital. In 2014, small family farms held 71 percent of farm assets and 80 percent of farm debt (Patrick, Kuhns and Borchers Reference Patrick, Kuhns and Borchers2016). One solvency ratio commonly used by the USDA ERS, the D/A ratio, was 12.26 in 2015, up from 11.75 the year before (USDA ERS 2016). Hoppe reported that small family farms had D/A ratios between 0.1 and 4.5, depending on farm type. This is compared to mid-sized and large/very large family farms with D/A ratios at 8.4, 12.2, and 21.8, respectively (Hoppe Reference Hoppe2014).
Low et al. (Reference Low, Adalja, Beaulieu, Key, Martinez, Melton, Perez, Ralston, Stewart, Shuttles, Vogel and Jablonski2015) conclude that direct marketing was associated with higher survival rates, a measure of particular interest when considering beginning farms and ranches. One reason for this may be due to lean management strategies. Given, as mentioned above, that 85 percent of farms that participated in direct and intermediated markets in 2012 had gross cash farm income under $75,000, local food system participants may purchase less machinery and land than did those with traditional marketing, and instead, lease such assets as a means of managing cash flows. Consequently, local food market channel participants may not need to leverage as much of their wealth to obtain financing. Lower leverage translates to repayment capacity, thereby reducing the risk of small business failure (Fotopoulos and Louri Reference Fotopoulos and Louri2000).
Profits fluctuate widely in commodity markets because of changes in input and output prices and yields, something that direct marketing strategies can mitigate (through risk-sharing models such as community-supported agriculture or price negotiating options commonly allowed in intermediated markets such as food hubs). Moreover, local and regionally focused producers assume additional supply chain functions (e.g., marketing, processing, distribution) (King et al. Reference King, Hand, DiGiacomo, Clancy, Gomez, Hardesty, Lev and McLaughlin2010). Through taking on these additional roles they receive some of their income from these post farmgate activities; farm income risk may be better managed in these markets.
Previous research on fresh produce price determination found that supply is fixed when price is above marginal harvesting costs, and that any surplus returns above the cost of harvesting are divided among buyers and sellers according to their relative bargaining power in the market (Sexton and Zhang Reference Sexton and Zhang1996). In cases where products are slightly more storable, producers have some ability to control supply, and so the relative bargaining position of growers, shippers, and retailers may vary (Richards and Patterson Reference Richards and Patterson2003). However, Richards and Patterson (Reference Richards and Patterson2003) note that consolidation, vertical integration, and the large scale of many food retailers and distributors are perceived as threats for the producer-supplier's bargaining position, particularly for perishable products such as produce, dairy, and eggs. Accordingly, direct markets are commonly referenced as one mechanism for producers to regain control of their bargaining power by integrating more phases of the food supply chain into their own operations.
Financial Performance and Market Channel
Previous studies explored farm success or financial performance in traditional commodity markets, and in general, financial efficiency, leverage, and farm size were found to be negatively related to mean financial performance (e.g., Ford and Shonkwiler Reference Ford and Shonkwiler1994). Beyond scale, the nature of commodities may also suggest that different marketing strategies will affect market success, and thus, financial viability.
A handful of research uses national data to examine the farm and ranch profitability impacts of sales through local markets. Park (Reference Park2015) examined the impact of participation in direct marketing on the distribution of farm sales using the unconditional quantile regression estimator and endeavored to evaluate the distributional impacts, rather than just assess the means of the sample. Results show lower sales commonly associated with direct marketing enterprises are somewhat mitigated by the scale of the operation; scaling up (at least to some degree, even if not at the scale required to compete in commodity markets) may be an essential element in attaining viability. Park and Lohr (Reference Park and Lohr2010) found that organic producers who participate in local direct marketing channels tend to achieve lower earned income, suggesting that relative dependency on local sales may correlate with negative financial outcomes.
As mentioned above, Low et al. (Reference Low, Adalja, Beaulieu, Key, Martinez, Melton, Perez, Ralston, Stewart, Shuttles, Vogel and Jablonski2015) show that all farms, regardless of scale, are more likely to survive if they have local food sales as part of their marketing portfolio. However, similar to the Park (Reference Park2015) and Park and Lohr (Reference Park and Lohr2010) results, these farms grew at a significantly slower rate compared to farms that did not use these channels.Footnote 1 Vogel, Jablonski, and Schmit (Reference Vogel, Jablonski and Schmit2016) also use ARMS data to show that small-scale farms using local markets (<$350,000 in gross cash farm income) are significantly more likely to have a positive operating expense ratio and that a greater percentage are profitable than those using only commodity markets. However, they find that this trend reverses once farms exceed $350,000 in gross cash farm income.
Park, Mishra, and Wozniak (Reference Park, Mishra and Wozniak2014) developed a multinomial logit model to assess the relationship between direct markets and financial performance. They find that farmers using direct-to-consumer-only outlets report sales that are significantly lower than from other direct marketing strategies, such as using intermediated only or both direct-to-consumer and intermediated. Of note, they also assess the role that management and marketing skills play in the selection of direct-to-consumer markets. They find that producers with a broader portfolio of management skills—such as more ways to control input costs—were more likely to rely on intermediated retail outlets only or to diversify into both direct-to-consumer and intermediated retail marketing outlets. Finally, a set of exploratory market channel assessments conducted across several states show labor requirements are a major determinant of profitability for small-scale fruit and vegetable producers when comparing different market channels (Hardesty and Leff Reference Hardesty and Leff2010, LeRoux et al. Reference LeRoux, Schmit, Roth and Streeter2010, Christensen et al. Reference Christensen, Thilmany, Jablonski, Sullins and Naasz2017). Because this is a notable pivot from the labor-saving strategies used by commodity operations, the role of labor in financial performance is worth exploring further. In summary, the results from this study provide further evidence of the heterogeneous factors that may drive participants in local food markets.
Empirical Analysis
Research on the competitive position of agricultural producers has generally focused on the structure of the food system, with USDA ERS reports concentrating on the relative size of farms within the farm sector (Hoppe Reference Hoppe2014). The USDA commonly benchmarks agricultural producers across a wide range of production and financial measures (e.g., Hoppe Reference Hoppe2014, Burns and Kuhns Reference Burns and Kuhns2016), and segments them by several characteristics (i.e., size, commodity, farm location, age of operator). This paper represents the first time that the benchmarking has also focused on the marketing channel of the agricultural firm, which complements work exploring the different types of producers participating in direct and intermediated markets (Jablonski and Schmit Reference Jablonski and Schmit2015, Low et al. Reference Low, Adalja, Beaulieu, Key, Martinez, Melton, Perez, Ralston, Stewart, Shuttles, Vogel and Jablonski2015).
Although financial metrics are only one way to measure competitiveness, analysis of USDA ARMS data subsamples report that selling into direct and/or intermediated markets is a useful first step to help inform the literature on a more diverse range of comparative advantages across scale and market orientation. A conceptual model that considers why one would expect a variety of factors to vary among farms marketing in direct and intermediated markets can be developed based on past work on small-scale enterprises, and in particular, those choosing to participate in markets where farm income risk may be managed, and lean management strategies are possible.
A Conceptual Model: Benchmarking Financial Performance against Market Orientation
Bauman et al. (Reference Bauman, Shideler, Thilmany, Taylor and Angelo2014) developed a generalized typology of marketing channels that represent strategic market choices or decisions from which farmers would choose depending on the best fit for their business (see Figure 1). The set of marketing strategies is divided into four quadrants using sales volume as the horizontal dimension and value-added (operating profit margin) per unit of sales as the vertical dimension. The types of marketing strategies are ordered to represent common evolutionary steps that operations may take if their current marketing choice or portfolio evolves with plans to expand or decrease in scale, perhaps as new marketing opportunities appear or financial challenges arise.
Typology of Food Marketing Strategies by Sales Volume and Profit Margin
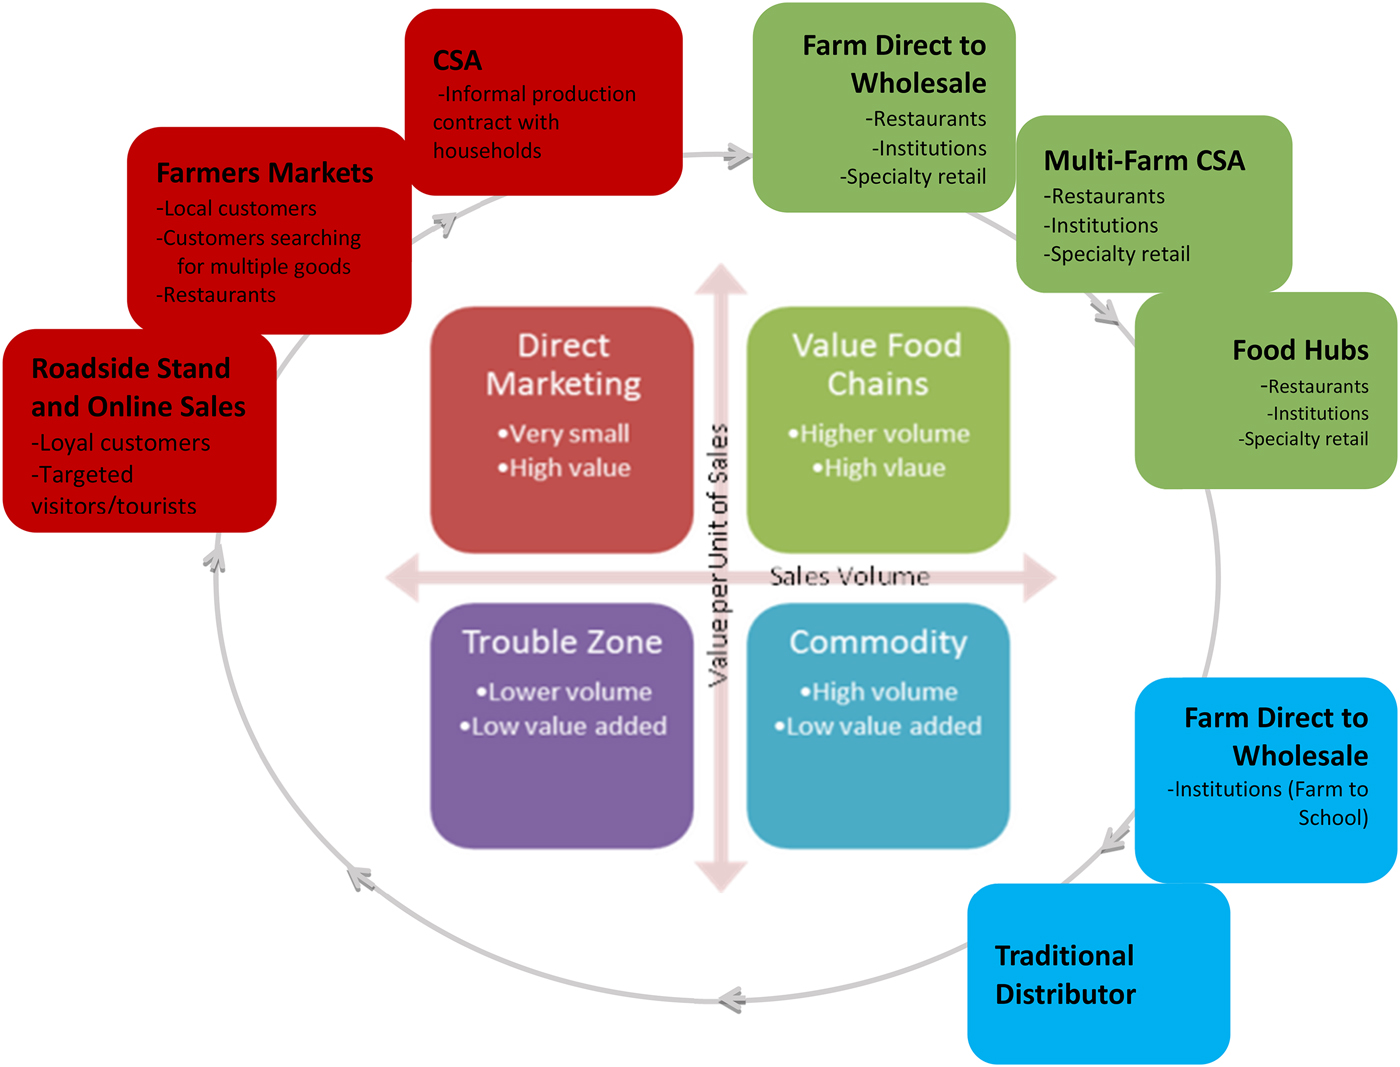
The business models shown in the top two quadrants of Figure 1 are the focus of this article, because they correspond most directly to the direct-to-consumer and intermediated sales models found in local and regional food systems. Importantly, as reported by Low et al. (Reference Low, Adalja, Beaulieu, Key, Martinez, Melton, Perez, Ralston, Stewart, Shuttles, Vogel and Jablonski2015) and Park, Mishra, and Wozniak (Reference Park, Mishra and Wozniak2014), a portfolio of these marketing strategies, rather than just direct sales, may correspond to a positive influence on the financial viability of a farm enterprise.
The literature on potential comparative advantages sought by small-scale enterprises, more thoroughly described above, suggests that a targeted focus on the market segments they can best serve with responsive supply chains may be key (Hammeresh, Anderson and Harris Reference Hammeresh, Anderson and Harris1978, Kim and Lee Reference Kim and Lee2010). However, research on farm operations participating in direct marketing have reported mixed effects in terms of financial performance and survivability (Park and Lohr Reference Park and Lohr2010, Low et al. Reference Low, Adalja, Beaulieu, Key, Martinez, Melton, Perez, Ralston, Stewart, Shuttles, Vogel and Jablonski2015, Park Reference Park2015). Perhaps that is due to the fact that any analysis of an average producer in this sector may mask the subtle differences among segments that are performing well by participating in direct and intermediated markets. Figure 2 represents one of the many tradeoffs that may be faced by producers who manage their own marketing supply chains.
Tradeoffs between Efficiency and Customer Service

On the vertical axis, there is a consideration of the scale efficiencies that may be realized (or lost) depending on the volume of sales a market can provide to a farm operation. Further, the sizeable share of small producers participating in direct and intermediated markets who have been labeled as “lifestyle farms” (less than $10,000 in gross cash farm income), may bias findings downward. An analysis of performance by segment facilitates discovery of those who can achieve a viable scale in local and regional markets.
On the horizontal axis, the customer service and responsiveness attributes that may allow farm operations to compete in the marketplace can be varied. Whereas minimal marketing effort may be required for participation in commodity markets, a high level of effort is required for producers who want to better control their prices and customer loyalty. Direct-to-consumer markets are held up as a way for consumers and buyers to reconnect with their food source, support their local economy, and secure higher or more consistent quality products (Thilmany McFadden Reference Thilmany McFadden2015, Vilsack Reference Vilsack2016). Even when scaled up to intermediated markets, research on value chains has begun to show examples of how such assurances may be maintained (Hardesty et al. Reference Hardesty, Feenstra, Visher, Lerman, Thilmany McFadden, Bauman, Gillpatrick and Nurse-Rainbolt2014, Angelo, Jablonski, and Thilmany Reference Angelo, Jablonski and Thilmany2016). Through our analysis of USDA ARMS data, we explore differences across the share of production costs invested in labor as one potential proxy for customer service, given pilot studies demonstrating the essential role of labor in managing responsive supply chains in these marketing channels (LeRoux et al. Reference LeRoux, Schmit, Roth and Streeter2010).
In short, at any point in time a farm operation may be considering the tradeoffs of their product marketing portfolio: balancing the efficiency gains of scale against the potentially higher or more stable returns from self-governed customer responsive supply chains. And, as there is likely heterogeneity among producers participating in these channels with respect to their portfolio mix of markets (illustrated in Figure 1, with the economic tradeoffs presented in Figure 2), an analysis of performance by top- and lower-performing farms may be enlightening.
Although competitive analysis is useful in assessing one's position relative to the competition, it usually does not provide insights as to how competitors achieved this position (i.e., through what methods or processes) without further delineation of benchmark data. By benchmarking several key business factors across producer segments and comparing those operations with relatively better and worse financial performance, we explore several issues of interest. For example, how the relative performance of small and mid-sized enterprises varies from larger enterprises, and if a comparative disadvantage in scale can at least be partially mitigated by participation in alternative marketing channels. Because the cyclical nature of agriculture makes it particularly susceptible to financial risk and repayment challenges, we also assess how farms compare to others in terms of debt usage and financial efficiency (e.g., Fox, Bergen, and Dickson 1993, Patrick, Kuhns and Borchers Reference Patrick, Kuhns and Borchers2016).
Data and Methods
Data for this study are from the 2013 Phase III USDA ARMS. The data include gross cash farm income, marketing channels used, key product segments, region where operation is located, fixed and variable expenses, assets, debt, and farm and operator characteristics (see Table 1). The ARMS is a nationally representative survey that targets about 30,000 farms annually and utilizes a complex survey design (e.g., complex stratified, multiple-frame, and probability-weighted). Given this survey design, if the purpose of the analysis is to describe the population, then the estimates must be weighted; if the purpose is to describe a sample (in our case, farmers and ranchers participating in local food marketing channels), then weighting the sample will distort the results by forcing this sample to act more like the average farmer-respondent.
USDA ARMS Sample of Farmers and Ranchers by Local Marketing Segments

Note: In 2013, all local food farms have an n = 1,012 and of those n = 958 have sales over $1,000. This analysis includes only those farms with at least $1,000 in sales, so for this category and all subsequent tables n = 958.
By not using the jackknife weighting scheme to standardize the sample analyzed (recommended by the USDA ERS when working with ARMS), this paper assumes that: (1) local food producers would not be shown as representative using the criteria commonly used to create more representative farms in the ARMS sampling scheme; and, (2) the ARMS sampling scheme is representative of all farms, so comparisons of our targeted set of producers to the sample still offers some important inferences. In short, we did not modify the targeted sample to normalize it to a representative U.S. farm population because we expect it is those farms’ variance from being “representative” that is interesting for comparison.
In the ARMS, the criteria used to establish whether or not a farm participates in local food marketing channels is twofold. First, participants are asked to respond (yes/no) if they produced, raised, or grew commodities for human consumption that were sold directly to: (1) individual consumers, (2) retail outlets, and (3) institutions. Second, they are asked to provide the amount of money they received from the sale of crop and livestock commodities from the above-listed channels. We chose to define local food system participants by all those that reported any amount of positive sales in any of the three direct marketing channels listed above. Following Low et al. (Reference Low, Adalja, Beaulieu, Key, Martinez, Melton, Perez, Ralston, Stewart, Shuttles, Vogel and Jablonski2015), sales to individual consumers are classified as direct-to-consumer sales and sales by the producer (or a value-based supply chain representing the producer) to retail outlets and institutions are classified as intermediated sales. Of the total sample, Table 1 shows that 16,461 (94 percent) reported no local food sales and 1,013 (6 percent) responded that they had positive sales in local food marketing channels. For all those respondents who reported positive sales in local food marketing channels, 664 (66 percent) had positive direct-to-consumer sales only, 136 (13 percent) had positive intermediates sales only, and 213 (21 percent) had positive sales to both outlets (note that given how ARMS asks respondents about local food sales, for farms that report sales to both outlets it is not possible to disentangle percentage of sales through direct-to-consumer versus intermediated outlet).
Table 1 highlights a couple of important aspects of the local food system participants in the sample. First, the top rows illustrate how the local marketing producer sample compares to the full ARMS sample (1,013 of 16,416 total operations) and below, how the local food producers compare when decomposed by scale, location and commodity. Additionally, the observation numbers allow one to see that, as is the case for all farms, there is a high prevalence of very small farms among the sample marketing locally, and that some products are more commonly sold using direct and intermediated strategies (i.e., fruits and vegetables).
Table 2 shares the means of several key variables from the direct and intermediated sample, to help compare numbers across producers of different sales class categories (note that the two highest farm income classes are combined to attain a larger sample). And, since Jablonski and Schmit (Reference Jablonski and Schmit2015) found differential expenditure patterns among those who participate in local and regional food systems, variable expenditures are explored here using their methodology.
Summary Statistics for Local Food Farmers and Ranchers, by Gross Cash Farm Income

a 1: ≤34, 2: 35–44, 3: 45–54, 4: 55–34, 5: 65+.
b 1: less than high school, 2: completed high school, 3: some college, 4: completed 4 years of college or more.
c 0: Urban, 1: Metro adjacent, 2: Rural.
As is the case for all farms (Hoppe Reference Hoppe2014), as the scale of farms that participate in direct and intermediated channels increases, so does average profitability. Among marketing strategies, higher gross cash farm income is positively correlated with participating in intermediated markets (either solely or together with direct marketing). Not surprisingly, the ratio of off-farm to farm income indicates that smaller farms are more reliant on off-farm income streams to sustain the household (and perhaps subsidize the operations). As one might expect, those operators who scale up are relatively less dependent on off-farm income streams as their profitability improves.
Although no statistical tests were performed, visual observation shows larger farms using local channels spend a higher share of variable costs on labor, suggesting that these operations are either more labor intensive, or perhaps, as sales grow, owner and family labor contributions are no longer sufficient to maintain operations (in line with Hoppe Reference Hoppe2014). The other noticeable difference is the share of costs spent on rent, which is relatively low for the smaller operations. The low share of costs spent on rent for smaller operations is consistent with the relatively higher ratio of owned to leased land among that sales class, because land payments would be an overhead cost while rent would be registered as a variable cost.
As expected, fruit and vegetable operations using local markets cross all sales class categories. What may be surprising is that livestock enterprises are more commonly small. It is interesting to note that a higher share of the farms using local markets are in the West and South regions (using USDA regional designations), and that the smallest sales class farms are in the South. However, it is important to understand that the USDA ARMS samples are stratified to include more of the core agricultural states (mostly in the Midwest), so any regional differences must be interpreted carefully. Still, what is masked by these averages is the great heterogeneity in this sample, something that segmentation into quartiles allows us to consider.
Quartile Groupings by Return on Assets
To better capture the sample's heterogeneity, we group local and regional food marketers into high- and low-performing quartiles by profitability and conduct statistical tests across quartiles. There are many measures of profitability, but in this case we chose to use a farm's reported ROA, a commonly used metric to evaluate the profitability of farm businesses, to sort farms into quartiles as a way to disentangle what differences may exist among the most and least profitable farms (e.g., Ho et al. Reference Ho, Newman, Dalley, Little and Wales2013, Wolf et al. Reference Wolf, Stephenson, Knoblauch and Novakovic2016). The use of a “standardized” measure like ROA, may allow some expected and interesting cases (such as lean farms with few owned assets that are aggressively pursuing high-end produce and product markets) to emerge more clearly. In contrast, gross measures (e.g., net farm income) or more refined measures (return on equity) may mask some interesting aspects we expect to see in the comparisons. Beyond sharing the financial profitability differences across these groups, we also explore what operator and production characteristics (region, commodity) indicated to financial outcomes.
Additionally, we examine differences in bargaining power by comparing local producers selling through intermediated channels to similarly sized producers not participating in direct or intermediate markets. Following Cai, Stiegert, and Koontz (Reference Cai, Stiegert and Koontz2011), we use net farm income as a proxy for price, to determine differences in bargaining power between marketing channels. Still, we do present a few other key measures (labor as a share of variable expenses and asset turnover ratios) as part of the analysis to assess how management of labor and assets may also influence financial outcomes.
Results and Discussion
Before delineating between our ROA groups of farms, there are some general themes to explore for the sample of farms that market directly. Following the classification scheme adopted by the USDA ERS to delineate the structure of U.S. farms by gross cash farm income (GCFI), we consider farms in four sales classes; $1–74,999, $75–349,000, $350,000–999,999, and $1 million and higher in GCFI. Once segmented into these sales classes, the quartiles were created based on the relative ROA across farms within the sales class. Table 3 summarizes the ROA results by these sales classes, with Quartile 1 representing farms with the lowest ROA and Quartile 4 the highest. T- and F-tests show that there are significant differences across quartiles within the high and low performers in each of the sales classes, so comparisons are warranted given the notable differences between enterprises.
Return on Assets, by Gross Cash Farm Income, by ROA Rank Quartiles

Note: Return on assets was multiplied by 100 for interpretation.
In a test of whether quartiles varied by sales class (for example, Quartile 1 farms had significantly different ROA when comparing small vs. large sales levels), only Quartiles 1 and 3 were significantly different across sales classes.
When pairwise tests of mean ROA measures were conducted within each sales class, all pairs were found to be significantly different with the exception of Quartiles 3 and 4 in the $1,000 to $74,999 sales class.
Profitability by Scale of Farm Sales
Farms participating in direct and intermediated markets report a broad range of profitability with higher performers reporting returns of at least 20 percent, a strong result for a low margin industry such as agriculture (Table 3, last row). Still, over half of the sample reported negative returns, but the losses vary significantly by sales size class. Only the top 25 percent of the smallest size operations (Quartile 4) are profitable, perhaps through adopting a very lean management strategy (an issue we will return to later in the discussion). However, once above the $75,000 sales threshold, all other size classes (Quartiles 3 & 4) have at least one half of their operations reporting break-even profits or some level of profitability, and the highest performing groups report impressive ROA levels of 20, 23, 24 and 29 percent, respectively.
The variance across locally marketing enterprises in the low- and high-income quartiles is very interesting. The lowest performers are likely indicative of the lower left quadrant of Figure 2, lacking the scale economies, and with less-developed supply chains, as one might expect for some small family farms in the United States (retirement operations, or those with off-farm occupations) (Hoppe Reference Hoppe2014). Outliers in all size classes warrant additional exploration in terms of what strategies influence marketing efficiency (vertical axis of Figure 2) or success in terms of supply chain responsiveness (horizontal axis of Figure 2). One additional way to group producers is by the marketing channels in which they participate.
Profitability by Marketing Channel
Table 4 shares the results of ROA-ranked quartiles when farm enterprises are segmented by their marketing choices (direct, intermediated, or some marketing to both types of channels). Again, there is significant heterogeneity within these marketing segments, with the exception of the lowest performing quartiles for direct-to-consumer marketers (where Q1 and Q2 are not significantly different). For the majority of quartiles, the producers using different channels were not significantly different. However, among the top performing quartile (4), direct-to-consumer marketers had significantly lower ROA than the top performers using intermediated markets or both types of markets (not significantly different). This result may signal the importance of intermediated markets to achieve marketing efficiencies in these higher volume channels, if and when responsive supply chains can be maintained through value chain partners.
Return on Assets, by Marketing Outlets, by ROA Rank Quartiles

Note: Return on assets was multiplied by 100 for interpretation.
In a test of whether or not quartiles varied by marketing channel (for example, Quartile 1 farms had significantly different ROA when comparing those using direct vs. intermediated markets), only Quartile 4 was significantly different across marketing channels.
When pairwise tests of mean ROA measures were conducted within each marketing channel, all pairs were found to be statistically significantly different, with the exception of Quartiles 1 and 2 among farms that used both direct and intermediated channels.
Profitability by Marketing Channel and by Scale
Because one could imagine that farm scale may influence the choice of marketing channel, the data were further decomposed to explore how scale and marketing channel interact (Table 5). When testing whether the quartiles varied by marketing channel controlling for scale, there were some interesting patterns that emerged in Quartile 4 (the highest performers), particularly between producers participating in direct and intermediated or both direct and intermediated markets in the two higher sales categories (at least $75,000 in sales). This could signal that once above a certain sales threshold, participating in intermediated markets with more potential for wholesale volumes provides the best opportunities to maximize returns.
Return on Assets, by Marketing Outlets and by Gross Farm Income, by ROA Rank Quartiles

Note: In several cases, the sample size for a scale/marketing channel combination was not large enough to report results (designated by NA).
*In a test of whether or not quartiles varied by marketing channel when controlling for scale, most combinations were not significantly different. Only Quartile 4 was significantly different across marketing channels. Those Quartiles (by scale) that were significantly different across channels (when controlling for scale) at the 10 percent significance level are marked with a *.
^In a test of whether or not quartiles varied by scale when controlling for marketing channel, Quartile 4 was significantly different across all scales for each marketing channel option at the 5 percent level, and marked with a ^. The only other two pairwise significant differences were for Quartile 3 in the direct-to-consumer channel and Quartile 2 in the intermediated channel.
When pairwise tests of mean ROA measures were conducted within each scale and marketing channel combination, all pairs were found to be statistically significantly different at the 5 percent level with the exception of Quartiles 3 and 4 in the direct-to-consumer/$1–74,999 sales group and Quartiles 1 and 2 in the both direct/intermediated channels/$1–74,999 sales groups. Given the high standard errors for these combinations, it is not surprising that pairwise tests were not significant.
As another way to look at these interactions, we found quartiles varied by scale when controlling for marketing channel. Quartile 4 was significantly different across all scales for each marketing channel option at the 5 percent level. Although greater scale provided a clear advantage in intermediated markets among these highest performers, small- and mid-scale producers in the direct and both direct and intermediated segments outperformed the highest-grossing farms. Therefore, it seems scale does matter in the choice of appropriate marketing strategies and the portfolio of channels, at least among the most profitable.
Finally, when pairwise tests of mean ROA measures were conducted within each scale and marketing channel combination, all pairs were found to be statistically significantly different at the 5 percent level with the exception of Quartiles 3 and 4 in the direct-to-consumer/$1–74,999 sales group and Quartiles 1 and 2 in the both direct/intermediated channels/$1–74,999 sales groups (although the latter is likely due to the high standard errors among those groups). The overall variability among producers marketing directly and through intermediated markets makes it clear that one should not develop a notion of an average or representative producer in this space. But, instead, there are likely many “right fit” strategy combinations that make sense. We will now consider a few more factors that may influence performance.
Profitability by Commodity
Table 6 presents a decomposition of quartiles for those producers marketing directly or through intermediated markets, by the primary product they market (they self-report their primary product in ARMS). All quartiles were found to be significantly different at the 1 percent level within each of the commodity categories (with the exception of Quartiles 1 and 2 in the fruit and vegetable, livestock, and dairy producers). The variability of profits is also evident when considering products, though field crops had a relatively tighter distribution across groups. Moreover, across producers of different commodities, the highest performing producers (Quartile 4) were significantly different with fruits and vegetable producers reporting the highest returns among those groups.
Return on Assets, by Commodity, by ROA Rank Quartiles

Note: All quartiles were found to be significantly different at the 1 percent level within each of the commodity categories, with the exception of Quartiles 1 and 2 in the fruit and vegetable and livestock dairy producer groups.
*Across the commodity categories, the highest performing producers (Quartile 4) were significantly different at the 5 percent level, all other quartiles were not significantly different.
Profitability by U.S. Region
To determine if there are any spatial aspects that may influence the financial performance of farms, the sample was segmented by regions at a broad level to maintain sufficient sample sizes (see Table 1 for regional sample sizes). Again, Table 7 shows that, according to pairwise t-tests on quartiles within regions, there were significant differences across almost all quartiles. Across regions, all of the top performing quartiles were significantly different, suggesting there may be better market conditions for this business model depending on location. Specifically, the West and Northeast outperform other regions for the best performers, and the Midwest notably lags behind the other regions.
Return on Assets, by USDA Region, by ROA Rank Quartiles

Note: All quartiles were found to be significantly different at the 1 percent level within region, except Quartiles 1 & 2 in NE and South.
*Across the regions, the highest performing producers (Quartile 4) were significantly different at the 10 percent level; all other quartiles were not significantly different.
Profitability by Metro to Rural Location
As a final approach to explore spatial aspects that may influence the financial performance of farms, the sample was segmented by whether the farm was in a rural, metro or metro-adjacent county (using aggregated USDA ERS rural-urban continuum codes). Again, within segments there were significant differences when assessing t-tests on quartile pairings. Across regions, all of the top performing quartiles were significantly different. Those enterprises located in metro counties significantly outperformed those in areas farther from population centers (Table 8).
Return on Assets, Across Metro-Rural Continuum, by ROA Rank Quartiles

Note: All quartiles were found to be significantly different at the 1 percent level within metro, metro-adjacent and rural categories with the except of Quartiles 1 and 2 in the metro group, which were significant at the 10 percent level.
*Across the regions, the highest performing producers (Quartile 4) were significantly different at the 1 percent level; all other quartiles were not significantly different.
Leverage by Scale of Farm
As detailed in the background research, a key indicator of economic performance may relate to the leverage used to finance the business. It should be noted that this is one of the few factors where quartiles within sales classes were all found to be significantly different from one another when tested as a group (although some quartile pairs were similar), therein warranting additional exploration. Table 9 shows that among the smallest income class (under $75,000), there is the least average reported debt. However, it is unclear if this is due to limited access to capital or the choice of the operator to invest equity capital at this stage of development so that the risk of repayment is not a challenge. The least debt was held by the top quartile that was profitable at this scale, consistent with findings from others showing leverage is detrimental to returns (Ford and Shonkwiler Reference Ford and Shonkwiler1994).
Financial Characteristics, by Gross Cash Farm Income, by ROA Rank Quartile

Note: *Labor as a share of all variable costs was not significantly different across quartiles within sales classes, with the exception of Quartiles 1 and 2 in the $1,000–74,999 sales class, which were significantly different at the 10 percent level. Across sales classes, each of the quartile groups are significantly different at the 1 percent level, so for example, the labor expenses for Quartile 4 farms at each sales level are significantly different.
^The asset turnover ratio was evaluated with pairwise tests across quartiles within sales classes; ^ indicates quartiles that were significantly different than the next highest quartile at the 5 percent significance level. Across sales classes, only Quartiles 2 and 3 are significantly different among groups at the 1 percent level.
#The D/A ratio pairwise tests show that those with a # were significantly different than the next highest quartile at the 10 percent level. Across sales classes, all quartiles are significantly different at the 5 percent level with the exception of Quartile 3.
Once we move to the higher-grossing farm operations, the patterns are more bimodal in nature. In general, the best- and worst-performing farmers (Quartile 1 and Quartile 4 as delineated by ROA) both use relatively higher levels of debt (see Table 9). One could imagine a situation where the poorest-performing operations see debt as a solution for cash flow shortfalls, whereas the best-performing operations see debt financing as an opportunity for faster growth. Given the use of debt by even those performing well, it would suggest targeted, government-backed credit access may be an attractive policy solution to support this sector.
Financial Efficiency
Figure 2 suggests that marketing efficiency is a key aspect of financial performance of farm operations, and although the data did not contain enough information to identify marketing efficiency, the gross sales a producer can create from a farm's assets is a good proxy of overall efficiency. Not surprisingly, asset turnover ratio (ATR), which is the farm's ability to create gross sales effectively, shows some interesting and significant patterns across farms that market directly and are of varying scale. As expected, the highest-performing farms generally have the highest ATRs. The higher ATRs among the strong financial performing operations could be the result of several strategies, including lean management (leasing vs. owning land and equipment), high sales through strong customer loyalty and price points, or intensively managed production models (succession planting, full carcass utilization, season extension). Again, it shows there is likely a diverse set of approaches producers in the direct marketing sector use to be competitive.
There are, however, a few exceptions to the rule. In all but the $75–350,000 gross farm income class, there were some pairwise quartiles with no significant differences. For a subset of farms in each sales class, there appears to be a challenge converting assets into saleable goods, which may again be representative of either beginning farmers or the retirement and lifestyle producers identified by Hoppe and MacDonald (Reference Hoppe2015). For the latter, lifestyle producers may seek out a farmstead and lifestyle with aesthetic or amenity value, but with less concern about actively managing their land, animals, or machinery into saleable goods. One interesting exception is that the poorest-performing quartile in several sales classes have relatively high ATRs, showing relatively high technical efficiency in converting assets to sales but they still lag in overall financial performance. Perhaps it is their relatively high indebtedness that explains their high sales conversion not translating to profitability.
Labor Expenses by Scale of Farm
As previous work by Jablonski and Schmit (Reference Jablonski and Schmit2015) suggests, there are significant differences in the use of labor by those farms that market directly. Previous research on responsive supply chains confirms the varying efficiency in managing labor needs of such business strategies (Hardesty and Leff Reference Hardesty and Leff2010, LeRoux et al. Reference LeRoux, Schmit, Roth and Streeter2010). In the results by commodity groups, we noted that more labor-intensive fruit and vegetable producers reported the highest profitability among the strong-performing Quartile 4. This is one signal that labor expenditures, managed in a strategic manner, can pay off in responsive supply chains.
It appears from Table 9 that labor investments are a relatively high share of total costs as operations grow in scale. This may suggest the hours, skill, and expertise needed to manage responsive supply chains is higher as the volume of sales conducted through direct and intermediated markets increases. This is not surprising, given that the functions of the marketing supply chain, which direct marketing farms integrate into their operations (e.g., distribution, brokering), are relatively well-paid enterprises in the food sector.
Conclusions and Future Research Directions
In initial work targeting financial performance analysis specifically on those who participate in local marketing strategies among the USDA ARMS and USDA National Agricultural Statistics Service, researchers found differences that suggest different business strategies are being employed (Low et al. Reference Low, Adalja, Beaulieu, Key, Martinez, Melton, Perez, Ralston, Stewart, Shuttles, Vogel and Jablonski2015). This paper's grouping of local and regional food marketers into quartiles by profitability (defined as ROA), and then further delineating these results by gross cash farm income levels and a number of other operational characteristics, provides valuable insights.
Although several potential managerial factors are considered, we primarily sought to explore how different scales of producers’ financial performance may rely on their ability to understand and exploit a new set of comparative advantages in increasingly differentiated markets. To reinforce initial research that direct markets are less scale-biased than traditional agricultural markets (Low et al. Reference Low, Adalja, Beaulieu, Key, Martinez, Melton, Perez, Ralston, Stewart, Shuttles, Vogel and Jablonski2015), we provide further evidence of a transition to financial viability at a relatively small GCFI level, on average, in this study. This is an encouraging indicator and further motivates the need to explore groupings of producers as means may signal little among a sector of farms that are likely to be quite heterogeneous. The full set of benchmarks for producers that are marketing directly and through intermediated markets presented here begin to frame an interesting story of how diverse this emerging sector of agriculture is, and why it is important to understand the variety of managerial strategies being employed that allow producers to be financially viable at all scale levels.
There are other interesting differences across operator and production characteristics that complement these findings on operations of different scales. Types of marketing channels, primary commodity, region of the country, and location of the farm relative to metro areas are all important factors as well. What are the implications of these differences in ROA across sales class among those farms that have chosen to integrate direct sales into their business strategy? First, the financial choices these farms face may vary from a typical farm. If part of the reason they report high financial returns is because they operate with a “lean” model where they lease all they can, they are inherently minimizing overhead by not owning real estate and long-term assets. However, the tradeoff for that strategy is that it may be harder to collateralize loans in the future as they continue to grow if the farm operators choose never to invest in assets that would allow for securitization. Further growth may be limited to what operating cash flows allow, even if market opportunities would allow for even faster growth.
The USDA appears poised to increase access to guaranteed credit and technical assistance for small and mid-sized producers. Programs have emerged such as the Farm Service Agency's Beginning Farmer and Rancher loan programs or Farm Credit's AgConnect program to better fit the needs of these clients. Despite increasing investments in innovative, regional food supply chain initiatives, there is little systematic consideration of the outcomes of these efforts, and specifically, if it helps small and mid-sized farms to explore a new set of comparative advantages. This paper is intended to begin evaluating whether or not outcomes targeted at those sales classes has been effective, and initial evidence shows that intermediated markets are positively related to those in higher sales classes. In turn, a higher share of those enterprises report profitability (and for the top 25 percent, impressive ROA numbers).
If one agrees that accessing commodity markets is difficult for small and mid-sized farms as procurement systems are increasingly vertically and horizontally integrated and aim to maximize efficiency, new marketing and financing models will be necessary (e.g., Tropp, Ragland, and Barham Reference Tropp, Ragland and Barham2008, Hardesty et al. Reference Hardesty, Feenstra, Visher, Lerman, Thilmany McFadden, Bauman, Gillpatrick and Nurse-Rainbolt2014). Angelo, Jablonski and Thilmany (Reference Angelo, Jablonski and Thilmany2016) concluded that, to enhance the viability of food value chains and the producers involved, market development, market access, and consumer and institutional buyer education are key. This paper provides at least initial evidence that participation in direct and intermediated markets may allow the most business-savvy farms of any scale to be financially viable.
As of writing this article, the USDA National Agricultural Statistics Service just released preliminary results from its first in-depth survey of those farms participating in local food markets. Though financial questions are not as detailed as those found in the USDA ARMS data, it should provide an even better opportunity to analyze how specific local marketing choices and strategies impact marketing profitability. Beyond more delineated market channel data, this survey has a much bigger sample size of local food producers (>5,000), allowing for segmentation by a larger set of criteria (commodity, region, age of operation). Follow-up analysis on the 2015 Local Foods survey to explore these same financial performance indicators, together with a more refined segmentation of key enterprise differences (commodity, region, age of farm), will provide richer context to these findings.


 Open access

