

Disclaimer
Other than the material expressly identified in this paper as being the intellectual property and copyright of Ortec Finance, the IFoA owns any and all intellectual property rights, including copyright in this paper and its content is protected by copyright.
You are permitted to use and/or view this paper provided that (i) you do not modify the content in any way; (ii) you do not use this paper or any part(s) of it in a misleading context; (iii) your use of this paper is for your own personal information or for a non-commercial purpose; (iv) any copies of this paper or any part(s) of it for a permitted purpose described in this notice will include an acknowledgement that copyright belongs to the IFoA and Ortec Finance (as appropriate).
The IFoA and Ortec Finance do not accept any responsibility or liability to any person for loss or damage suffered as a consequence of their placing reliance upon any view, claim or representation made in this paper. The information, including the modelling scenarios, and expressions of opinion contained in this paper are not intended to be a comprehensive study, nor do they provide actuarial advice or advice of any nature and should not be treated as a substitute for specific advice concerning individual situations. We have used this tool to model the effects of three different climate pathways through sets of alternative economic assumptions that mimic various possible evolutions of the economy depending on which climate pathway the world follows.
Executive Summary
The potential influence and risk of climate change on economies and our financial system is no longer in doubt. Climate-informed decision-making is increasingly being demanded by regulators. It is rapidly becoming the case that trustees of UK defined benefit pension schemes will be deemed to be not acting responsibly if they do not take any action.
As part of this, there has been an explosion of interest in climate scenario analysis due to its prominence in the TCFD (Taskforce on Climate-related Financial Disclosures) recommendations. Furthermore, amendments to the Pension Schemes Bill currently before Parliament are expected to make TCFD style reporting – and hence climate scenario analysis – mandatory for large UK pension schemes.
This paper explores how climate scenario analysis can be used for forward-looking assessment of the risks and opportunities for defined benefit pension schemes and other financial institutions. For this paper, we have used ClimateMAPS, the top-down modelling tool developed by Ortec Finance in partnership with Cambridge Econometrics. We have then translated the impacts of climate-adjusted GDP from this tool for the following three different climate pathways onto a wide range of financial and economic variables:
-
Paris Orderly (coordinated action to limit global average temperature rises to 2°C which financial markets price in gradually)
-
Paris Disorderly (same real-world outcomes as the Paris Orderly pathway, but financial markets’ reaction is delayed and abrupt)
-
Failed Transition (no additional climate policies are implemented and global average temperature rises by 4°C by 2100).
These are just three plausible pathways, and they are not intended to be “worst case.” We have compared these pathways with a climate-uninformed baseline. This climate-uninformed baseline assumes no increase of physical risks due to climate change and does not make any explicit assumptions about the transition to a low carbon economy.
We have modelled these impacts on the assets and liabilities of an example UK defined benefit pension scheme over the next forty years. The main results of the modelling are as follows:
-
The funding risks for the pension scheme are greater under all three climate pathways than under the climate-uninformed base scenario. In the absence of changes to the investment strategy or recovery plan, the time taken to reach full funding is increased by 3 to 9 years.
-
For this pension scheme, the worst of these three scenarios is the Paris Disorderly scenario. Although the long-run economic impacts are projected to be greatest under the Failed Transition, the scheme is assumed to have started reducing investment risk by the time the worst effects of the Failed Transition apply. However, the timing of the climate effects is very uncertain, and if the impacts of the Failed Transition started to emerge prior to the risk reductions, then this could be the worst of the three.
As actuaries with some experience in this field, we are satisfied that these results are based on a reasonable model. However, there is material uncertainty in all aspects of climate scenario modelling and this model is not able to fully capture all the risks. For example, it does not incorporate environmental tipping points and is highly dependent on the assumptions used to translate the climate adjustments from GDP onto the other variables. In addition:
-
There are some plausible climate pathways (not included in these three) where real gilt yields fall rapidly and so the liabilities could be impacted more extremely.
-
Even when the scheme has reduced its investment risks, some climate risks will remain since matching assets are not immune to climate risks (particularly corporate debt due to credit risk) and cannot match uncertain cash flows perfectly.
-
Climate risks might affect annuity prices earlier and more significantly than they affect the scheme’s funding position, affecting the cost of transferring the scheme’s liabilities to an insurance company.
-
Financial market volatility might increase as the physical and transition impacts of climate change unfold, particularly if this happens in an unpredictable manner. The modelling does not make much allowance for this. For maturing pension schemes, market volatility is likely to increase the chance of being a forced seller of assets and cause a drag on investment returns.
-
In all cases, the extent of the sponsoring employer’s exposure to climate risks is relevant: the greater a scheme’s climate risk exposure through the sponsor covenant, the lower its capacity to tolerate climate risk exposure through its assets and liabilities (all else being equal).
These are all areas where further research and model refinements would be useful. In aggregate, it is quite likely that the modelling is biased to underestimate the potential impacts of climate-related risks, especially for the Failed Transition pathway. This reinforces the finding that actuarial advice based on the climate-uninformed baseline would underestimate the funding risks (since the progression of the funding position is worse under all three pathways). Given that most models currently used by actuaries do not make explicit adjustments for climate change, it seems quite likely that pension schemes are systematically underestimating the funding risks they face.
Climate change scenarios can help trustees and employers determine how exposed pension schemes may be to climate change and how the employer may be able to respond as climate impacts emerge. There are then a number of actions that trustees can take in order to mitigate climate risk (not explored in detail in this paper), for example:
-
Make changes to investment strategies and their implementation.
-
Engage with the employer to understand how resilient it is to climate change and which scenarios it is most exposed to.
-
Factor these risks into their funding and investment strategies and plan in advance how to react should they start to materialise.
Finally, the modelling is based on market conditions on 31 December 2019 and makes no allowance for subsequent events, notably the COVID-19 pandemic. The climate impacts we illustrate may seem less significant now they are being considered against that backdrop. However, what COVID-19 does demonstrate is the impact that globally integrated events can have on economies and financial systems and the importance of preparedness.
1. Introduction
Pension schemes are increasingly seeking to understand better and analyse the financial and economic exposure of their assets and liabilities to climate-related risks and opportunities. Climate-informed decision-making is increasingly being demanded by regulators, and for some pension fund trustees, it has become a fundamental consideration as part of their fiduciary duties, to support strategic investment decisions, better risk management and developing more resilience in their portfolios.
This paper explores how climate scenario analysis can be used as a tool for forward-looking assessment of the risks and opportunities for defined benefit pension schemes and other financial institutions. It is intended to provide an example of how pension schemes can integrate climate change into their thinking on matters such as funding strategies and long-term strategic asset allocation and should prove useful to pension actuaries and other advisors who are seeking to give specific consideration to climate risks in their advice to scheme trustees and sponsors. It assumes that the reader already has some knowledge of climate change and its relevance to the work of pensions actuaries, including material covered in other IFoA documents on this topicFootnote 1 . Although the case study that is presented is a defined benefit scheme operating in the UK, this paper should also be useful for actuaries advising other long-term investors, both in the UK and in other jurisdictions. A companion paper “Climate scenario analysis: an illustration of potential long-term economic & financial market impacts” (the Companion Paper), written by the same authors, examines the long-term economic and financial impacts illustrated by the underlying modelling in more detail.
The potential influence and risk of climate change is not in doubtFootnote 2 . Climate-related risks topped the concerns in the World Economic Forum’s latest Global Risks ReportFootnote 3 , and almost all countries have signed the Paris AgreementFootnote 4 , committing them to significant action to limit climate change. It is an unprecedented challenge and poses significant risks to the economy and to the financial system. Some of these risks are already manifesting themselves through changing climatic conditions (such as temperatures and rainfall patterns), rising sea levels and extreme weather events (such as hurricanes, wildfires and flooding). These events have significant negative impacts and disruption on various sectors such as agriculture and forestry, supply chains and infrastructure. Actions to limit the extent of climate change by cutting greenhouse gas emissions, primarily through reducing the use of fossil fuels and switching to renewable energy sources, will fundamentally change many aspects of business and everyday life. Some assets, such as fossil fuel reserves, are likely to lose much of their value if emissions limits are imposed – the problem of stranded assets. The business models in many industries are likely to change, and new industries may emerge. Hence, the socio-economic consequences of climate-related impacts will be wide-ranging and long-lasting. Crucially from an actuarial perspective, these impacts can be difficult to predict, quantify and model due to the systemic nature of climate change.
Climate change will almost certainly fundamentally impact how economies perform as a whole. It will affect macro-economic variables such as GDP growth and in turn have significant influence over the resulting performance of asset classes and industry sectors. Since the risks associated with climate change are systemic in nature, they will affect all assets to some extent and so cannot be avoided completely through careful selection of investments.
These economic factors will affect not only the assets of pension schemes but also their liabilities through impacts on inflation, health and mortality (which may also be affected more directly through the physical impacts of climate change). Moreover, these economic factors will affect the sponsoring employer and its ability to meet any funding shortfalls. Insights gained from climate scenario analysis allow pension schemes and other financial institutions to make more informed strategic decisions with the aim of developing investment portfolios and approaches to liability management that are more climate resilient. This paper considers the economic impacts on the assets and liabilities and hence the funding position. A more comprehensive exercise would also consider impacts on the demographic variables and the sponsor covenant.
Previous IFoA working party papersFootnote 5 have acknowledged the challenge of assessing the financial impact of climate risks. They have noted the disconnect between existing scientific data describing climate-related risks and the use of this information in traditional financial performance measurement, risk assessment and economic scenario analysis at the strategic level. Moreover, most of the currently publicly available analysis focuses on bottom-up security-specific climate-related risk analysis and reporting and does not consider top-down integration into funding strategies and long-term strategic asset allocation via macro-economic risk analysis.
Meanwhile, there has been an explosion of interest in climate scenario analysis due to its prominence in the TCFD recommendations: “Organizations should describe how resilient their strategies are to climate-related risks and opportunities, taking into consideration a transition to a lower-carbon economy consistent with a 2°C or lower scenario and, where relevant to the organization, scenarios consistent with increased physical climate-related risks.” Footnote 6 As predicted, we are seeing considerable work in this area as financial institutions start to implement the recommendations. In March 2020, the UK Pensions Climate Risk Industry Group (PCRIG) launched a consultation on its draft guidance for trustees on integrating climate-related risk assessment and management into decision-making and reporting. Climate scenario analysis features prominently in this draft guidance and is described as “a crucial step in trustees meeting their legal duty to manage climate-related risks.” Footnote 7 Amendments to the Pension Schemes Bill currently before Parliament are expected to make TCFD style reporting – and hence climate scenario analysis – mandatory for large pension schemesFootnote 8 .
Whilst interest is high, the form, pace and breadth of adoption remain to be seen. We hope that this paper can contribute positively to the pace and breadth of adoption and the emergence of best practice. Pensions actuaries will be able to use the case study to help show them how such analysis can be performed and what the results might show. The case study we present is intended to be realistic, and the numerical results illustrate plausible outcomes rather than forecasts. The climate pathways illustrated are not intended to be extreme and so do not represent “worst-case” scenarios. Moreover, the model we have used does not take account of the full effects of climate change, as it ignores broader environmental tipping points and knock-on effects, such as climate change-related migration and conflict. Given the pathways we have described, there is therefore a strong bias towards optimism in our results.
Climate change is not the only systemic risk to which pension schemes are exposed. Since the majority of the work on this paper was completed, the world has experienced a major shock in the form of the COVID-19 pandemic which is having unprecedented financial market impacts. The climate impacts we illustrate may seem less significant now they are being considered against that backdrop. An important difference is that real-world climate impacts – although already being felt – will manifest themselves over a period of decades, extending beyond the independent lifetime of many UK defined benefit pension schemes, and are likely to emerge much more slowly than those of COVID-19. The mounting awareness of climate risks among financial participants – facilitated by tools such as scenario analysis – should help to mitigate the market impacts by enabling the effects to be priced in gradually, although pricing-in shocks are still likely to occur and could be significant. What COVID-19 does demonstrate is the impact that globally integrated events can have on economies and financial systems and the importance of preparedness.
Climate impacts may be a material factor when considering future insurance buy-out prices (which will need to consider the long-term outlook) as well as nearer term matters such as an appropriate level of deficit repair contributions and the expected time horizon to be fully funded. Moreover, actions taken now will be crucial in determining eventual climate outcomes. For example, atmospheric concentrations of greenhouse gases are determined by cumulative emissions, hence the level of emissions today matters as well as the level at future dates (e.g. 2050), and infrastructure being built now could either lock us into fossil fuel dependency for decades or accelerate the transition to a low carbon economy.
2. The Systemic Nature of Climate Risk
As outlined in section 1, climate change is an unprecedented challenge and poses significant risks to the economy and to the financial system. The risks are often classified into two main types:
-
Physical – these arise from both gradual changes in climatic conditions and extreme weather events; and
-
Transition – these arise from the move to a low carbon economy and include impacts relating to policy, technology, markets and reputationFootnote 9 .
There are likely to be significant opportunities too, particularly in relation to the transition, although the net impact is likely to be negative for many sectors and for the financial system as a whole.
The physical and transition impacts that actually materialise will depend crucially on the speed and magnitude of climate change and the policy response. There are many possible pathways, driven by the choices made by governments and society at large, varying from those in which our behaviour does not change (leading to more severe physical impacts) to those in which drastic action is taken to counteract climate change (leading to more severe transition impacts). The actual pathway that we will follow is highly uncertain. Nonetheless, it is certain that there will be financial impacts from some combination of physical and transition effects.
These climate impacts will have macroeconomic consequences (i.e. economy-wide effects) that will affect indicators such as GDP growth, interest rates, inflation, investment and international trade flows. This will in turn affect risk-return expectations across all asset classes, regions and sectors and also the value placed on the liabilities of pension schemes. The risks are therefore systemic in nature – they will affect large parts of the economic and financial system, with many companies potentially affected in similar ways at similar times. The Bank of England has warned repeatedly that climate risks could cause instability of the financial systemFootnote 10 .
It is therefore imperative that pension schemes and other financial institutions start to assess and determine the potential impact of transition and physical risks on their assets and liabilities. Not only will this help individual schemes navigate the uncertain waters ahead, it will also help facilitate an understanding of how, and on what scale, climate change creates risks for the whole financial system.
2.1 Modelling the Financial Impacts of Climate Change
The modelling of climate systems is a long-established area of research. Considerable work has also been carried out to model the economic costs and benefits of climate change and related policy action. More recently, attention has turned to modelling the effects on financial markets and financial institutions. However, most models currently used by actuaries do not make explicit adjustments for climate change. They often assume that market prices fully reflect climate-related risks, despite the warnings of financial regulators and others that this is unlikely to be the case.
Of the analysis of financial impacts that is currently available, most focuses on bottom-up climate-related risk analysis and reporting of investment impacts and does not consider top-down integration via macro-economic risk analysis into asset-liability modelling and long-term strategic asset allocation.
Although bottom-up approaches for carrying out climate scenario analysis are useful for some purposes, they suffer from a number of disadvantages. They are mainly focused on individual companies or sectors on the assets side or individual effects on health or mortality on the liabilities side. They are unable to take economic networked effects into account, thus missing the structural impacts on the global economy and making it difficult to consider assets and liabilities consistently.
A top-down or “systemic” perspective is increasingly being considered in the academic literature, as well as in guidance documents, and by regulators and key experts in the fieldFootnote 11 . Such a top-down approach to scenario analysis captures the systemic nature of climate risks that are not identified in “bottom-up” metrics and methodologies.
It is acknowledged that a micro-economic approach is necessary to drill down to the individual holding level. This is important for understanding how climate risks are distributed within the investment portfolio and hence where mitigating actions should be focused. Therefore, “top-down” and “bottom-up” approaches to climate scenario analysis are complementary and both need to be considered.
3. Introducing the Systemic Climate Risk Scenario Tool
For this paper, we have used ClimateMAPS, the top-down modelling tool developed by Ortec Finance in partnership with Cambridge Econometrics. This tool combines climate science with macro-economic and financial modelling in order to integrate quantified systemic climate risks and opportunities (both physical and transition) into traditional multi-horizon real-world scenario sets. The climate risk integration logic “ties together” climate science, macro-economic modelling and financial modelling. The methodology is relevant for a broad range of financial organisations, covers both physical and transition risks and provides granularity down to the country and sector level across asset classes for several global warming pathways and stress-test scenarios. It is described in more detail in Appendix A.
ClimateMAPS is not the only modelling tool that could have been used. The precise numerical results from the modelling would be different had another tool been used. We consider that ClimateMAPS provides useful insights in spite of its limitations (see section 3.2), and think it likely that other tools might provide similar insights – an interesting area of further work would be to perform some comparisons across different modelling tools.
We have used ClimateMAPS to model the effects of three different climate pathways through sets of alternative economic assumptions that mimic various possible evolutions of the economy depending on which climate pathway the world follows. The scenarios aim to be a realistic representation of possible policy, technology and physical risk developments under different temperature pathways. They therefore represent plausible climate-aware real-world scenarios, rather than climate stress-test scenarios, i.e. they are not potential worst-case scenarios.
Each pathway includes a set of climate-related risks and opportunities. These risks can be further broken down into physical and transition risks. For example, risks arising from a transition to a low-carbon economy require a large shift of investments across all sectors towards low-carbon alternatives. On the other hand, if the world continues on an unchanged path, more physical risks will come into play and disrupt expected growth. It should be noted that there are some physical effects that will materialise regardless of the pathway, due to locked-in impacts caused by greenhouse gases already emitted over the past decades. These physical effects are much smaller if we transition towards a low-carbon economy, but they should not be neglected.
3.1 Climate Pathways
The three climate pathways that we have modelled are shown in Figure 1 and described in more detail in Appendix B. They consist of two pathways in which the world transitions to a low-carbon economy in a way that is consistent with the Paris Agreement, and one in which there is no such transition.
Climate change pathways modelledFootnote 12 .

In the Paris Orderly Transition pathway, action to achieve the Paris Agreement goals starts immediately and continues until net zero global emissions are achieved in 2066. Because of the timely awareness and response of policy and financial actors, the pricing in of climate-related risks (transition and physical) takes place gradually over the period 2020–2024. It should be noted that this pathway is expected to limit average global temperatures to below 2°C (75% probability) but not necessarily 1.5°C (50% probability) by the end of this century. The alternative 1.5°C narrative is of increasing interest to financial institutions, especially those which have committed to net-zero emissions by 2050. Achieving this pathway with a greater probability than 50% would require an even steeper transition pathway (based on IPCC SR1.5 instead of RCP 2.6) with quicker technology take-up, stricter policy measures and negative emissions from carbon capture technologies and/or afforestation/reforestation measures.
The Paris Disorderly Transition pathway includes the same real-world transition risks and opportunities as the Paris Orderly Transition pathway. The assumptions regarding matters such as policies across sectors and countries as well as technology uptake are the same in both pathways. The physical risks associated with a Paris pathway, i.e. those gradual physical risks and extreme weather events associated with staying below 2°C global average temperature rise from pre-industrial levelsFootnote 13 by 2100, are also the same for both. What differs, however, is how markets become aware of, and address, these transition and physical risks. In the Paris Disorderly Transition pathway, the financial markets have little initial awareness of the scale and speed of the transition that is required. There is an abrupt realisation of the problem in 2024, followed by a re-evaluation of assets directly and indirectly related to carbon-intensive economic activities. In addition, stocks and bonds are abruptly re-priced in 2024, with a consequential sentiment shock, i.e. a carbon bubble/stranded asset event, in 2025. These abrupt responses on financial markets also lead to increased market volatility from 2024 to 2026.Footnote 14
In the Failed Transition pathway, there is no impetus for policymakers to implement additional policies over and above those already in place, and therefore, the Paris Agreement goals are not achieved. The scale and potential impact of the physical risks to 2050 that this pathway implies are priced in over the period 2025–2029. The severe physical risks beyond 2050, and the structurally lower growth expectations due to these physical risks, are then considered as part of a second repricing in the period 2035–2039.
These three climate-aware pathways are compared to a climate-uninformed baseline economic outlook, in which no account is taken of the effects of future temperature increases, climate-related policies or technology trends. More details of the baseline are provided in Appendix A.
3.2 Limitations
Given that the future is uncertain, the random variation in future economic variables and investment returns over the short term may result in experience that is significantly different to the expected long-term average experience. This is true of all stochastic financial models but is particularly important here because there is material uncertainty in all aspects of climate scenario modelling. The use of judgment is required at all stages in both the formulation and application of climate scenario models.
Furthermore, as most current economic models are built on past experience, including implicitly the assumptions that climate change is not occurring, and there is no energy transition, there is an important question for users of these models about the level of uncertainty inherent in them.
The modelling is intended to illustrate plausible impacts on a hypothetical UK defined benefit pension scheme. It considers the economic impacts on the assets and liabilities, and hence the funding position, but not the impacts on demographic variables or the employer covenant. The impacts will vary significantly by scheme particularly because of differences in (amongst other things) time horizon, risk appetite, employer covenant, investment strategy and funding position. Furthermore, rather than focusing on the absolute results under each pathway, we encourage readers to focus on the relative results of the climate-aware pathways compared with the climate-uninformed baseline.
The pathways we have modelled do not cover the full range of possibilities. For example, our Paris Disorderly Transition assumes a late realisation only on the part of the financial markets of the physical and transition risks of climate change. Other possible drivers of disorder include a late realisation of the risks by policymakers leading to abrupt policy action, unexpected technological breakthroughs, or a sudden shift in consumer sentiment. These would all result in disorderly impacts that would differ in impact and timing from what we have modelled. Moreover, the actual outcome is likely to be different from any of our pathways. However, the pathways do give some idea of the types of impacts that may be seen and of their potential relative significance.
The model we have used relies on Cambridge Econometrics’ macro-econometric model E3ME to integrate transition and physical risk drivers and calculate their impact on macro-economic outputs (see Appendix A). E3ME considers only carbon dioxide (CO2) emissions from energy use and does not model other emissions or emissions from agriculture or changes in land use. In order to capture the effects of other greenhouse gas emissions, the model uses a climate sensitivity coefficient that implicitly includes these other emissions. In addition, E3ME assumes that the supply of natural resources (e.g. water, forest) is equal to demand, i.e. only demand is modelled, not supply. Other models are available but as actuaries with some experience in this field, we are satisfied that this is a reasonable model and captures most of the features that we would like.
The modelling translates the impacts of climate-adjusted GDP shocks onto a wide range of financial and economic variables. To do this, GDP is the only translation mechanism from the macro-econometric model to the stochastic financial scenario model. Other potential translation mechanisms (such as carbon-price impact on inflation and interest rates) are out of scope and follow purely from the estimated relationships with GDP in the financial model. The results of the modelling are highly dependent on the assumptions used to translate the GDP shocks onto the other variables.
There is particular uncertainty about how climate change might affect interest rates and inflation since there has not yet been much research in this area, and the available evidence is mixed. Historically, inflation and interest rates have generally been lower when economic growth is low. In this model, inflation and interest rates fall broadly together in the climate pathways which means that the real interest rate, which is the most important driver of pension scheme liabilities, does not change that much. That is, in the coming 20 years, real rates are assumed to decline by 10 (Paris) to 15 (Failed Transition) basis points relative to the baseline. By 2060, real rates are expected to be 30 (Paris) to 60 (Failed Transition) basis points lower than the climate uninformed baseline. However, plausible narratives can be constructed in which interest rates fall but inflation is stable or even rises. As an example, Aon has produced a “Forced Green” scenario in their Climate Change Challenges paperFootnote 15 which explores the impact of delayed action for five years, with governments eventually forced to address greenhouse gas emissions due to increasing extreme weather events leading to lower nominal yields but higher inflation. Such scenarios, which are not considered in this paper, could lead to significant increases in the value of liabilities.
Existing research on how climate change affects financial market volatility is limited and inconclusive. Volatility might increase as the physical and transition impacts of climate change unfold, particularly if this happens in an unpredictable manner. Due to the inconclusiveness of the research, the modelling does not make any allowance for this, except in the Paris Disorderly Transition pathway during the period 2024–2026 whilst pricing in of climate-related risks takes place.
The outputs of this paper focus on median results and compare the projections to a “climate-uninformed” baseline that assumes historic trends with no allowance for additional climate impacts. Almost all the charts and tables are referenced to this baseline, so that calibration of the baseline largely cancels out, enabling the discussion to focus on the economic and financial impact of the three different climate pathways. The impact on tail risks will be significantly influenced by any increases in financial market volatility, and thus, we have focused on median results in this paper. Future work could be undertaken to consider the impact of different baseline assumptions and further investigation of tail risk impacts.
There is a great deal of subjectivity in the assumed timing of market movements. In our model, the biggest market movements under a Failed Transition pathway occur after 2030, which is after our example scheme has started reducing the investment risks. The worst impacts are thus avoided. However, the market movements could occur a lot earlier, in which case the funding position would look a lot worse. For example, analysis by the Cambridge Institute for Sustainability Leadership of a “No Mitigation” scenario found that all portfolios experience losses over the next five years, the largest being a 45% loss for the portfolio with the highest equity allocation (60%)Footnote 16.
The modelling does not incorporate any changes to the definitions of UK inflation measures, for example in the gap between RPI and CPI measures. The effects of any changes are expected to be very similar under each scenario, so there would be minimal impact on the gap between the climate-aware scenarios and the climate-uninformed baseline.
The modelling is based on market conditions on 31 December 2019 and makes no allowance for subsequent events, notably the COVID-19 pandemic.
Furthermore, it should be noted that the modelling does not consider broader environmental tipping points and knock-on effects, such as climate change-related migration and conflicts. Nor does it consider the potential for food or other resource shortages which may lead to both lower GDP and higher inflation. In aggregate, it is quite likely that the modelling is biased to underestimate the potential impacts of climate-related risks, especially for the Failed Transition pathway.
4. Case Study: Applying the Tool to a UK DB Pension Scheme
The case study in this section is based on a hypothetical UK defined benefit pension scheme and provides an illustrative example of the type of forward-looking, quantified analysis that can be done using climate scenario analysis. It provides a perspective of climate-related risk under three different global warming pathways: a Paris Orderly Transition, a Paris Disorderly Transition and a Failed Transition. All three climate pathways are compared to a climate-uninformed baseline.
Due to the long-term nature of climate risks, the time horizon is longer than typical periods utilised by pension schemes. The case study analysis covers projections over 40 years (until 2060) and is either expressed in absolute levels or as a difference to the baseline (climate-uninformed) pathway, i.e. an unadjusted econometric model. The baseline and all climate-adjusted economies used in this case study are built on the December 2019 market situation.Footnote 17
The key characteristics of the case study are given in section 4.1, with more details of the investment profile in Appendix C. Section 4.2 describes the progression of the scheme’s funding position under the three climate pathways. Appendix D outlines the GDP and asset class returns underlying the pathways.
4.1 Scheme Description
The example pension scheme that we use in our case study has been chosen to be fairly representative of the current situation of many DB schemes in the UKFootnote 18 . It has a relatively high initial allocation to growth assets and relatively low hedging ratios which results in higher exposure to climate risks than a more mature scheme with a low allocation to growth assets. It retains its exposure to growth assets throughout the next decade. The scheme has the following characteristics:
-
Liability profile. 80% of the cash flows are linked to RPI, and the remainder are fixed, with an initial duration of around 17 years. There is no further accrual of benefits. The projections focus on a Long-Term Funding Objective, calculated using a discount rate of gilts+0.5% paFootnote 19 . On this basis, the scheme starts with an initial value of liabilities of £133 million.
-
Investment profile. The initial market value of assets is £100 million, which are initially invested 50% in growth assets and 50% in bonds, with around 50% of the liabilities hedged against interest rate and inflation risk. From 2030 to 2040, it is assumed that the scheme will linearly reduce the risk to be 100% bonds with 100% interest rate and inflation hedging. More details are included in Appendix C.
-
Cash contributions. The liabilities and investments give a starting funding level of 75% on the Long-Term Funding Objective. To help to eliminate the deficit, a Recovery Plan has been agreed such that company contributions of £670,000 are paid annually over the first 10 years. These contributions have been set based on maximum affordability to the sponsoring company, such that they do not impact on the company’s growth plans.
On non-climate adjusted median assumptions (by which we mean that there is a 50% chance that experience will be better and a 50% chance that experience will be worse), we estimate that the scheme will reach 100% funding on the Long-Term Funding Objective after 10 years (assuming the Recovery Plan is followed in full). This is shown by the median baseline case in Figure 2.
Funding level projections: 5th, 50th and 95th percentile outcomes.
It is assumed that no changes are made to cash contributions or the asset allocation in the light of experience.
4.2 Pension Scheme Performance
In this section, we analyse the performance of the pension scheme across our three climate-informed pathways and the climate-uninformed baseline. For this, we generate 2000 stochastic economic scenarios for the period 2020–2060 for each climate pathwayFootnote 20 . For each pathway for each scenario for each future year within this time period, we calculate the investment return, the resulting value of the assets and the value of the liabilities (taking into account inflation and interest rates in the specific scenario), and the resulting funded ratio. In this section, we show the impact of the different pathways on the funded ratio and discuss some of the considerations that apply. Appendix D analyses underlying drivers of the differences in impact that we see.
Each of the pathways is intended to be plausible, but we have not attempted to assign a probability to the likelihood of each one occurring. We do not know which climate pathway will transpire in practice – and it could look quite different to those we have modelled – so the outcomes illustrated in Figure 2 can best be interpreted as widening the funnel of doubt that pension schemes should consider. In other words, rather than considering the 5th to 95th percentile range for one scenario, readers should consider the range from the worst 5th percentile case to the best 95th percentile case and recognise that this is likely to represent much less than the middle 90% of possible climate-aware outcomes given the uncertainties involved.
Figure 2 shows the following impacts on progress towards the Long-Term Funding Objective:

Figure 3 illustrates the median outcomes of the funding level projections: focus on median outcomes when they are depicted as difference to climate-uninformed baseline. We can see that the climate-uninformed baseline is too optimistic and underestimates the funding risks for this pension scheme. Furthermore, the Long-Term Funding Objective is met much later in the Paris Disorderly Transition pathway than in the other pathways. The probability that this pension scheme will be fully funded on this basis at the originally-expected date of 2030 is less than 50% unless additional deficit contributions are paid.
The differences in funding level development between the different pathways are mainly due to differences in investment returns up to 2030 (see Appendix D). The analysis assumes that the scheme will not make any changes to its asset allocation between 2020 and 2030 and that contributions will be payable throughout this period. After 2030, the pension scheme reduces the investment risk to one with 100% invested in fixed income, and 100% hedging of inflation, interest rate and currency risk. The funding level trajectory beyond 2030 is therefore predominantly determined by the funding level in 2030. However:
-
If the funding were to be below target in 2030, then the trustees may decide not to reduce the investment risk but to target the same returns as before. In this case, the situation is likely to look worse for the Failed Transition pathway as the growth asset markets suffer more losses after 2030. The box below illustrates what might happen if the scheme did not reduce the investment risks during the 2030s.
-
If the contributions were already at their maximum affordability, but the company then has to divert more of its cash in dealing with impacts from climate change, then it may be looking to reduce its cash contributions into the pension scheme at future valuations. This could be the case even in the Failed Transition and particularly under either Paris Transition pathway.
-
The Paris Orderly Transition pathway shows the most favourable climate-informed median funding level results in the medium to long term. This pathway is also far preferable for the economy as a whole as this pathway is the least disruptive in the medium to long term.
In interpreting these results, it is important to note that it is quite likely that the modelling is biased to underestimate the potential impacts of climate-related risks, especially for the Failed Transition pathway. In addition, readers should look at the wider context rather than considering these results in isolation. Under the Failed Transition pathway, catastrophic physical impacts would be expected in the second half of this century with severe consequences for the overall wellbeing of society. Hence, whilst the modelling above suggests that, from the scheme’s perspective, outcomes under the Paris Orderly Transition and Failed Transition pathways are similar, from a societal perspective even the Paris Disorderly Transition is far preferable to a Failed Transition. The differing long-term impacts and the attributions to different elements of climate risks are discussed further in the Companion Paper.
What-if analysis without the reduction in investment risk
One of our key modelling assumptions is that our hypothetical scheme follows a reducing investment risk path that reallocates the exposure to equities and real estate to fixed income assets during the 2030s. This assumption benefits our scheme as it hedges some of the climate risks that would occur in the second half of the time horizon. Indeed, the second pricing-in shock modelled in the Failed Transition pathway mostly does not affect our scheme’s performance thanks to this reallocation of assets. However, what would happen if our scheme keeps its asset allocation static? Figures 4 and 5 below present the evolution of the funded ratio under such an alternative static asset allocation.
Comparing these results with the first scenario, we can see that the scheme performs better on average if it does not reduce investment risk. However, the persistent allocation to equities leads to a higher risk level. In particular, this alternative scheme performs worse under the Failed Transition pathway. As the second pricing-in shock occurs, the gap between the Paris Orderly Transition and the Failed Transition pathways widens to the point where the Failed Transition falls below the Paris Disorderly Transition in 2038.
Funding level projections: focus on median outcomes (depicted as difference to climate-uninformed baseline).
Note: Difference to baseline is calculated as the ratio of climate-informed median and baseline at each year.

Funded ratio projections under a static asset allocation.

Funding level projections under a static asset allocation: focus on median outcomes (depicted as difference to climate-uninformed baseline).
Note: Difference to baseline is calculated as the ratio of climate-informed median and baseline at each year.

We have summarised further risk metrics related to the funded ratio in Table 1 below. We see that using the climate-uninformed baseline strongly underestimates the funding risks of this pension scheme. Especially in the Paris Disorderly Transition pathway, the long-term probability of underfunding is significantly higher than the probabilities emerging from the climate-uninformed baseline. Of the climate-informed pathways, the Paris Orderly Transition pathway is the most favourable in the long run for our pension scheme.
Selected metrics for the funding level (percentages)

The following factors should also be considered alongside the modelling:
-
Even once the scheme has reached full funding on a gilts+0.5% basis, there remain risks which we have not captured. The trustees may have a further target to buy-out the benefits with an insurance company. We have not considered how buy-out terms may be affected by climate change but the longer buy-out is delayed, the more uncertainty there is likely to be.
-
The pension scheme is maturing. This means that cash outgoings will increase as a proportion of assets. In this environment, volatility in the markets is likely to increase the chance of being a forced seller of assets and cause a greater drag on investment returns. Climate change is likely to lead to greater volatility. As noted in section 3.2, the modelling incorporates greater volatility in the Paris Disorderly Transition pathway, but not the other climate-aware pathways.
-
We have assumed a constant level of contributions. The strength of the sponsoring company covenant may also be impacted by climate change, and this should be considered alongside the funding impacts if possible.
-
The principal limitations of our modelling are described in section 3.2. These are expected to underestimate the potential financial impacts of climate-related risks.
5. Conclusion
There is an increasing expectation that pension schemes and other financial institutions use scenario analysis to understand their potential exposure to climate-related impacts. As noted in section 1, climate scenario analysis is expected to become a legal requirement for large UK pension schemes soon. This paper illustrates one possible approach that uses a top-down model to explore the financial impacts of three plausible climate pathways on the funding position of an example UK defined benefit pension scheme. The progression of the funding position is worse under all three pathways, indicating that advice based on the climate-uninformed baseline would underestimate the funding risks. Given that most models currently used by actuaries do not make explicit adjustments for climate change, it seems quite likely that pension schemes are systematically underestimating the funding risks they face. In the UK, this may be a concern for the Pensions Regulator and may also have implications for the Pension Protection Fund.
It is important to note that the climate pathways illustrated are not intended to be extreme, even though they can result in extreme financial outcomes as illustrated by the 5th and 95th percentiles. The climate impacts for the example scheme under “worst-case” scenarios could be much larger than those illustrated. Moreover, the model we have used does not take account of the full effects of climate change, so there is a strong bias towards optimism in our results.
The example scheme is closed to accrual, so the bulk of cash flows occur in the next 25 years. Due to the reduction of investment risk that occurs from 2030 onwards, the scheme is most exposed to climate risks prior to this date. We expect this time horizon to be typical for DB pensions actuaries’ work, but some schemes – for example, those which are less mature and will remain invested in growth assets for longer – will have greater climate risk exposure. Conversely, schemes that have already largely reduced their investment risks may have fairly limited exposure to climate risks. Nonetheless, some climate risks will remain since matching assets are not immune to climate risks (particularly corporate debt due to credit risk) and cannot match uncertain cash flows perfectly. In all cases, the extent of the sponsoring employer’s exposure to climate risks is relevant: the greater a scheme’s climate risk exposure through the sponsor covenant, the lower its capacity to tolerate climate risk exposure through its assets and liabilities (all else being equal).
There will be significant timing risk for many schemes – outcomes will depend on precisely when climate shocks and market repricing occur relative to the risk reduction path as this could disrupt a scheme’s journey planning. Particular care should be taken when modelling “disorderly” pathways in schemes with significant investment risk reduction expected over the next few years so that the scenario shock is still considered and not arbitrarily assumed to occur after most of the risk reductions have taken place.
If schemes expect to transfer their liabilities to an insurance company, they need to consider how climate risks might affect insurer pricing in future (or even the solvency of the insurer). Climate risks might affect annuity prices earlier and more significantly than they affect the scheme’s funding position. Indeed, we anticipate climate change will receive increasing attention from UK life insurers in the next few years due to the Prudential Regulatory Authority’s recent supervisory statement on climate changeFootnote 21 and the Bank of England’s proposed climate stress testsFootnote 22 . Hence, the longer-term financial impacts of climate risk may be relevant even for pension schemes that have already largely reduced their risks.
For actuaries advising pension schemes, it is clear that some investment strategies are likely to be materially impacted under climate pathways relative to climate-uninformed projections. In these circumstances, analysing the potential impacts can inform actuaries’ advice on likely time horizons to full funding, impacts of different investment strategies and suitable deficit repair contributions. Managing the trade-offs for climate risks is particularly challenging as the traditional counterbalances to an increased deficit of larger allocation to growth assets or longer time horizons may both increase sensitivity to climate-related risks and may be no longer viable. Such tensions may be eased by considering the bottom-up perspective that was mentioned in section 2.2. The bottom-up perspective can help build investment portfolios that are more resilient to climate risks than the traditional market cap benchmark.
Climate scenario analysis for financial institutions is a relatively new area where significant work is currently underway. Over the next few years, we expect modelling approaches to become more sophisticated and consensus to start to emerge around which scenarios to use. In the meantime, we hope this paper is helpful to actuaries and others in demonstrating how such analysis can be performed and what the results might show. We encourage them to consider whether their current models may be underestimating the risks from climate change and, if so, work to address this.
Trustees and employers can use climate-change scenarios to help determine how exposed they may be to climate change. This includes factoring in how the employer may be able to respond in the scenarios – for example whether they would be able to afford an increase in contributions or even whether they would be able to continue the current level of contributions. Historically trustees have been nervous about taking action which may be deemed to not be in the best financial interests of their members. However, scenario modelling can help give the trustees the evidence they require in order to take actions to help mitigate climate change risks and it is rapidly becoming the case that trustees will be deemed to be not acting responsibly if they do not take any action. Indeed, there are a number of actions that trustees can take in order to mitigate climate risk, for example:
-
There are many changes which can be made to investment strategies, which are beyond the scope of the paper:
-
They can engage with the employer to understand how resilient it is to climate change and which scenarios it is most exposed to. This may encourage the employer to take steps to reduce these risks.
-
In any event, the trustees can at least factor these risks into their funding and investment strategies and plan in advance how they would react should they start to materialise. In this way, they can hopefully mitigate at least some of the risks.
Appendix A. Modelling Methodology
The modelling methodology was developed and tested in 2018 by Ortec FinanceFootnote 23 during a joint pilot project with its strategic partner Cambridge EconometricsFootnote 24 along with leading academics and a group of clients. After being made more broadly available in early 2019, asset owners, asset managers and insurance companies from around the world have used the methodology for informing their strategic investment policy.
Methodology Explained
The climate risk integration logic applied in order to “tie together” climate science, macro-econometric modelling and financial modelling has been shaped and can be is outlined in Figure 6:
The climate change impact per global warming pathway and the policy and technological changes necessary to reach the different temperature targets are based on robust climate science. These assumptions inform the macro-econometric model of Cambridge Econometrics, which takes into account worldwide macro-economic interactions. The Cambridge Econometrics E3ME model is a non-equilibrium global macro-econometric model with linkages between the economy, the energy sector, and the environmentFootnote 25 . It can fully assess both short- and long-term impacts and is not limited by many of the restrictive assumptions common to Computable General Equilibrium (CGE) models. The model facilitates the integrated treatment of the world’s economies, energy systems, emissions and material demands. This enables it to capture two-way linkages and feedbacks between these components.
The outputs from the macro-econometric model are deltas (differences) in annual growth rates per country, from a macro-economic baseline outlook that does not make allowance for any climate-specific inputs, i.e. climate-uninformed.
This climate-uninformed baselineFootnote 26 assumes the same implicit rates of innovation, physical climate damage and fiscal shocks that have been observed in the past. It assumes no increase of physical risks due to climate change and does not make any explicit assumptions about the transition to a low carbon economy. This enables the examination of the impact of different climate pathways but the financial impacts outlined within this paper suggest that this assumption does not remain credible.
Within the climate-uninformed baseline pathway, financial returns for each asset class are based on long-term assumptions related to GDP growth and adjusted for market conditions at the start of the modelling period (31 December 2019). The median returns for each asset class, as well for the example pension scheme’s total assets, are summarised in Table 2 below.
Median asset class returns under baseline pathway over each time period

The “climate-adjusted GDP deltas” per country/sector, per year, are then input into the Ortec Finance stochastic financial model. This model translates the impacts of the climate-adjusted GDP shocks onto a wide range of financial and economic variables (including interest rate, inflation, impacts on different asset classes) via stylised facts based on historic data and economic rationale.
The resulting systemic climate risk-aware scenarios set delivers quantified climate-adjusted consistent global economic and financial outlooks up to 2060 differentiated per country/sector and per global warming pathway, which then can be used for climate-informed portfolio analysis. Given that this analysis is compared to the climate-uninformed baseline, the first-order effects of the assumptions in the financial projections cancel out to enable a focus on the relative outcomes of the different pathways. Of course, second-order effects from the assumptions and GDP projections remain. We have not investigated the sensitivity of the results to these impacts.
It should be noted that the pathway assumption narratives extend out to the end of the century as this aligns with climate science time horizons. Financial modelling is not extended beyond 2060 as, under the Failed Transition pathway, changes might become so dramatic that stability of the entire financial system is at risk. This is uncharted territory and would render quantified modelling results very uncertain. It should be noted, however, that in order to capture in particular the likely severe physical risks beyond mid-century under the Failed Transition pathway, these structurally lower growth expectations have been “priced-in” in the period 2035–2039.
Ortec Finance updates its climate-informed scenario sets every six months to reflect the latest market situation, as well as to capture any advances in climate science and next iterations of the modelling methodology. The scenario sets used here reflect December 2019 market conditions and incorporate all the modelling updates up to March 2020.
Scope of the Modelling
Figure 7 below summarises the scope of the available forward-looking climate-informed real-world scenarios and asset class risk assessments. The asset classes modelled in this paper implicitly use market cap weightings (or MSCI indices for real estate).
Systemic Climate Risk Scenario Solution – climate risk integration logic.

Scope of ClimateMAPS model.

The energy transition sectoral impacts are captured directly within the equity market modelling and allowance made for the compositions within each regional market. These impacts are not directly captured within the credit markets modelling (e.g. allowance for the higher energy exposure in US High Yield) although there is an implicit allowance through the connection of domestic credit markets with domestic GDP. (Credit markets with higher energy allocations typically reflect higher sensitivity to energy transition in their GDP.)
The systemic climate risk portfolio modelling tool helps investors to determine whether their current investment strategy is likely to be robust across different global warming pathways. The quantified results provide insights into the effects on risk and return of the risks associated with different climate pathways and how they differ per time horizon. In this way, trade-offs can be assessed between, for example, a Paris Disorderly Transition to a low carbon economy and Failed Transition pathway. In addition, investment opportunities, for example innovative renewable energy or transport technologies, may be identified. In summary, the methodology captures the directional signal of potential impacts stemming from systemic climate risks for an investor’s investment portfolio.
Appendix B. Climate Pathway Narratives
The modelling in this paper considers two broad options for the future: either the world continues on our current path or we transition to a low-carbon economy. To represent these two alternative pathways, Ortec Finance has developed economic scenario sets to reflect these two variants: the Paris Transition pathway and the Failed Transition pathway. These two pathways inform the underlying transition and physical climate risk parameters. Furthermore, the Paris Transition pathway is then broken down into two possible market reactions: orderly versus disorderly. In the latter case, the transition risks are supplemented by a confidence shock representing an aggressive market correction of carbon-intensive and related assets.
Each main pathway is built on key policy and technological assumptions across countries and sectors to represent transition risks and opportunities. Physical risks are composed of, on the one hand, gradual physical risks, such as sea level rise and temperature effects on worker and agricultural productivity. On the other hand, physical risk also derives from increasing frequency and loss impacts of extreme weather events, such as floods, storms, wildfires, that are attributable to climate change.
A continuation of current policies and technological trends will lead to increasing global CO2 emissions (Failed Transition pathway) and in turn continuously increasing average global temperature reaching up to 4°C by the end of this century. However, in a pathway that limits warming to below 2°C, CO2 emissions peak in 2020 and decrease sharply to reach net zero before 2066 (in both Paris pathways). This is illustrated in Figure 8.
Annual global CO2 emissions.
Source: Cambridge Econometrics
Note: Only CO2 emissions from fossil fuel combustion and industrial processes are currently included in E3ME, other greenhouse gases and emissions from land use, i.e. CO2 equivalents, are not currently modelled.

There is much uncertainty around the extent of the global temperature response to increasing emissions but not the direction. In order to calculate how these emissions trajectories map to a projected change in average global temperatures above pre-industrial levels, we use a ratio of the globally averaged surface temperature change per unit carbon dioxide (CO2) emitted (transient climate response to cumulative carbon emissions; TCRE) based on a 2018 paper by Millar and FriedlingsteinFootnote 27. The TCRE in this paper (1.43–2.37°C per trillion tonnes of carbon (TtC)) are within the established range for the TCRE used in other climate model simulations and are used widely in the scientific literature, including the IPCC Special Report on Global Warming of 1.5°C, although recent research suggests these figures may be underestimatedFootnote 28 .
The TCRE implicitly captures a unique relationship between CO2 emissions, non-CO2 emissions and total warming, although there is large uncertainty about the extent to which this relationship will continue in the future.Footnote 29
Regional temperature anomalies are derived by adjusting the global projected temperature changes with the regional differences in vulnerability to temperature change from the IPCC (Figure 9).Footnote 30
Expected average global temperature change (above pre-industrial level) until 2100.
Source: Cambridge Econometrics

Although there is uncertainty about the level of warming since the pre-industrial era, there is some consensus that levels of global warming were between 1.1 and 1.25°C above pre-industrial levels in 2018 (see Figure 10 below). Future warming effects are estimated by taking the cumulative emissions from 2019 onwards and multiplying them by the TCRE term, which translates total cumulative CO2 emissions to a change in temperature.
Global temperature change from multiple datasets, presented as the lower bound on warming since the pre-industrial era (defined here as 1720–1800).
Source: Climate Lab Book, Defining “pre-industrial” (2017). https://www.climate-lab-book.ac.uk/2017/defining-pre-industrial/

In the Paris Transition pathways, we take assumptions for the current level of warming and the TCRE that are aligned to the consensus view coming from the climate literature. Specifically, it is assumed that temperatures were 1.1 °C higher in 2018 than in the pre-industrial era and the median TCRE, 1.84°C/TtC, is used to estimate the effects of cumulative emissions on temperature change.
In the Failed Transition pathway, by contrast, to reflect a slightly more extreme case, we assume higher levels of current warming and a high responsiveness of temperature to emissions. In this scenario, we assume that warming between the pre-industrial era and 2018 is approximately 1.25°C and that the TCRE is equal to 2.29°C/TtC.
The different assumptions about warming above pre-industrial levels and the TCRE in each scenario are motivated by:
-
the uncertainty around these parameters within the scientific literature – the Failed Transition scenario uses a higher TCRE than the Paris pathways, reflecting recent research suggesting that previous TCRE figures may be underestimated; and
-
the fact that, due to non-linearities and tipping points, it is highly likely that the TCRE will be higher under higher warming scenarios.
Paris Orderly Transition Pathway
To reduce emissions in line with the Paris Agreement, economies must reduce their carbon intensity. Given the current state of play of technology (and likely technological trajectories) especially relating to energy efficiency and negative emissions, it is unlikely that current fossil fuel use can be maintained as well as meeting emission reduction requirements. This implies a strong shift away from fossil fuels, and related physical and human capital, business models and supporting financial and regulatory infrastructure. Almost every sector in the economy will have to be retooled in order to shift away from fossil fuel dependency in a very short timeframe of one to two decades.
In the Paris Orderly Transition pathway, political and social organisations act quickly and in a coordinated manner to meet the objectives of the Paris Agreement. With this immediate action, global CO2 emissions start to fall in 2020. Financing to meet ambitious decarbonisation investment goals is made available in all regions worldwide.
Demand for coal, oil and gas decreases steadily and the share of renewables in the electricity generation mix increases to almost 70% by 2050. There are investments in carbon capture and sequestration technology (CCS), including some limited deployment of net-negative emissions technologies such as bioenergy with carbon capture and storage (BECCS). The share of electric vehicles on the roads steadily increases to almost 70% by 2050 and a large share of the remaining conventional vehicles use biofuels instead of petrol or diesel.
A reduction in fossil fuel demand and prices leads to stranded fossil fuel assets. There is a negative economic impact in fossil fuel exporting regions (such as the Middle East and North America), where lower royalties from natural resource extraction deplete government revenues. In these regions, the double effects of reduced oil and gas export revenues and reduced government spending drive a negative impact on GDP.
Because of the timely awareness and response of policy and financial actors, the pricing in of climate-related risks (transition and physical) takes place gradually over the period 2020–2024.
In many other regions, investments in low-carbon technology and energy efficiency measures, reduced dependence on imported fossil fuels and the recycling of carbon tax revenues back into the economy, drive a short- to medium-term GDP stimulus (under the assumption of an orderly transition).
In this pathway, net-zero global emissions are achieved by 2066, but physical impacts continue to increase over the rest of the century due to the delays in the reaction to the temperature rises. Locked-in physical climate impacts in a 1.5°C world are less severe than in the Failed Transition pathway, but nonetheless have negative impacts on growth when compared to today’s baseline in a world that is at roughly 1.1°C of warming (see Figure 10 above). To illustrate this, there may be a 20% increase in climate-related extreme weather events by 2050, increasing to over 25% in 2100 compared to the number of worldwide extreme weather events we observe today. In addition to the higher frequency, the severity of these events may be 10% more than what is seen today even under a successful transition scenario.
Paris Disorderly Transition Pathway
The Paris Disorderly Transition pathway contains the same general transition and physical risk parameters as the Paris Orderly Transition pathway. This means the adjustments in longer term growth expectations implemented in the stochastic financial model are identical.
What differs, however, is an assumption of belated awareness by financial market participants of the scale and speed of the transition required that will likely lead to additional systemic risk via two main channels:
-
1. Stocks and bonds of assets directly and indirectly related to carbon-intensive economic activities (“stranded assets”) are abruptly re-priced within one year (2024),
-
2. With a consequential sentiment shock in 2025 and an increase in market volatility around these events (2024–2026).
The abrupt re-pricing, which is referred to as a “Minsky moment” by the Bank of England, is assumed to be triggered by a sudden shift in investor sentiment. It should be noted that our modelling does not prescribe the exact trigger cause for a Minsky moment, but rather focuses on exploring the consequent financial implications of such a sentiment shock. In the event of a “Minsky moment,” fossil fuel assets may undergo a fire-sale by investors, at the moment when they fully understand the real risk involved in holding these in their portfolios. This would lead to a race to the bottom, where investors try to get rid of these assets as quickly as possible. This loss would propagate across the real economy and could threaten entire industries that are dependent on fossil fuel income.
This unexpected and aggressive market reaction causes an increase in uncertainty (loss of confidence). This in turn leads to greater fluctuations in market prices and greater deviations from the mean and therefore an increase in volatility. The shock and increased volatility in fossil intense sectors may lower overall market confidence and therefore impact other asset classes. It thus has a negative systemic impact on the financial market and the economy as a whole. Intuitively, the narrative can be compared to the contagion and confidence effect that the crisis in the real estate sector had on the rest of the financial system and the economy during the 2008 financial crisis. In our narrative, however, it is fossil fuel-related stranded assets that trigger the crisis instead of high-risk mortgage products.
Failed Transition Pathway
The Failed Transition pathway reflects current policies as of 2019. This means that low-carbon policies in the Failed Transition pathway are assumed to be a continuation of existing policies and to have the same level of ambition, for example no carbon price in most regions, except for the continuation of existing regimes such as the EU Emission Trading System. Similarly, low carbon technology developments and the fall of relative cost of these technologies are limited compared to the Paris Transition pathways. As a result, the world will not succeed in reaching the Paris goals. Increases in consumption, particularly driven by economic growth in emerging economies, drive an increase in demand for fossil fuels and increases in CO2 emissions globally.
The physical risks thus diverge significantly from those in the two Paris Transition pathways (see also the Companion Paper). By 2050, the planet is already around 2°C warmer than pre-industrial levels (increasing to around 4°C by end of this century), and many countries are suffering from extreme drought and water shortages. Melting permafrost and melting icecaps lead to feedback loops and tipping points which drive further increases in warming. Higher temperatures lead to negative health impacts (increased prevalence of heat-related illness) and affect infrastructure that is designed to operate most efficiently in much cooler climates. This leads to a less productive labour force. Agricultural productivity is also affected, and crop yields are reduced, which drives up food prices. Lower labour productivity and higher industry costs of production (e.g. due to higher insurance premiums resulting from the increasing incidence of climate-related losses) lead to an increase in prices. These impacts are reflected in aggregate by the drag on future GDP.
The number of climate-related extreme weather events will continue to rise. The number of climate-related extreme weather events in 2100 under the Failed Transition pathway is expected to more than double from what it is today, and their average impacts much more severe. By 2100, the losses from climate-related extreme weather events could be more than fivefold what we see today.
In addition to adjusted growth expectations, the modelling also takes into account market “pricing-in” effects from a physical risk perspective. After several severe extreme weather events hit the Western world, the market becomes aware of the lower expected market performance up to 2050 due to these expected physical impacts, which is priced in over the period of 2025–2029. A second physical risk pricing in moment is modelled in the period 2035–2039 which reflects the physical risks beyond 2050. However, the modelling does not consider broader environmental tipping points and knock-on effects, such as climate change-related migration and conflicts. Nor does it consider the potential for food or other resource shortages which may lead to both lower GDP and higher inflation.
Appendix C. Case Study Portfolio Composition and Asset Allocation
The sample portfolio composition and asset allocation for our example pension scheme at the start of the time horizon is given in Table 3 as follows:
Sample UK pension scheme asset allocation table at start of time horizon

Note: The table above represents an illustrative portfolio only.
The pension scheme’s holdings are initially invested as shown in the table above, but a risk-reducing strategy is implemented over the next 20 years. For the first 10 years, the asset allocation remains static and is rebalanced annually to the allocation shown in the table above. In 2030, the risk reduction strategy starts and shifts the investments linearly (annual incremental transition) over 10 years into the following allocation as given in Table 4:
Sample UK pension scheme asset allocation table from 2040

At the same time, dynamic interest rate and inflation hedging strategies are implemented. Until 2030, 50% of the liabilities are hedged against inflation and interest rate risk. Starting in 2030, these hedging strategies are linearly increased in the same fashion as the risk reduction path depicted above. Gradually, the liabilities are hedged from 50% in 2030 to 100% in 2040 with annual incremental steps of 5%-points.
Furthermore, a currency hedging strategy is used against the pension scheme’s exposure to US dollars (USD). Half of the exposure to USD due to holdings in world equities and US High Yield is hedged. This hedging is naturally decreased over time to follow the total USD exposure.
For simplicity, we have assumed an allocation of 20% to US High Yield from 2040. In practice, we would not expect such a high allocation, but it is intended to be a proxy for a portfolio of higher yielding fixed interest type assets.
Appendix D. Understanding the Underlying Risk Drivers
Macroeconomic Impacts
The physical and transition impact narratives that are informed by the climate and macro-econometric modelling influence the behaviour of key financial risk drivers such as growth and inflation. This section illustrates the dynamics of these risk drivers.
GDP Impact
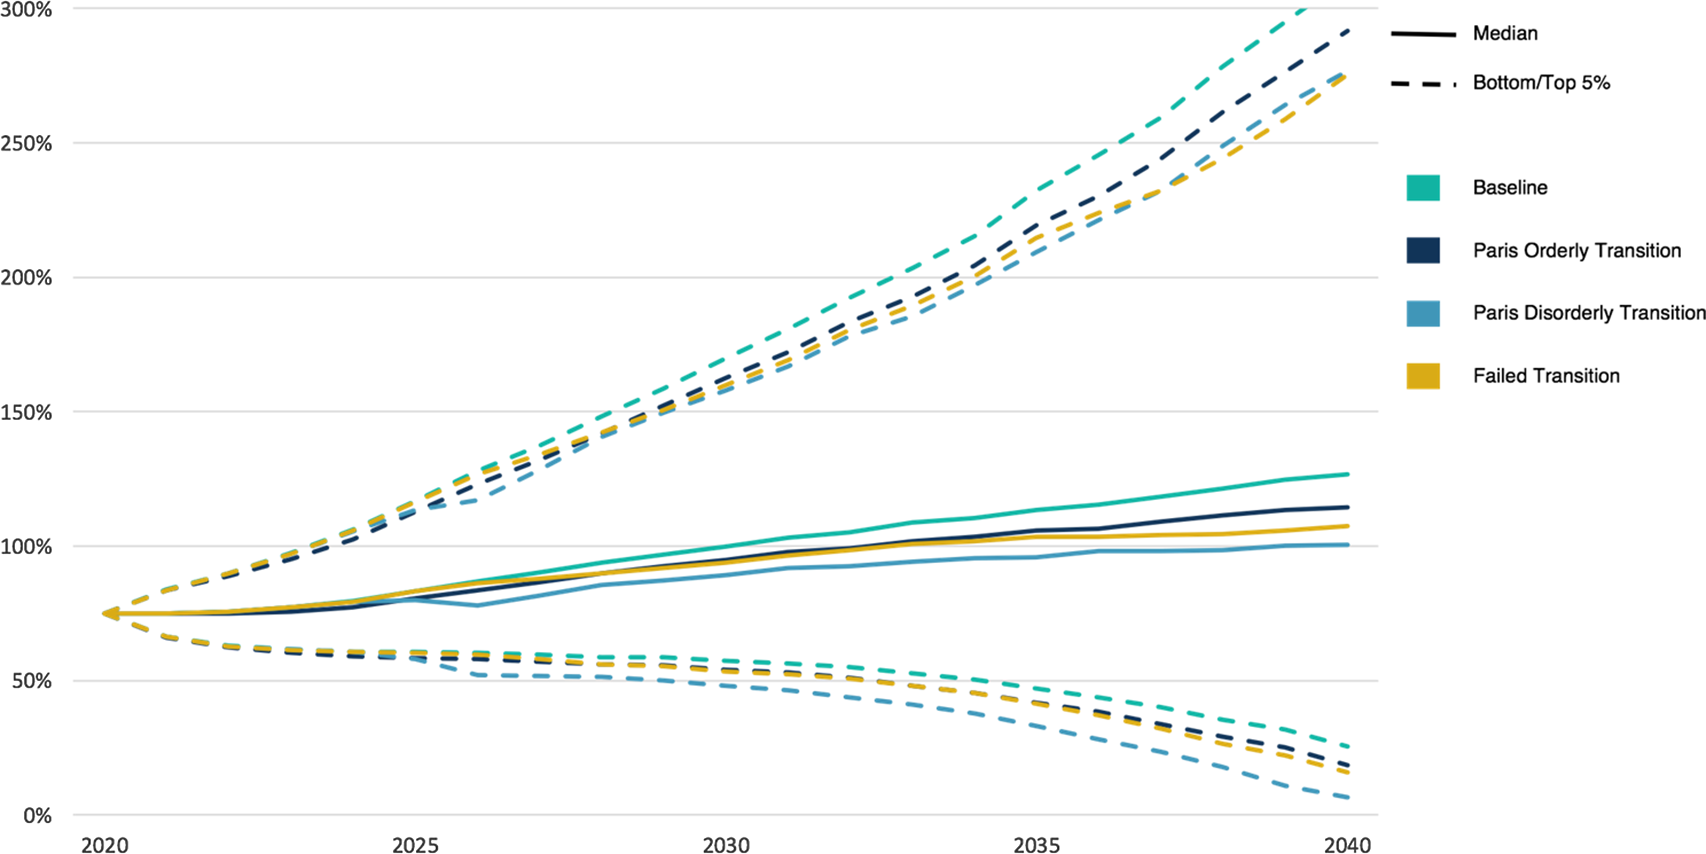
The expected impact of both successful and Failed Transition pathways on UK GDP in the coming ten years is fairly limited. Under the Paris pathways, in the short term, positive stimulus effects of low-carbon investment are offset by physical impacts and decommissioning carbon-intense activities. In the longer term, investments in low-carbon electricity and energy efficiency improvements are paid back, resulting in lower levels of consumer spending. Although the UK benefits from the recycling of carbon tax revenues (through reduced VAT and income taxes), this effect is not sufficient to outweigh the negative impacts of physical risks, higher prices for consumers and repaying debt issued to finance the transition, driving an overall small negative transition impact on GDP in the long term (Figure 11).
Climate-adjusted GDP growth UK (cumulative difference to climate-uninformed baseline pathway)Footnote 31 .

The modelling indicates that the UK might experience larger GDP impacts than the European average due to relatively higher exposure to extreme weather event risk explained by many cities at risk of more severe flooding due to climate change. This especially drives down long-run GDP growth in the Failed Transition pathway, but to a lesser extent also in the Paris pathways due to already locked-in physical effects (see Figure 12).
Decomposition of the cumulative difference in the level of GDP UK between the various climate risk drivers (difference to climate-uninformed baseline pathway).

It should be noted, however, that there is considerable variation in the impacts across geographic regions. These differences are mainly caused by the level of transition risks over the short term and physical risks over the long term. Higher temperatures exacerbate damage intensity and the frequency of natural disasters. Transition and physical risk impact economic variables and asset prices. An example is given in Figure 13 below with the differences in GDP impacts across three different regions (US, China and Canada) and how their growth expectations are affected by climate change. The Companion Paper provides more information on differences between regions.
Climate-adjusted GDP growth across regions and climate pathways (cumulative difference to climate-uninformed baseline pathway).

Inflation Impact
In the current modelling set-up and assumptions, inflation is not shocked separately, but is affected via the historic relationship with GDP. A reduction in long-term economic growth leads to a reduction in inflation in the long term, as has occurred in previous recessions. However, it might be the case that certain climate impacts would cause a negative supply shock, and in turn, one would expect inflation to increase in the short term (see Figure 14).
Climate-adjusted RPI inflation (annualised difference to climate-uninformed baseline pathway).

Nominal Interest Rate Impact
UK 10-year interest rates are not affected much in the short term due to the limited impacts on UK GDP. In the mid-term, the UK experiences some negative impacts from the transition, and in the longer term, the UK suffers more from physical risks than the European average, which translates into lower interest rates (see Figure 15).
Climate-adjusted 10-year fixed interest gilt yield (annualised difference to climate-uninformed baseline pathway).

Investment Return Impacts
The main driver of differences in investment returns in the coming decade between the different pathways is a potential price correction (“pricing-in”) in financial markets, particularly equity markets. That is, at a certain point in time, financial markets will realise what the longer-term impacts will be of the transition to a low-carbon world and what the impact will be of gradual physical risks (such as reduced agricultural productivity) and extreme weather events (whether the transition succeeds or not). By translating this impact to changes in future expected output, earnings and dividend growth, the modelling estimates the expected price correction on financial markets. This price correction differs per climate pathway and per country and sector.
The overall impact on investment return will depend on the composition of the investment portfolio. The example pension scheme’s assets are mainly exposed to climate risks through global equity and UK credit markets during the 2020s, with de-risking out of global equity and into UK and US credit during the 2030s. They are also exposed to UK interest rates and inflation, although this exposure is mitigated by hedging. The impact of climate change on the scheme’s investment returns therefore primarily depends on global, UK and US sensitivities to transition risk and physical risks.
Cumulative median investment returns for example pension scheme (allowing for de-risking).

In the Paris Orderly Transition pathway, we assume that pricing-in will take place in the coming five years, i.e. 2020–2024. The impact of this pricing-in shock is visible in Figure 16 (overall investment return) above, and in Figures 17 and 18 (equity and real estate return) below as the dark blue Paris Orderly line is below the other pathways in the first few years.
In the Paris Disorderly Transition pathway, we assume that pricing-in starts later, in 2024, and that the full price correction materialises within one year. This large price correction leads to negative market sentiment and consequently to a sentiment shock – a “Minsky moment” – in 2025, followed by (positive) price corrections in consecutive years to compensate for the overshooting in previous years. Market volatility is high in this 2024–2026 period.
In the Failed Transition pathway, in the second half of this decade investors will start to realise that the transition to a low-carbon economy will fail. Therefore, they will price in the resulting impact of increasing physical risks and extreme weather events on expected future output, earnings and dividend growth in the period 2025–2029. That is why the expected investment returns shown in Figures 16, 17 and 18 are lower in the Failed Transition pathway in the second half of the 2020s than in the first half. We assume that this first pricing-in shock reflects only the impact of physical risks and extreme weather events on growth prospects up to 2050. However, in the Failed Transition pathway, physical risks will increase significantly in the second half of this century. At some point in the future, financial markets will start to also price in these very substantial post-2050 physical risks. We assume that this second pricing-in shock occurs in 2035–2039.
Cumulative difference in equity returns, World Developed Markets (difference to climate-uninformed baseline pathway).

Figure 17 indicates that, over the coming ten years, a Paris Disorderly Transition pathway will severely impact equity returns. In the second half of this decade, investors’ realisation of a Failed Transition pathway will also have sizable impacts on equity returns. In Figure 18, we see that UK real estate is also expected to be significantly impacted by physical risks and thus by significant revaluations.
Cumulative difference in UK real estate returns, 50% office, 50% retail (difference to climate-uninformed baseline pathway).

Appendix E. Climate Impacts on the Pension Scheme’s Assets
In this section, we present the return impacts for each asset class of interest across all climate-informed pathways for our example pension scheme. This is included for those actuaries who wish to see more detailed figures, for example so they can perform broad-brush calculations themselves to get a feel for the potential impact of climate change on other pension schemes and financial institutionsFootnote 32 .
Aggregate climate impacts on overall investment return for example pension scheme over each time period (expressed as ratio to climate-uninformed baseline)

Note: Colour coding has been generated per time-bucket to compare relative impact size across the three climate pathways.
The first observation from Table 5 is the dynamics of the climate impacts. Under the Paris Orderly Transition, limited effects are observed with most of them happening in the short term. However, under the Paris Disorderly Transition these impacts are more severe due to the increased transition impacts. Naturally, the Failed Transition pathway yields the worst performance for the long term.
Diving deeper into each pathway, we note that equity returns are the most sensitive to climate change across all pathways. Real estate investments suffer to a similar extent. When it comes to UK gilts and credit, we see much smaller impacts across all pathways. Other countries such as Canada and the US face more severe climate risks. Nonetheless, other asset classes are affected due to their global and systemic nature.
Aggregate climate impacts on asset class returns under Paris Orderly Transition pathway over each time period

In the Paris Orderly Transition pathway,illustrated in Table 6, we observe that the impacts stem entirely from equities and real assets in the short term. The limited remaining impacts stem from already locked-in physical impacts generated by past emissions.
Aggregate climate impacts on asset class returns under Paris Disorderly Transition pathway over each time period

We note that the same asset classes are hurt more severely in the Paris Disorderly Transition pathway than in the Paris Orderly Transition pathway (Table 7), due to stronger pricing-in effects, the sentiment shock and increased volatility. The remainder of the horizon is similar in both pathways, with locked-in physical impacts generating minor losses.
Aggregate climate impacts on asset class returns under Failed Transition pathway over each time period

Ultimately, under the Failed Transition pathway (Table 8), limited impacts are shown in the short term since no transition occurs. However, severe losses ensue in the medium run due to pricing in impacts and in the long run (beyond 2040) because of physical risks.


 Open access