

Piloni di Torniella deposit (Roccastrada, Tuscany, Italy) is an important mining site for kaolin in Italy; this site has been a major provider of raw materials to the Sassuolo district (Emilia-Romagna, Italy), one of the most important ceramic tile production clusters in Europe, since the beginning of the 2000s, one of the most important ceramic tile production clusters in Europe (Sammuri & Scapigliati, Reference Sammuri and Scapigliati2022). The raw material extracted at Piloni di Torniella can be classified as a raw kaolin (RK), which is defined as a deeply kaolinized parent rock that contains a significant amount of non-plastic components (rock fragments, quartz, feldspars, micas, etc.; Dondi et al., Reference Dondi, Raimondo and Zanelli2014). The deposit is located in the north-western part of the Pleistocene Roccastrada rhyolites, part of the Tuscan Magmatic Province. These volcanic rocks can be described as peraluminous rhyolitic lava flows, with a porphyritic texture; the main phenocrysts are quartz, K-feldspar, biotite and plagioclase, with minor amounts of cordierite (Pinarelli et al., Reference Pinarelli, Poli and Santo1989; Marianelli & Carletti, Reference Marianelli and Carletti1999; Poli & Perugini, Reference Poli and Perugini2003). A glassy or perlitic groundmass is recognizable in most cases, whereas sometimes the groundmass is microcrystalline (Pinarelli et al., Reference Pinarelli, Poli and Santo1989; Marianelli & Carletti, Reference Marianelli and Carletti1999; Poli & Perugini, Reference Poli and Perugini2003). The average chemical composition of the glassy matrix is 72.9–76.6 wt.% SiO2, 0.1–0.2 wt.% TiO2, 12.7–13.8 wt.% Al2O3, 0.1–1.2 wt.% FeOtot, 0.1–0.2 wt.% MnO, 0.1–0.2 wt.% MgO, 0.2–0.4 wt.% CaO, 1.9–3.4 wt.% Na2O and 4.8–6.9 wt.% K2O (Pinarelli et al., Reference Pinarelli, Poli and Santo1989; Marianelli & Carletti, Reference Marianelli and Carletti1999). These rhyolites have been considered to be of crustal anatectic origin, and radiometric dating established their age at 2.3–2.5 Ma (Borsi et al., Reference Borsi, Ferrara and Mazzuoli1965; Pinarelli & Villa, Reference Pinarelli and Villa1985; Innocenti et al., Reference Innocenti, Serri, Ferrara, Manetti and Tonarini1992).
In the Piloni di Torniella area, the primary rhyolites have undergone intense low-temperature hydrothermal alteration, which led to widespread kaolinization of the parent rock and to the development of an economically significant deposit (Bertolani & Loschi Ghittoni, Reference Bertolani and Loschi Ghittoni1989; Gorga, Reference Gorga1995; Viti et al., Reference Viti, Lupieri and Reginelli2007). Kaolinite is a typical product of hydrothermal weathering, in particular in the intermediate and advanced argillic alteration facies, at temperatures of <200°C and relatively acidic pH levels (Fulignati, Reference Fulignati2020; Hedenquist & Arribas, Reference Hedenquist and Arribas2022; Apollaro et al., Reference Apollaro, Fuoco, Gennaro, Giuliani, Iezzi and Marini2023). In Piloni di Torniella, two distinct stages have been recognized in the weathering process (Viti et al. Reference Viti, Lupieri and Reginelli2007). In the first stage, spatially constrained, local weathering affected only plagioclase and biotite phenocrysts, without affecting the groundmass and the mineral phases. This stage did not cause major changes in the whole-rock major element chemical composition and led to the formation of kaolinite as the main alteration product.
The second stage was characterized by a greater fluid–rock ratio, which resulted in more diffuse weathering. This caused major changes in the whole-rock major element chemical composition and affected K-feldspars and the groundmass, along with plagioclase and biotite. The main secondary products of this stage are kaolinite and halloysite; other intermediate clay minerals, such as illite, vermiculite or smectite-group minerals, were not identified. In hydrothermal alteration deposits, halloysite occurrence is connected to the circulation of low-temperature (generally <100–110°C) steam-heated acid-sulfate fluids (Jansen et al., Reference Jansen, Gemmell, Chang, Cooke, Jourdan, Creaser and Hollings2017; Hedenquist & Arribas, Reference Hedenquist and Arribas2022). Moreover, halloysite is often interpreted as a fast-forming metastable precursor to kaolinite (Ece et al., Reference Ece, Schroeder, Smilley and Wampler2008; Ercan et al., Reference Ercan, Ece, Schroeder and Karacik2016). This could be the reason for halloysite development in the most altered portions of Piloni di Torniella mine (Viti et al., Reference Viti, Lupieri and Reginelli2007). Gorga (Reference Gorga1995) observed considerable transformation of biotite into kaolinite, associated with the segregation of Fe-oxyhydroxides. Viti et al. (Reference Viti, Lupieri and Reginelli2007) have reported two distinct alteration products of biotite, both with a kaolin chemical composition, characterized by different grey tones in backscattered electron (BSE) images. These two products are characterized by different intensities in the oxygen energy-dispersive X-ray spectroscopy (EDS) peak, suggesting different water contents. However, proper identification of these two distinct phases is lacking, leaving some aspects of the textural relationship between weathering phases and the primary paragenesis partially unresolved.
In the second phase of weathering, alunite (KAl3(SO4)2(OH)6) has also been produced via alteration of feldspars (Gorga, Reference Gorga1995; Viti et al., Reference Viti, Lupieri and Reginelli2007). Alunite belongs to the aluminium–phosphate–sulfate (APS) group, which includes alsosvanbergite (SrAl3(PO4/SO4)(OH)6), jarosite (KFe3(SO4)2(OH)6) and woodhouseite (CaAl3(PO4/SO4)(OH)6) (Dill, Reference Dill2001). APS minerals are typical minor and accessory phases in hydrothermal deposits (Dill, Reference Dill2003; Marchesini et al., Reference Marchesini, Tavani, Mercuri, Mondillo, Pizzati and Balsamo2024; Naderi et al., Reference Naderi, Modabberi, Tarantola and Haroni2024). Alunite in particular is common in hydrothermal kaolin deposits, being a typical product of advanced argillic alteration, especially with relatively high concentrations of dissolved H+ and SO42– in the hydrothermal fluids (Hemley et al., Reference Hemley, Hostetler, Gude and Mountjoy1969; Hedenquist & Arribas, Reference Hedenquist and Arribas2022). Among other minor phases found in Piloni di Torniella, cristobalite has been reported only in a minority of samples from a previous study: it was interpreted as a relict phase from the primary paragenesis (Bertolani & Loschi Ghittoni, Reference Bertolani and Loschi Ghittoni1989).
The presence of these secondary phases is potentially problematic for the ceramic tile industry. For instance, alunite is related to an increase in the slip viscosity and to the occurrence of efflorescence after drying, and it may cause an increase in SOx emissions during firing, which are responsible for high porosity in final products, in addition to being harmful to human health (Dondi et al., Reference Dondi, Guarini, Ligas, Palomba and Raimondo2001; González et al., Reference González, Campos, Barba-Brioso, Romero, Galán and Mayoral2016; Ediz et al., Reference Ediz, Tatar and Aydln2017). High amounts of halloysite, although contributing to improved plasticity in ceramic batches, cause rheological problems to the slips, increasing their viscosity and resistance to shear due to halloysite’s common tubular habit and its relatively high specific surface area (Dondi et al., Reference Dondi, Iglesias, Dominguez, Guarini and Raimondo2008). The higher specific surface area compared to kaolinite is also responsible for high drying shrinkage in ceramic bodies, which can potentially lead to the development of microcracks in tiles during this phase of manufacturing (Moussi et al., Reference Moussi, Medhioub, Hatira, Yans, Hajjaji and Rocha2011; Lampropoulou & Papoulis, Reference Lampropoulou and Papoulis2021). In addition, the presence of cristobalite may be problematic during the firing of ceramic tiles, as the α–β displacive inversion at ∼220°C brings about a significantly greater volume change (∼5%) with respect to the quartz α– β transition (Peacor, Reference Peacor1973; Johnson et al., Reference Johnson, Song, Cook, Vel and Gerbi2021). This volume change produces large internal stresses within ceramic bodies upon cooling, leading to microcrack formation and ultimately negatively influencing the mechanical strength of the final products (Aras & Kristaly, Reference Aras and Kristaly2019; Christogerou et al., Reference Christogerou, Lampropoulou, Papoulis and Angelopoulos2021).
In this study, to better understand the alteration mechanisms in Piloni di Torniella, a multi-technique methodology was applied to characterize the weathering paragenesis and its textural relations with the primary rhyolites. In several previous studies, a multi-technique approach, including both spectroscopic techniques and scanning electron microscopy (SEM)-EDS, has been applied to characterize clay deposits, with a special focus on applications in the ceramics sector (Aghayev & Küçükuysal, Reference Aghayev and Küçükuysal2018; Nzeukou Nzeugang et al., Reference Nzeukou Nzeugang, El Ouahabi, Aziwo, Mache, Mefire Mounton and Fagel2018; Baghdad et al., Reference Baghdad, Bouazi, Bouftouha, Hatert and Fagel2019; Kaçar & Yanık, Reference Kaçar and Yanık2025). In most cases, Fourier-transform infrared (FTIR) spectroscopy on bulk samples is performed (Kaufhold et al., Reference Kaufhold, Chryssikos, Kacandes, Gionis, Ufer and Dohrmann2019; Chalouati et al., Reference Chalouati, Bennour, Mannai and Srasra2020; Salgado-Campos et al., Reference Salgado-Campos, Bertolino, da Silva, Mendes and Neumann2021), whereas Raman spectroscopy is rarely applied to characterize argillic alteration in hydrothermal deposits (Papoulis & Tsolis-Katagas, Reference Papoulis and Tsolis-Katagas2008; Palinkaš et al., Reference Palinkaš, Šoštarić, Bermanec, Palinkaš, Prochaska, Furić and Smajlović2009). In this study, the proposed analytical approach aims to integrate bulk techniques (e.g. X-ray powder diffraction (XRPD)) with micro-texture characterization via optical techniques associated with spot analyses (SEM-EDS and micro-Raman spectroscopy). The methodological approach also includes both micro-Raman mapping and EDS elemental imaging. The combination of these imaging techniques has recently gained importance in various branches of earth and material sciences (Maragh et al., Reference Maragh, Weaver and Masic2019; Musa et al., Reference Musa, Rossini, Di Martino, Riccardi, Clemenza and Gorini2021; Polavaram & Garg, Reference Polavaram and Garg2021, Fitzek et al., Reference Fitzek, Zankel, Dienstleder, Rattenberger, Schröttner and Hofer2022). Optical microscopy and XRPD serve as a basis for identifying various alteration stages and for defining the mineral phases involved in the weathering process. Furthermore, the combination with microanalytical techniques enables a better understanding of the textural relationships of the phases from the primary and secondary parageneses, with a specific focus on biotite weathering.
To focus on the relevance of such results for the ceramic applications of the raw materials, not only the geological samples but also the extracted material have been analysed. In fact, a better understanding of the alteration mechanisms that lead to the formation of undesired secondary phases would be of great importance for the mining license holder to guarantee a proper and constant quality to the raw materials supplied.
Materials
Piloni di Torniella deposit is conventionally divided by the mining license holder into different excavation sites. Ten samples, collected during various sampling campaigns, were considered in this study and were numbered from 1 to 10 (Table 1). The samples were cut to 30 μm-thick polished thin sections for optical petrographic observation. Moreover, Sample 10, which was considered representative of the highest level of weathering in the study site, was examined using XRPD by grinding in an agate mortar, while for SEM/EDS and micro-Raman spectroscopy an aliquot of Sample 10 was embedded in epoxy resin, and this was fine-polished with diamond paste on cloth abrasives (smallest abrasive size used equal to 1 µm). For SEM/EDS analysis only, the sample was carbon-coated.
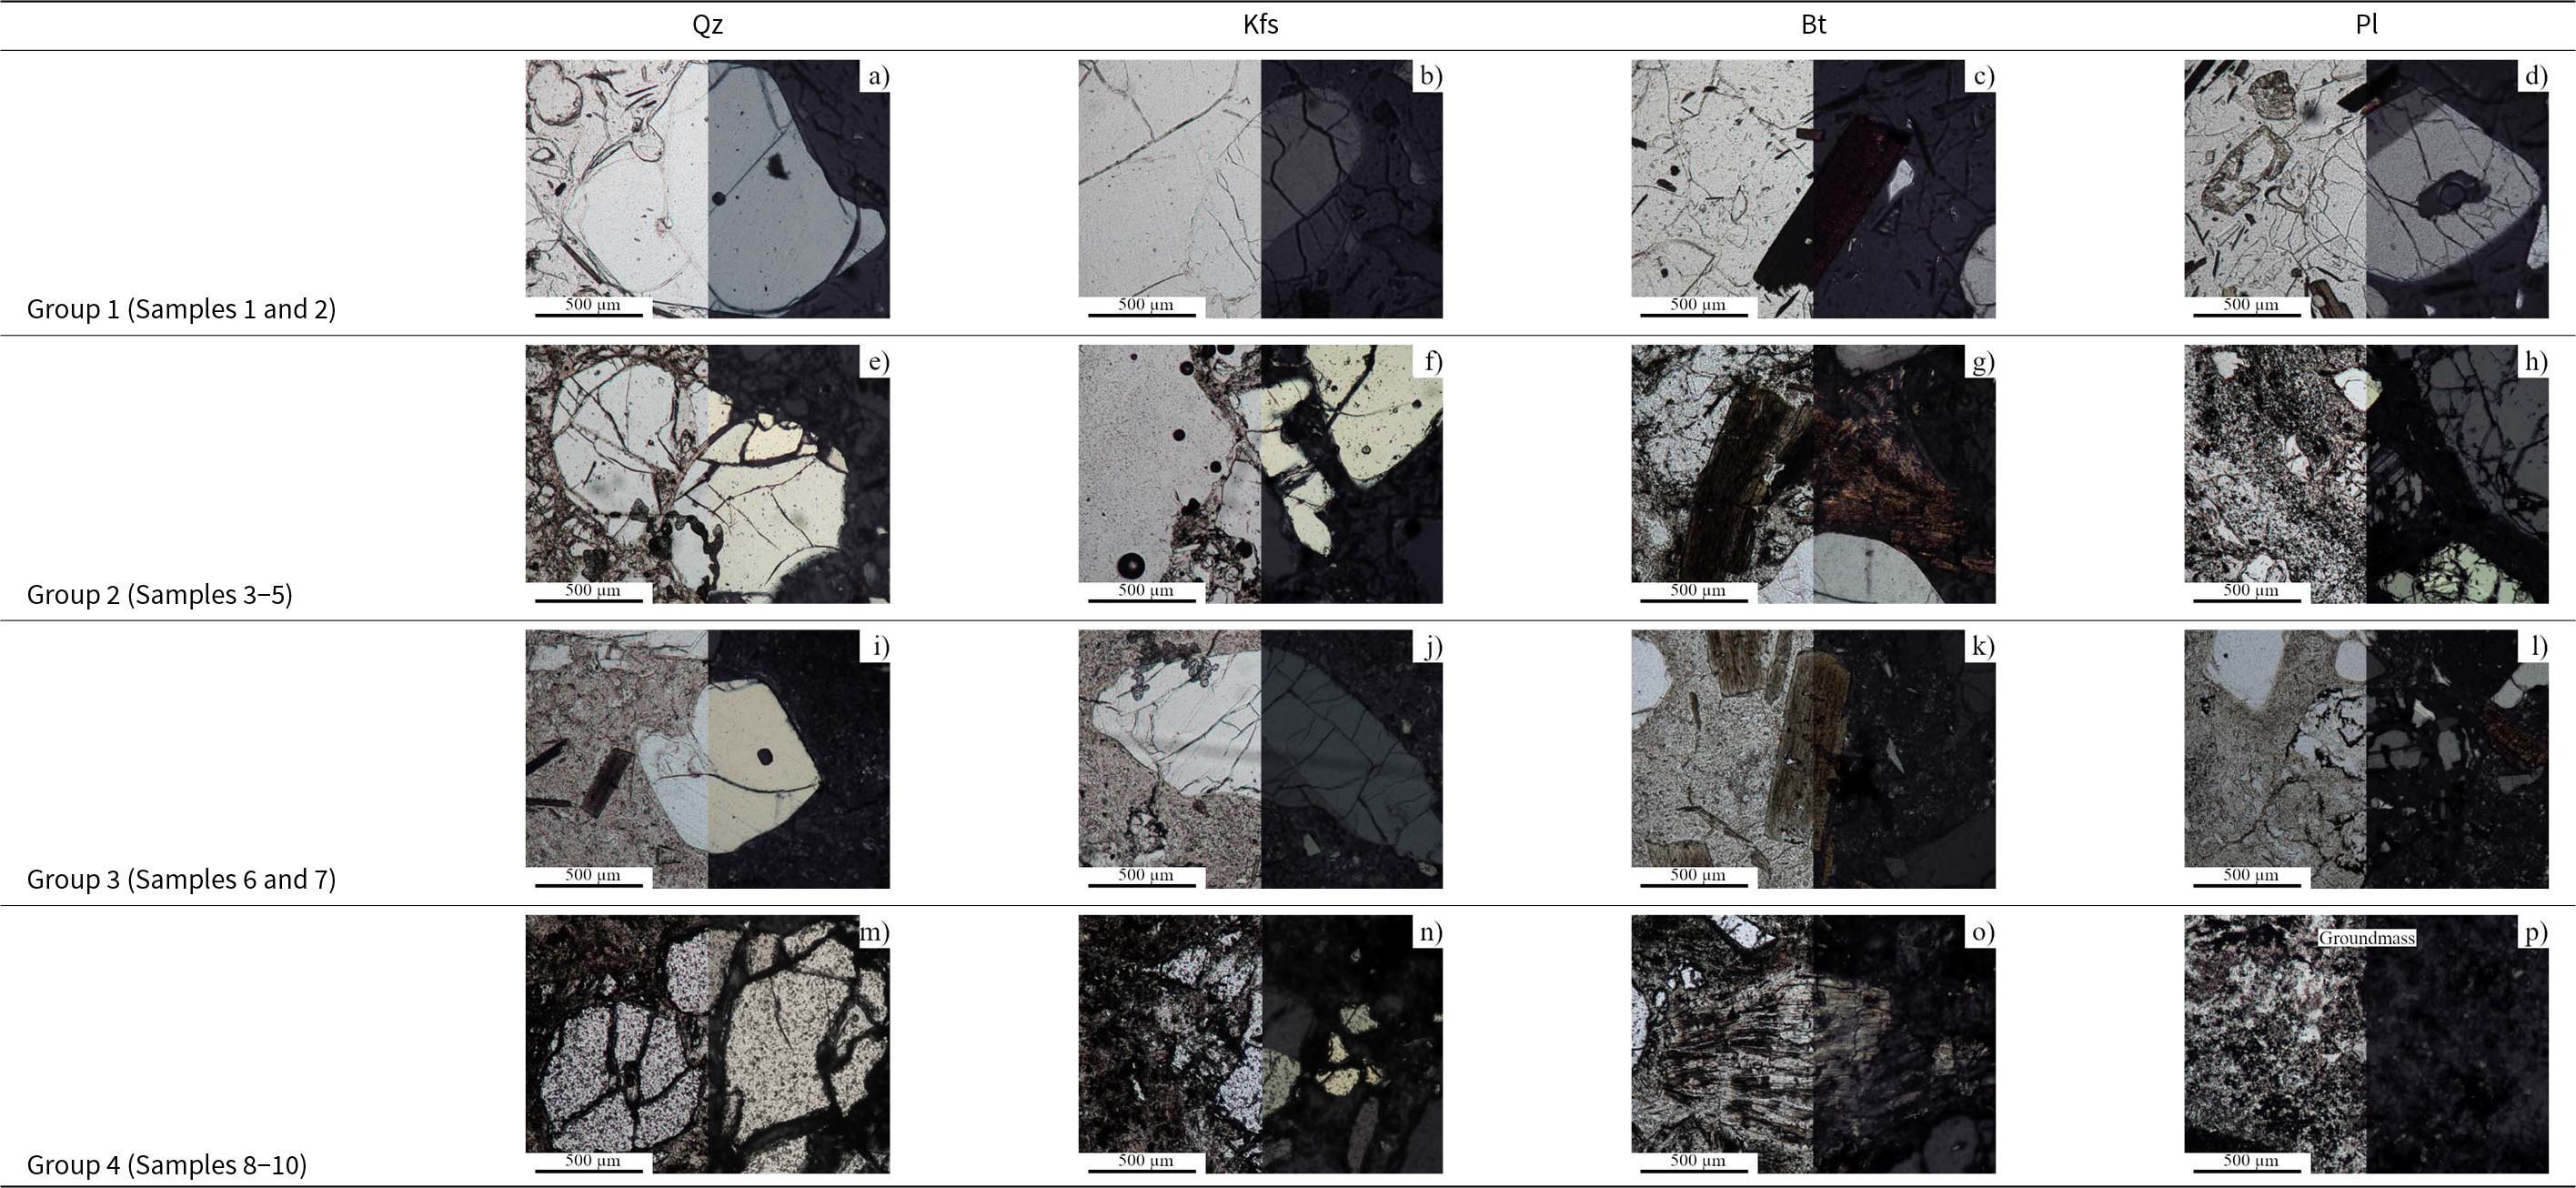
Micro-textures representing different stages in the weathering process of the 10 samples considered in this study. The identification of the four groups (rows) was performed considering the alteration features of the main phenocrysts (columns) of the primary rhyolites (quartz (Qz), K-feldspar (Kfs), biotite (Bt) and plagioclase (Pl)) plus the groundmass. The optical microscopy images are provided in plane-polarized light (on the left) and cross-polarized light (on the right). For discussion of the groups, see the ‘Optical microscopy’ subsection in the ‘Results’ section.

Table 1 Long description
The table organizes 10 rhyolite samples into four weathering groups and provides column headings for the main phenocrysts assessed: quartz, K-feldspar, biotite, and plagioclase. Group 1 includes Samples 1 and 2. Group 2 includes Samples 3 through 5. Group 3 includes Samples 6 and 7. Group 4 includes Samples 8 through 10. All cells under the mineral columns are blank, so no mineral-specific micro-texture observations or comparisons are provided in the table itself. As presented, the table communicates only the grouping structure and sample membership, not the alteration features used to define the groups.
Experimental
Optical microscopy
A Nikon Eclipse E400 Pol polarized-light microscope was used for thin-section studies. The microscope was coupled with a Nikon DS-Fi3 camera, which enabled the acquisition of coloured images using the PC software NIS-Elements vers.5.42. The acquired images had a 1440 × 1024 pixel resolution.
X-ray powder diffraction
XRPD traces were collected with a Malvern Panalytical X’Pert3 Powder diffractometer with Bragg–Brentano geometry, using Ni-filtered Cu-Kα radiation. Data were collected in the range 2–65°2θ with a step size of 0.0131303°2θ and a time per step of 0.417 s. For the qualitative evaluation of clay minerals, XRPD traces have been acquired both air-dried and after a thermal treatment at 400°C for 1 h. The XRPD traces were analysed using the X’Pert HighScore Plus 2.0.1 software. The traces were compared to Powder Diffraction File (PDF) entries from the International Centre for Diffraction Data (ICDD). Semi-quantitative phase composition was obtained by using HighScore Plus with the normalized reference intensity ratio (RIR) method.
Scanning electron microscopy with energy-dispersive spectrometry
A Tescan field-emission (FE)-SEM (Mira 3XMU-series), equipped with an EDAX spectrometer (Apollo XL silicon drift detector (SDD)-EDS), was used during analysis. The operating conditions were: 20 kV accelerating voltage, 12 mA beam current, working distance 15.5–16.0 mm, 50 s of count collection per analysis and dead time of ∼25%. EDS spot areas varied with respect to the dimensions of the analysed phases, and the microanalyses were processed through the EDAX Genesis software and corrected on the basis of atomic number, absorption and fluorescence excitation (ZAF correction). EDS elemental mapping was also performed.
Micro-Raman spectroscopy
A XploRA Plus HORIBA Scientific set-up was used for the micro-Raman experiments. Two different wavelengths were used as excitation (532 and 638 nm) from solid-state lasers. The scattered light was analysed with a 1800 lines mm–1 grating, with a spectral resolution of ∼1.5 cm–1, and it was measured using a charge-coupled device (CCD) detector cooled at –65°C. The instrument was coupled with an Olympus BX43 microscope with 10×, 50× (both short and long working distances) and 100× objectives. Analyses were performed both in the spectral range of the fundamental vibrations of silicates (1200–100 cm–1) and in the hydroxyl stretching region (3750–3550 cm–1). For most analyses, the 638 nm laser was used, with the 1800 lines mm–1 grating centred at 670 cm–1 for the low-Raman-shift region and at 3700 cm–1 for the OH region. Laser power was kept in the 10–25 mW range, and the laser beam was focused by the 100× objective, leading to a spot diameter on the samples of ∼0.5 µm2. Micro-Raman mapping was also performed by focusing the laser beam with the 100× objective. Data were acquired using the LabSpec software, while curve fitting of the Raman spectra was performed using the WiRE5.2 software.
Results
Optical microscopy
Based on petrographic observations at thin-section scale, the samples considered in this study were classified into four different groups, representative of different alteration patterns. In Table 1, each row represents one of these alteration groups, whereas each column relates to one of the main phenocrysts of Roccastrada rhyolites (quartz, K-feldspar, biotite and plagioclase). Hence, in every cell of Table 1, an image of one of these phases in a specific alteration group is portrayed.
Group 1 (Samples 1 and 2; Table 1a–d) represents almost unaltered rhyolite, showing a preserved porphyritic texture and preserved phenocrysts. The pristine glassy groundmass represents ∼55–60% in volume of the rock. Quartz phenocrysts (Table 1a) are euhedral to subhedral and embayed, with a network of rounded fractures and dimensions from 500 µm to ∼3–4 mm. Quartz is the most abundant phenocryst of Group 1. K-feldspar (Table 1b) is euhedral to subhedral, from 400 µm to ∼3–4 mm in size, with typical Carlsbad twinning and prismatic habit. Biotite (Table 1c) is unaltered and euhedral to subhedral, showing lamellar–micaceous habit, ranging from 200 µm to ∼2 mm in size. Biotite crystals can be very elongated, and sometimes they are orientated along flow structures of the groundmass, or they occur as inclusions in quartz. Plagioclase (Table 1d) is the least abundant among the main phenocrysts, at 400 µm to ∼1 mm in size. It is euhedral to subhedral, with polysynthetic twinning, and it sometimes preserves oscillatory zoning. Plagioclase is partially altered in places, starting from the grain boundaries and moving towards the cores. Accessory phases are cordierite, zircon, monazite, apatite and minor oxides.
Group 2 (Samples 3–5; Table 1e–h) is characterized by the simultaneous presence of altered and pristine domains at the thin-section scale. Thus, domains with substantially preserved rhyolite can be distinguished from weathered domains. In the preserved domains, the glassy groundmass shows a perlitic texture, which was not evident in the samples from Group 1, and fractures are more abundant. In altered domains, however, the groundmass is completely weathered to fine-grained phases with low birefringence. Quartz and K-feldspar phenocrysts are generally well-preserved in Sample 5, whereas in Samples 3 and 4 (Table 1e,f) they show various alteration levels in different domains. K-feldspars from Sample 4 show the most extensive alteration of this group. The alteration of biotite is evidenced in some cases by darker colours and high birefringence, being shown only by some portions of the crystals in Samples 3 and 4, and in others by the alteration along cleavage planes, which determines the loss of its habit (Sample 5; Table 1g). Plagioclase is well-preserved only in unaltered domains from Sample 4; in the remaining samples, and in the most altered domains of Sample 4, plagioclase relics are identified at grain cores, and evident signs of alteration begin at grain boundaries (Table 1h).
Group 3 (Samples 6 and 7; Table 1i–l) is characterized by extensive alteration of the groundmass (and not by different altered domains as per Group 2). The phenocrysts preserve their habit and some of their optical proprieties. The groundmass is strongly altered to fine-grained phases, with low birefringence (Table 1i–l). However, in Sample 6, single small relics of the original groundmass, at ∼100 µm in size, are still preserved within a fine-grained weathering matrix. The observed textural relationships between these relic portions of the groundmass and the alteration phases suggest that weathering began from fractures in the glass. Quartz and K-feldspar are generally well-preserved (Table 1i,j). In some crystals from Sample 7, fine-grained alteration phases developed within K-feldspar fractures. Biotite in Sample 7 is well-preserved (Table 1k), and it shows only slight colour zoning, with the rim of the crystals being lighter than the core, almost preserving its optical proprieties. However, in Sample 6, biotite is very dark, with slight pleochroism, and it shows evident signs of weathering along cleavage planes and at grain boundaries. Only small portions of plagioclase relics can be identified, with crystals mostly being weathered (Table 1l).
Finally, Group 4 (Samples 8 and 9; Table 1m–p) shows the most extensive alteration of the examined samples. The groundmass is completely altered to fine-grained phases (Table 1p). Quartz and K-feldspar show evident signs of weathering. Quartz is heavily fractured, mottled and shows corroded margins (Table 1m). Fine-grained phases have developed around relict phenocrysts and within fractures, causing different portions of the same crystal to separate. Relics of K-feldspar (Table 1n) are strongly weathered. Biotite is completely altered, and it can either preserve its habit (Sample 9) or it can lose it completely (Sample 8; Table 1o). In both cases, biotite’s optical properties are completely lost. Plagioclase is absent from these samples.
Based on these observations, Group 4 represents the highest degree of alteration, corresponding to the most valued material from an economic perspective. Therefore, one sample belonging to this group – Sample 10 – has been selected for further, more detailed analyses to identify and characterize the alteration micro-textures and mineral phases.
X-ray powder diffraction
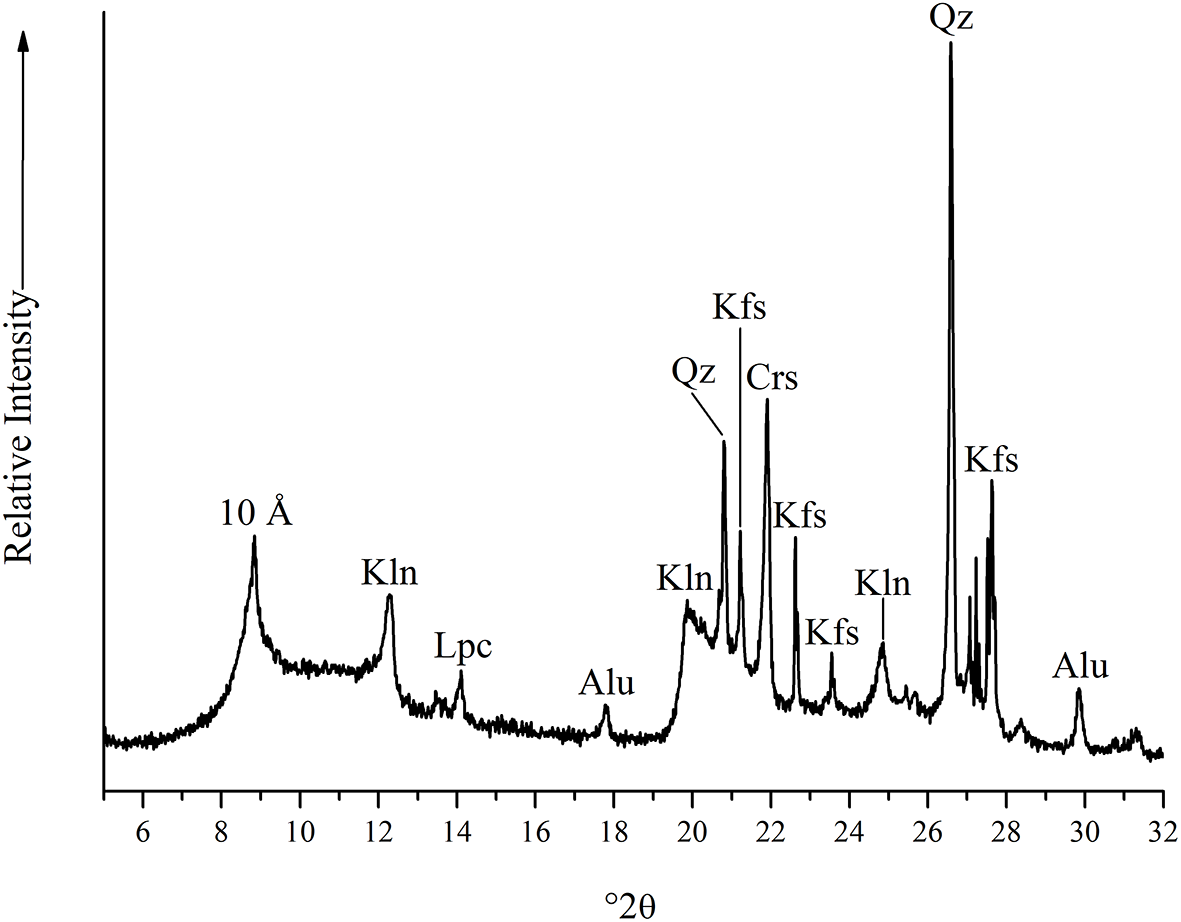
The XRPD trace of Sample 10 is shown in Fig. 1. The sample consists of quartz (peaks at 26.65°2θ, 3.34 Å and 20.86°2θ, 4.25 Å), K-feldspar (peaks at 27.66°2θ, 3.22 Å; 27.16°2θ, 3.28 Å; 26.98°2θ, 3.30 Å; 23.57°2θ, 3.77 Å; 22.62°2θ, 3.93 Å; and 21.22°2θ, 4.19 Å) and kaolinite (peaks at 12.36°2θ, 7.16 Å and 24.86°2θ, 3.58 Å), together with alunite (peaks at 29.81°2θ, 2.99 Å and 17.85°2θ, 4.97 Å). Lepidocrocite (Fe3+O(OH), main peak at 14.13°2θ, 6.27 Å) and cristobalite (main peak at 21.92°2θ, 4.05 Å) were also detected.
XRPD trace of Sample 10 across a representative range. Alu = alunite; Crs = cristobalite; Kfs = K-feldspar; Kln = kaolinite; Lpc = lepidocrocite; Qz = quartz.

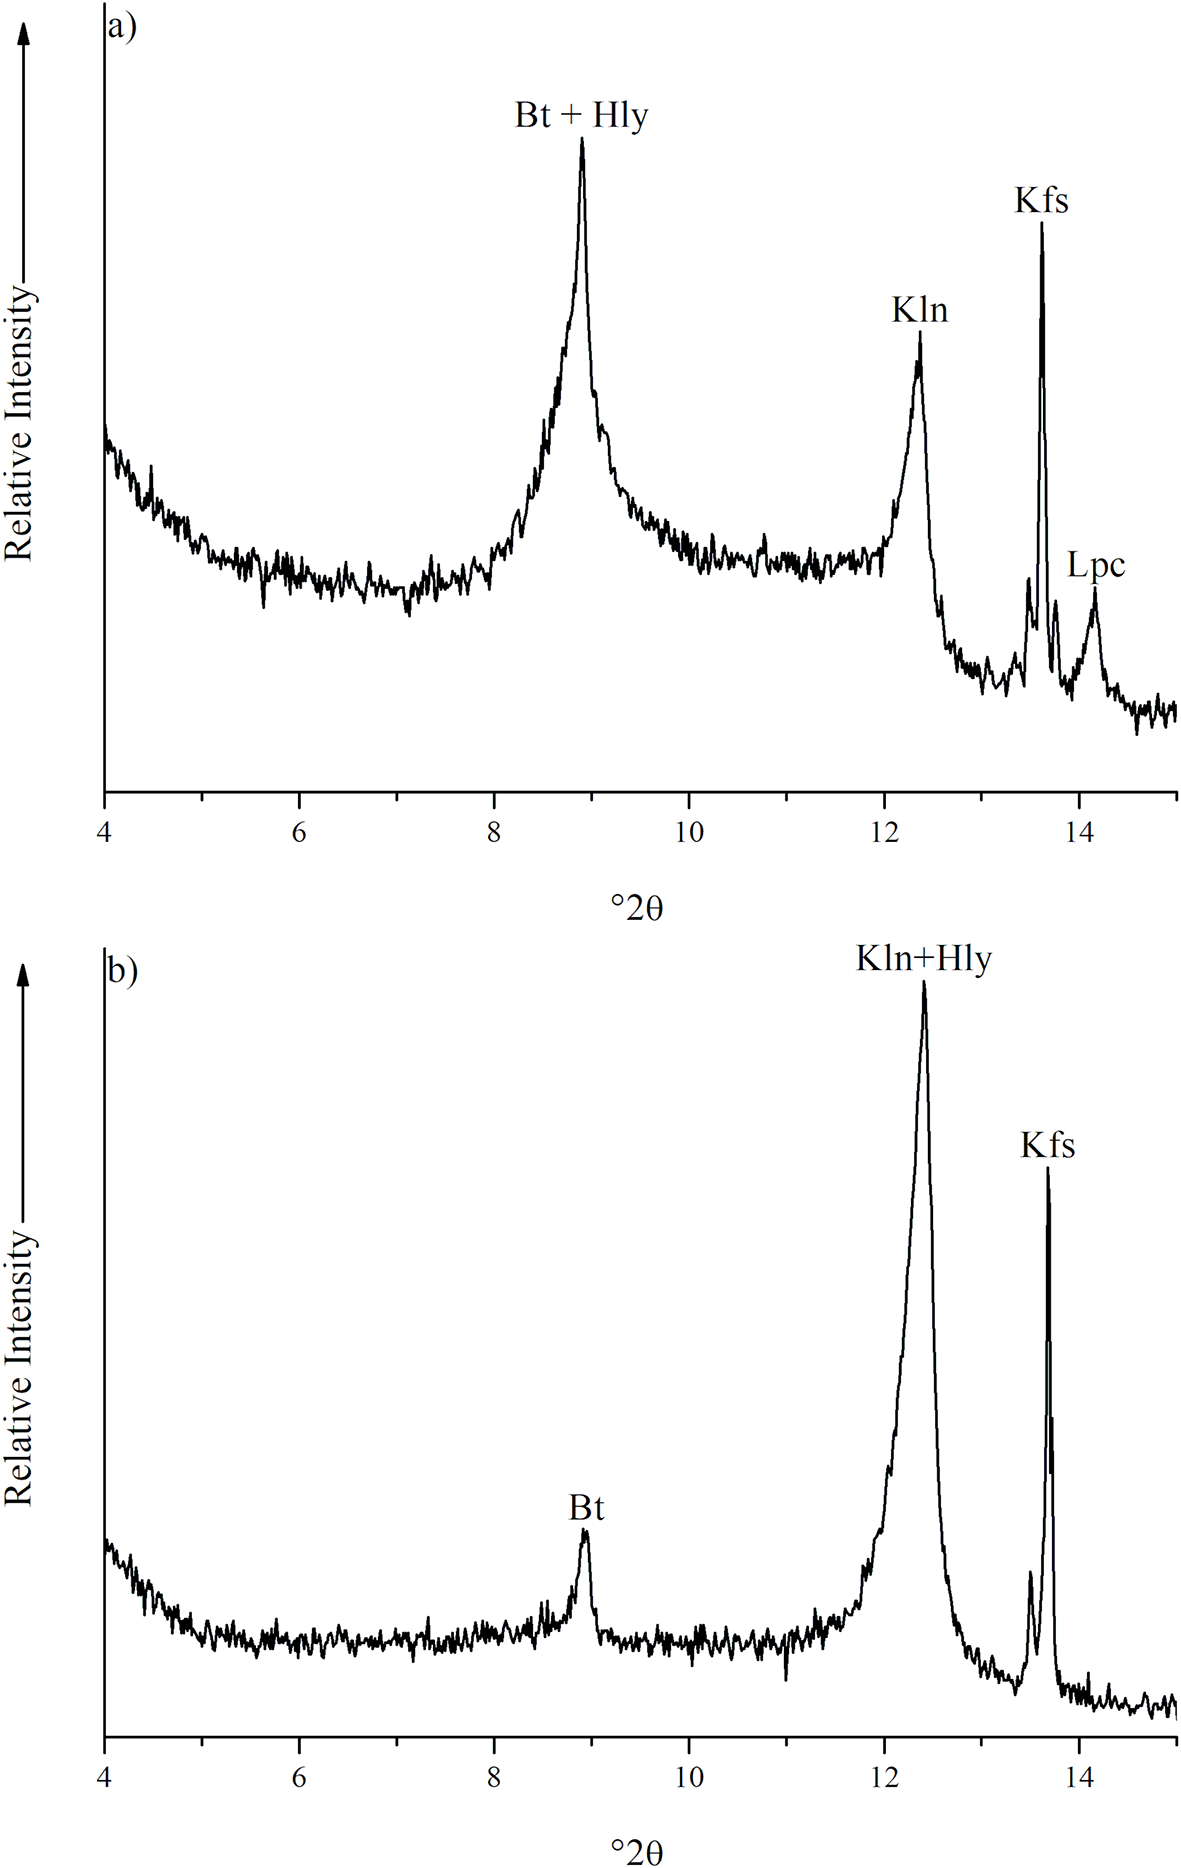
Finally, a peak at ∼8.80°2θ (⁓10Å) was observed. A detailed analysis was performed in the 2–20°2θ range to understand the nature of this ⁓10 Å peak. The XRPD traces of the original sample (Fig. 2a) and after thermal treatment at 400°C for 1 h (Fig. 2b) were obtained. After thermal treatment at 400°C, the intensity of the ⁓10 Å peak was significantly reduced, accompanied by a significant increase in the intensity of the 7.16 Å peak. This behaviour can be attributed to the presence of halloysite in the sample (Moore & Reynolds, Reference Moore and Reynolds1989; Środoń, Reference Środoń, Bergaya and Lagaly2013). Furthermore, the presence of lepidocrocite was confirmed by the disappearance of its 6.27 Å peak after thermal treatment; in fact, this phase transforms to maghemite (γ-Fe2O3) upon heating to temperatures between 200°C and 300°C (Gehring & Hofmeister, Reference Gehring and Hofmeister1994; Fang et al., Reference Fang, Kumbhar, Zhou and Stokes2003).
(a) Range of interest of the air-dried XRPD trace of Sample 10. (b) XRPD trace of the same sample after heat treatment at 400°C. Bt = biotite; Kfs = K-feldspar; Kln = kaolinite; Hly = halloysite; Lpc = lepidocrocite.

SEM-EDS and micro-Raman mapping
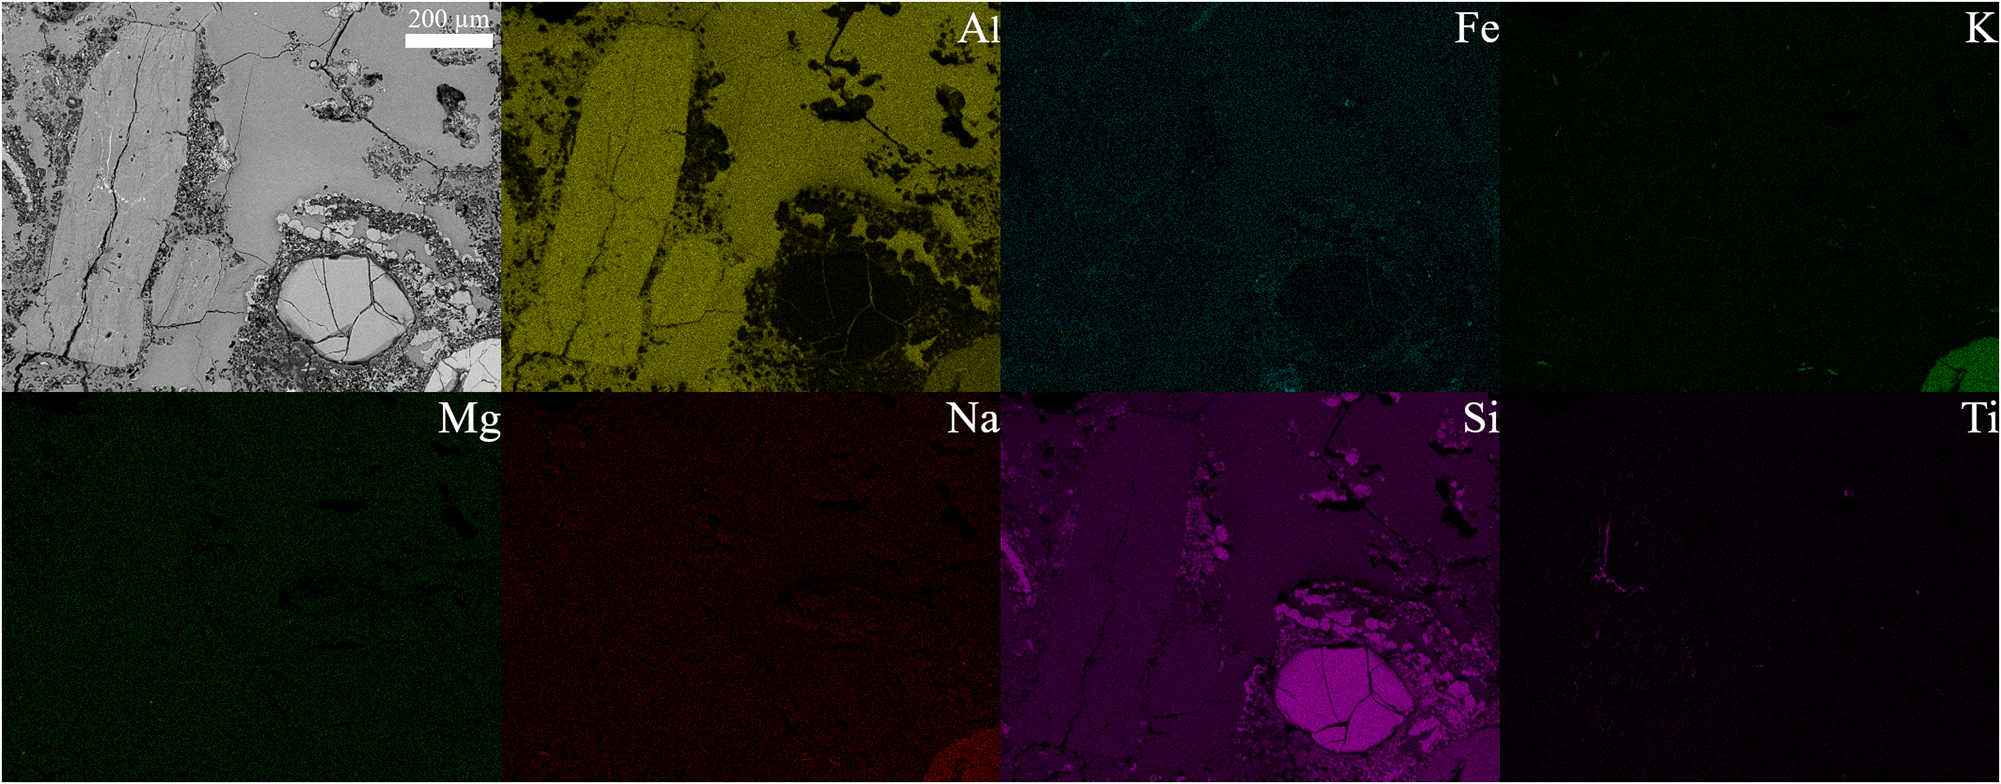
Figure 3 shows the SEM-EDS elemental mapping performed on Sample 10, in an area where the typical micro-textures previously described for Group 4 (Table 1m–p) are clearly visible. The lamellar–micaceous phenocryst shows only the presence of Si and Al, whereas the other elements typical of biotite (Fe, Mg and alkalis) are present in trace amounts, as in the groundmass. Si is also highly concentrated in both the rounded, fractured crystal (right part of Fig. 3) and in the smaller rounded grains around it. Single EDS spot analyses confirmed that the biotite pseudomorphs are composed only of Si and Al (Fig. S1), and the small, rounded grains are consistent with a silica-rich phase (Fig. S2). Only Ti is present in a specific area of the pseudomorph, corresponding to the brighter spots in the BSE image. Na and K are present only in the bottom-right crystal of feldspar (Fig. 3).
EDS elemental mapping showing the spatial distribution of Al, Fe, K, Mg, Na, Si and Ti in an area of Sample 10.

Raman mapping (point-to-point lines and grid squares) was performed for the biotite pseudomorphs (Fig. 3). The analyses were performed in areas corresponding to different greyscales in the BSE images and at the grain–groundmass boundaries to evaluate the phases’ relative distributions and possible alterations to crystallinity. The maps returned spectra of the pseudomorph, characterized in the fingerprint range (1200–100 cm–1) by a complex band system, in which no significative differences have been highlighted. In contrast, in the OH stretching range (3800–3500 cm–1) bands show shifting and asymmetric broadening, moving from one point to another of the pseudomorph (Fig. S3). However, no bands were registered in the groundmass surrounding the crystal, attesting to a high degree of amorphization of the fine texture. To achieve a better interpretation of the spectra, high-resolution, single-spot micro-Raman analyses were performed on spots that, in the preliminary mapping, had shown differences in their OH stretching region spectra.
Micro-Raman spectroscopy spot analyses
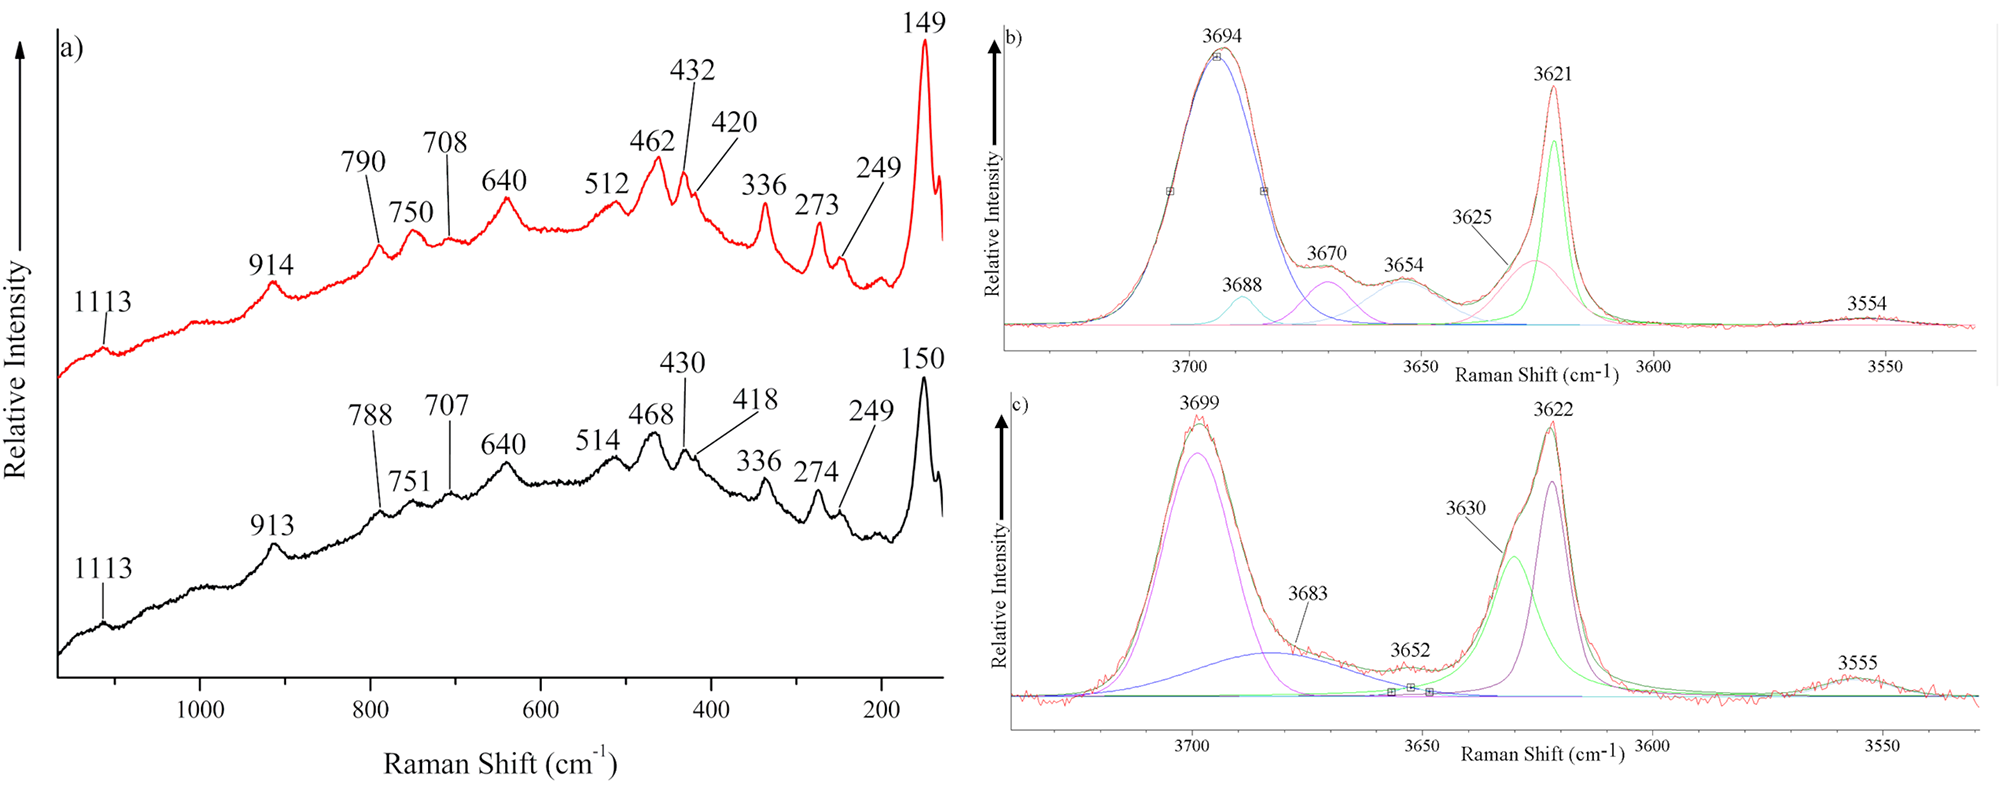
In biotite pseudomorphs, several spot analyses have been acquired in the areas characterized by two different grey tones in BSE images, where the previously acquired Raman maps returned differences in the OH bands (see the previous subsection). In the 1200–100 cm–1 spectral region (Fig. 4a), bands typical of kaolin-group minerals are observed at ∼150, 249, 274, 336, 420, 432, 465 (broad), 512, 707, 750, 790, 913 and 1113 cm–1 (Frost, Reference Frost1997; Kloprogge, Reference Kloprogge, Gates, Kloprogge, Madejová and Bergaya2017). Furthermore, in all of the acquired spectra, a band is present at ∼640 cm–1, which is typical of kaolinite and absent from its polymorphs (Frost, Reference Frost1995; Frost et al., Reference Frost, Tran and Kristof1997). In the hydroxyl stretching region (3750–3550 cm–1), spectrum deconvolution shows five bands at ∼3621, 3654, 3670, 3688 and 3694 cm–1 (Fig. 4b). These bands are typical of kaolinite (Frost, Reference Frost1995, Reference Frost1997). However, a band at ∼3625 cm–1 is also present as a shoulder of the band at 3621 cm–1. This shoulder is more evident in some areas of the pseudomorphs, where its intensity increases, and its position is located at ∼3630 cm–1 (Fig. 4c). This variation is generally accompanied by a shift of the 3694 cm–1 band towards higher Raman shifts (∼3699 cm–1) and by the disappearance of the bands at 3654, 3670 and 3688 cm–1. These variations in spectra are attributed to halloysite, characterized by bands at ∼3621–3622 cm–1, with a shoulder at ∼3630 cm–1, and at 3699 cm–1 (Frost, Reference Frost1997). However, in these areas of the pseudomorphs, halloysite is always associated with kaolinite, as is testified by the band at 640 cm–1 in the low-wavenumber spectral region (Fig. 4a, black spectrum). All of the spectra show the broad and weak band at ∼3555 cm–1, which represents an OH stretching mode in water absorbed on the clay surface in halloysite, without strong bonding to the clay (Kloprogge & Frost, Reference Kloprogge and Frost1999; Kloprogge, Reference Kloprogge and Kloprogge2019). Thus, micro-Raman spectroscopy confirms the coexistence of halloysite, detected by XRPD, with kaolinite along biotite pseudomorphs cleavage planes, corresponding to the darker grey areas in the BSE image in Fig. 3a.
(a) Raman spectra in the 1167–127 cm–1 region of kaolinite (in red) and halloysite (in black). Raman spectra of (b) kaolinite and (c) halloysite in the OH stretching region, also showing the bands resulting from the deconvolution operation.

Figure 4 Long description
Panel A shows Raman spectra of kaolinite (red) and halloysite (black) in the fingerprint region. The x-axis is Raman Shift (cm superscript -1) and the y-axis is Relative Intensity (arbitrary units). Key peaks for kaolinite include 1113, 914, 790, 750, 708, 640, 512, 462, 432, 420, 336, 273, 249 and 149. Halloysite shows peaks at 1113, 913, 788, 751, 707, 640, 514, 468, 430, 418, 336, 274, 249 and 150. Panel B displays kaolinite in the OH stretching region, with peaks at 3694, 3688, 3670, 3654, 3625, 3621 and 3554. Panel C shows halloysite in the OH stretching region, with peaks at 3699, 3783, 3652, 3630, 3622 and 3555. The spectra highlight differences in peak positions and intensities, indicating variations in mineral composition.
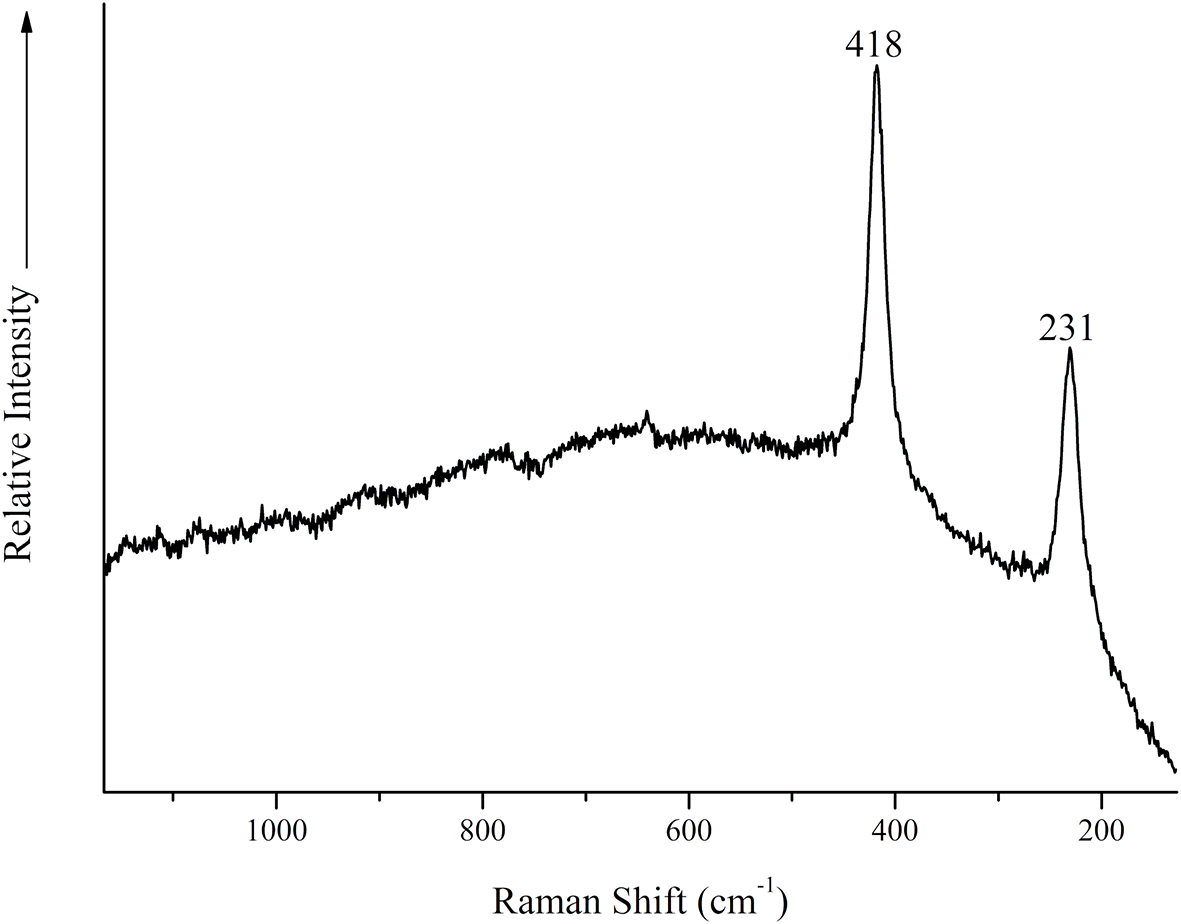
Micro-Raman analyses were also performed on the siliceous grains observed using SEM-EDS (Fig. 3). An example of the obtained spectra is shown in Fig. 5, where two bands at 231 and 418 cm–1 are evident. These two bands are typical of α-cristobalite (Bates, Reference Bates1972; Swainson et al., Reference Swainson, Dove and Palmer2003), which is consistent with the siliceous chemical composition of these phases and the XRPD results.
Raman spectrum of α-cristobalite in the 1167–127 cm–1 spectral region.

Semi-quantitative mineralogical analyses
Table 2 lists the semi-quantitative mineralogical composition for Sample 10. Quartz and K-feldspar are still the most abundant crystalline phases at this final step of the weathering process, but the abundance of kaolin-group minerals is ∼30 wt.%. In particular, the halloysite content is 12 wt.%; the remaining secondary phases of interest in this study – alunite and cristobalite – show concentrations of 5 and 6 wt.%, respectively.
Semi-quantitative phase composition (wt.%) of Sample 10.

Table 2 Long description
The table reports semi-quantitative mineral phase composition by weight percent for Sample 10. Quartz is the largest component at 38 wt%. K-feldspar is next at 21 wt%, followed by kaolinite at 17 wt% and halloysite at 12 wt%. Minor phases include cristobalite at 6 wt% and alunite at 5 wt%. Lepidocrocite is the smallest listed phase at 2 wt%. Overall, the sample is quartz-rich with moderate feldspar and clay minerals, while the remaining phases occur only in small amounts. Values are semi-quantitative, so small differences between phases should be interpreted cautiously.
Alu = alunite; Crs = cristobalite; Kfs = K-feldspar; Kln = kaolinite; Hly = halloysite; Lpc = lepidocrocite; Qz = quartz.
Discussion
Petrographic analyses by optical microscopy have enabled four different alteration patterns in the study area to be distinguished and constrained the weathering sequence of mineral phases from the primary paragenesis. Plagioclase is the first to undergo weathering, as had already been reported by Viti et al. (Reference Viti, Lupieri and Reginelli2007); this phase shows evident signs of alteration already in the almost unaltered rhyolite of Group 1. Quartz and K-feldspar are, by contrast, the phases less affected by weathering; indeed, these phases are preserved in Groups 1 and 3, whereas in Group 2 they show limited alteration. Even in Group 4, where quartz and K-feldspar show more evident weathering micro-textures, these phases are still present in the rhyolite. Biotite shows evidence of partial weathering in the altered domains of samples from Group 2, whereas it is mostly well-preserved in Group 3. The fact that biotite is present in this group, with little or no sign of incipient alteration, whereas the groundmass is completely weathered, marks a difference from the results of the study by Viti et al. (Reference Viti, Lupieri and Reginelli2007). In that study, weathering was reported to develop in two main stages: a first, local stage, affecting only biotite and plagioclase; and a second stage, more diffuse in the rock, also involving the groundmass and K-feldspar. However, in Group 3, biotite is almost unaltered within a completely weathered groundmass, and it can also be completely preserved in rocks from the other groups, where the groundmass is preserved. This difference is probably due to a more complex weathering mechanism existing than the two-stage process suggested by Viti et al. (Reference Viti, Lupieri and Reginelli2007), one that is possibly differentiated in different areas of the mine.
The presence of kaolinite, as the main secondary phase, has been confirmed by both XRPD and micro-Raman spectroscopy. The analytical approach applied here has allowed for the identification of other secondary phases that may create problems for ceramic manufacturing. First, alunite was identified by XRPD, which is in agreement with previous work (Gorga, Reference Gorga1995; Viti et al., Reference Viti, Lupieri and Reginelli2007). Alunite was not able to be characterized using microanalytical techniques, probably due to the small dimensions of the single crystals.
The presence of halloysite was confirmed by XRPD after thermal treatment at 400°C. However, in the XRPD trace, a small peak at ∼8.80°2θ (⁓10 Å) is still present, suggesting incomplete alteration of biotite. For a better interpretation of these findings, the sample was studied again using SEM-EDS, which confirmed the complete weathering of the biotite phenocrysts by aluminosilicate phases. Specifically, micro-Raman spectroscopy analysis performed on the same biotite phenocrysts analysed using SEM-EDS enabled two different kaolin minerals replacing biotite to be distinguished, namely kaolinite and halloysite. These two phases appear irregularly intergrown in the biotite pseudomorph. This evidence is in agreement with Viti et al. (Reference Viti, Lupieri and Reginelli2007), who suggested the presence of two distinct kaolin-group phases replacing biotite, identified here as kaolinite and halloysite due to the use of our multi-technique approach. Indeed, ours is the first study to adopt micro-Raman spectroscopy to explore micro-textural relationships between kaolin-group minerals and rock texture in a kaolin mine; specifically, the adopted methodology allowed for the identification of the spatial distribution of various kaolin-group minerals (namely kaolinite and halloysite) within biotite pseudomorphs. The coexistence of these two kaolin minerals as alteration phases of biotite has been reported in hydrothermal systems (Papoulis et al., Reference Papoulis, Tsolis-Katagas, Kalampounias and Tsikouras2009; Ercan et al., Reference Ercan, Ece, Schroeder and Karacik2016). In low-temperature hydrothermal systems, halloysite typically forms in the presence of percolating fluids with temperatures <100°C and low pH values as a fast-forming metastable precursor for kaolinite, related to its kinetics of nucleation and growth (Utada, Reference Utada1980; Ece et al., Reference Ece, Schroeder, Smilley and Wampler2008; Hedenquist & Arribas, Reference Hedenquist and Arribas2022). This implies that a fluid with a lower temperature than the one that led to kaolinization has circulated in some areas of the mine. This evidence should be considered to achieve better management of the mine; in fact, with the circulation of these lower-temperature fluids, the development of halloysite instead of kaolinite is favoured, thus leading to some problems for ceramic applications. The mineralogical composition of the material extracted should be monitored carefully: consistent knowledge regarding its mineralogy might enable the improvement of the blending procedures of the materials extracted from various excavation sites so as to obtain the most suitable blends for the ceramic tile industry.
The combination of SEM-EDS and micro-Raman spectroscopy facilitated the identification of α-cristobalite, as only the main peak of this phase was evident from XRPD. Cristobalite in Piloni di Torniella mine has been interpreted in the past as a residual phase from the primary paragenesis (Bertolani & Loschi Ghittoni, Reference Bertolani and Loschi Ghittoni1989); however, its presence in the primary Roccastrada rhyolites had not been reported in the literature (cf. Marianelli & Carletti, Reference Marianelli and Carletti1999; Poli & Perugini, Reference Poli and Perugini2003). By combining the SEM-EDS and micro-Raman spectroscopy analyses, cristobalite was identified as forming small grains surrounding larger quartz crystals and in the fractures of Group 4. Combining all of these considerations with the literature, cristobalite can also be assigned to the hydrothermal alteration paragenesis. Cristobalite is typically found as an accessory phase in hydrothermal kaolin deposits (Ece & Ercan, Reference Ece and Ercan2024), as it is typical of both advanced argillic alteration and silicification mineral assemblages (Hedenquist & Arribas, Reference Hedenquist and Arribas2022; Imura et al., Reference Imura, Ohba, Takahashi, Manalo, Sato and Ban2024).
Conclusions
The multi-technique analytical approach proposed for the study of Piloni di Torniella kaolin mine was effective for characterizing the secondary minerals of the study area. Specifically, micro-analytical techniques improved our understanding of the textural relationships between primary and alteration phases, overcoming the limits of bulk techniques. Importantly, four groups of weathering patterns were identified, providing insights into the alteration process of the rhyolite, which is more complex than had been previously suggested. The weathering was uneven across the rhyolite body, most probably affecting the different volumes of rock in space and time.
The identification of minerals at the microscale demonstrated the weathering of biotite to halloysite and kaolinite, leading to a better understanding of alteration mechanisms. The coexistence of halloysite and kaolinite on the same biotite pseudomorph, with halloysite at the rims of kaolinite, suggests the circulation of low-temperature (<100°C) hydrothermal fluids in some areas of the mine postdating the main kaolinization stage.
The analyses enabled the identification of other secondary phases that could be harmful for ceramic applications, such as cristobalite. Moreover, cristobalite texturally postdates the quartz phenocrysts.
Although these secondary phases are not abundant, they should be monitored during mining to achieve better management of the final properties of the raw materials for use in the ceramics industry. Expanding the number of samples in future research, using the same multi-technique approach adopted here, will enable more detailed examination of the various alteration patterns.
Supplementary material
The supplementary material for this article can be found at https://doi.org/10.1180/clm.2026.10044.
Acknowledgements
We are grateful to Eurit Srl and to Dr Massimiliano Reginelli for letting us collect samples from Piloni di Torniella mine. The reviewers of this contribution are also acknowledged for their comments that improved the quality of the manuscript significantly.
Financial support
This research is part of a PhD project partially funded by Next Generation EU. This research was also partially funded by the Italian Ministry of Enterprises and Made in Italy, Viability fOr circuLar manufacTuring (VOLT) project.
Competing interests
The authors declare none.



 Open access

