





Impact statement
Healthy soil and land underpin food security, climate resilience, biodiversity and livelihoods, yet decisions about land use, especially in rangelands, are often made with limited or inconsistent data. This research highlights the scale of the problem by reviewing existing rangeland monitoring frameworks, standards and remote sensing platforms, revealing significant gaps and a lack of harmonization in how land health is measured and reported. These inconsistencies limit the ability of governments, development partners and communities to effectively assess degradation, prioritize interventions and track progress toward restoration and sustainability goals. We demonstrate how the Land Degradation Surveillance Framework (LDSF) addresses these challenges by providing a practical, scalable approach to generating reliable and comparable data on soil and land health. By integrating field-based measurements with remote sensing and spatial analysis, the LDSF produces robust, spatially explicit information that can be applied across diverse ecosystems and contexts. Its standardized yet adaptable design ensures consistency in key indicators while remaining flexible through the use of modules for specific contexts. The broader impact of this work lies in strengthening evidence-based decision-making. The LDSF enables more targeted and efficient investments in landscape restoration, sustainable land management and climate adaptation by identifying where degradation is occurring and which interventions are most effective. This helps maximize the return on limited resources while supporting equitable outcomes. Importantly, improved monitoring in rangelands, often underrepresented in global datasets, can unlock better outcomes for pastoral communities and the ecosystems they depend on. By providing a stronger, more coherent evidence base, this research contributes to more informed policies, improved land management practices and, ultimately, more resilient landscapes and livelihoods at local, regional and global scales.
Introduction
Rangelands cover over 40% of the Earth’s terrestrial surface and support the livelihoods of over two billion people, including many of the world’s most vulnerable populations (Millennium Ecosystem Assessment [MEA] 2005; Lund, Reference Lund2007; Sayre et al., Reference Sayre, McAllister, Bestelmeyer, Moritz and Turner2013). They are diverse and provide a wide array of critical ecosystem services, including carbon storage, water regulation, biodiversity conservation and the production of food and fodder that sustains people, livestock and wildlife (Briske, Reference Briske2017; Bengtsson et al., Reference Bengtsson, Bullock, Egoh, Everson, Everson, O’Connor, O’Farrell, Smith and Lindborg2019). However, rangelands face mounting pressures from climate change, population growth, land conversion and unsustainable management (Bardgett et al., Reference Bardgett, Bullock, Lavorel, Manning, Schaffner, Ostle, Chomel, Durigan, Fry, Johnson, Lavallee, Provost, Luo, Png, Sankaran, Hou, Zhou, Ma, Ren, Li, Ding, Li and Shi2021; UNCCD, 2024), which has resulted in widespread land degradation. Despite their importance and the many challenges facing rangelands globally, they have historically been neglected in monitoring and assessment efforts and remain among the least documented and most poorly understood land systems (Jones et al., Reference Jones, Naugle, Twidwell, Uden, Maestas and Allred2020; Meli et al., Reference Meli, Schweizer, Winowiecki, Chomba, Aynekulu and Guariguata2023; Metcalfe et al., Reference Metcalfe, Anders, Axén, Petter Axelsson, Bermudez, Bartholomew, Butt, Cadillo-Quiroz, Chaudhary, Callebaut, Dahlsjö, Dusenge, Feeley, Wanger, Hwang, Hermans, Jonsson, Kardol, Lindh, Lussetti, Lamba, Mewett, Mujawamariya, Manzi, Salinas, Prevéy, Bargués-Tobella, Tang, Vought, Witteman, Wallin, Zhang, Yan and Virkkala2025).
Monitoring rangeland health presents inherent challenges due to spatiotemporal heterogeneity, ecological complexity and the dynamic nature of rangeland systems (Fuhlendorf et al., Reference Fuhlendorf, Finn, McGranahan, Twidwell and Briske2017; Briske, Reference Briske2017). Strong temporal variability in key resources (water availability and vegetation productivity) is primarily driven by stochastic rainfall patterns and subsequent disturbance regimes from grazing, fire and recurrent drought (Fynn, Reference Fynn2012; Fuhlendorf et al., Reference Fuhlendorf, Finn, McGranahan, Twidwell and Briske2017). Ecological processes do not operate under standard equilibrium principles, making it difficult to distinguish short-term fluctuations from longer-term directional trends in condition (Briske et al., Reference Briske, Coppock, Illius and Fuhlendorf2020; Vetter, Reference Vetter2005). Further, rangeland vegetation often forms mosaics of bare ground, herbaceous and woody components that vary across topography and soils and are mediated temporally through climate and management histories. This complexity, coupled with the vast and remote extent of many rangeland areas, has constrained the development of consistent and scalable rangeland monitoring approaches (Karl et al., Reference Karl, Herrick, Pyke and Briske2017). Furthermore, traditional rangeland assessments often rely on ad hoc sampling, expert observation or localized monitoring plots that lack statistical representativeness (Karl et al., Reference Karl, Herrick, Pyke and Briske2017).
This persistent “rangeland data gap” has profound implications. Without baseline data, it is difficult to quantify degradation, track ecological recovery or assess the impacts of restoration and management interventions. Moreover, policy frameworks such as the Land Degradation Neutrality (LDN) targets under the UN Convention to Combat Desertification (UNCCD) rely on national reporting systems that often lack reliable biophysical data for rangelands. This article aims to demonstrate how the Land Degradation Surveillance Framework (LDSF) can contribute to fill these data gaps and provide a systematic, consistent monitoring framework for key indicators of soil and land health.
Review of rangeland monitoring frameworks
We conducted a systematic review where we evaluated 12 rangeland monitoring frameworks with core field-based components, 14 livestock and fiber standards and five remote-sensing-based monitoring platforms. Frameworks such as the LDSF or AusPlots are scientific protocols for field data collection, while standards such as the Sustainable Fibre Alliance set performance or certification criteria. We evaluated each framework or standard based on their inclusion of indicators across seven key domains: (1) soil health, (2) vegetation metrics, (3) hydrology, (4) faunal diversity, (5) community engagement, (6) ease of implementation and (7) data management. These domains were developed specifically for the review, based on recurring themes in the literature, and were refined through several consultation workshops with rangeland practitioners and experts in East Africa. Each framework or standard was then assessed according to the extent to which it included indicators or substantive content within each domain.
We present the evaluation results from 12 field-based methodologies across the seven domains (Figure 1). There were large differences across frameworks, with some not including any hydrological or faunal indicators, while others focused more on ease of implementation and community engagement. Key themes from the review include the below:
-
• Fragmented architecture and inconsistent design. None of the evaluated frameworks, standards or platforms shared a common core indicator set, sampling design or implementation methodology. Many were developed for localized projects and were never harmonized with parallel efforts, leaving funders and practitioners to navigate a patchwork of partially overlapping requirements.
-
• Ecological blind spots. No framework captured all seven indicator domains (soil health, vegetation, hydrology, faunal diversity, community engagement, ease of implementation and data integration). Hydrological processes, fauna, and community engagement were the least represented.
-
• Operational limitations. Implementation guidance was often incomplete or aspirational. For example, several frameworks recommended measuring soil carbon stocks but did not specify sampling stratification, field protocols or laboratory QA/QC procedures, forcing practitioners to improvise methods, reducing comparability across sites, ecosystems, and over time.
Comparative coverage of major rangeland monitoring domains across reviewed frameworks. Cells show the number of subdomains represented within each major domain for each framework (0–3). Frameworks are ordered by total content coverage score, calculated as the unweighted sum across all seven domains (maximum = 21). This comparison reflects the comprehensiveness of framework content and does not evaluate implementation quality or field effectiveness. Figure adapted from the full review.
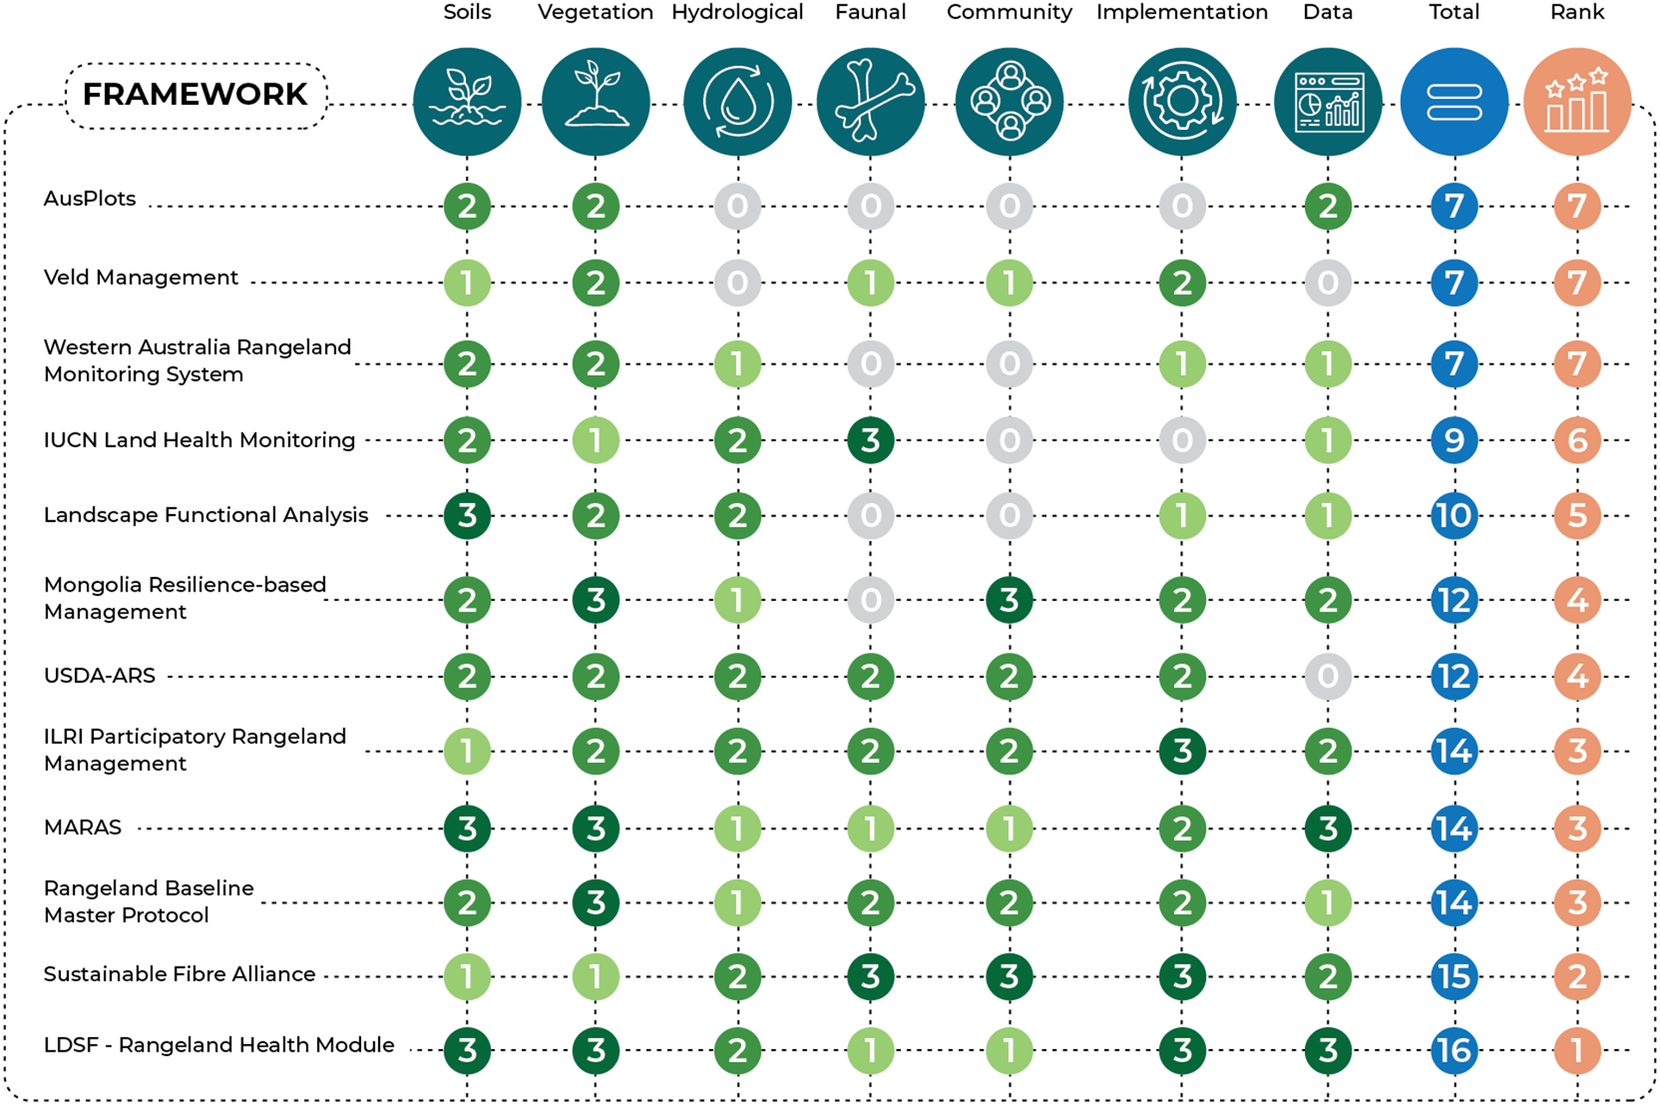
Figure 1. Long description
A matrix table with frameworks as rows and monitoring domains as columns. The columns from left to right are: Soils, Vegetation, Hydrological, Faunal, Community, Implementation, Data, Total, and Rank. Scores are represented by colored circles: dark green for 3, medium green for 2, light green for 1, and grey for 0.
* L D S F - Rangeland Health Module: Soils 3, Vegetation 3, Hydrological 2, Faunal 1, Community 1, Implementation 3, Data 3. Total 16, Rank 1.
* Sustainable Fibre Alliance: Soils 1, Vegetation 1, Hydrological 2, Faunal 3, Community 3, Implementation 3, Data 2. Total 15, Rank 2.
* Rangeland Baseline Master Protocol: Soils 2, Vegetation 3, Hydrological 1, Faunal 2, Community 2, Implementation 2, Data 1. Total 14, Rank 3.
* M A R A S: Soils 3, Vegetation 3, Hydrological 1, Faunal 1, Community 1, Implementation 2, Data 3. Total 14, Rank 3.
* I L R I Participatory Rangeland Management: Soils 1, Vegetation 2, Hydrological 2, Faunal 2, Community 2, Implementation 3, Data 2. Total 14, Rank 3.
* U S D A - A R S: Soils 2, Vegetation 2, Hydrological 2, Faunal 2, Community 2, Implementation 2, Data 0. Total 12, Rank 4.
* Mongolia Resilience-based Management: Soils 2, Vegetation 3, Hydrological 1, Faunal 0, Community 3, Implementation 2, Data 2. Total 12, Rank 4.
* Landscape Functional Analysis: Soils 3, Vegetation 2, Hydrological 2, Faunal 0, Community 0, Implementation 1, Data 1. Total 10, Rank 5.
* I U C N Land Health Monitoring: Soils 2, Vegetation 1, Hydrological 2, Faunal 3, Community 0, Implementation 0, Data 1. Total 9, Rank 6.
* Western Australia Rangeland Monitoring System: Soils 2, Vegetation 2, Hydrological 1, Faunal 0, Community 0, Implementation 1, Data 1. Total 7, Rank 7.
* Veld Management: Soils 1, Vegetation 2, Hydrological 0, Faunal 1, Community 1, Implementation 2, Data 0. Total 7, Rank 7.
* AusPlots: Soils 2, Vegetation 2, Hydrological 0, Faunal 0, Community 0, Implementation 0, Data 2. Total 7, Rank 7.
Together, these findings clearly highlight a lack of consistency across frameworks, in terms of indicator selection and measurement methodology. There is, therefore, an opportunity to develop a globally consistent monitoring framework that can be adapted to local contexts, needs and ecological realities to fill data gaps and strengthen the evidence base for targeting and tracking interventions over time. Frameworks that integrate robust field-based monitoring with remote sensing can generate standardized, spatially explicit information on soil health, vegetation dynamics, hydrologic function and land degradation. These outputs must be consistent, comparable across sites and through time, and scalable across large rangeland systems. This would enable effective adaptive management, guide investments and support policy frameworks such as Land Degradation Neutrality, Nationally Determined Contributions (NDCs), as well as contributing to international targets under the UN Decade on Ecosystem Restoration and the Sustainable Development Goals.
In this article, we propose the Land Degradation Surveillance Framework (LDSF) as a monitoring approach that can fulfill the need for consistent, scalable biophysical assessments. We also demonstrate how this framework has been implemented across the tropics and subtropics, advancing scientific understanding and supporting data-driven decision-making for food security, ecosystem restoration and climate domains.
Filling data gaps: The Land Degradation Surveillance Framework
The Land Degradation Surveillance Framework (LDSF) was designed to provide statistically sound, scalable, and reproducible data and evidence on ecosystem health across diverse landscapes (Vågen and Winowiecki, Reference Vågen and Winowiecki2025). It is a well-established, operational approach that combines a robust sampling design for field-based data collection, standardized laboratory protocols and integration with cutting-edge remote sensing workflows, enabling systematic assessments of soil and land health, land degradation and vegetation diversity.
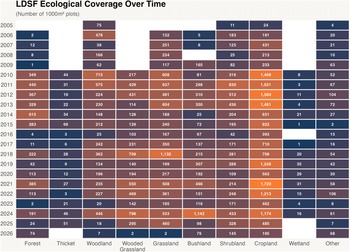
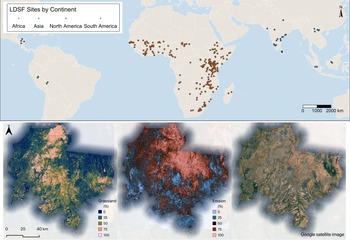
Developed initially by the World Agroforestry Centre (ICRAF, now CIFOR-ICRAF) in 2005, the LDSF has been implemented in over 40 countries by a myriad of partners and across diverse ecosystems (Figures 2 and 3).
Heatmap showing the number of LDSF plots (n = 49,000) sampled by vegetation structure class (columns) and year (rows) over the period December 2005 to April 2026. The current LDSF soil, rangeland and land health database spans 40 countries, 64 ecoregions and 7 biomes.
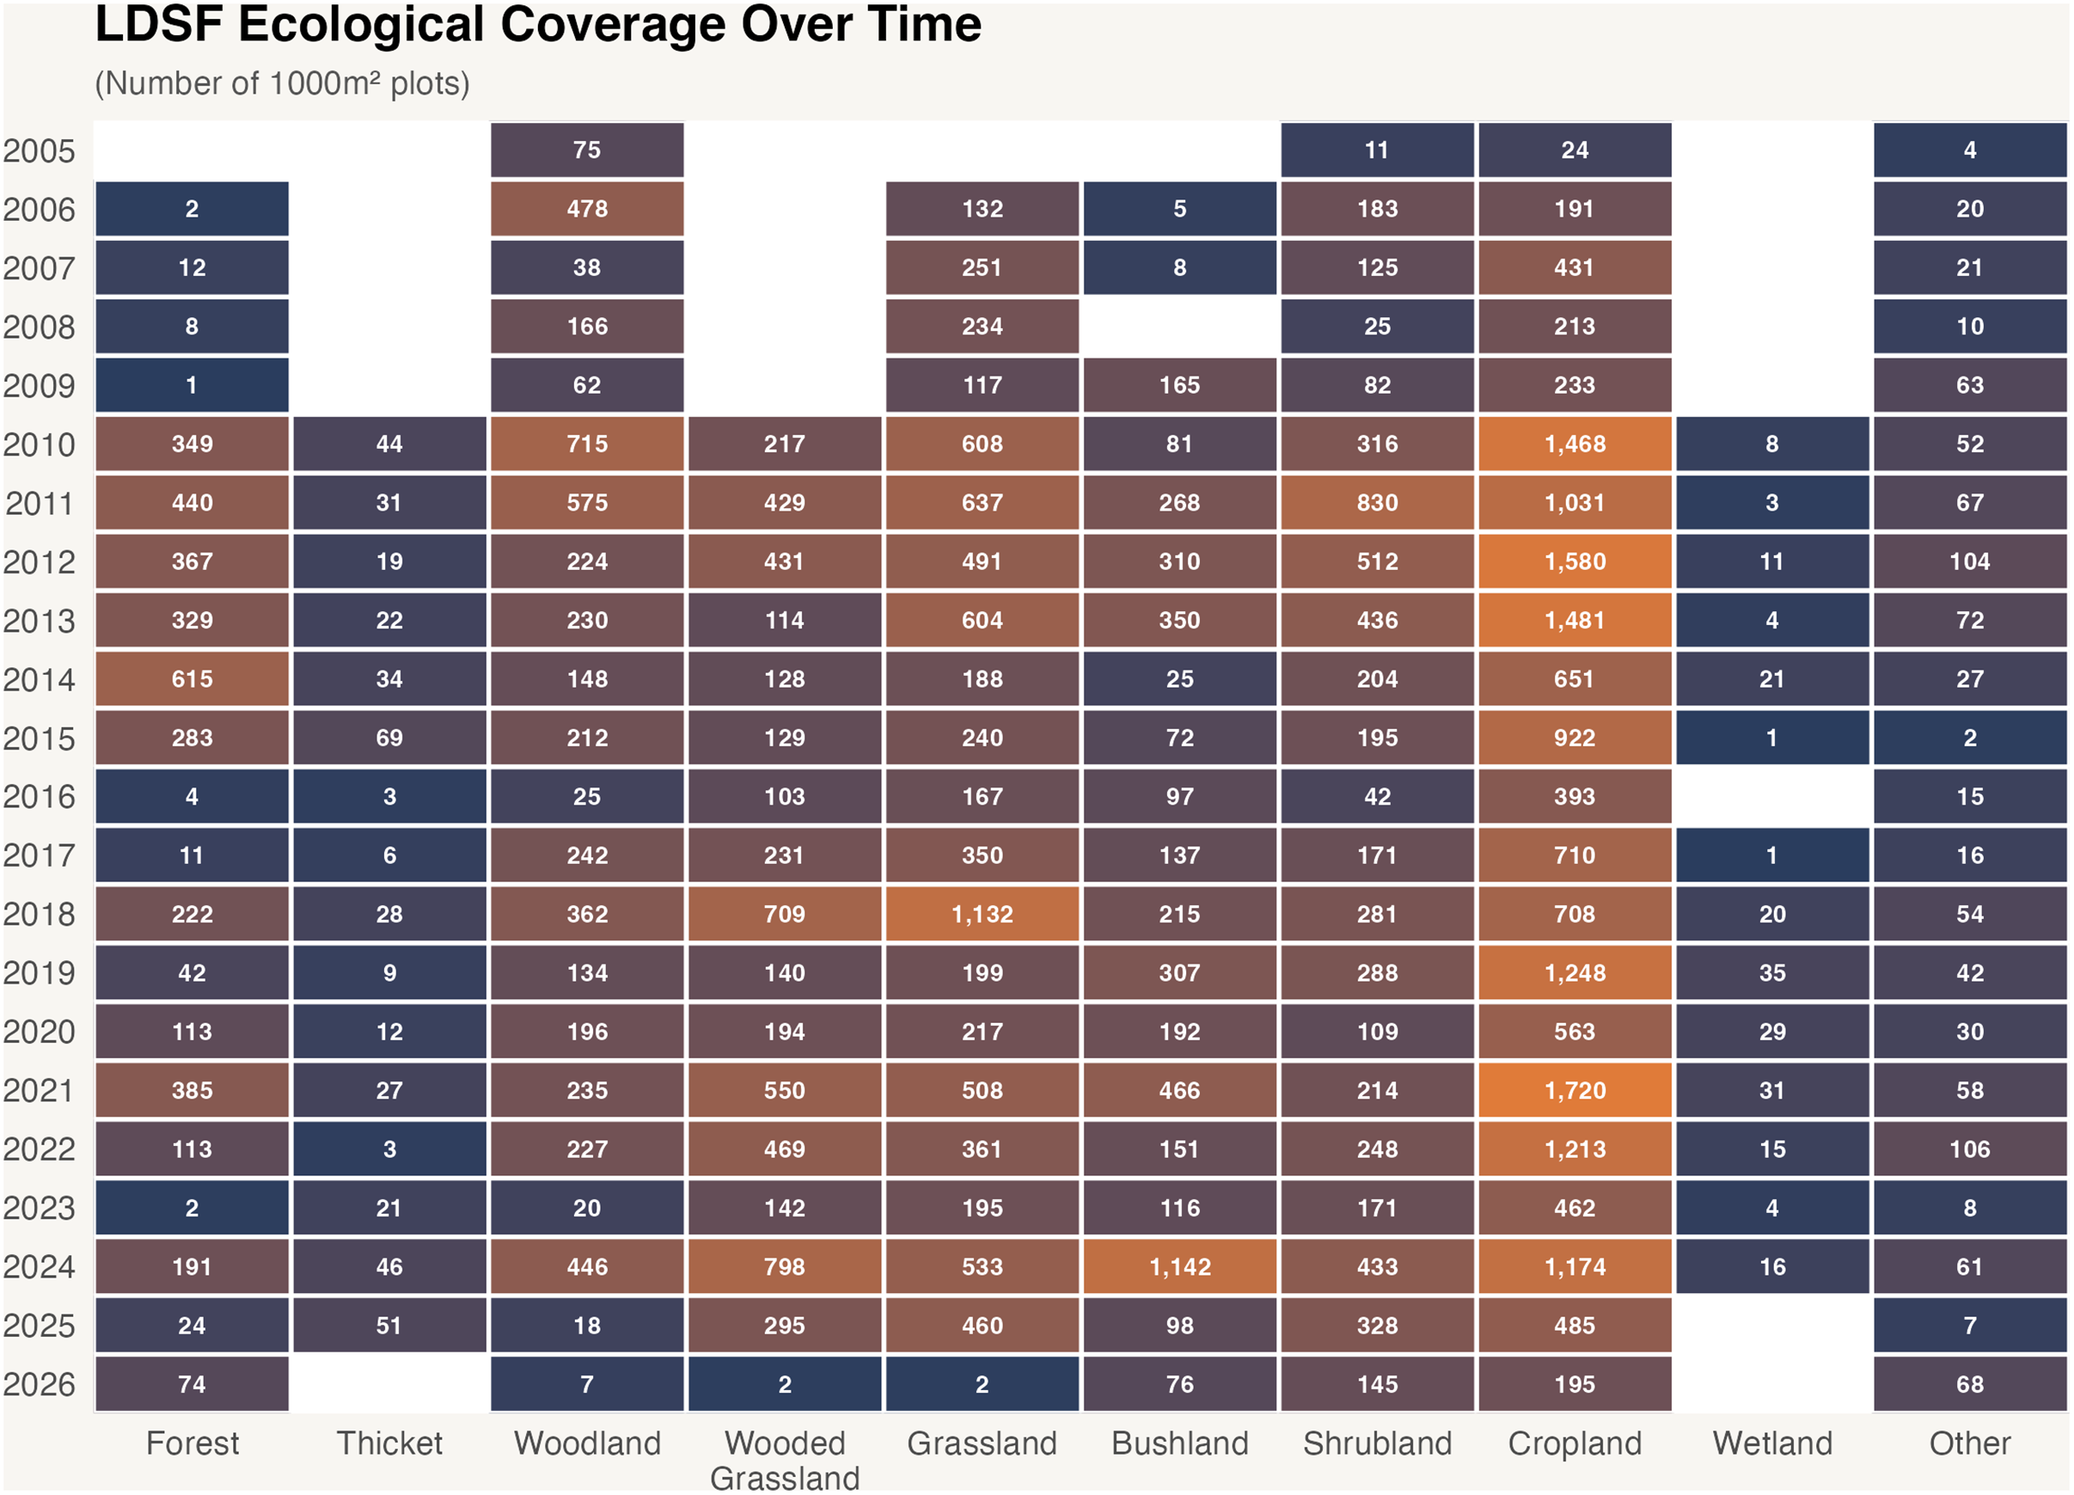
Figure 2. Long description
The heatmap displays the number of 1000 m super 2 plots sampled annually.
* Axes: The vertical Y-axis lists years from 2005 at the top to 2026 at the bottom. The horizontal X-axis lists ten vegetation classes: Forest, Thicket, Woodland, Wooded Grassland, Grassland, Bushland, Shrubland, Cropland, Wetland, and Other.
* Color Scale: Low values are represented by dark blue/purple cells, while high values are represented by bright orange cells.
* Temporal Trends: Sampling was sparse between 2005 and 2009. A significant increase in sampling density began in 2010 and remained high through 2025, with a projected decrease in 2026.
* Distribution by Class:
- Cropland consistently shows the highest sampling density, with peaks of 1,580 plots in 2012 and 1,720 plots in 2021.
- Grassland and Wooded Grassland show high density, particularly in 2018 with 1,132 plots in Grassland and 2024 with 798 plots in Wooded Grassland.
- Bushland shows a major peak in 2024 with 1,142 plots.
- Wetland and Thicket consistently show the lowest sampling counts across the entire time period, often with single-digit or low double-digit values.
Distribution of LDSF sites (top) (see also https://ldsf.thegrit.earth/) and examples of land health maps across rangeland systems in Laikipia County, Kenya (bottom). These maps were developed using machine learning models based on data from the LDSF network of field sites and Earth Observation.
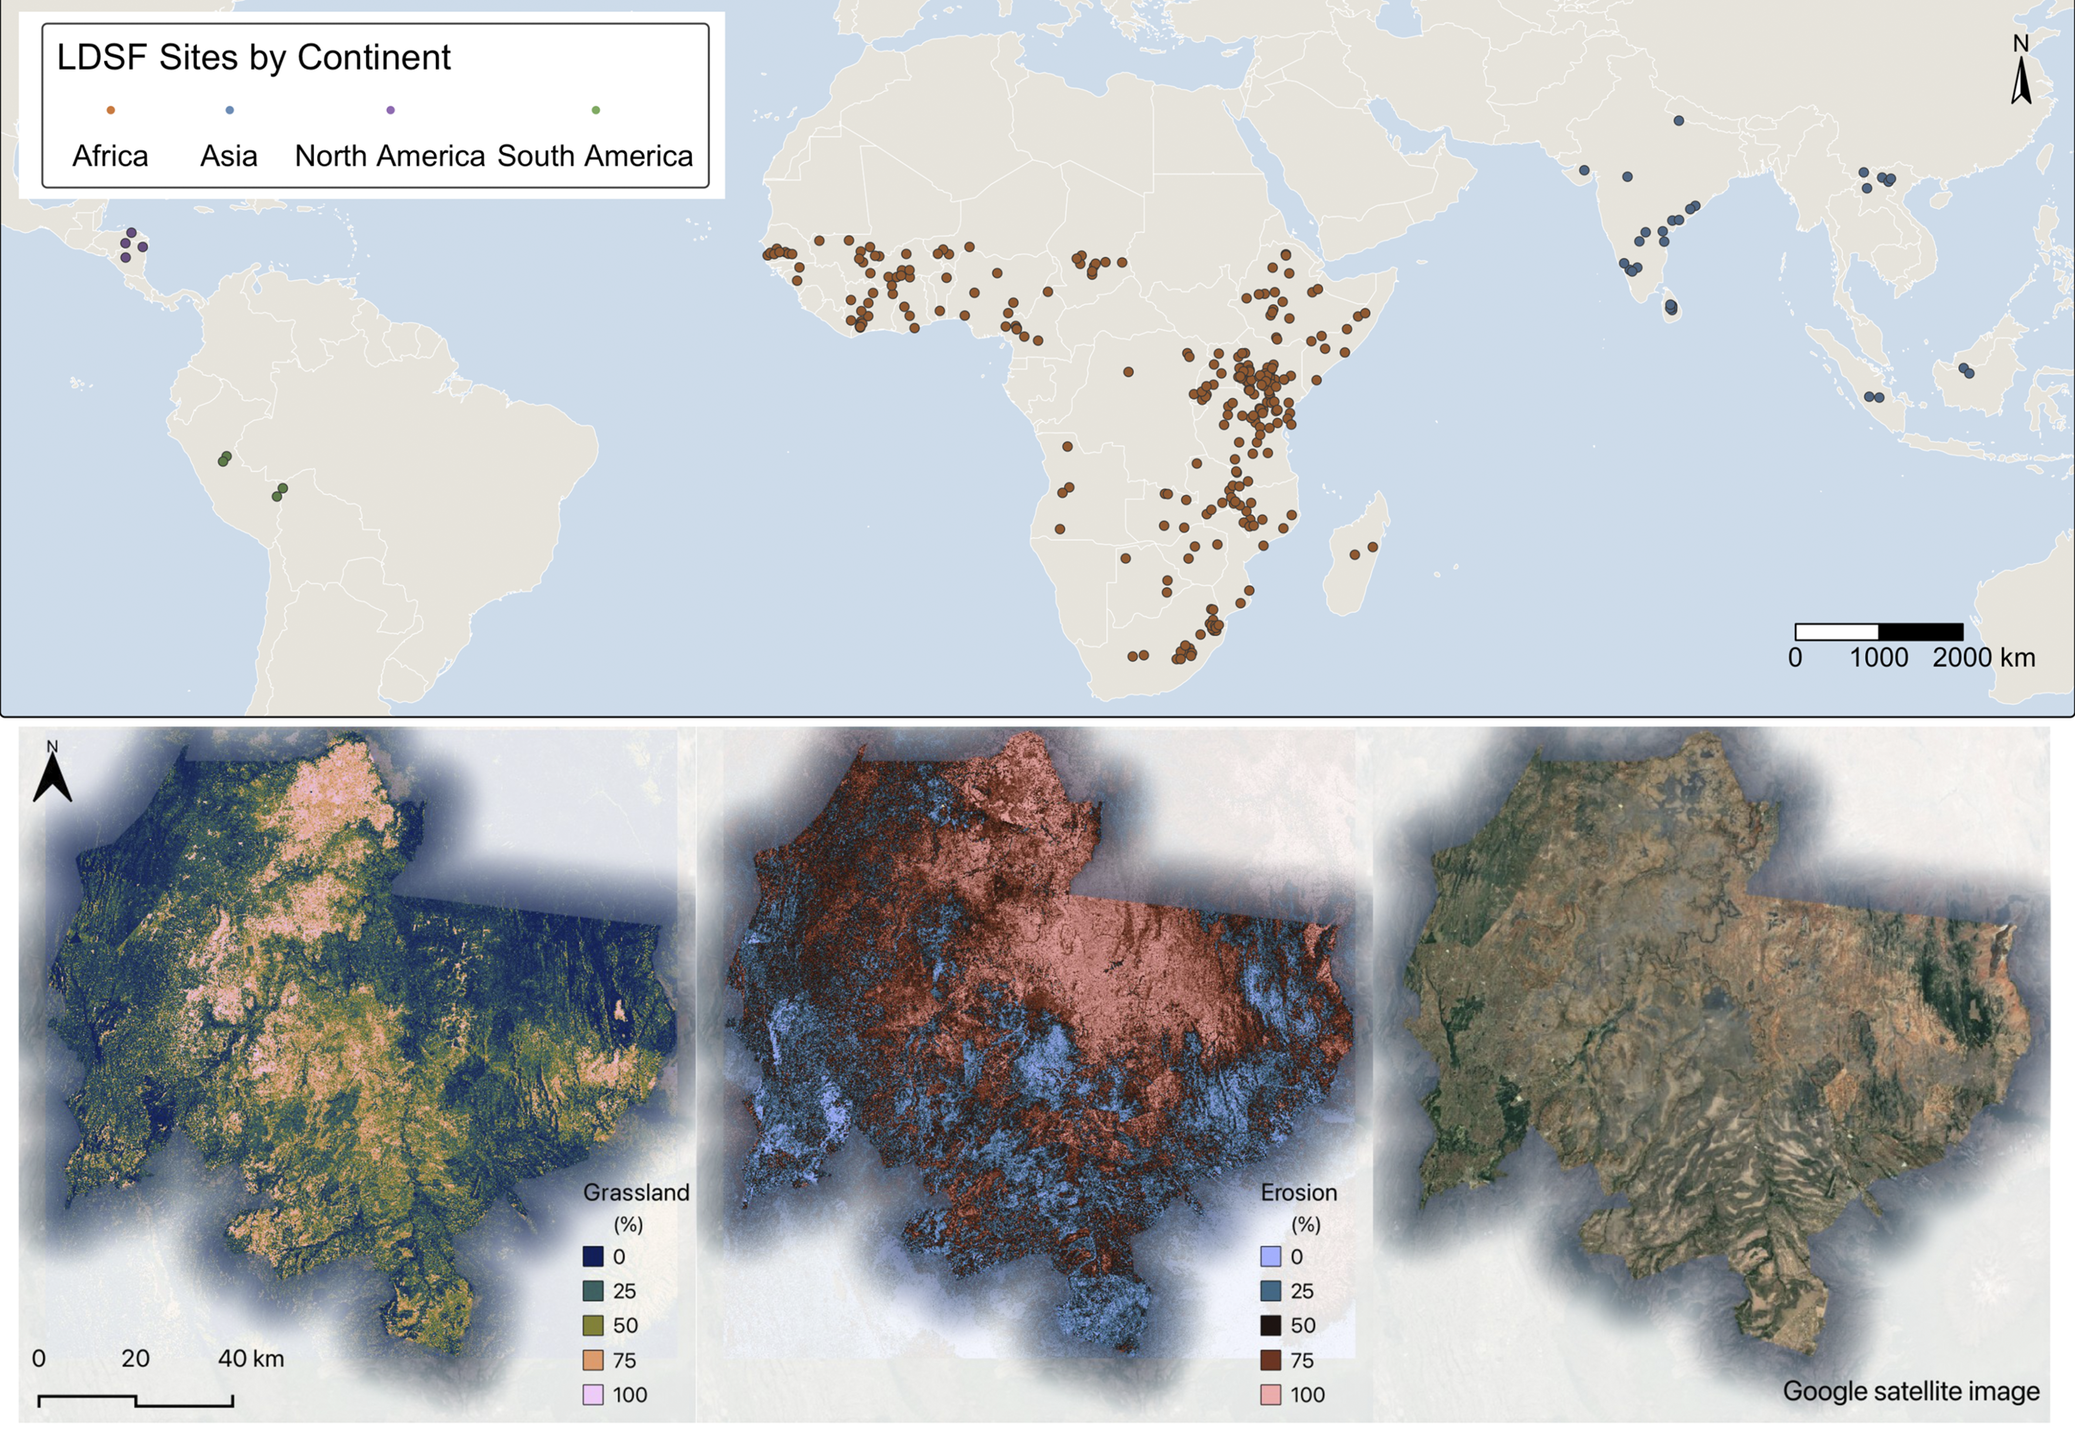
Figure 3. Long description
The top panel is a world map titled L D S F Sites by Continent. Brown dots representing Africa are densely clustered in West, Central, and East Africa. Blue dots for Asia are scattered across India and Southeast Asia. Purple dots for North America are located in Central America. Green dots for South America are located in the western region. A scale bar indicates 0 to 2000 k m.
The bottom panel contains three maps of the same geographic area in Laikipia County.
1. The left map shows Grassland percentage. A color scale ranges from dark blue at 0 percent to light pink at 100 percent. High concentrations of pink and tan (75 to 100 percent) are visible in the North and Northeast.
2. The center map shows Erosion prevalence. A color scale ranges from light blue at 0 percent to dark red at 100 percent. High erosion (75 to 100 percent) is concentrated in the North and central regions, while lower erosion (0 to 25 percent) is found in the South.
3. The right map is a Google satellite image showing the natural terrain in shades of green and brown.
A 40 k m scale bar is provided at the bottom left.
The LDSF has been implemented across multiple projects and settings. For example, within the ecosystem restoration agenda, including in the semi-arid regions in Chad to determine land restoration potential (Takoutsing et al., Reference Takoutsing, Winowiecki, Bargués-Tobella and Vågen2023), and in central Kenya and eastern Rwanda to assess and prioritize landscape restoration actions (Winowiecki et al., Reference Winowiecki, Vågen, Kinnaird and O’Brien2018, Reference Winowiecki, Bargués-Tobella, Mukuralinda, Mujawamariya, Ntawuhiganayo, Mugayi, Chomba and Vågen2021). The LDSF has been used to produce maps of soil organic carbon at both continental (Vågen et al., Reference Vågen, Winowiecki, Tondoh, Desta and Gumbricht2016) and landscape levels (Winowiecki et al., Reference Winowiecki, T-G and Huising2016), as well as for assessments of soil organic carbon in the rangelands of Kenya (Vågen et al., Reference Vågen, Davey, Shepherd, Ramachandran Nair and Garrity2012). In addition, LDSF data have been used to determine controls on soil organic carbon persistence (von Fromm et al., Reference Von Fromm, Doetterl, Butler, Aynekulu, Berhe, Haefele, McGrath, Shepherd, Six, Tamene, Tondoh, Vågen, Winowiecki, Trumbore and Hoyt2024) and to understand drivers of saturated soil hydraulic conductivity (Bargués-Tobella et al., Reference Bargués-Tobella, Winowiecki, Sheil and Vågen2024). Also, LDSF-derived data and insights have been used to support integrated social-ecological approaches that aim to guide sustainability transformations in drylands (Bargués-Tobella et al., Reference Bargués-Tobella, Knutsson, Bostedt, Hörnell, Lindvall, Mpairwe, Mureithi, Nyberg, Nuberg, Ong’ao Ng’asike, Schumann, Turinawe, Vågen, Winowiecki, Wredle and Öborn2026). This wide application of the LDSF demonstrates its utility and scalability across multiple domains, which is due in part to its robust sampling design and indicator framework.
LDSF sampling design
The LDSF employs a geospatially stratified, randomized sampling design, where the basic sampling unit is a cluster consisting of 10 random sampling plots, each 1,000 m2 in size. Each plot has four 100 m2 subplots where measurements are made. Clusters are stratified based on a defined stratum. A standard LDSF sentinel site is designed for unbiased sampling of landscapes and covers a 100 km2 landscape, which is stratified into 16 tiles or grid cells with one sampling cluster randomly located within each tile. However, other designs may be used where strata are defined by: (i) management units (e.g., administrative units, conservation areas and community grazing areas) where the aim is to evaluate specific interventions or governance arrangements; (ii) hydrological units (e.g., watersheds or subcatchments) where land–water interactions are central; or (iii) broad ecological zones or ecoregions (e.g., based on established bioclimatic or vegetation maps). This approach preserves statistical comparability across sites by keeping the within-landscape sampling design consistent, while allowing the stratification to reflect context-specific management and ecological boundaries.
This hierarchical sampling design also enables robust statistical analyses, assessing variability among plots within each cluster, among clusters within each site, and across sites in the global dataset. At each georeferenced plot, a standardized suite of indicators is measured, including land use history, management practices, soil erosion, vegetation density and diversity, and soil properties, among other variables. These indicators adhere to the S.M.A.R.T. framework (Doran, Reference Doran1981) in that they are: (i) Specific: The indicator should accurately describe what is intended to be measured and should not include multiple measurements in one indicator; (ii) Measurable: Regardless of who uses the indicator, consistent results should be obtained and tracked under the same conditions; (iii) Attainable (or obtainable): Collecting data for the indicator should be practical, feasible and cost-effective, while remaining scientifically robust; (iv) Relevant: The indicator should be closely connected with each respective input, output or outcome; and (v) Time-bound: The indicator should represent a specific time frame.
The LDSF indicator set is supported by detailed field protocols which are documented in the LDSF Field Manual (Vågen and Winowiecki, Reference Vågen and Winowiecki2025). Here we briefly summarize the key measurement protocols. Soil samples for soil organic carbon (SOC) and other soil properties are typically collected at fixed depths (0–20 cm and 20–50 cm) using a soil auger, with composite samples from each plot. Cumulative mass sampling (Vågen and Winowiecki, Reference Vågen and Winowiecki2013) is conducted at 0–20, 20–50, 50–80 and 80–110 cm depth increments for estimation of bulk density and SOC stocks at the center subplot. Vegetation assessments are conducted at the subplot level, including assessments of woody and herbaceous cover ratings. Trees and shrubs are identified to species level, counted and measured for diameter at breast height and height. Trees are considered woody vegetation >3 m tall, and shrubs are woody vegetation between 1.5 and 3 m tall. Land degradation assessments are also conducted at the subplot level by assessing erosion prevalence (none, sheet, rill and gully), as well as recording auger depth restrictions, which is an indicator of compaction or root-depth restrictions. Soil water infiltration capacity is measured at three plots per cluster using a single ring infiltrometer in the field, where observations are made over 2.5 hours. These data are used to calculate field-saturated soil hydraulic conductivity.
Field observations are collected using electronic data entry tools and uploaded to a relational database. As with any large-scale field and laboratory assessment framework, uncertainty may arise, for example, from observer variability and laboratory analytical variation. However, the use of standardized and simple-to-implement field protocols, standard operating procedures for laboratory analysis (including for dry spectroscopy), electronic data entry and georeferenced plot locations helps minimize inconsistencies across sites and survey campaigns.
Repeat measurements within the LDSF can be conducted by revisiting the original georeferenced sampling plots, enabling assessment of temporal changes in soil and land health indicators. However, the LDSF does not have a fixed repeat sampling interval, as resampling largely depends on resource availability. In parallel, georeferenced LDSF field datasets can be integrated with Earth Observation data to build spatial predictive models and assess trends in land health indicators over time, allowing for scalable temporal analyses across broader spatial extents. For example, LDSF field measurements have been used to train models based on a range of satellite sensors, such as Landsat, Sentinel 2 and Sentinel 1, for prediction of key indicators of soil and land health, such as soil organic carbon or soil erosion prevalence (Vågen and Winowiecki, Reference Vågen and Winowiecki2013; Vågen et al., Reference Vågen, Winowiecki, Tondoh, Desta and Gumbricht2016; Vågen and Winowiecki, Reference Vågen and Winowiecki2019). These soil and land health maps are also valuable for informing both local interventions and global policy analysis.
Applications in rangelands
In 2018, the LDSF rangeland module was developed to respond to an increasing demand for data on rangeland ecosystems. This module added indicators specific to rangelands to the LDSF core indicator framework, allowing for detailed assessments of rangeland health. The LDSF rangeland module has been employed in Lesotho for their national annual rangeland monitoring, as well as in eSwatini, Ethiopia, Kenya, Rwanda, Senegal and Tanzania for assessments of rangeland health. This expansion is also reflected in the temporal distribution of the LDSF dataset (Figure 2), which shows increased sampling coverage of rangeland-related vegetation structure classes from 2018 onwards. While earlier phases of the LDSF implementation had a stronger representation of croplands, recent years show broader coverage across grasslands, shrublands, bushlands and wooded grasslands.
In the rangeland module, two 30 m transects are laid out (North–South and East–West) in each LDSF plot. At every 2 m, an assessment of the nearest annual and perennial grasses, woody vegetation and forbs are identified, as well as whether the point falls on bare ground, grass tuft, dung or litter. These data are used to calculate vegetation species richness, diversity and abundance, as well as understanding co-occurrence matrices and the presence of invasive species. This detailed vegetation survey enables the understanding of vegetation dynamics and can be implemented in the wet and dry seasons, as well as over time.
The LDSF, through the rangeland module, provides a solution to the data gap challenges as it integrates statistically rigorous field-based methods with spatially explicit modeling and remote sensing. The structured and hierarchical nature of the LDSF sampling enables leveraging Earth Observation datasets, along with predictive modeling and machine learning approaches, to generate spatially continuous maps of soil and vegetation indicators. This expands the local observation across broad landscapes and through time. Additionally, this enables developing more dynamic baselines that reflect expected ranges of variability rather than static reference conditions. For example, LDSF data were collected across rangelands in Laikipia County in Kenya. Using these data, maps of grassland cover and erosion prevalence were made at 30-m resolution (Figure 3).
Systematic deployment of the LDSF across global rangelands offers a unique opportunity to fill critical knowledge gaps, harmonize data and inform evidence-based policies for restoration, sustainable land management and climate adaptation. By providing a consistent monitoring approach, the LDSF also enables collaboration across regions and countries, allowing practitioners and policymakers to compare data and share experiences.
Application of the LDSF outside the tropics
Although the LDSF has been developed, tested and most extensively implemented across tropical and subtropical landscapes (Figure 3), its core design principles are not inherently limited to these regions. The framework’s hierarchical, spatially explicit sampling design, standardized field protocols and integration of field observations, soil laboratory analysis, spectroscopy, remote sensing, and predictive modeling are broadly relevant to land health monitoring in other biomes. In addition, many of the LDSF indicators, such as soil organic carbon, texture, pH, erosion prevalence, infiltration capacity, vegetation cover, structure and diversity, represent fundamental dimensions of soil and ecosystem function across temperate, Mediterranean and boreal ecosystems, as well as the tropics and subtropics. Therefore, the LDSF should be transferable to other regions beyond the tropics because its core design principles are not biome-specific.
However, while the LDSF methodology itself is transferable, the interpretation of results and associated thresholds would need to be adapted to regional ecological conditions outside the tropics. Indicator values that signal degradation or recovery in tropical landscapes may not have the same meaning in temperate systems, where soil properties and vegetation dynamics are shaped by different climatic regimes, parent materials, management histories and seasonal cycles. For example, soil organic carbon levels, vegetation cover, infiltration rates, bulk density and pH must be interpreted relative to local soil types, land-use systems, seasonal conditions and ecological baselines rather than against generalized thresholds. Therefore, the LDSF can be considered a broadly applicable monitoring framework with strong potential for use beyond tropical regions, provided that indicator interpretation and associated thresholds are regionally calibrated and ecologically relevant.
Enabling conditions for scaling of the LDSF
Key elements enabling the successful application of the LDSF at scale have included the development of a detailed field manual, the use of simple and accessible field tools, electronic data entry and a methodology that is straightforward to implement while remaining scientifically robust. At the same time, continued methodological custodianship and coordination remain important for maintaining consistency, data quality, comparability across sites and regions and centralized data management. Such coordination also helps identify coverage gaps to support expansion of the LDSF network. This custodianship does not dictate or hamper the data analysis, application and interpretation. Together, these technical and institutional features are critical for logistical feasibility, partner uptake, consistent implementation across diverse contexts and the long-term scaling of the framework. In addition, maintaining a core set of indicators alongside a flexible and modular design allows the LDSF to be expanded into new contexts and applications, such as carbon monitoring, reporting, and verification, assessment of rangeland health, and soil biological assessment.
There are also important stakeholder engagement and capacity development dimensions that have contributed to the successful application of the LDSF at scale. Implementing the LDSF on the ground with national institutions, research partners, universities, government agencies, and local communities creates opportunities for hands-on training in sampling design, standardized field data collection, soil sampling, data management, quality assurance and interpretation of results. This practical, field-based approach helps build local technical capacity while also strengthening ownership of the data and the monitoring process.
By involving partners directly in implementation, the LDSF also promotes stronger stakeholder engagement and trust in the results. Partners are not only recipients of final outputs; they are actively involved in generating, validating and interpreting the evidence. This improves understanding of what the indicators mean, how they can be used and how the data can inform restoration planning, soil health monitoring, land management decisions and policy processes. In this way, the LDSF serves not only as a monitoring framework, but also as a platform for learning, collaboration, stakeholder engagement and sustained institutional capacity development.
In addition to the above, social and institutional conditions under which a global rangeland monitoring system is implemented play a critical role. For example, rangeland regions are often characterized by complex and overlapping land tenure arrangements, mobile and transhumant pastoral systems and contested governance structures. These are elements that need to be taken into consideration to ensure the continuity of monitoring sites, also pointing to the importance of structured stakeholder engagement throughout the development and implementation of such monitoring systems. While the LDSF has primarily focused on building a robust biophysical and data-integration architecture, many of its successful implementations have depended on codesign with national and local institutions, and other implementing partners, with explicit attention to how monitoring results will be used in decision-making. In other words, governance, tenure arrangements, pastoral and nomadic mobility and ethical safeguards are not externalities, but rather enabling conditions that must be addressed alongside technical design for a rangeland monitoring framework to be successful.
Next steps
There are several potential next steps for advancing a global rangeland monitoring framework that builds on the LDSF outlined below.
1. Stakeholder engagement for framework application
The LDSF will continue to be refined to serve as the backbone for a standardized global rangeland monitoring framework. A structured engagement process for application across diverse contexts will be implemented, including integration with traditional ecological knowledge.
2. Integration with global standards
A collaborative process is underway to align LDSF-based rangeland monitoring with the emerging Global Rangelands Standard (GRS) led by the Rangeland Stewardship Council and partners such as the Sustainable Fibre Alliance (SFA). This integration of a standard monitoring and evaluation framework within a Standard has the potential to build trust and buy-in.
3. Expansion to new landscapes
The LDSF has predominantly been applied in the tropics. Therefore, there is an opportunity to expand its application to new environments, including temperate zones. This will have important implications to ensure it is a globally applicable framework.
4. Engagement in national and international reporting frameworks
There is a growing opportunity to implement the LDSF for national, continental and international reporting commitments. For example, the LDSF could support reporting under the Nationally Determined Contributions (NDCs) (using soil organic carbon as a climate change mitigation measure), or under the UNCCD Land Degradation Neutrality targets where changes in vegetation and soil organic carbon are reported. On the African continent, there is an emerging opportunity within the 2025 Kampala Declaration Comprehensive Africa Agriculture Development Plan (CAADP) to include soil organic carbon as a key indicator for member states to report on every 2 years. Under the UN Decade on Ecosystem Restoration, the LDSF could be used for tracking the impact of restoration efforts, as well as within the National Biodiversity Strategies and Action Plans (NBSAPs), where soil biodiversity has been recognized under the Kunming-Montreal Global Biodiversity Framework. The International Year of Rangelands and Pastoralists (IYRP) in 2026 also presents an important opportunity to bring evidence to bear and highlight the state of rangeland health and the impact of rangeland restoration on overall ecosystem health. By harmonizing rangeland, soil and land health monitoring globally, these data can be used by governments to comply with multiple reporting commitments, while enhancing transparency and accountability.
Open peer review
For open peer review materials, please visit https://doi.org/10.1017/dry.2026.10040
Data availability statement
There were no data presented in this article, only summary statistics on the LDSF sites. Here is the website: https://ldsf.thegrit.earth/
Acknowledgments
The authors would like to sincerely thank the team members who have toiled in the field collecting these data, including John Maina and Musembi J. Kimeu. Appreciation to the myriad of partners who have supported this work. A sincere thank you to Hanna Linden for support in the editing and submission. A special thanks to Debra Harte, a brilliant graphic designer who designed Figure 1.
Author contribution
L.W., A.B.T. and T.G.V. conceptualized the publication and wrote the original draft, and all authors contributed to reviewing and editing the manuscript. N.R. and R.V. led the review of methodologies and wrote that section. B.T., M.N., J.B., R.C., C.M., I.T., B.O., E.W., D.A., D.A.A. and L.M. contributed to data collection and curation. S.T. contributed to conceptualization and oversight.
Financial support
This work was supported by a Global Environment Facility (GEF)-funded project, “Sustainable Investments for Large-Scale Rangeland Restoration (STELARR),” grant number GEFSEC ID: 10816, and the International Union for Conservation of Nature (IUCN) Project No. PO3903; UK PACT (Partnering for Accelerated Climate Transitions), jointly governed and funded by the UK Government’s Foreign, Commonwealth and Development Office (FCDO) and the Department for Energy Security and Net Zero (DESNZ) through the UK’s International Climate Finance, project number 301495; The Nature Conservancy; and the Restore4More project, funded by Formas – the Swedish Research Council for Sustainable Development – within the National Research Program on Climate and the National Research Program on Oceans and Water (Grant 2023-00307).
Competing interests
The authors declare none.

 Open access


Comments
Dear Editorial Team,
This paper addresses the need for a reliable, cost-effective, and accurate monitoring framework to support ecosystem restoration and combat soil and land degradation, globally. The Land Degradation Surveillance Framework (LDSF) is a novel approach that combines robustly structured field-based data collection, standardized laboratory protocols, and integration with cutting edge remote sensing work flows, enabling systematic assessments of soil and rangeland health.
The LDSF has been applied in more than 45 countries, including in the rangelands of Kenya and other dryland environments. The LDSF and the position of this article align ideally with the scope of the Cambridge Prisms: Drylands journal, and we believe that it will be a good fit for publication. We believe that our findings will be relevant to your readers who may be looking for a tested, affordable and vigorous solution to monitoring soil and land health, filling key knowledge gaps, and aiding decision-making.
The article “Towards a Global Monitoring Framework of Soil and Rangeland Health: Building on 20 years of the LDSF” is an original work conducted by the authors, and it has not been published elsewhere. We declare no conflicts of interest in this submission.
Thank you for your time and consideration,
Sincerely,
Leigh Winowiecki