


Introduction
Dung beetles play a crucial role as ecosystem service providers by efficiently recycling animal waste (Nichols et al. Reference Nichols, Spector, Louzada, Larsen, Amezquita and Favila2008; Noriega et al. Reference Noriega, Hortal, deCastro-Arrazola, Alves-Martins, Ortega, Bini, Andrew, Arellano, Beynon, Davis, Favila, Floate, Horgan, Menéndez, Milotic, Nervo, Palestrini, Rolando, Scholtz, Senyüz, Wassmer, Ádam, Araújo, Barragan-Ramírez, Boros, Camero-Rubio, Cruz, Cuesta, Damborsky, Deschodt, Rajan, D’hondt, Díaz Rojas, Dindar, Escobar, Espinoza, Ferrer-Paris, Gutiérrez Rojas, Hemmings, Hernández, Hill, Hoffmann, Jay-Robert, Lewis, Lewis, Lozano, Marín-Armijos, De Farias, Murcia-Ordoñez, Karimbumkara, Navarrete-Heredia, Ortega-Echeverría, Pablo-Cea, Perrin, Pessoa, Radhakrishnan, Rahimi, Raimundo, Ramos, Rebolledo, Roggero, Sánchez-Mercado, Somay, Stadler, Tahmasebi, Triana Céspedes and Santos2021). They feed on and bury dung, which helps to break it down and return nutrients to the soil (Stanbrook and King Reference Stanbrook and King2022), benefiting plant growth (Badenhorst et al. Reference Badenhorst, Dabrowski, Scholtz and Truter2018) and reducing greenhouse gas emissions (Piccini et al. Reference Piccini, Arnieri, Caprio, Nervo, Pelissetti, Palestrini, Roslin and Rolando2017). However, these invaluable insects are facing multiple threats, namely habitat loss, primarily due to deforestation and urbanisation, and the widespread use of anti-parasitic medications that are considered toxic to dung beetles (Lumaret et al. Reference Lumaret, Kadiri and Martínez-M2020; Tovar et al. Reference Tovar, Correa, Lumaret, López-Bedoya, Navarro, Tovar and Noriega2023). Climate change poses another challenge, as rising temperatures and altered precipitation patterns can disrupt the timing and availability of dung resources, affecting their reproductive success and overall survival (Kirkpatrick and Sheldon Reference Kirkpatrick and Sheldon2022). A recent review of the factors driving declines in tropical dung beetles has outlined how other human activities may alter dung beetle abundance, assemblage composition, and diversity (Fuzessy et al. Reference Fuzessy, Benítez-López, Slade, Bufalo, Magro-de-Souza, Pereira and Culot2021; Lopez-Bedoya et al. Reference López-Bedoya, Bohada-Murillo, Ángel-Vallejo, Audino, Davis, Gurr and Noriega2022). Importantly, Fuzessy et al. suggested that anthropogenic actions are likely to harm dung beetle populations directly through habitat loss and indirectly through the cascading effects of large mammal depletions.
Reductions in mammal diversity and habitat destruction often go hand in hand (Cassano et al. Reference Cassano, Barlow and Pardini2014; Quinn et al. Reference Quinn, Awada, Trindade, Fulginiti and Perrin2017) and insects are particularly susceptible to habitat loss and are known to be affected by reductions in hospitable habitat necessary to support healthy populations (Cardoso and Leather Reference Cardoso and Leather2019; Hallmann et al. Reference Hallmann, Sorg, Jongejans, Siepel, Hofland, Schwan, Stenmans, Müller, Sumser, Hörren, Goulson and De Kroon2017; Wagner Reference Wagner2020). One such insect group, dung beetles, also rely on access to mammal faeces in addition to natural intact habitats (Bogoni et al. Reference Bogoni, Graipel, de Castilho, Fantacini, Kuhnen, Luiz, Maccarini, Marcon, de Souza Pimentel Teixeira, Tortato, Vaz-de-Mello and Hernández2016; Chiew et al. Reference Chiew, Hackett, Brodie, Teoh, Burslem, Reynolds, Deere, Vairappan and Slade2022; Correa-Cuadros et al. Reference Correa-Cuadros, Gómez-Cifuentes and Noriega2022; Raine and Slade Reference Raine and Slade2019). Human-induced large-scale declines in wildlife populations are often particularly severe for animals with a large body size (Cardillo et al. Reference Cardillo, Mace, Gittleman, Jones, Bielby and Purvis2008; Galetti and Dirzo Reference Galetti and Dirzo2013). Globally, large terrestrial mammals (bodyweight >3kg) are in drastic decline both within (Craigie et al. Reference Craigie, Baillie, Balmford, Carbone, Collen, Green and Hutton2010) and outside protected areas (Harris et al. Reference Harris, Thirgood, Hopcraft, Cromsigt and Berger2009). These declines are germane as many large mammal species provide important ecological functions such as arthropod suppression, seed dispersal, pollination, material, and nutrient distribution (Duffy et al. Reference Duffy, Cardinale, France, McIntyre, Thébault and Loreau2007), and their extirpation can initiate cascading effects likely to instigate functional losses in the ecosystems which once harboured them (Brodie et al. Reference Brodie, Williams and Garner2021; Fleming et al. Reference Fleming, Anderson, Prendergast, Bretz, Valentine and Hardy2014). These losses may become particularly relevant in East Africa where most of the world’s largest mammals now exist (Faurby and Svenning Reference Faurby and Svenning2015) and form the backbone of ecosystem service provision (Dobson Reference Dobson2009). In Kenya, large mammals are at a third of their recorded abundance in the 1970s (Ogutu et al. Reference Ogutu, Owen-Smith, Piepho and Said2011). These populations have undergone severe declines due to poaching, land use change, and livestock incursion, and pachyderms (elephants and rhinoceros), which once roamed freely over wide areas, are now often restricted to game reserves. These reserves are often fenced to combat poaching and prevent agricultural encroachment (Pekor et al. Reference Pekor, Miller, Flyman, Kasiki, Kesch, Miller, Uiseb, van der Merve and Lindsey2019).
To date, several studies have linked dung beetle species richness and abundance to declines in mammalian species richness (Bogoni et al. Reference Bogoni, Graipel, de Castilho, Fantacini, Kuhnen, Luiz, Maccarini, Marcon, de Souza Pimentel Teixeira, Tortato, Vaz-de-Mello and Hernández2016; Coggan Reference Coggan2012; Culot et al. Reference Culot, Bovy, Zagury Vaz-de-Mello, Guevara and Galetti2013; Correa-Cuadros et al. Reference Correa-Cuadros, Gómez-Cifuentes and Noriega2022; Fuzessy et al. Reference Fuzessy, Benítez-López, Slade, Bufalo, Magro-de-Souza, Pereira and Culot2021; Nichols et al. Reference Nichols, Gardner, Peres and Spector2009; Raine and Slade Reference Raine and Slade2019) with the majority of studies finding that dung beetle abundance is high when the surrounding habitat offers a high mammalian biomass (Andresen and Laurance Reference Andresen and Laurance2007; Barlow et al. Reference Barlow, Gardner, Araujo, Ávila-Pires, Bonaldo, Costa, Esposito, Ferreira, Hawes, Hernandez, Hoogmoed, Leite, Lo-Man-Hung, Malcolm, Martins, Mestre, Miranda-Santos, Nunes-Gutjahr, Overal, Parry, Peters, Ribeiro, Da Silva, Da Silva Motta and Peres2007; Krell and Krell-Westerwalbesloh Reference Krell and Krell-Westerwalbesloh2024; Pryke et al. Reference Pryke, Francois and Samways2022). Dung beetles rely on mammalian dung as a both food source and a breeding substrate (Holter Reference Holter2016), and while most dung beetles are generalist feeders of mammalian dung (Frank et al. Reference Frank, Krell, Slade, Raine, Chiew, Schmitt, Vairappan, Walter and Blüthgen2018), many belonging to the subfamily Scarabaeinae are specialist feeders of mammal dung (Raine and Slade Reference Raine and Slade2019), particularly that of large herbivores (Holter Reference Holter2016).
Despite the reliance of dung beetles on mammal dung, there are only a handful of studies that have directly assessed the effects of habitat degradation and associated mammalian loss on dung beetle populations in Africa. Furthermore, a recent study found adult dung beetles to be physically smaller in areas where native wild mammal fauna is absent and replaced by domestic livestock, which indicates that a reduced body condition occurs when dung beetles do not have access to rich and diverse dung resources (Nependa et al. Reference Nependa, Pryke and Roets2021), suggesting negative implications for dung beetle preservation in areas that are or will become faunally depauperate. Consequently, it is not unreasonable to assume that areas with low mammal diversity may also suffer from a decline in ecosystem functioning along with a corresponding decline in dung beetle functional diversity (Correa-Cuadros et al. Reference Correa-Cuadros, Gómez-Cifuentes and Noriega2022; López-Bedoya et al. Reference López-Bedoya, Bohada-Murillo, Ángel-Vallejo, Audino, Davis, Gurr and Noriega2022; Stanbrook et al. Reference Stanbrook, Norrey, Kisingo and Jones2021a). For example, in areas of Africa where elephants have been poached to extirpation, large dung beetles, which as a functional group are responsible for most of the dung removal and nutrient cycling in soils, are largely absent due to lack of elephant dung (Cambefort Reference Cambefort1982). However, while it is likely some large dung beetle species such as those in the Heliocopris genus may occasionally use a dung substitute when elephant dung is no longer available, this switch in dung type may have implications for larvae, as larval offspring display smaller body size in alternative dung types, compared to larvae provisioned with elephant dung (Hanski and Cambefort Reference Hanski and Cambefort1991) indicating possible directional selection in dung beetle body size in a locality where elephants are extirpated. In their meta-analysis of global deforestation and its impact on dung beetles, López-Bedoya et al., (Reference López-Bedoya, Bohada-Murillo, Ángel-Vallejo, Audino, Davis, Gurr and Noriega2022) show that large tunnelling dung beetles are the most sensitive to changes in vegetation cover and demonstrate a marked decrease in abundance when primary forests undergo disturbance. Furthermore, the authors link these changes in abundance to the loss of large mammals, which provide the large quantities of dung required by large tunnelling dung beetles, and also note the loss of larger species of dung beetle can intensify negative effects on ecosystem functioning, as these are the species that make the greatest contribution to ecosystem services (Piccini et al. Reference Piccini, Nervo, Forshage, Celi, Palestrini, Rolando and Roslin2018, Reference Piccini, Caprio, Palestrini and Rolando2020).
Our study assesses the interactive effect of mammal diversity and habitat structure on Afromontane dung beetle richness, abundance, and body size, and attempts to provide a better understanding of how the distribution of elephant [Loxodonta africana (Cuvier, 1825)] may affect dung beetle communities which occur within Afromontane Forest. Our choice of dung beetles as a model taxon is based on previously described attributes of dung beetles as a cost-effective indicator of mammal–dung beetle interactions in a recent similar study in Bornean tropical forest (Chiew et al. Reference Chiew, Hackett, Brodie, Teoh, Burslem, Reynolds, Deere, Vairappan and Slade2022) and in South African woodlands (Pryke, Roets, and Samways 2022). We addressed the following questions (i) does habitat structure have a stronger effect on dung beetle diversity and species richness than mammal abundance in montane forests in Africa? And (ii) are dung beetles directly affected by the density of large mammals such as elephants in African forests? We hypothesised that habitats which contained a higher abundance of mammals, in general, would have a positive effect on dung beetle diversity, and in areas of high elephant density, the assemblage composition of dung beetles would shift towards dung beetles with a larger body size.
Methods
Study site
The Aberdare National Park (ANP), located in central Kenya, contains several Afromontane vegetation types which harbour a diverse assemblage of dung beetles (Stanbrook et al. Reference Stanbrook, Wheater, Harris and Jones2021b), and is one of the best examples of preserved montane forest along the African equator (Kipkoech et al. Reference Kipkoech, Melly, Muema, Wei, Kamau, Kirika, Wang and Hu2020). The ANP lies to the east of the Gregory Rift Valley and is about 80 km north of Nairobi and 17 km from Nyeri town (0.4167° S, 36.9500° E). The altitude of the ANP ranges between 1888 m and 4001 m (Stanbrook et al. Reference Stanbrook, Harris, Wheater and Jones2021). The climate is classed as Cwb: Dry-winter subtropical highland according to the Köppen-Geiger climate classification index. Topography and soil type modify the distribution of the six main vegetation types (Bushland, Juniperus-dominated forest, Podocarpus-dominated forest, Hagenia-dominated forest, Bamboo, and Ericaceous moorland) found within the park. The vegetation consists mainly of bamboo, high heath moorland at upper elevations with large areas of open, and closed canopy forest with Bushland prevalent at lower elevations.
The park also has a rich and diverse mammalian fauna that includes a large population of African elephant (L. africana) (Massey et al. Reference Massey, King and Foufopoulos2014; Morrison et al. Reference Morrison, Omengo, Jones, Symeonakis, Walker and Cain2022) and a small number of black rhino [Diceros bicornis (Linnaeus, 1758] that suffered a population crash, which began in the 1960s and reduced the estimated number from 450 individuals (Sillero-Zubiri and Gottelli Reference Sillero-Zubiri and Gottelli1991) to an estimated seven individuals in the mid-2000s (Patton and Jones Reference Patton and Jones2007). The ANP is enclosed by an electric fence which surrounds the entire 400 km perimeter of the park (Morrison et al. Reference Morrison, Higginbottom, Symeonakis, Jones, Omengo, Walker and Cain2018). Initially, the electric fence was constructed to protect the black rhino population within the ANP but poaching outstripped fence construction and rhino numbers within the park fell drastically between 1989 and 2009 when the fence was completed. However, the fence minimised other illegal activities such as firewood collection and illegal logging, which in the past drove habitat degradation (Lambrechts et al. Reference Lambrechts, Woodley, Church and Gachanja2003), and recent surveys indicate that the ANP may now house a dense elephant population, with elephant detected at various densities ranging from 6.27/km2 in scrub habitat at lower elevations to 0.44/km2 in moorland habitat at higher elevations within the ANP (Morrison et al. Reference Morrison, Omengo, Jones, Symeonakis, Walker and Cain2022).
Dung beetles
Twelve 1500 m transects were used to assess the effect of spatial variation and habitat structure on dung beetle assemblage composition. Twelve pitfall traps were placed at 125 m intervals along each transect (Figure 1). Each trap consisted of a one-litre bowl quarter-filled with a detergent and water solution and buried in the ground with the lip of the bowl level with the soil surface. Traps were baited with 50 g of elephant dung, which was collected each morning prior to being used as bait. The dung was wrapped in fine gauge mesh netting and suspended directly over each one-litre bowl. Traps were emptied and re-baited every 24 hours for four days to provide a total sample of 48 samples per transect and total of 576 samples for the whole study.
(A) The study area showing the distribution of the sampling points, vegetation measurements and camera traps within the Aberdare National Park; (B) The area contained within the rectangle shows the locations of sites describing variation in elephant density with the Aberdare National Park (black boundary). Elephant absent (grey polygon), and the highest abundance site (orange polygon) are adjacent to each other at Treetops Lodge in the East salient area. The low abundance site (brown polygon) is located in an open glade in the salient sector.
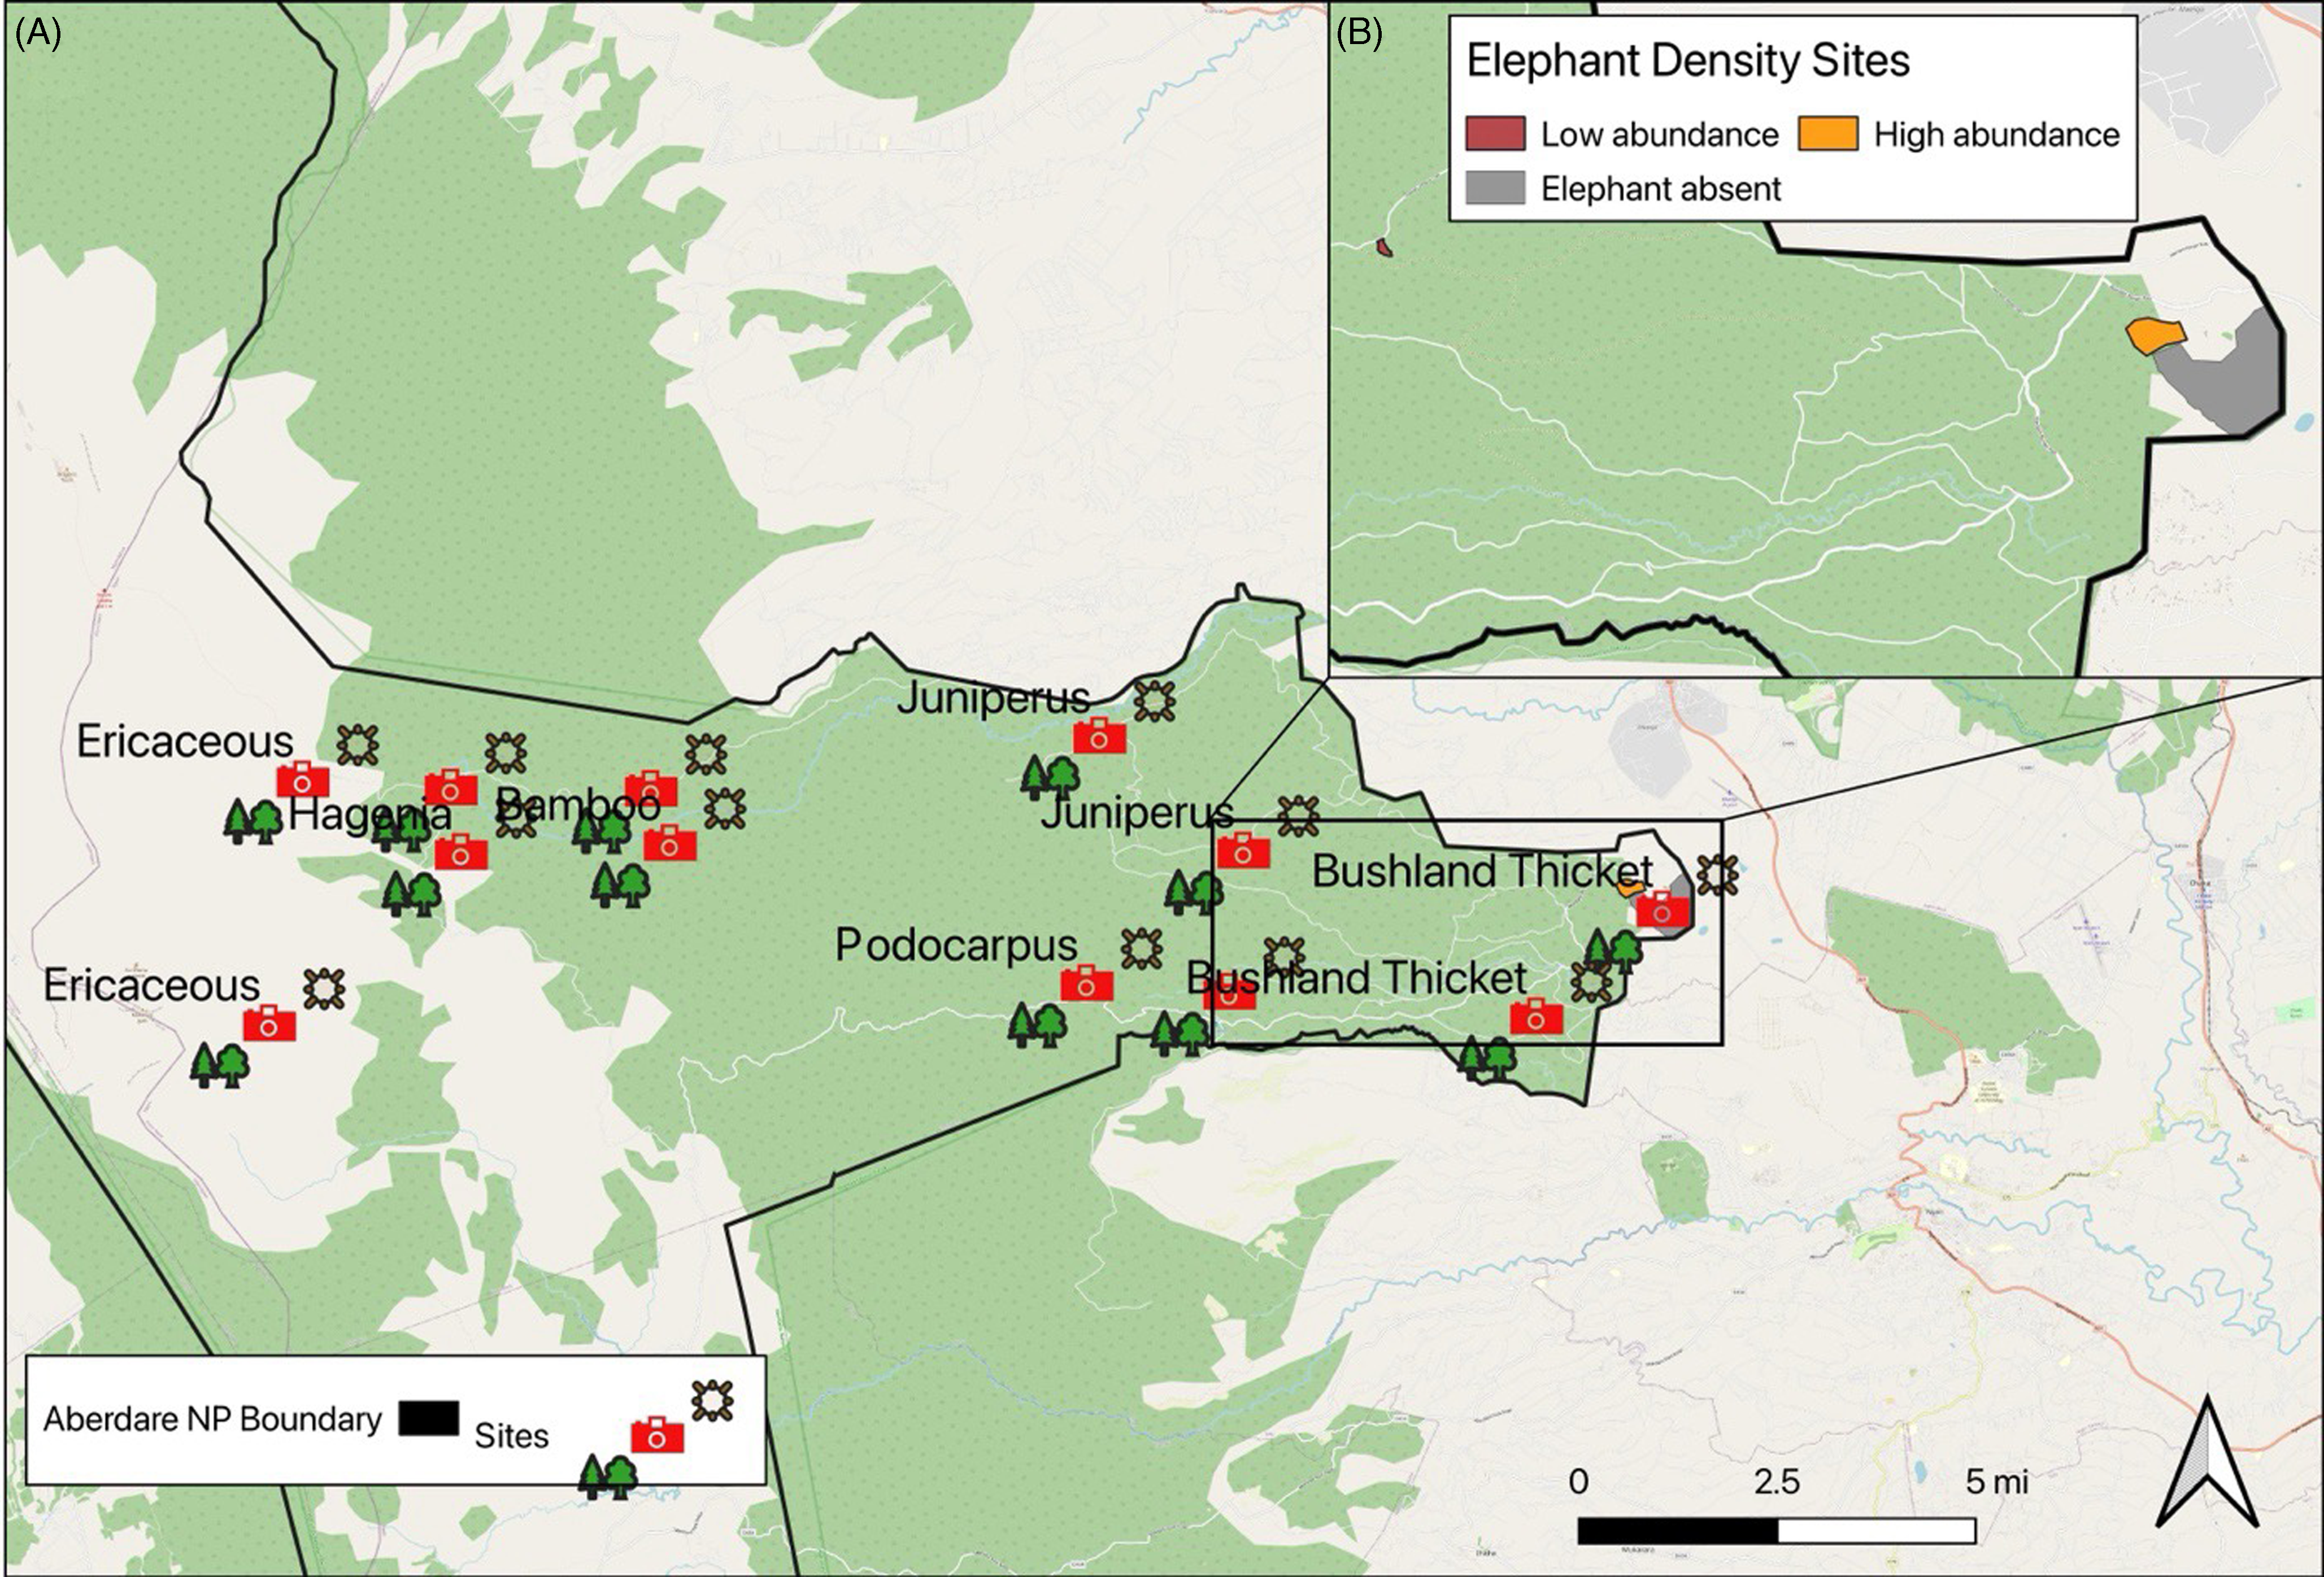
In addition to the twelve transects and pitfall traps mentioned above, which were used to assess the effect of habitat structure on dung beetles, we also set up a smaller subset of four pitfall traps located in each of three areas where we observed high, low, or no elephant presence (Figure 1). These traps were also baited with elephant dung and used the same trapping protocol as described above. These traps were not located along a linear transect but within a 200 m2 grid with each trap located on each corner of the square. In total, 50 g of dung was used as a standardised bait amount to avoid attraction bias between the pitfall traps.
Once collected, the dung beetles were transferred into a 70% ethanol solution for preservation and identification. To measure body length, measurements from the external edge of the clypeus to the bottom of the pygidium were taken using the line toolbar found in the AxioVision software package and recorded in micrometres (μm) per individual dung beetle. We measured thirty individuals of each species, and in instances where fewer than thirty individuals were caught, we measured all of the specimens that were captured. Where more than 30 individuals were caught, a random sample of 30 individuals was taken from the sample to be measured by assigning each beetle a number between zero and the maximum sample size. A random drawing for each specimen was then performed using the random number generator on www.random.org.
Camera traps and mammal data
To assess mammal occurrence and species richness, two Bushnell™ NatureView camera traps were set up within 20 m of each pitfall trap along each transect (Figure 1) during 2015 (6th July–13rd August) and 2016 (12th–29th February), yielding a total sample effort of 15840 trapping hours (55NIGHTX12TRANSECTX24CTRAP). The camera traps recorded 61,230 images overall, 56,578 of which contained no mammal record, and 4,652 images which contained animals which could be identified. Cameras were set at 140 cm above the ground to accommodate the height of most mammals suspected of being present within the sampling sites and to avoid camera loss by hyaena [Crocuta crocuta (Erxleben, 1777)], Cameras were set to record for 24 hours per day with a time delay for activation set at 30 seconds. Traps were checked and reset every four days, with data downloaded onto Secure Digital (SD) cards at the end of the fourth day. The images from SD cards were loaded into Camelot open-source camera trapping software (www.camelotproject.org) for sorting and analysis. Unidentifiable incomplete captures such as tails and hind legs were not considered for further analysis. For this study, photographs of an animal captured by a camera at a particular location in sequence with 5s intervals were considered as a single capture event. We first identified, and then categorised all mammal species into feeding guilds using information found within Kingdon (Reference Kingdon2015).
Camera traps to record elephant occurrence
Three additional camera trap locations were established around Treetops Lodge in the Salient sector of the ANP (Figure 1). Two camera traps were installed in the centre of each pitfall trap grid in each of the two locations known to be occupied by elephant herds at either high or low abundances, and a further two camera traps were installed inside the fenced-off area adjacent to treetops lodge, which is inaccessible to elephants and was used as a control. The camera trapping locations were established with the guidance of the Kenya Wildlife Service who regularly conduct anti-poaching patrols in areas known to be frequented by elephant herds. At the beginning of the long rains (mid-March), the elephants began to migrate from the higher areas of the ANP to the Salient sector where our sampling site was located. They are stopped by the electric fence and are funnelled to the area around Treetops Lodge, where a large population of elephants congregate (Schmitt Reference Schmitt and Goldammer1992). In 1998, a section of the National Park adjacent to the Treetops Lodge was completely enclosed by another electric fence located inside the existing electrified boundary. The fence was constructed to exclude elephants and buffalo (Syncerus caffer) with the aim of protecting the vegetation surrounding a nearby water hole from increasing elephant-induced damage. The camera traps collected a total of 66 independent occurrences of elephant within the two unfenced sites. Eight occurrences of elephant were recorded at the low abundance site, and 58 occurrences of elephant were recorded at the high abundance site, with no elephant occurrence recorded within the fenced site, which was expected. As such, these three sites were chosen to represent areas where elephants were absent, in low abundance and in high abundance.
Assessment of habitat structure
We recorded the following vegetation characteristics within 30 m of each pitfall trap; tree species richness, the number and species of tree, tree diameter at breast height (dbh), percentage ground cover, and percentage canopy cover around and above each trap. Two concentric circles (1 m and 30 m radius) were established around each trap to record the data. Tree seedlings and saplings (2.5–10 cm diameter) were counted in the 1 m radius circle, and mature trees (>10 cm diam.) in the 30 m radius circle. Tree diameter at breast height (dbh) was measured at the standard 1.3 m height. Ground vegetation and canopy cover were determined in the 1 m radius circles. Estimates of percentage ground cover were taken for herbs when individuals were impractical to count. For each trap, the ground vegetation cover was visually scored on a five-point scale within the 1 m radius circle as follows: (1) 0–5 per cent of the total area of the circle; (2) 6–25 per cent of the total area of the circle; (3) 26–50 per cent of the total area of the circle; (4) 51–75 per cent of the total area of the circle; and (5) >75 per cent of the total area of the circle. Canopy cover was measured at three points within the 1 m radius of every trap using a spherical densiometer.
Statistical analysis
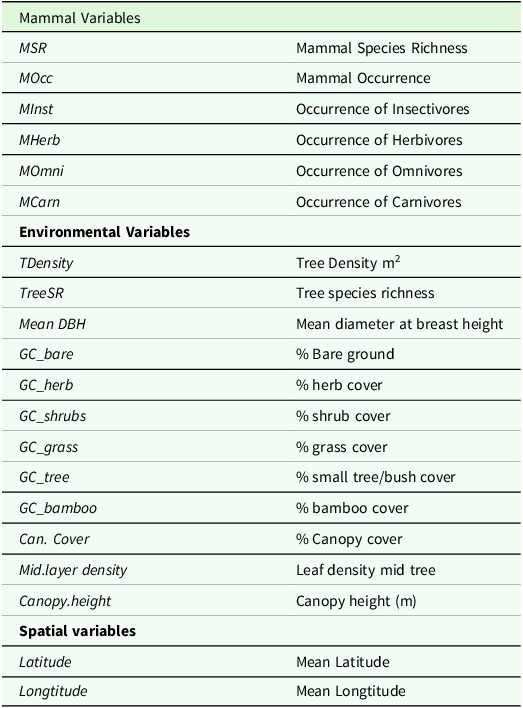
We first assigned variables to one of three matrices (Table 1), which were used to construct a global model that included all explanatory variables. We then conducted transformation-based RDA ordination with forward selection on each matrix, then used variation partitioning to evaluate the per cent contribution (both individual and combined) of each group of predictor variables containing variables related to mammal occurrence, habitat structure, and linear distance to explain the variation in dung beetle assemblage composition, abundance, and body size (Borcard and Legendre Reference Borcard and Legendre2002; Legendre and Legendre Reference Legendre and Legendre1998, Reference Legendre and Legendre2012). The variation was partitioned by selecting a subset of (significant) predictor variables based on the complete mammal data set and non-multi-collinear habitat data and using the forward selection method proposed by Blanchet et al. (Reference Blanchet, Legendre and Borcard2008) to reduce the likelihood of type-I errors. Variation partitioning is a type of analysis that combines RDA and partial RDA to divide the variation of a response variable among two, three, or four explanatory data sets. Variation partitioning performs ordinations for all predictors, then one-by-one for each set of predictors individually, removing the effects of other predictors e.g., RDA for mammals removes the effects of habitat and distance; RDA for habitat removes the effects of mammals and distance (Dray et al. Reference Dray, Legendre and Peres-Neto2006). The proportions of variation explained by the predictors are represented by adjusted r2 (adj. r2) in accordance with Ezekiel’s correction, where values are expressed as percentages.
Mammal, environmental, and spatial variables used to partition the variation in dung beetle species richness, abundance, assemblage structure, and body size
Using the spatial variables, we created Principal Coordinate Analysis of Neighbourhood matrices (PCNM) to determine the spatial heterogeneity of the dung beetle assemblage data between sample sites (Borcard and Legendre Reference Borcard and Legendre2002). The PCNM functions were constructed using the ‘pcnm’ function from the R software ‘vegan’ library. We selected the positive PCNM vectors according to spatial autocorrelation acquired by the Moran index (Dray et al. Reference Dray, Legendre and Peres-Neto2006) using the ‘moran’ function in the R software ‘spdep’ library. PCNM represents spectral decomposition of the spatial relationships among the study sites. Multivariate partitioning (Blanchet et al. Reference Blanchet, Legendre and Borcard2008) can be applied using PCNM variables as spatial or temporal descriptors and, for this reason, were employed as predictors of spatial variation among sample sites to avoid autocorrelation.
We used variation partitioning via Redundancy Analysis (RDA) to assess the percentage contribution for each group of predictor variables. Group one contained predictors relating to habitat structure, group two contained mammal community predictors, and group three contained the linear spatial distance obtained from the PCNMs (Table 1). These groups were subsequently used to describe the variation in dung beetle assemblage composition, abundance, and body size within the ANP.
To examine if elephant abundance was associated with dung beetle assemblage composition, we used non-metric multidimensional scaling (NMDS) based on the Bray-Curtis distance metric to characterise species composition. NMDS is an unconstrained ordination method used for exploratory analyses of the relationships between species occurrences and environmental variables (Legendre and Legendre Reference Legendre and Legendre2012). NMDS places sites in ordination space in such a way that ordination distances correspond to differences in similarity (sites placed closer together) or dissimilarity (sites placed further apart) in species composition (Lee-Yaw et al. Reference Lee-Yaw, L. McCune, Pironon and N. Sheth2022). Ordination analysis was conducted in the package ‘vegan’ and implemented in version 3.1.1 of R (Development Core Team, 2021). To verify statistical differences between groups formed by the NMDS, an analysis of similarity (ANOSIM) was performed.
Indicator species analysis
To identify which dung beetle species were associated with elephant presence, we used indicator species analyses using the Multinomial Species Classification Method, CLAM (Chazdon et al. Reference Chazdon, Chao, Colwell, Lin, Norden, Letcher, Clark, Finegan and Arroyo2011). Specifically, the method was applied to identify any dung beetle species closely associated with elephant presence at high density (EP) versus elephant absent (EA) sites. CLAM is a multinomial model that uses pooled species abundance data from two distinct groups to classify species into four categories: (1) ‘Group A specialist’; (2) ‘Group B specialist’; (3) ‘Generalist’, and (4) ‘Too rare to classify’. Species are considered specialists if ≥ 66% of their occurrences are within a specified group. The analysis was conducted using the function ‘clamtest’ located in the vegan package in R. An important parameter of the multinomial model is K, which refers to the threshold for classifying species according to their indicator preference. We used a super-majority specialisation threshold of K = 0.667, and p = 0.05 to classify which species were specialists or generalists in areas with and without the presence of elephants. The alpha value was set at p = 0.05, which is the probability suggested when the aim is to classify individual species instead of all species.
Results
Dung beetles
We collected 8020 individual dung beetles from 34 different species (Supp. Table 1). The number of dung beetle species per transect varied between nine and twenty-nine species and ranged in abundance between 149 and 1511 individuals. Mean body length ranged between 2.72 ± 1.14 mm to 18.2 ± 3.17 mm (Supp. Table 2).
Mammal data
We recorded 2592 mammal occurrences from 26 species. Species richness among the eleven sites ranged from three to 26 species. Total species richness included five carnivores including leopard [Panthera pardus (Linnaeus, 1758)], serval [Leptailurus serval (Schreber, 1776)], and spotted gennet [Genetta maculata, (Gray, 1830)] ranging from 1–4 per site, 14 omnivores such as olive baboon [Papio anubis, (Lesson, 1827)], slender mongoose [Galerella sanguinea, (Rüppell, 1835)], and Zorilla (Ictonyx striatus, (Perry, 1810) (0–13 per site), and eleven herbivores including African elephant (L. africana), black rhino (Diceros bicornis), Harvey’s duiker [Cephalophus harveyi, (Thomas, 1893)], and suni (Neotragus moschatus, (Von Dueben, 1846)], (1–11 per site) (Supp. Figure 1). Occurrences varied from 19 individuals observed in high-elevation Ericaceous grassland habitat to 903 individuals in lower elevation Bushland thickets.
Variation partitioning
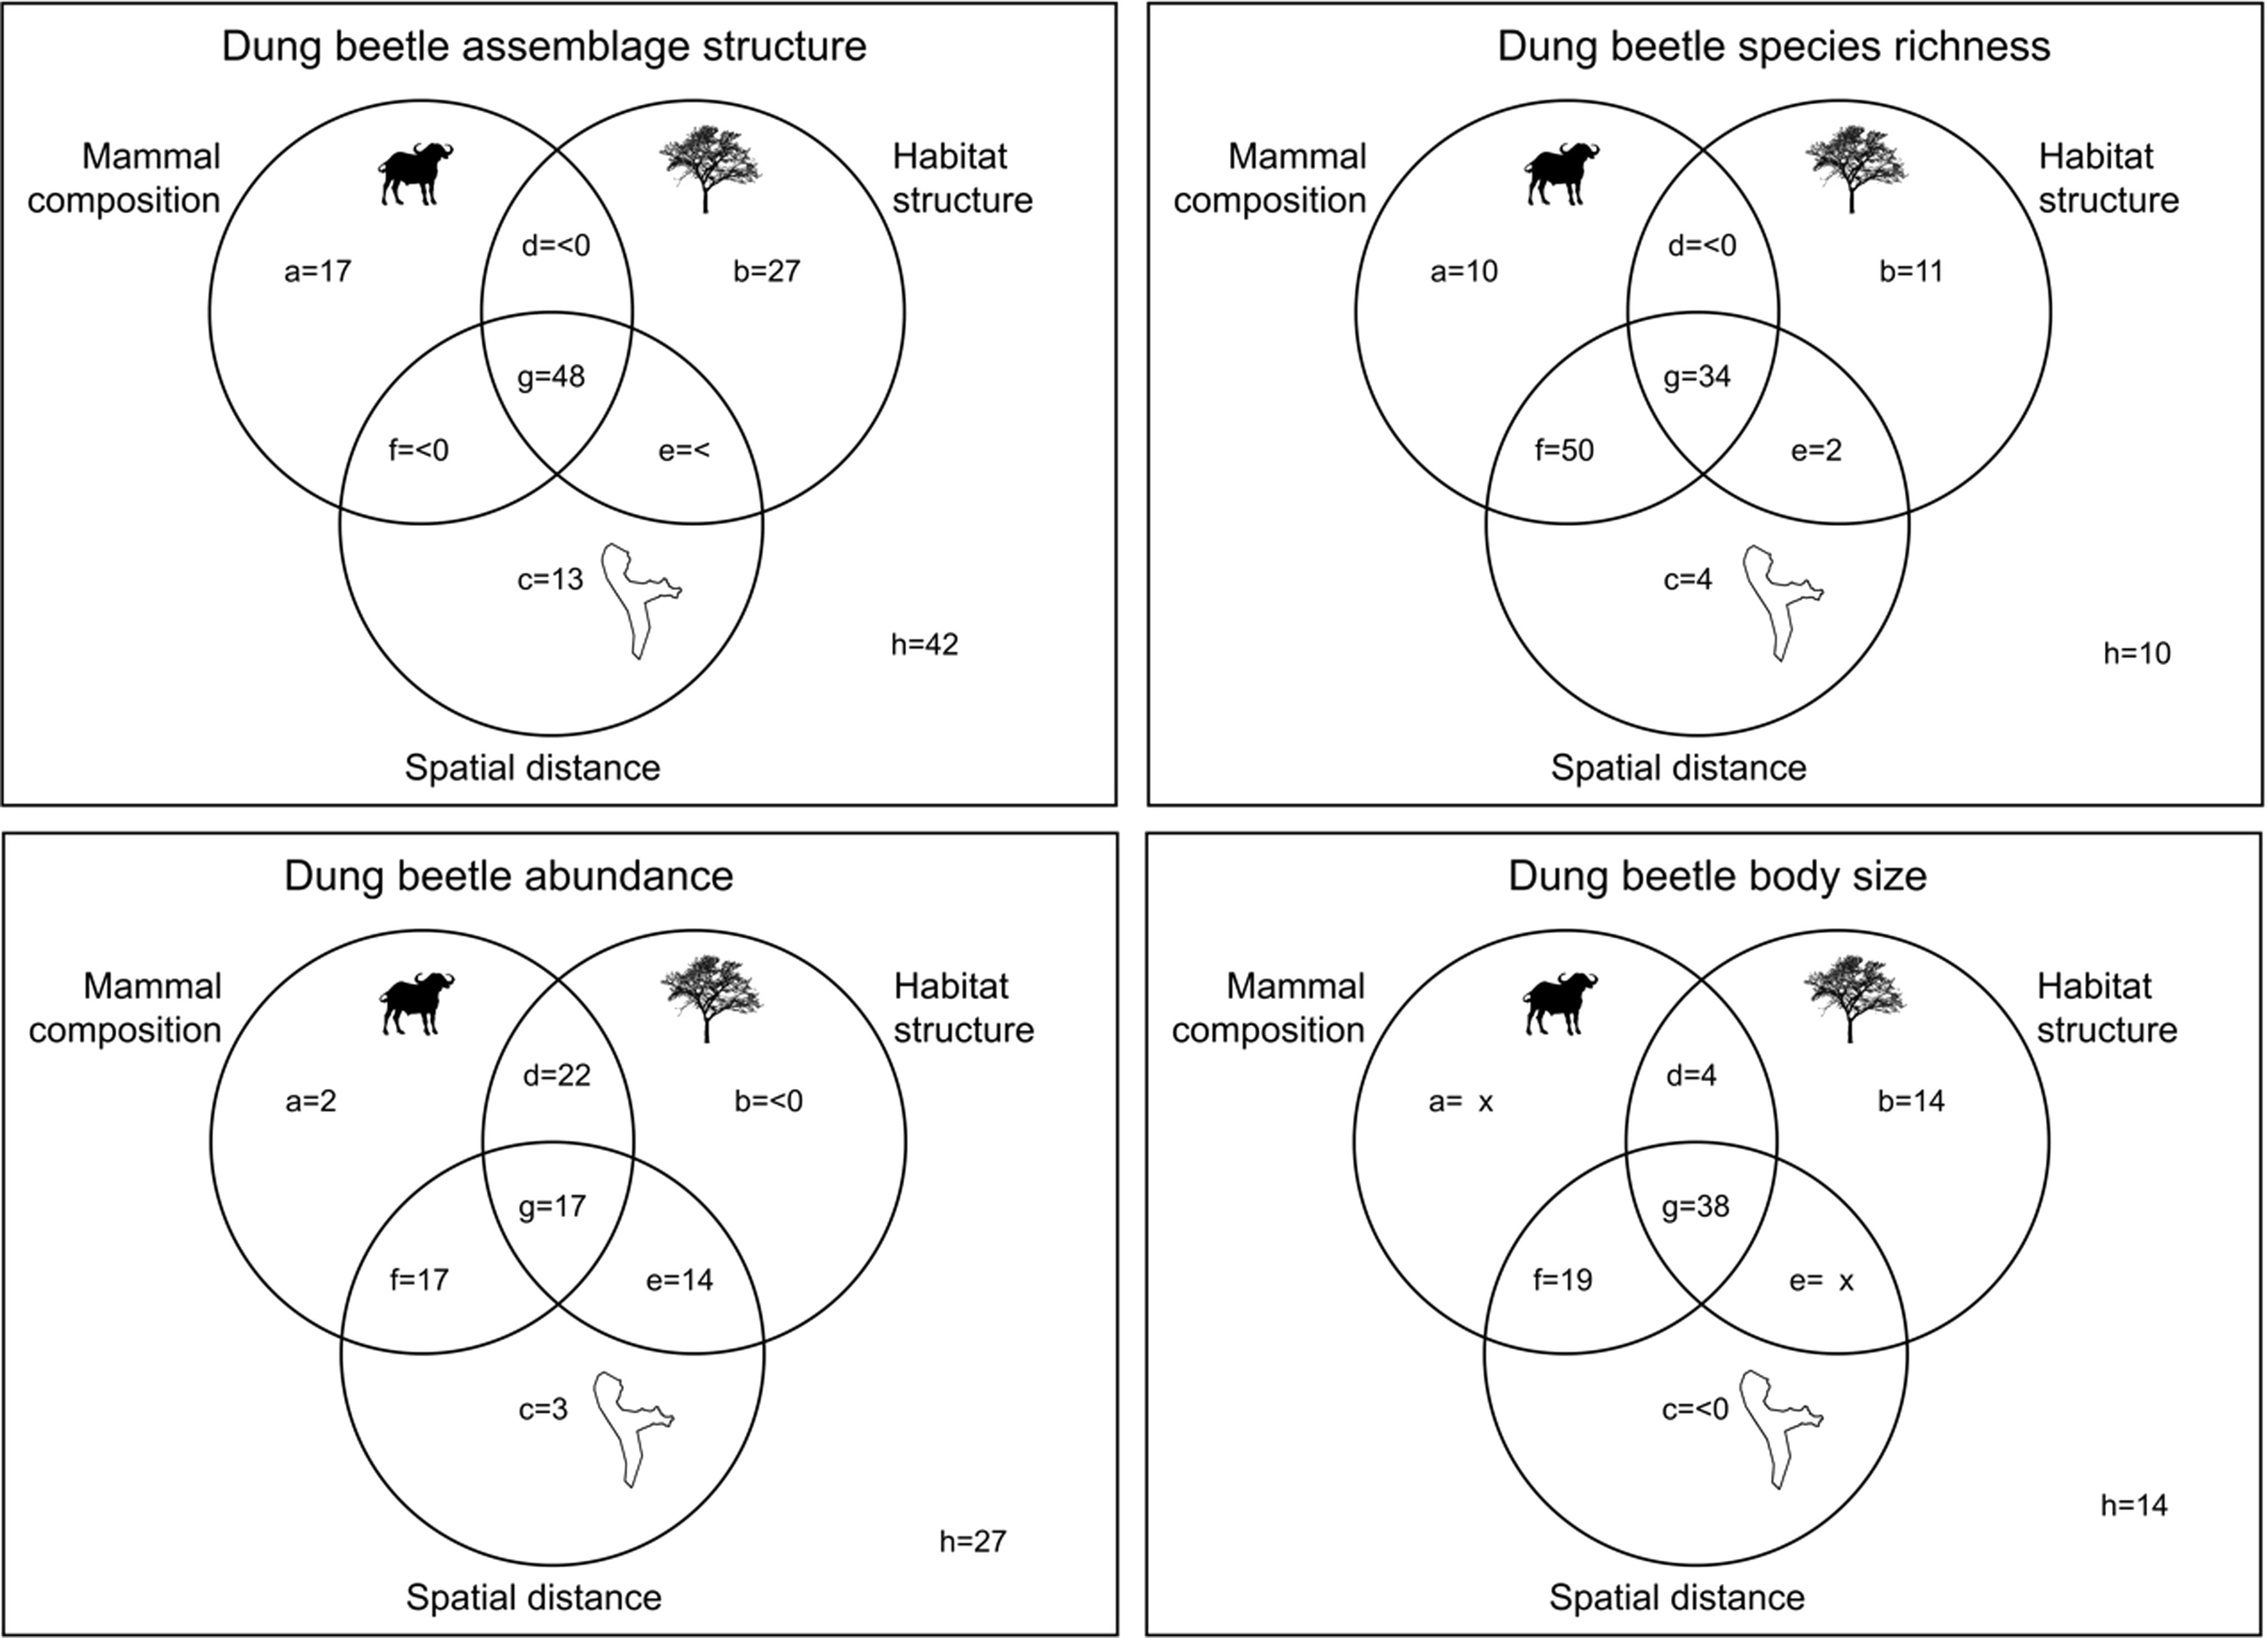
Tree density and percentage of ground cover and spatial vectors derived from PCNMs were the significant predictors of habitat and spatial variables (Supp. Table 3), and abundance of herbivores and overall mammal abundance were the significant predictors of mammal assemblage attributes (Supp. Table 4). Variation partitioning using these significant predictors indicated that 17% of the variation in dung beetle richness and abundance was explained by overall mammal abundance and herbivore abundance whereas less than 1 per cent was explained by the variation in these attributes and habitat structure combined (Figure 2). Habitat structure and mammal abundance explained 22% of dung beetle abundance but less than 1% of dung beetle species richness. Spatial distance between sites explained 13% of the assemblage composition (richness and abundance combined), 4% of dung beetle species richness, and 3% of abundance. Half of the variation in dung beetle species richness was explained by mammal composition and spatial distance. Mammals explained 15% of the variation in dung beetle body size, whereas spatial distance explained less than 1%, and both mammals and habitat complexity explained 19%.
Variation partitioning for eleven sites within Aberdare National Park. Dung beetle assemblage structure, species richness, abundance, and average body size were analysed in relation to the percentage explained by biotic and abiotic predictors. (a) mammals; (b) habitat structure; (c) spatial distance; (d) mammals and habitat complexity; (e) habitat complexity and spatial distance; (f) mammals and habitat complexity; (g) all factors; (h) residuals.
Does elephant abundance affect Afromontane dung beetle assemblages?
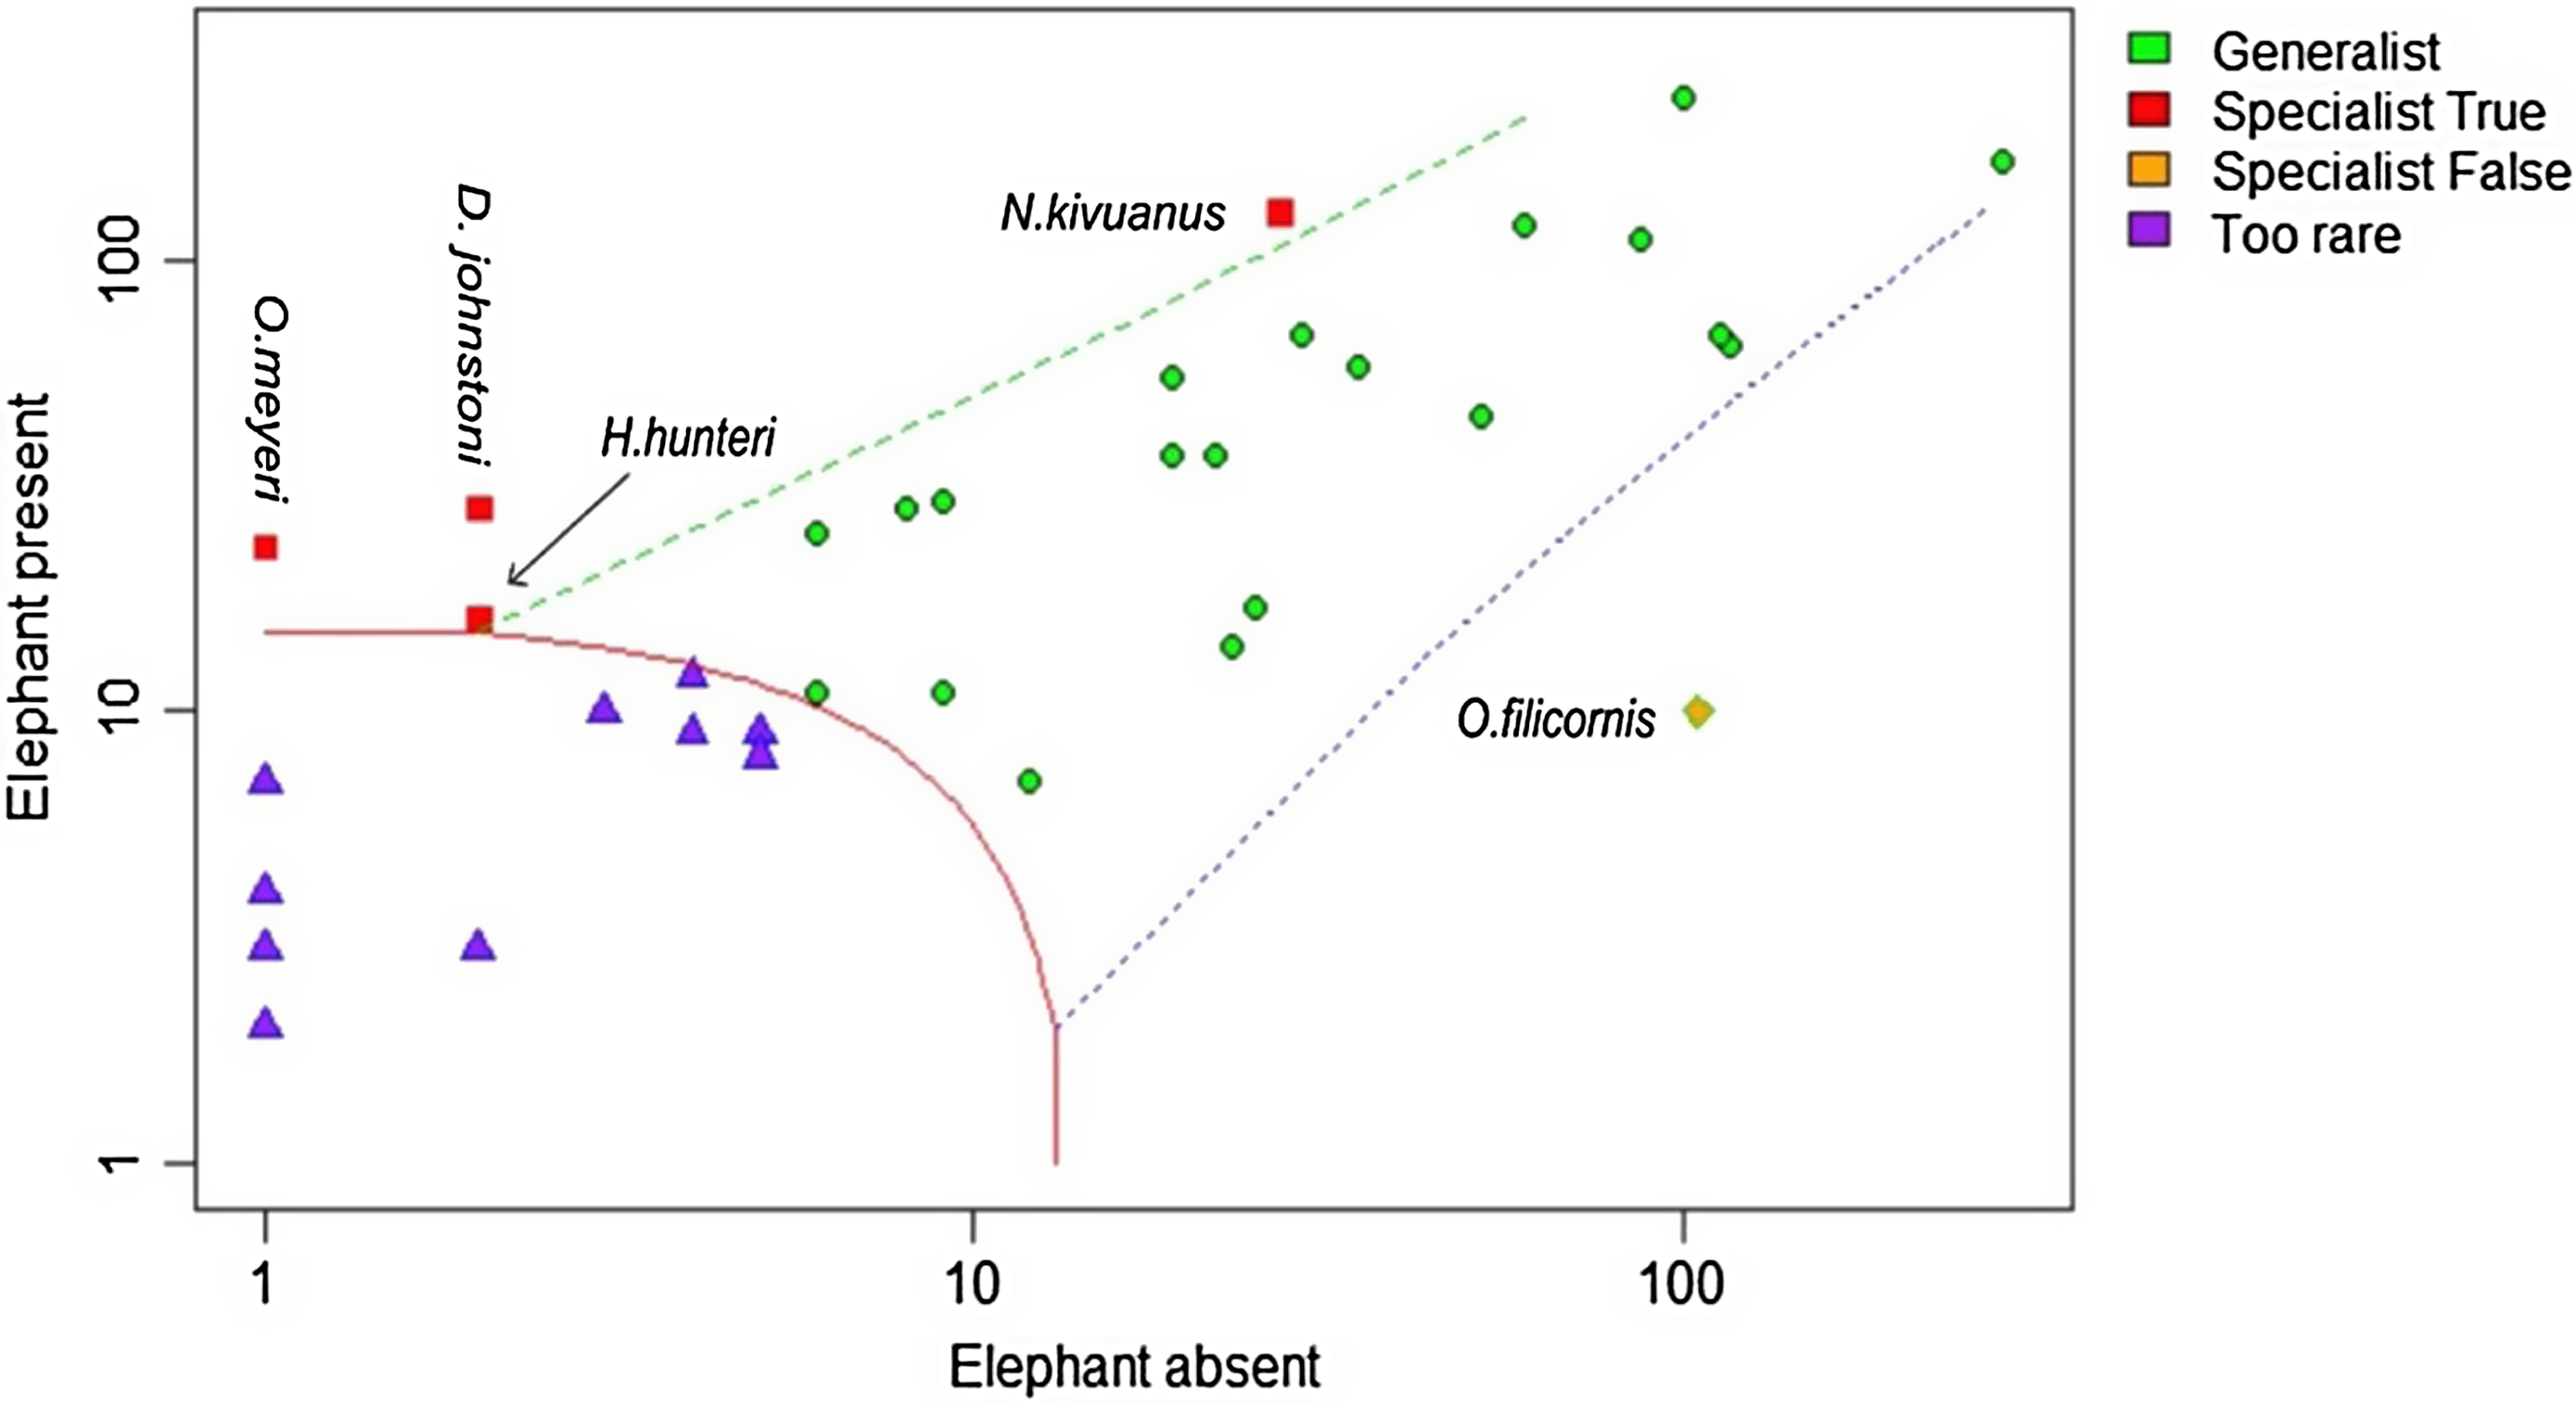
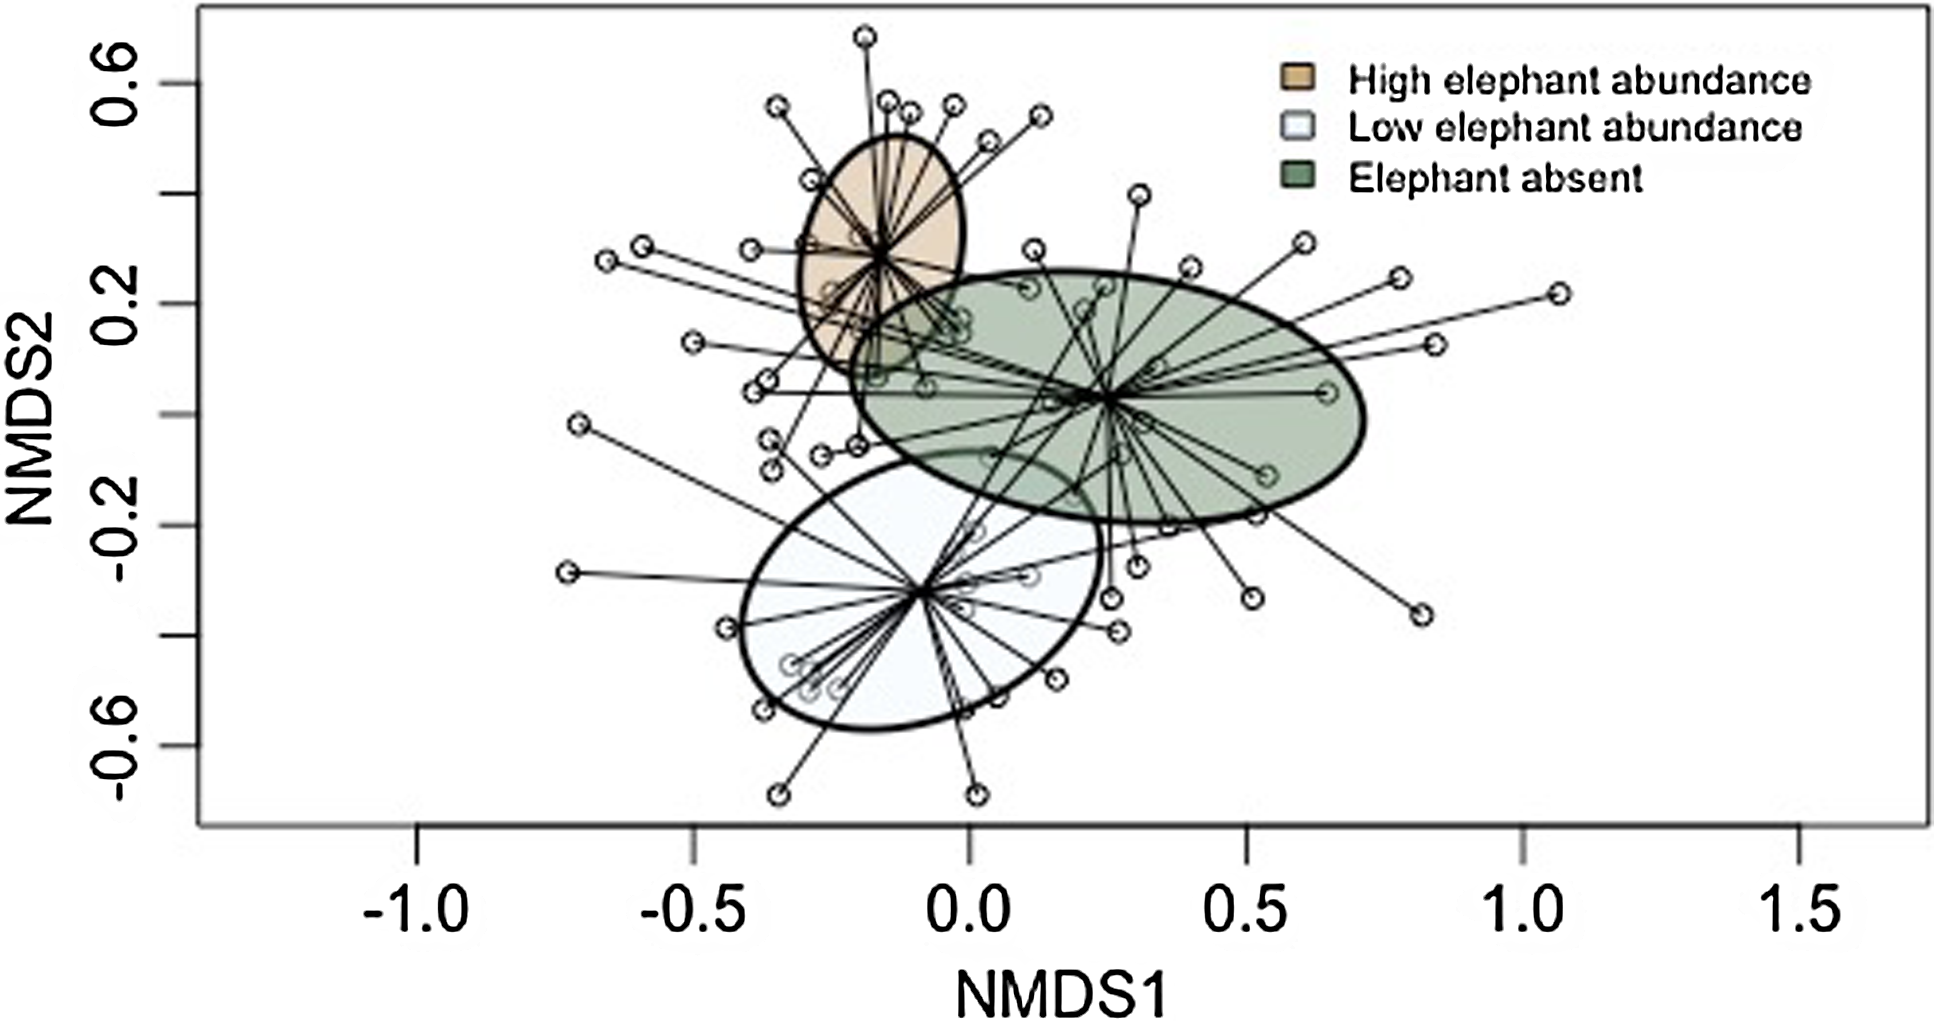
A total of 1435 (34 species) of dung beetles were observed in the elephant present (EP) sites compared with 1165 (30 species) in the EA site; 20 out of 34 (58%) of species were shared between the two sites. Four species, [Neocolobopterus kivuanus (Endrödi, 1956)], [Onitis meyeri (Kolbe, 1891)], [Diastellopalpus johnstoni (Waterhouse, 1885)], and [Heliocopris hunteri (Waterhouse, 1891)], were classified as specific to the sites where elephants were present (Figure 3). Twelve species (35%) were too rare to classify as they did not meet the minimum abundance requirements for CLAM analysis. NMDS analysis revealed clear differences in dung beetle assemblage composition (both richness and abundance) between the three sample sites (Figure 4). Stress was low (0.19) indicating a high degree of fit. The distribution pattern of species composition was different for each sample site (ANOSIM R = 0.38, p<0.01), revealing a high turnover of species between areas. Twenty-five species were classified as generalists and demonstrated no preference for elephant presence or absence, and a single species [Onthophagus filicornis (Harold, 1873)] was considered as a habitat specialist in areas where elephants were absent.
The classification of dung beetle generalists and specialists found where there is high elephant density and where elephant are absent based on Multinomial Species Classification Method (CLAM) analysis. The x and y axes represent the log abundance of dung beetle species in the elephant present and absent samples respectively.
Non-metric multidimensional scaling (NMDS) ordination (stress = 0.19) using the Bray-Curtis distance metric based on dung beetle assemblage composition for the sites with high, low and absent elephant occurrence. Ellipses represent 95% Confidence Interval around the centroid and depict groupings. Circles are the ordinated data points representing individual species and are linked to the centroid of each respective site.
Discussion
Our findings demonstrate that for Afromontane dung beetle species at high elevation, habitat structure is more important than mammal composition in shaping dung beetle assemblages, while species richness is driven by the interactive effect between the spatial distance between sites and mammal composition. Furthermore, we found that mammal composition had a smaller than expected effect on Afromontane dung beetle communities when compared to results from similar studies in the Neotropics (Culot et al. Reference Culot, Bovy, Zagury Vaz-de-Mello, Guevara and Galetti2013). Large mammals are undergoing a heightened risk of extinction that has been brought about by human-associated activities such as poaching, illegal logging, climate change, and habitat fragmentation (Fa and Brown Reference Fa and Brown2009). Large mammals in Africa have lost 59% of their populations in the past 40 years including from within Protected Areas (Craigie et al. Reference Craigie, Baillie, Balmford, Carbone, Collen, Green and Hutton2010) and they often singularly represent the apex predator or largest herbivore in an ecosystem a role that is often crucial in structuring communities in ecosystems, which, in many cases, may lack an alternate functional equivalent (Brocardo et al. Reference Brocardo, Zipparro, de Lima, Guevara and Galetti2013; Jorge et al. Reference Jorge, Galetti, Ribeiro and Ferraz2013; Young et al. Reference Young, Mccauley, Dirzo and Goheen2015). Therefore, large mammal extirpation or extinction can cause dramatic changes that induce cascading ‘top down’ effects that drive alterations at multiple trophic levels (Eklöf and Ebenman Reference Eklöf and Ebenman2006).
Elephant abundance and dung beetle assemblage structure
The results of this study also emphasise the role of large herbivores such as elephants, whose occurrence, even at low densities, has the capacity to shape the structure of dung beetle assemblages. One limitation of using elephant presence and absence data from a small sample size is the lack of replication between sites, and there are several other factors which may have also influenced the dung beetle assemblage composition such as other soil types (Daniel et al. Reference Daniel, Noriega, da Silva, Deschodt, Sole, Scholtz and Davis2021) and the presence or absence of other mammal species. Nevertheless, we found elephant presence had a strong effect on the assemblage composition of dung beetles (Figure 4). Overall, dung beetles were more abundant where elephants were present compared with when elephants were absent. Four dung beetles were indicated as specialists in the site where elephants were in high abundance (Figure 3). Three of the four dung beetle species (Onitis meyeri, Diastellopalpus johnstoni, and Heliocopris hunteri) are large paracoprids (32 – 48 mm in length), which are capable of constructing nests up to 1 m below the earth surface (Klemperer and Boulton Reference Klemperer and Boulton1976). Onitis meyeri is categorised as ‘data deficient’ by the International Union for Conservation of Nature (IUCN) and is described as having a disjunct and restricted distribution limited to the ANP and Mt Kilimanjaro in Tanzania (Davis Reference Davis2013). The assessment also noted ‘some category of extinction risk would be justified’ if data including ‘dung type… and specialisations’ become available. Our data indicate that O. meyeri is an African elephant dung specialist and therefore will be only present in sufficient numbers within East African high-altitude areas where sufficient elephant dung resources remain available. Currently, those areas are limited to four forested locations that have an elevation greater than 2000 m asl and are within the range for elephant as defined by the IUCN; Mount Meru National Park, Tanzania; Mount Elgon National Park, Uganda; the ANP and Mount Kenya NP, Republic of Kenya, and Mt Kilimanjaro National Park, Tanzania. Diastellopalpus johnstonii has a distribution which is centred in high-altitude Afromontane vegetation with records from upland locations in both east (Kenya, Tanzania, Rwanda, Burundi), and west Africa (Cameroon, Republic Democratic Congo) (Davis and Scholtz Reference Davis and Scholtz2020). Its dung preferences are unknown but most other species belonging to the genus are specialists of elephant dung. In the case of large-bodied tunnellers, particularly Heliocopris dung beetle species, the majority of whom rely on elephant dung for breeding (Hanski and Cambefort Reference Hanski and Cambefort1991), the quantity of dung resources required is very large (Gregory et al. Reference Gregory, Gómez, Oliveira and Nichols2015; Kingston and Coe Reference Kingston and Coe1977; Pokorný et al. Reference Pokorný, Zidek and Werner2009; Stanbrook Reference Stanbrook2020). Heliocopris dung beetles belong to a genus which had a much larger historic distribution compared to current records. For example, there are recent records for Heliocopris dung beetles in Borneo and Sumatra where remnant populations of elephant still exist, but only fossil evidence of the genus occurs in Japan and South America both regions where megafauna most likely went extinct in the Pleistocene (Davis et al. Reference Davis, Scholtz and Philips2002).
Biotic and abiotic drivers of Afromontane dung beetle assemblages
In forests, the biological processes that maintain ecosystem functioning (such as nutrient recycling, pollination, and secondary seed dispersal) are largely driven by insects (Wagner et al. Reference Wagner, Grames, Forister, Berenbaum and Stopak2021). The effects of species loss on the functioning of ecosystems have only recently begun to be widely discussed in the context of functional trait loss e.g., Hillebrand et al. (Reference Hillebrand, Blasius, Borer, Chase, Downing, Eriksson, Filstrup, Harpole, Hodapp, Larsen, Lewandowska, Seabloom, Van de Waal and Ryabov2017), and to date, the effects of functional trait loss in populations have been explored in dung beetle ecology mostly in the context of body size, dung burial, and seed dispersal capability (Nervo et al. Reference Nervo, Tocco, Caprio, Palestrini and Rolando2014; Piccini et al. Reference Piccini, Caprio, Palestrini and Rolando2020; Slade et al. Reference Slade, Mann and Lewis2011). Forest fragmentation-induced changes in abundance and species richness have been shown in many insect groups, and the modification, fragmentation, and loss of tropical forest habitat are known to lead to high local extinction rates across forest-restricted dung beetle communities (Nichols et al. Reference Nichols, Larsen, Spector, Davis, Escobar, Favila and Vulinec2007; Noriega et al. Reference Noriega, Santos, Calatayud, Chozas and Hortal2021b).
An abundance of interconnected high-quality habitat is essential for the maintenance of functioning ecosystems and the preservation of the mammals contained within them. Habitat quality directly affects mammal composition and abundance (Burkepile et al. Reference Burkepile, Burns, Tambling, Amendola, Buis, Govender, Nelson, Thompson, Zinn and Smith2013; Di Marco et al. Reference Di Marco, Buchanan, Szantoi, Holmgren, Grottolo Marasini, Gross, Tranquilli, Boitani and Rondinini2014) in addition to dung beetle assemblage structure (Campos and Hernández Reference Campos and Hernández2013; França et al. Reference França, Frazão, Korasaki, Louzada and Barlow2017; Nichols et al. Reference Nichols, Uriarte, Peres, Louzada, Braga, Schiffler, Endo and Spector2013). Synthesis of species’ distribution across elevational gradients has shown that it is difficult to attribute diversity to any one ecological variable (Brown Reference Brown2001; Gebert et al. Reference Gebert, Njovu, Treydte, Steffan-Dewenter and Peters2019, Reference Gebert, Steffan-Dewenter, Kronbach and Peters2022). However, a few environmental variables such as decreasing environmental temperature, atmospheric pressure, and biologically relevant gases are closely associated with elevation of all mountains (Lomolino Reference Lomolino2001). Body size is an important morphological and functional trait of species (deCastro-Arrazola et al. Reference deCastro-Arrazola, Andrew, Berg, Curtsdotter, Lumaret, Menéndez, Moretti, Nervo, Nichols, Sánchez-Piñero, Santos, Sheldon, Slade and Hortal2023; Nervo et al. Reference Nervo, Tocco, Caprio, Palestrini and Rolando2014) as the variation in an organisms’ body size can have pivotal consequences for the relationship between biodiversity and ecosystem functioning (Dangles et al. Reference Dangles, Carpio and Woodward2012; Noriega et al. Reference Noriega, Hortal, deCastro-Arrazola, Alves-Martins, Ortega, Bini, Andrew, Arellano, Beynon, Davis, Favila, Floate, Horgan, Menéndez, Milotic, Nervo, Palestrini, Rolando, Scholtz, Senyüz, Wassmer, Ádam, Araújo, Barragan-Ramírez, Boros, Camero-Rubio, Cruz, Cuesta, Damborsky, Deschodt, Rajan, D’hondt, Díaz Rojas, Dindar, Escobar, Espinoza, Ferrer-Paris, Gutiérrez Rojas, Hemmings, Hernández, Hill, Hoffmann, Jay-Robert, Lewis, Lewis, Lozano, Marín-Armijos, De Farias, Murcia-Ordoñez, Karimbumkara, Navarrete-Heredia, Ortega-Echeverría, Pablo-Cea, Perrin, Pessoa, Radhakrishnan, Rahimi, Raimundo, Ramos, Rebolledo, Roggero, Sánchez-Mercado, Somay, Stadler, Tahmasebi, Triana Céspedes and Santos2023). There are numerous reasons for this; (1) an individual’s role reflects its weight-dependent metabolic requirements, so size can be a useful proxy of the impact of a given species (or assemblage) on ecosystem functioning (Reiss et al. Reference Reiss, Bridle, Montoya and Woodward2009); (2) species with similar body sizes should overlap in niche use (Kleynhans et al. Reference Kleynhans, Jolles, Bos and Olff2011); and (3) large species (Cardillo et al. Reference Cardillo, Mace, Jones, Bielby, Bininda-Emonds, Sechrest, Orme and Purvis2005) are particularly vulnerable to many types of environmental alteration; including climate change (Kleynhans et al. Reference Kleynhans, Jolles, Bos and Olff2011), habitat fragmentation (Crooks et al. Reference Crooks, Burdett, Theobald, King, Di Marco, Rondinini and Boitani2017), land use changes (Karanth et al. Reference Karanth, Nichols, Karanth, Hines and Christensen2010; Kiffner et al. Reference Kiffner, Wenner, Laviolet, Yeh and Kioko2015), or exploitation (Fa and Brown Reference Fa and Brown2009b; Scholte 2011).
The physical structure of habitats can be an important determining factor in the composition and distribution of dung beetle assemblages (Davis and Sutton Reference Davis and Sutton1998) with a complete species turnover observed across a natural ecotone spanning as little as 100 m (Spector and Ayzama Reference Spector and Ayzama2003). Our results align with those of Halffter and Arellano (Reference Halffter and Arellano2002) who asserted that it is vegetation cover rather than dung supply that is more important for determining the structure and diversity of a forested dung beetle communities. In Neotropical dung beetle populations, the structure and integrity of forested habitats have been found to be the most important factor in dung beetle species richness (Batilani-Filho and Hernandez Reference Batilani-Filho and Hernandez2017; Campos and Hernández Reference Campos and Hernández2013; Carpio et al. Reference Carpio, Donoso, Ramón and Dangles2009; Gardner et al. Reference Gardner, Hernández, Barlow and Peres2008; Lopes et al. Reference Lopes, Korasaki, Catelli, Marçal and Nunes2011) as the structural loss of biomass and reductions in canopy cover negatively affects forest-dependent species (França et al. Reference França, Frazão, Korasaki, Louzada and Barlow2017; Slade et al. Reference Slade, Mann and Lewis2011). Illegal logging is one of many factors that drives forest degradation and defaunation in many Afrotropical forests (Poulsen et al. Reference Poulsen, Rosin, Meier, Mills, Nuñez, Koerner, Blanchard, Callejas, Moore and Sowers2018) and is responsible for the loss of large-bodied dung beetle species (Edwards et al. Reference Edwards, Edwards, Sloan and Hamer2014). Functional loss has already been demonstrated to lead to lower dung removal and seed dispersal rates in Neotropical forests (Braga et al. Reference Braga, Korasaki, Andresen and Louzada2013; Noriega et al. 2021; Santos-Heredia et al., Reference Santos-Heredia, Andresen and Zrate2010) but the effects on Afrotropical forests remain largely less well understood. Historically, the ANP has suffered from illegal logging and from livestock incursion (Schmitt Reference Schmitt and Goldammer1992). However, since the recent completion of the electric fence, which surrounds the park, only a small fraction of illegal timber extraction now occurs (Butynski Reference Butynski1999; Lambrechts et al. Reference Lambrechts, Woodley, Church and Gachanja2003; Mungai et al. Reference Mungai, Thuita and Alfred2011). It is predicted that areas in which Afromontane Forest currently occurs in Kenya are set to decline due to expansion and intensification of agriculture and deforestation (Eckert et al. Reference Eckert, Kiteme, Njuguna and Zaehringer2017). Heavily modified habitats with little or no tree canopy cover have been shown to support species-poor dung beetle communities with high species turnover, dramatically reduced abundance and smaller body size compared to species found in intact forest types (Lumaret et al. Reference Lumaret, Kadiri and Martínez-M2020; Nichols et al. Reference Nichols, Larsen, Spector, Davis, Escobar, Favila and Vulinec2007).
Nichols et al. (Reference Nichols, Uriarte, Peres, Louzada, Braga, Schiffler, Endo and Spector2013) report that they found no consistent pattern of association between beetle nesting strategy (tunnellers, rollers or dwellers), responses to human presence, or mammal abundance. However, the same study suggests that Neotropical small-bodied beetle species are disproportionately more sensitive to human presence in upland forests; this is supported by (Culot et al. Reference Culot, Bovy, Zagury Vaz-de-Mello, Guevara and Galetti2013) who also reported that negative relationships between mammal abundance and dung beetle species richness were stronger for smaller-bodied beetles in Brazilian Atlantic rainforest. Our results are one of the first to outline the possible effects of mammal decline on Afrotropical montane dung beetles and strongly support the importance of having an abundant and species-rich mammal fauna to provide abundant and diverse dung types. Our results indicate that mammal abundance and the number of herbivores present at each sample site accounted for 15% of the variation in dung beetle body size, compared to the results of a similar study undertaken by Bogoni et al. (Reference Bogoni, Graipel, de Castilho, Fantacini, Kuhnen, Luiz, Maccarini, Marcon, de Souza Pimentel Teixeira, Tortato, Vaz-de-Mello and Hernández2016) who found that mammals explained 26% of the variation in dung beetle body size in Atlantic Forest. The difference in variation may be attributable to the higher level of resource specialisation found in African dung beetles (Holter Reference Holter2016; Tshikae et al. Reference Tshikae, Davis and Scholtz2008) relative to those from the Neotropics (Bogoni et al. Reference Bogoni, Hernandez and Preisser2014) with a greater proportion relying on large mammal dung, which is absent from Neotropical forests. This study also described four species of dung beetle that could be considered specialists of elephant dung as they were more abundant in areas with greater elephant presence. Three of the four dung species (O.meyeri, D. johnstoni, H. hunteri) exhibit congruent traits; they are all large-bodied (>30 mm in length), tunnelling dung beetles, and are thought to be nocturnal.
This study is one of very few studies to have assessed the biotic drivers of dung beetle communities in Africa and is one of just three known studies originating from the forested ecosystems found on the continent. Currently, dung beetles in the ANP appear to be abundant but fragile as they depend on a high tree density and a species-rich mammalian fauna, plus the synergy between these parameters acting in concert to ensure continuing dung beetle persistence. Functionally rich dung beetle populations will only continue to persist in upland protected areas in Africa if they contain a mixture of suitable habitat types complete with an abundant and species-rich mammalian fauna. We highlight the importance of protecting suitable forest habitat and a species-rich and abundant mammal community to preserve healthy, speciose, and functionally viable future dung beetle populations.
Supplementary material
The supplementary material for this article can be found at https://doi.org/10.1017/S0266467425000100
Data availability statement
The authors confirm that the data supporting the findings of this study are available within the article and/or its supplementary materials.
Acknowledgements
Data were collected with the authorisation of the Kenya Wildlife Service, and we are grateful for the help and protection they provided during our time in the Aberdare National Park. We also thank Laban Njoroge at the National Museums Kenya for the use of their facilities for storage and identification. This research received no specific grant from any funding agency, or commercial or not-for-profit sectors.
Author contributions
Conceptualisation: RS, PW; Analysis: RS; Investigation: RS, MJ, PW; Writing: RS, MJ, PW Supervision: MJ, PW; Project Administration: RS; Revision: all authors.
Competing interests
None.
Ethical standards
All of the work conducted in this article adhered to the standards outlined by the Kenyan National Commission for Science, Technology & Innovation under Research Permit Number NACOSTI/P/15/0573/3206.


 Open access