

Racial and ethnic minorities continue to make important and often hard-fought advances as candidates in legislative elections in the United States. However, despite more minority candidates competing for seats in all levels of government, minority officeholders are still relatively rare in U. S. legislatures, particularly in white-majority districts. The standard explanations for low levels of minority representation are generally based on the observations of officeholders after an election, and on the survey research that finds many white voters are prejudiced against racial and ethnic candidates in a single election (Andersen and Junn Reference Andersen and Junn2010; Schaffner Reference Schaffner2011; Tesler Reference Tesler2013; Washington Reference Washington2006). On the basis of this research, scholars conclude that minority candidates remain uniquely disadvantaged in the vast majority of jurisdictions where minority voters are not a sizable part of the electorate.
The empirical relationship between race and representation, however, is complicated by partisanship. Most voters in the United States have strong partisan preferences and rely on these to select candidates (Bartels Reference Bartels2000; Campbell Reference Campbell1980), but it is less clear what voters do when faced with a “decision conflict” between candidate race and co-partisanship (Krupnikov and Piston Reference Krupnikov and Piston2015). Current scholarship is indeterminate as to how race and partisanship combine to affect support for minority candidates. One line of research asserts that racial prejudice can overshadow partisan preferences for some voters. For example, a number of scholars examine prejudice and voting behaviors among white Democrats and independents choosing between Obama and McCain in 2008. Piston (Reference Piston2010) finds that white voters are statistically more likely to negatively evaluate Obama compared with other white Democrats. Similarly, Lewis-Beck, Tien, and Nadeau (Reference Lewis-Beck, Tien and Nadeau2010) argue that Obama was denied a “landslide” victory because of racial resentment. Their analyses of 2008 survey data indicate a 5% decline in support for Obama based on his race, even after controlling for ideology. These findings are confirmed by recent research by Jackman and Vavreck (Reference Jackman and Vavreck2011) and Kam and Kinder (Reference Kam and Kinder2012).
In contrast, other findings suggest that co-partisanship trumps racial prejudice. For example, some of the same research that presents evidence of prejudiced voting in Obama's election in 2008 also finds that the overwhelming majority of bigoted Democratic and independent voters relied on their partisan and ideological preferences to override their racial prejudices and vote for Obama (Kam and Kinder Reference Kam and Kinder2012; Piston Reference Piston2010). Further, many researchers who examine more than a single election, fail to find evidence of racial voting against minority candidates. Citrin, Green, and Sears (Reference Citrin, Green and Sears1990), Highton (Reference Highton2004), and Voss and Lublin (Reference Voss and Lublin2001) examine the survey data and election results from the state-level and Congressional elections and find no effects of racial voting in races involving black candidates. Instead, racial voting is directed at both black and white Democratic candidates. Experimental evidence from a variety of settings corroborates this conclusion that candidate co-partisanship can override racial voting (Kam Reference Kam2007; Reeves Reference Reeves1997; Sigelman et al. Reference Sigelman, Sigelman, Walkosz and Nitz1995).
Together, these previous studies lead us to argue that white racial prejudice, on its own, cannot explain the puzzle of minority under-representation. Building on recent scholarship on the role of elite-level factors—candidate party identification and incumbency—on minority representation (Juenke Reference Juenke2014; Shah Reference Shah2014), we develop hypotheses about minority candidate success in white districts that clarify some of the unsettled aspects of the minority representation puzzle. Instead of asking “Did a minority candidate win the election?” we ask “Are minority Democrats and minority Republicans performing as well as their white co-partisans in white districts?” As we demonstrate below, the answer is yes.
By shifting the focus of under-representation to minority partisan candidates in white districts, we contribute to a growing literature that is generally more optimistic about the future of minority representation in the United States, compared with research that is focused on white voter bias in isolation. In particular, we make a number of substantial contributions to the minority representation scholarship. First, we investigate three theoretical viewpoints of white voter bias, and develop a corresponding election returns model to test the hypotheses derived from these causal stories. Complementing other analyses that rely on survey or experimental data, we examine how voters in white districts respond to minority candidates, providing strong tests of competing hypotheses when minority candidates run for office. Second, as the majority of scholarship to date has centered on congressional elections, we model election results of more than 3,000 candidates in nearly 1,500 elections for State Legislative Office in 2012, the first elections following the 2010 redistricting processes in the states. Thus, we are able to gain significant leverage in understanding the relationship of party and race across a variety of contexts that seldom exist in Congressional elections. Further, this empirical leverage allows us to use a matching procedure to better compare minority Democrats with white Democrats running for office in the same types of electoral contexts. Finally, we examine the relationship between race and partisanship for both black and Latino candidates. Given the growth in the number of Latino and black candidates across the two major parties, our analysis provides a distinct assessment of how race and party effects differ across both racial and ethnic candidates.
DESCRIPTIVE REPRESENTATION IN WHITE DISTRICTS: UNCOVERING THE MECHANISM
Do voters in white districts systematically obstruct minority representation? Despite a great deal of public and scholarly attention, this question is largely unresolved (Davidson and Grofman Reference Davidson and Grofman1994; Lublin Reference Lublin2004; Parker Reference Parker1990). What we do know is that racial/ethnic descriptive representation in the United States is confined largely to majority–minority districts, and is a rarity in largely white districts. When scholars observe these racially correlated aggregate outcomes, they most often point to theories of white voter racial bias. Our starting point then is the theoretical foundation of white racial bias and its contribution to candidate choice.
Either implicitly or explicitly, all descriptive representation work relies on some version of the idea that many voters use racial and ethnic cues to influence their candidate choice. White racial bias in elections is understood in three different ways, each not necessarily exclusive of the others (Matsubayashi and Udea Reference Matsubayashi and Udea2011; but see Gomez and Wilson Reference Gomez and Wilson2006 and Neblo Reference Neblo2009 for one-dimensional explanations). The first process treats race as a shortcut or substitute cue for determining the candidate's partisanship, policy preferences, or ideology (Hajnal Reference Hajnal2007; McDermott Reference McDermott1997; Schaffner, Streb, and Wright Reference Schaffner, Streb and Wright2001). In many ways, this is “statistical-based discrimination” (Butler and Broockman Reference Butler and Broockman2011), where voters are using race or ethnicity to make inferences about politically relevant policy positions or co-partisanship (Conover and Feldman Reference Conover and Feldman1989). Because black and Latino candidates run as Democrats most of the time and are more likely to favor liberal policies in general, voters use racial and ethnic bias to fill in politically relevant gaps. For example, McDermott (Reference McDermott1998) uncovers experimental evidence in non-partisan races that voters stereotype blacks as more liberal and more concerned about minority rights, leading them to assume that black candidates will pursue more liberal policies in office. Thus, the preference of some white voters for white candidates might be driven in part by conservative policy preferences.
Similarly, Citrin, Green, and Sears (Reference Citrin, Green and Sears1990) and Graves and Lee (Reference Graves and Lee2000) argue that the relationship between race/ethnicity and voting is indirect: race or ethnicity influences partisanship (non-white candidates are more likely to be Democrats/liberals), which in turn influences vote choice, but race or ethnicity does not directly influence voting. This perspective suggests that when voters have more information about the candidates, racial bias should disappear from the election results. If this is correct, then we should observe little to no effect from a candidate's race or ethnicity in more visible elections like Congressional or statewide races, in partisan elections, and in elections with an incumbent minority officeholder. If this substitute cues perspective is incorrect, then racial and ethnic differences should persist across minority and white co-partisans and incumbents. Empirically then, the success of Latino Democratic candidates should be compared with white Democrats, and black Democrats with white Democrats, and other minority candidates with their white partisan counterparts.
The second information-based explanation for racial bias is grounded in ideas of group dominance (Hajnal Reference Hajnal2007; Matsubayashi and Udea Reference Matsubayashi and Udea2011; Sidanius et al. Reference Sidanius, Pratto, Van Lar and Levin2004). Here, a candidate's race and ethnicity is used as a shortcut for determining the composition of the candidate's electoral coalition and which groups will gain power if the candidate wins the election (Hajnal Reference Hajnal2007). Thus, a Latino Democrat may be seen as less desirable for some white Democratic voters because (it is perceived that) Latino coalitions will make political gains at the expense of whites if the Latino is elected. These political gains are both general (policy-related) and intra-party, suggesting that the coalition that defines each party is shifting with the rise of racial and ethnic minority officeholders (Green, Palmquist, and Shickler Reference Green, Palmquist and Shickler2004). This perspective is generally tied to ideas of racial threat (Giles and Hertz Reference Giles and Hertz1994; Valentino, Hutchings, and White Reference Valentino, Hutchings and White2002), with the gains in minority political power, or threat of gains, being met with white voter backlash or bias against minority candidates (Hajnal Reference Hajnal2007).Footnote 1 This perspective suggests that the extent of white voter bias is conditional on the size of minority population, and should be greater in minority threat or influence districts (Cameron, Epstein, and O'Halloran Reference Cameron, Epstein and O'Halloran1996; Davidson Reference Davidson1989; Key Reference Key1984).
The third perspective is based on simple affective responses to minority candidates and is often tied to traditional racism in various forms. This view proposes that some whites will simply not vote for a minority candidate because they do not like them, they do not think they are qualified (regardless of information to the contrary), or they think the candidate is deficient in other dimensions (Knuckey and Orey Reference Knuckey and Orey2000). While this affective process is very difficult to observe directly in modern politics (precisely because it has no political or moral rationale behind it), and is the center of a number of measurement debates, it proposes the most straightforward hypothesis of the three perspectives (Kalmoe and Piston Reference Kalmoe and Piston2013; McConnaughy et al. Reference McConnaughy, White, Leal and Casellas2010; Terkildsen Reference Terkildsen1993). If this perspective is correct, then we should see significant and consistent bias against minority candidates from both parties, in all types of elections, particularly in areas with significant numbers of white voters. While partisan identification and incumbency might mitigate some of this bias, given the number of whites holding explicit negative or bigoted views of minorities (measured at approximately 40% of white voters (Jackman and Vavreck Reference Jackman and Vavreck2011; Piston Reference Piston2010)), we would expect to see some manifestation of this bias in a large number of election results.
REFRAMING DESCRIPTIVE REPRESENTATION
Relying on one or more of these narratives to explain representation outcomes, scholars who study aggregate election results tend to focus exclusively on voters, and particularly voters in white districts. We characterize this previous descriptive representation research by analytic frameworks. The first frame explicitly examines white voter bias by asking, via surveys, white voters about their candidate preferences. The conclusions from this research are decidedly varied. On the one hand, some studies present convincing evidence that white voters show no evidence of bias in elections with minority candidates. For example, Citrin, Green, and Sears (Reference Citrin, Green and Sears1990) use surveys to find that white voters in CA were averse to Democrats generally in the 1982 gubernatorial election, not just to the African-American candidate Tom Bradley. Similarly, Highton (Reference Highton2004) looks at exit polls of congressional races in the 1990s and finds no evidence that white voters opposed black candidates based on their race. More recent research, however, has called into question the generalizability of these earlier results. Piston (Reference Piston2010) and Kam and Kinder (Reference Kam and Kinder2012) produce survey evidence that indicates white voters with strong anti-black prejudice were significantly deterred from voting for Barack Obama (see also Jackman and Vavreck Reference Jackman and Vavreck2011; Lewis-Beck, Tien, and Nadeau Reference Lewis-Beck, Tien and Nadeau2010).
The second analytic frame focuses on experiments, presenting potential white voters with fictional candidates. Terkildsen (Reference Terkildsen1993) finds white voters were more likely to support a candidate identified as white, holding constant partisanship, ideology, and candidate quality. Moskowitz and Stroh (Reference Moskowitz and Stroh1994) come to similar conclusions. In contrast, Sigelman et al. (Reference Sigelman, Sigelman, Walkosz and Nitz1995) and Reeves (Reference Reeves1997) find the effect of candidate race to be minor. Kam (Reference Kam2007) observes that anti-minority bias disappears once partisan cues are introduced, and McConnaughy et al. (Reference McConnaughy, White, Leal and Casellas2010) find white bias against Latino candidates may be a substitute for policy beliefs or partisanship.
While the survey and experimental research described above greatly inform our understanding of descriptive representation, these methods are complemented by work that looks at large samples of actual election results. Survey-based research restricts our ability to incorporate a variety of electoral contexts that are overlooked when sampling from one or just a few elections. Additionally, while experimental research is critical to uncovering the causal mechanisms at the heart of white racial bias, it cannot on its own provide externally valid evidence for individual-level theories. As Jackman and Vavreck argue, “Election-level inferences...need election-level analyses” (Reference Jackman and Vavreck2011, 4). Thus, we focus on a third analytic frame, electoral outcomes, which is perhaps the longest-standing approach to studying descriptive representation (see e.g. Cameron, Epstein, and O'Halloran Reference Cameron, Epstein and O'Halloran1996; Canon Reference Canon1999; Engstrom and McDonald Reference Engstrom and McDonald1981; Epstein and O'Halloran Reference Epstein, O'Halloran, Epstein, Pildes, de la Garza and O'Halloran2006; Lublin Reference Lublin1997; Meier et al. Reference Meier, Juenke, Wrinkle and Polinard2005; Sass Reference Sass2000; Shah, Marschall, and Ruhil Reference Shah, Marschall and Ruhil2013). Focusing on how the demographic and institutional contexts influence when a minority candidate wins, the evidence from this work consistently finds that black and Latino officeholders are a rarity in white districts. Thus, a key mechanism by which minorities gain political representation is majority–minority districts (Cameron, Epstein, and O'Halloran Reference Cameron, Epstein and O'Halloran1996; Lublin et al. Reference Lublin, Brunell, Grofman and Handley2009).
Missing from each of these frameworks, however, is the role that is played by the candidate. Almost all of the previous descriptive representation research focus on the minority officeholder, and thus use the race or ethnicity of election winners as the dependent variable (Juenke Reference Juenke2014). However, more recent work using observations of election winners and losers has shown that minority candidates win and lose general elections as often as their white counterparts (Fraga Reference Fraga2014; Juenke Reference Juenke2014; Shah Reference Shah2014). This newer work demonstrates that demand-side explanations for minority representation are incomplete and require the additional accounting of minority candidate supply. Building on this research, we reframe the discussion of minority representation to emphasize the important roles played by minority candidate supply, candidate party identification, and incumbency in determining who is on the ballot and who ultimately wins.
Minority candidate supply and partisanship
The majority of descriptive representation research assumes that a black or Latino ballot option exists in most elections,Footnote 2 but little of this work actually observes the choices given to voters, instead focusing on who won.Footnote 3 Building on the scholarship about political ambition and candidate emergence, one can expect minority candidates to emerge in places where they have been recruited and supported by political elites and where their perception of victory is relatively high (Jacobsen Reference Jacobsen1989). Empirically, minority candidates overwhelmingly emerge in majority–minority districts, where elite support and co-partisan and co-racial/co-ethnic voting make victory very likely (Branton Reference Branton2008; Canon, Schousen, and Sellers Reference Canon, Schousen and Sellers1996; Juenke Reference Juenke2014; Shah Reference Shah2014). Consequently, it is likely that some of the minority descriptive representation puzzle is due to decisions made by parties and minority candidates to favor districts with a substantial minority voter presence.Footnote 4
Following research by Fraga (Reference Fraga2014), Juenke (Reference Juenke2014), and Shah (Reference Shah2014), we incorporate candidate supply into our election-based models of descriptive representation, with the expectation that we can only test for the effects of white voter bias, the theory used by representation scholars to explain aggregate election results, when these voters are presented with minority candidates. Adding to this previous work, we also include information about candidate partisanship and incumbency, and test both black and Latino candidacies simultaneously. As these previous studies suggest, there may be little observable bias against minority candidates when they show up on the ballot. By incorporating the minority candidate supply into our dataset, the aggregate tests more closely match the theory of partisan and racial cues as information substitutes/complements.
Parties can and do shape who runs for office by seeking out and encouraging candidates to run for office, often those who might not have considered running otherwise (Broockman Reference Broockman2014; Canon, Schousen, and Sellers Reference Canon, Schousen and Sellers1996; Lawless Reference Lawless2011). The literature on female candidates finds party recruitment to be particularly salient, and as Sanbonmatsu (Reference Sanbonmatsu2006) argues, the recruitment itself may create ambitious politicians and influence the perceived probability of winning, but that recruitment is largely undertaken for the immediate strategic benefit of the party (see also Fox and Lawless Reference Fox and Lawless2005; Lawless Reference Lawless2011; Stone Reference Stone1980; Stone and Maisel Reference Stone and Maisel2003). Relying on survey-based results of potential candidates, these scholars conclude that people run because: (1) they are asked or recruited by their political party/community organization; (2) they are ambitious; and (3) when the personal benefits outweigh the costs (time and money) of running, potentially moving, pay cuts, etc. However, as Lawless (Reference Lawless2011, 59 notes): “almost no research specifically addresses race or ethnicity in the candidate emergence process at all.”
Unsurprisingly, traditional descriptive representation research typically does not incorporate the partisan supply of minority candidates. Instead, these studies treat the results of partisan elections as if they are primarily racial contests (i.e., does a black/Latino or white win?). Empirically, we reframe the mechanism of descriptive representation and investigate whether the partisan supply of minority candidates will change how we understand descriptive representation. So instead of asking whether a black or Latino won the election (the traditional approach), we ask whether a Democrat or Republican won the election. Then, using the racial and ethnic makeup of the candidate pool, we test to see if black and Latino Democratic candidates are significantly more likely to win than their white counterparts, and whether black and Latino Republican candidates are less likely to win than their white co-partisans.
Incorporating candidate party identification into theories of white voter bias leads to the following hypotheses:
Substitute Cues (null) Hypothesis (H0 )
In partisan races, black and Latino candidates will win as often as their white co-partisans, all else being equal.
Racial Threat Hypothesis (H1 )
In partisan races, black and Latino candidates win less often than their white co-partisans in minority threat or influence districts, compared with extremely white, or majority–minority, districts.
Racial Affect Hypothesis (H2 )
In partisan races, black and Latino candidates will win significantly less often than their white co-partisans, all else being equal.
Incumbency Cues
Finally, we examine the role played by incumbency in the process of minority representation. The electoral power of incumbency has been documented at multiple levels of analysis (Ansolobehere and Snyder Reference Ansolobehere and Snyder2002; Hajnal Reference Hajnal2007; Schaffner, Streb, and Wright Reference Schaffner, Streb and Wright2001), but is not always leveraged in large-N studies of descriptive representation. We argue that incumbency affects descriptive representation in crucial ways. First, both minority and white incumbents have very high re-election rates, and these candidates should not be compared directly with challengers in open races, nor should minority challengers facing white incumbents be compared with other challengers in open races. White voters may not see a minority candidate on the ballot, because a white incumbent makes this emergence less likely. Thus, what traditional models blame on voters may instead be due to the incumbency advantage.
Second, as Hajnal (Reference Hajnal2007) explains, if the racial threat perspective of white bias is correct, then minority incumbents should do worse than their white incumbent counterparts, as white voters react to minority political success with an electoral backlash (H1). However, if incumbency is simply a substitute cue for racial biases, minority challengers might suffer bias in white districts, but minority incumbents should not (H0).Footnote 5 Finally, if the racial affect perspective is correct, then both minority challengers and incumbents should suffer from bias in white districts (H2). Thus, our approach treats incumbency as a tool to analyze the theoretical claims of white racial bias, instead of simply another variable for which to control.
Data and Analyses
To assess our hypotheses we create a unique dataset of state legislative elections, observing contests for seats in both the upper and lower chambers, from three general sources. The pre-election data consist of official candidate lists in 2012 for each state in the sample,Footnote 6 obtained from the New Organizing Institute, candidates' websites or Facebook pages, or election administrators (typically the Secretary of State). After the election, we recorded the number of votes received by each candidate, the winner of the election, and any remaining party and incumbency information using data from Klarner et al. (Reference Klarner, Berry, Carsey, Jewell, Niemi, Powell and Snyder2013) and state election agencies. We verified election winners and incumbency using Ballotopedia (2013) as a check on the merging procedure.Footnote 7
We employ two strategies to code candidate race and ethnicity: expert analysis and self-identification. Using candidate websites, Facebook pages, newspaper articles, or videos, we code candidate race/ethnicity based on pictures, surnames, and biographical information. In addition, the coding for Latinos was aided by the National Association of Latino Elected Officials (NALEO), which provides a pre-election list of Latino candidates (NALEO 2012). If there was uncertainty about the candidate's race or ethnicity, we referred to news accounts, background information, or any other piece of information available. We did not code someone as Latino or African-American unless there was clear and near certain evidence that the person belonged to that group. For a detailed discussion of the coding process and how we resolved a small number of difficult cases, please see Appendix B where we also discuss the tradeoffs of different coding methods. One example, Rick G. Perales (R) in Ohio's 73rd House, was a candidate whose background was scrutinized because of his surname. While we suspect that Mr. Perales has a Latino background, he is never described as such, nor does he self-identify as Latino in his campaign material. He does not belong to any Latino political organizations and he is not included on NALEO's list of Latino candidates. Thus, he is coded as “white non-Latino” in order to avoid a false positive. This decision works against our hypotheses, as Mr. Perales won in a district that is 89% white citizen voting age population (CVAP).
The candidate-level data are then aggregated to the district level to test the district-level hypotheses, and merged with CVAP district data from the American Community Survey 5-year Estimates 2008–12, using the new district lines from the 2010 to 2011 redistricting process (U. S. Census 2012). The Census Bureau provides estimates of education levels (percentage of those over the age of 25 with “some college”) and the unemployment rate in each district as well, capturing the socioeconomic profile of each political contest.
Finally, we add district partisanship estimates to the data. Because not all states release voter registration data at the state legislative level, we are forced to rely on two types of voter partisanship. When available, we use (two-party) voter registration data for each state legislative district.Footnote 8 When these data were not available for a state, we substitute percent of the two-party vote for the President in the 2012 election. Below, we display results for the entire sample of 1,492 districts in 14 states, and the sample without the 400 districts without partisanship information (1,079 in 11 states).
This is one of the largest datasets of minority candidate success and failure ever created for a single cross-section of elections in the United States. Descriptive statistics for the dataset are provided in Table A1 in the Appendix. Using our expert coding procedure, we identify 294 Latinos (9% of the candidates), 329 African-Americans (10% of the candidates), and 2,651 white candidates (81% of the candidates) in the 14 state sample for the 2012 state legislative elections. The average district in the sample has a Latino citizen adult population of about 16%, yet Latinos are only 9% of the candidate pool. In contrast, African-Americans make up an average of 12% of the population in these districts, slightly greater than their relative presence in the candidate pool.
At the aggregate (district) level, we find that 15% of the districts have at least one black candidate on the ballot and 12% of the districts have at least one Latino candidate on the ballot.Footnote 9 In Figure 1, it is clear that race and partisanship help structure the choices given to voters. Ninety-two percent of black candidates run as Democrats, as do 68% of Latino candidates. In comparison, only 37% of white candidates run as Democrats (and 67% of Democrats are white). Thus, similar to the voting public in the era of polarization, black and Latino candidates are not simply racial and ethnic minorities; they are overwhelmingly Democrats. Conversely, Republicans are almost exclusively white (93% of Republicans are white and 55% of white candidates are Republicans). This highlights the difficulty of separating partisan politics and racial/ethnic politics in the United States. Minority candidates face the double obstacle of race/ethnicity and partisan affiliation in many white Republican districts.
Black and Latino candidate partisanship in 2012

Descriptive representation is typically modeled as if most voters are choosing amongst a menu of racially and ethnically diverse candidates. This is very rarely the case as is demonstrated in Figure 2. Not only do minority candidates run as Democrats most of the time, but they also do so overwhelmingly in majority–minority districts. The median district in which black and Latino candidates run for office is 60% minority CVAP. In contrast, the median percentage of minority voters in districts with white Democrats and white Republicans is 20% (Figure 2 for Democrats and Figure A1 in the Appendix for Republicans). This partially explains why we see racially biased outcomes in elections. The choices presented to voters are racially and ethnically biased.
Where are Democrats on the ballot?

Models of Descriptive Representation
We have identified a number of ways in which minority representation research is improved by thinking of descriptive representation as being embedded within the partisan nature of U. S. politics. Empirically, we demonstrate how this theoretical outlook leads to different evidence and different conclusions from past work. The data allow us to model the proper partisan baseline of success for white and minority candidates. Thus, the main models include winning and losing Latino, black and white candidates, and use a partisan outcome (“Did a Democrat win the election?”) as the dependent variable instead of race or ethnicity (“Did a white or minority candidate win the election?”).
We first present the results using all of the observations in the dataset and then, following this, we present results on a “matched” subset of the data. We present both to demonstrate the importance of comparing minority partisans with white partisans in similar electoral contexts. While the full sample results are important for making generalizable inferences, the post-matching analysis allows for a more precise test of the hypothesized causal mechanism (white voters in white districts). As minority and white candidates in the same party are emerging in different types of demographic environments overall, matching allows us to compare minority and white co-partisans who emerge in similarly white, mixed, and majority–minority districts.
In Table 1, we present the full sample results of the regression models that predict whether a Democrat or Republican wins the election for a state legislative seat.Footnote 10 We focus primarily on comparative Democratic success for ease of interpretation, as minority candidates inordinately run as Democrats, and these candidates are the main emphasis of minority representation research.Footnote 11 The black Democrat and Latino Democrat binary variables test for intercept differences when the Democrat is Latino or black. That is, these variables test for any increase or decrease in the likelihood of a Democrat winning when the Democrat is Latino or African-American. Further, we interact minority CVAP with Latino and black Democrats to test for significant effects in low minority districts (very white districts).Footnote 12 If H1 is correct, then significant differences should manifest themselves in minority “threat” or “influence” districts, between 30% and 50% minority population. If H2 (“racial affect”) is correct, then these candidates should do poorly compared with white Democrats in very white districts.
Latino and black descriptive representation in the States: did a Democrat win the election?

The reference category for the racial and ethnic partisan candidate categories is a white Democrat on the ballot. Races without a Democrat on the ballot are excluded. Probit coefficients presented with robust standard errors.
Models 2 and 3 control for district partisanship, but because there is no information about this variable in GA, IL, and PA, we lose about 400 observations.
a Indicates significance at the 90% C. I.
* Indicates 95% significance.
** Indicates 99% significance in two-tailed tests.
Model 1 includes all the 14 states in the dataset, and models 2 and 3 include a control for partisanship in the 11 states that have this information available (dropping GA, IL, and PA). As Table 1 demonstrates, the empirical results obtained from the two samples are not meaningfully different. In both full models (models 1 and 3), we control for the presence of a Democratic incumbent, a Republican incumbent, upper and lower chamber elections, term limits, and the district education levels and unemployment rate. Model 2 is reduced to include only variables indicating the presence of Republican candidates on the ballot, the partisanship of the district, minority population, and incumbency, and is included for comparison with the full partisan model in column 3. It shows that almost all of the variations in the data are explained by these variables on their own.
The baseline result in all of the models is that all Democrats perform poorly in white districts and are much more successful in minority districts. The coefficient for “minority CVAP in the district” represents the demographic/electoral relationship for Democrats in these models, and it is positive, significant, and large. This is not a surprising finding, but it is important. All Democrats do badly in white districts and better in districts with more minority voters.
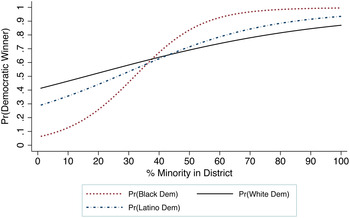
The main results of interest, however, are the interactive effects between district demographics, candidate race, and candidate partisanship, and these tell a more complicated story. For example, while the coefficient for black Democrats is significant and negative, these differences between black and white Democrats are negated by the positive and significant effects of minority voters in districts with black candidates on the ballot (the interactive term). To what extent do these joint effects differentiate minority Democrats from their white counterparts? And, more importantly, do these effects vary across districts in the sample? To help answer these questions, we present the Democratic predicted probabilities for the interactions in Figure 3, and the first differences for black/white Democrats and Latino/white Democrats in Figures 4 and 5, respectively.Footnote 13
Democrats in competitive partisan races. “Competitive races” are those that do not have an incumbent running and have at least one Democrat and one white Republican on the ballot. The predictions are estimated using CLARIFY (Tomz, Wittenberg, and King Reference Tomz, Wittenberg and King2003)
First differences black Democrat—white Democrat. These are the first differences and 95% C. I. associated with the dotted (black Democrats) and solid (white Democrats) lines in Figure 3. The first differences and associated uncertainty are estimated using CLARIFY (Tomz, Wittenberg, and King Reference Tomz, Wittenberg and King2003)

First differences Latino Democrat—white Democrat. These are the first differences and 95% C. I. associated with the dashed (Latino Democrats) and solid (white Democrats) lines in Figure 3. The first differences and associated uncertainty are estimated using CLARIFY (Tomz, Wittenberg, and King Reference Tomz, Wittenberg and King2003)

As a direct test of the main hypotheses, we present the predictions for competitive elections (open races with a Republican on the ballot). We do this primarily because there are no significant differences in success and failure for minority incumbents, even in white-majority districts. Black Democratic incumbents win 100% of their races; Latino Democratic incumbents win 98% of the time; and white Democratic incumbents win 97% of their elections. All three groups also do equally badly in races where they challenge a Republican incumbent in a white district (losing about 95% of the time). Scholars are not simply interested in whether minority candidates do well overall, but instead they are interested to know whether minority candidates underperform in particular electoral contexts. Thus, we present the predicted probabilities for each group in the toughest context possible, open races with a white Republican opponent on the ballot.
As is clear from Figures 3–5, in most of these competitive elections black and Latino Democrats do not perform significantly worse than their white Democratic counterparts. As the percentage of minority population in a district increases, all Democrats are expected to do better on average. Latino Democrats in particular do no better or worse than white Democrats in any context, even in very white districts (first differences in Figure 5). They are statistically indistinguishable from white candidates regardless of the white population in the district.
The results are less clear for black Democrats. While black Democrats perform just as well as whites and Latinos in most elections on average, they appear to do less well than whites in extremely white districts (less than 25% minority). Indeed, even if the differences were not significant, they are substantively consequential and require additional scrutiny. Before doing so, it is important to note that all Democrats, regardless of race or ethnicity, do poorly in very white districts, and that they all cross over from “possibly winning” to “probably winning” (above a 50% chance of winning) at approximately 20%–30% minority population in open and competitive district elections. This finding contrasts with the results from officeholder-only analyses, whose authors argue that majority or near-majority–minority populations are needed to provide legitimate opportunities for minority representation (Cameron, Epstein, and O'Halloran Reference Cameron, Epstein and O'Halloran1996; Lublin et al. Reference Lublin, Brunell, Grofman and Handley2009).
To assess whether these differences persist when we compare white and minority Democrats in similar districts, in effect to test the causal mechanism of white voters in white districts more precisely, we rerun the analyses after performing a matching procedure that prunes observations where minority Democrats are in different electoral contexts than white Democrats (Iacus, King, and Porro Reference Iacus, King and Porro2012). That is, the results presented thus far compare a couple of hundred races with black and Latino Democrats on the ballot, most of them in majority–minority districts, with a much larger sample of races with white Democrats on the ballot, many of them in white-majority districts. Black candidates, however, are much more likely to emerge in Southern states (GA, TX, FL, and NC in this sample), where white districts are particularly hostile to Democrats. Thus, it is possible that black Democrats are underperforming in very white districts (overall) because they are more likely to run in white districts where all Democrats do very badly (Lublin Reference Lublin2004). For example, 22% of white Democrats in white districts are from the South, whereas 43% of black Democrats in white districts are running in the South.Footnote 14
Matching is the best strategy to address these imbalances. The “treatment” in this case is a minority Democrat on the ballot, and the control case is a white Democrat on the ballot.Footnote 15 We use coarsened exact matching (CEM) to balance the data (Iacus, King, and Porro Reference Iacus, King and Porro2012) and employ “percent black/Latino CVAP,” “percent Democratic partisanship in the district” and the “South” (for blacks only) as pre-treatment variables. This procedure keeps and then re-weights the matched observations based on the similarities on these three dimensions. Thus, for example, white Democrats in the South are “matched” to black Democrats in the South, and non-South to non-South and, based on the other two dimensions, all unmatched observations are cut from the subsequent analysis.
The matching procedure for Latino Democrats does not produce different results from those found in Table 1, so we focus here on the results for blacks.Footnote 16 For black Democrats, the overall (untreated) sample imbalance is high, L 1 = .77. The imbalance is pronounced in all of the pre-treatment variables, showing that black Democrats are much more likely to be found in districts with a large black population and in very Democratic districts compared with white Democrats (a difference of means of .34 and .19, respectively, between “treated” and “control” groups). After matching, the overall imbalance for the restricted dataset is much lower, L 1 = .32 and the number of retained observations is 637 out of the original 1,079.
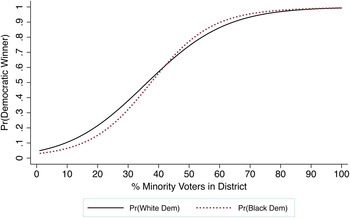
The post-matching predicted probabilities for black and white Democrats are presented in Figure 6 (predictions for competitive open races), and are nearly identical across all racial contexts. Black Democrats are almost guaranteed victory (above 80% chance of victory) in competitive open races in districts with more than 50% minority population. The findings also clearly demonstrate that black Democrats who are doing poorly in very white districts are disadvantaged because they are Democrats, not necessarily because they are African-American.Footnote 17 The matching procedure allows for a more balanced causal analysis of the effects of having a black Democrat on the ballot in white districts, and the results bolster the evidence that both Latino and black Democrats are, on average, winning elections at the same rate as their white counterparts in all types of racial and ethnic contexts. Thus, we find no support for H1 and H2 and fail to reject the null hypothesis of no racial voting in partisan white districts.
Democratic performance after matching on black Democrat. Predicted probabilities for black and white Democrats in “competitive districts” after matching on black Democratic candidacy. “Competitive districts” are those that do not have an incumbent running and have at least one Democrat and one Republican on the ballot
In Table 2, we demonstrate that black and Latino Democrats not only win as often as their white co-partisans, but they also receive nearly the same percentage of the vote as white Democrats in: (1) all competitive races; (2) in competitive races in white-majority districts; and (3) “open” competitive races in white-majority districts. In all competitive races in the sample, black and Latino Democrats win between 60% and 65% of the vote compared with 51% for whites. These differences are significant, and attest to the incredible success of minority Democrats in majority–minority districts. The comparisons in white-majority districts are more uniform, with each group winning about 50% of the vote on average. The similarities are maintained when the sample is split to include competitive open races in white-majority districts. There is no evidence of substantive racial voting in the results.
Mean Democratic percent of the vote in competitive races a

a Competitive races are coded as those with at least one Democrat and one Republican on the ballot. There are 1,055 of these races in the dataset. The N for each category is in parentheses. For example, there are 126 competitive races that feature an African-American Democrat, and the African-American Democrat won an average of 64% of the vote in those races.
b Denotes differences that are statistically significant at the 95% level, when compared with white Democrats. None of the other differences are statistically significant.
In summary, the null “substitute cues” hypothesis cannot be rejected. Indeed, we find no evidence for the racial threat hypothesis (H1); all Democrats do better as the percentage of minority population increases. If anything, minority Democrats do better than white Democrats in threat districts and majority–minority districts, even if these differences are not always statistically significant. More generally, we find little evidence to suggest that minority Democrats are suffering from “racial affect” at the ballot box (H2). This does not mean that many white voters are not racially and ethnically biased. The evidence from survey and experimental data definitively documents these widespread negative attitudes. However, there is no evidence that this bias manifests itself directly in the electoral outcomes of minority candidates.
Robustness Checks: Primaries, Selection Bias, and Candidate Quality
An alternative explanation for the lack of minority candidates in white districts in the general election is that a significant number face white voter bias during the party primary election. To test this possibility, we collected primary candidates’ racial and ethnic information during the summer of 2012 in two states with large Latino and African-American populations: TX and CA. We present the results examining primary candidates in Table 3. They indicate no reason to suggest racially biased voting against minority candidates. The success rate of black, white, and Latino candidates is nearly identical regardless of the electoral context. Black and Latino primary incumbents and non-incumbents perform just as well as their white counterparts. Further, in races where there is at least one white candidate and one minority candidate on the ballot and no incumbent in the race, there are no significant differences in terms of who wins. This pattern holds in subsamples that include only races in white-majority districts. Indeed, minority candidates perform better on average, although these differences are not statistically significant. While it is clear that minority primary candidates are rare in these contexts, when they do run, they often win.Footnote 18
Primary winning percent across candidates (TX, CA)

An additional potential source of bias in the analysis is that minority candidates are selecting to not run in districts with racist white voters (the voters from H1 or H2). Here we would only be worried about selection effects that would cause us to overestimate minority success, that is, bias that makes the estimated success of minority candidates look better because minorities are correctly avoiding districts where they know they will lose because of bigoted white voters. However, this condition has two assumptions: (1) minorities are systematically avoiding white districts because they fear racist votes, and (2) they are correct about those fears. If either of these does not hold, then the findings will not be biased, or will instead be biased downwards (i.e., we are underestimating minority success in white districts).
How can we evaluate these assumptions? Ideally, we would survey latent candidates for office and ask them about their reasons for running or not running. If we found that latent minority candidates avoided running for office at higher rates than white candidates because of their fear of white voter bias, then we would have some direct empirical support for the first claim. The only work we are aware of that surveys potential candidates and includes minority (black and Latino) respondents is Fox and Lawless (Reference Fox and Lawless2005). They find no differences between Latinos, blacks, and white men in terms of “thinking of running for office.” The authors also find that black candidates (similar to female candidates) are significantly less likely to have an interest in higher office compared with white men, and are less likely to have had the family socialization experiences correlated with political ambition (Fox and Lawless Reference Fox and Lawless2005). These individual-level characteristics are much more important in explaining the dearth of minority candidates in many districts, and suggest that minority candidates are strategic in conventional ways, focusing more generally on open race opportunities, individual candidate experience/resources, elite support, party support, and voter partisanship (Canon Reference Canon1999; Moncrief, Squire, and Jewell Reference Moncrief, Squire and Jewell2001), leading to the reliance on majority–minority districts as vehicles of certain minority officeholder success.
We also note that although all candidates incorporate the odds of winning into their decision to run (in some fashion), thousands of candidates run for office every year in spite of their long odds of winning. Indeed, out of nearly 3,500 candidates for office in the dataset, 1,400 of them lost (and 40% of the races were unopposed, showing that many white candidates are also strategically selecting out of difficult races). Winning is not always the sole or most important factor in the decision-making calculus of candidates. Often, candidates know that they are long shots but they want to make sure voters have a choice, or that their message gets out, or they gain experience for future races (Moncrief, Squire, and Jewell Reference Moncrief, Squire and Jewell2001). We have no reason to believe that minority candidates are different from others in this regard. As the data show, many minorities did run in white-majority districts, and they won and lost at similar rates to white partisans.
What would the results look like if minorities were somehow privy to information about which districts were unwinnable because of racist voting, and they were correct in these assessments? That is, what would our data look like if minority candidates were (differently than whites) correctly avoiding districts where they have less chance of winning because of racist voting? The data would show that minority candidates would be winning at higher rates than their white counterparts,Footnote 19 and would be winning a higher percentage of the vote because they are correctly avoiding losses in racist districts. As we show in Tables 2 and 3, this is not happening in white districts. The rates of success for minority and white candidates in general and primary races are nearly identical. Not only are minorities winning just as often as their co-partisans, they are also receiving the same percentage of the vote. We urge scholars to continue to evaluate these claims more directly in the future.
One final alternative explanation is that minority candidates are successful in white districts because they need to be of higher quality than their partisan counterparts. This is an important alternative explanation for minority candidate success, and has not been examined thoroughly by scholars. While Highton (Reference Highton2004) does include a measure of candidate quality in his congressional analysis, it is used as a general control in his models, but the hypothesis that black candidates are of significantly higher quality is never directly examined.
While there is no direct measure of candidate quality in our dataset, we address this alternative hypothesis with a proxy: campaign funding. Specifically, if there is a demand-disadvantage for minority candidates, they should need more money than their white counterparts to defeat opponents in white districts. We examine this relationship using financial information from the Database on Ideology, Money in Politics, and Elections (Bonica Reference Bonica2013), which provides candidate funding information for about 70% of the state legislative sample (“Total Receipts” in the election cycle; see Appendix Table A5). The results in Table A5 (in the Appendix) indicate that Latino and black Democratic candidates are not more “qualified.” Indeed, black and Latino Democrats raised less money than their white counterparts in white-majority districts with no incumbent on the ballot. Further, these deficiencies persist even if we compare Democratic winners in these contexts. This analysis suggests that minority candidates may not be required to be of higher quality to win in white districts.Footnote 20
DISCUSSION
In 2012, an African-American insurance agent and political newcomer, Larry Lee, Jr., defeated two white Democrats in his primary and then Michelle Miller, a white Republican, in the general election, winning the 84th House district seat in Florida. The 84th district is decidedly white (70% CVAP) but is a moderately favorable Democratic district (43% DEM, 32% GOP, and 20% “No affiliation”). The previous officeholder models of minority representation would have focused on the racial and partisan composition of the voters, and given Mr. Lee Jr. only a 10% chance of holding office after the election.Footnote 21 In other words, the previous research would have focused on the racial biases of white voters and ignored the choices that those voters were given. Our model gives Mr. Lee a 63% chance of victory because he ran as a Democrat in a Democratic district with an open seat.
We make a number of important contributions to the current literature. First, we show that the assumption that voters choose amongst a menu of racially or politically diverse candidates is rarely a reality (Figures 1 and 2). Indeed, our examination of candidates running for office in 2012 shows that in the vast majority of scenarios, voters’ choices are constrained by the decisions of the parties and candidates prior to the election. The fact that more African-Americans and Latinos are not representing white-majority districts has as much to do with the candidate recruitment and support process, as it does with the choice of voters to support or reject them.
Second, we develop a theory of descriptive representation that specifically features candidate partisanship and incumbency. Thus, while past work has examined the extent to which district factors correlate with the election of black, Latino, Asian, or white officeholders, it has provided no partisan baseline for comparing racial and ethnic outcomes. Here, we explicitly examine the intersection of race and partisanship, and ask: “Are minority Democrats and minority Republicans performing as well as their white co-partisans in white districts?” The totality of evidence here suggests that they are. Further, because we examine races at the state legislative level we are able to include thousands of candidates and a diversity of contexts that are not found at the congressional level of analysis. We observe more minority candidates in white districts than have ever been observed in a single cross-section of elections, and the resulting variation allows us to use matching to compare racial and ethnic co-partisans in similar electoral contexts. Given that these are the first data of this kind to come after the 2010 redistricting, these findings take on additional urgency and salience to the future of minority representation.
Finally, it is incorrect to interpret these results as suggesting white voters do not influence minority representation. The percentage of white voters in a district is highly correlated with the election of Democrats and Republicans. One of these parties has historically represented minority constituencies, and the other, generally speaking, has not (at least since the mid-1960s). It is more likely that many voters are responding to “who the parties represent,” not “who represents the party” (see Lublin Reference Lublin2004 for a historical treatment of this phenomenon in the South; Swain Reference Swain1993). The evidence from survey and experimental data confirms that white bias is alive and well. That said, however, our findings support the contention that this bias does not directly influence the success of black and Latino candidates. It is precisely because we know how rampant white bigotry is in the electorate (in both parties) that we cannot reject the idea that the election of minority and white Democrats depends on the partisanship of the voters in a district, where the parties stand on the politics of race, the availability of minority candidates, and the openness and competiveness of the election, not the racial makeup of the district.
Why did Larry Lee, Jr. enter his race? Why do other minority candidates, both Democrats and Republicans, not enter the political arena more often in white districts? Research on candidate mobilization suggests that interest groups and the parties play a big role in deciding who runs, who does not, and who gets financial and organizational support (Broockman Reference Broockman2014). Future work will address the remaining question of individual candidate motivation, support from the parties, and candidate quality. The focus of descriptive minority representation is shifting from the voters to the supply of minority candidates, and it is very likely that the future of minority descriptive representation lies in the hands of elites and latent elites, and less so in the hands of white partisan voters.
Supplementary Material
To view supplementary material for this article, please visit http://dx.doi.org/10.1017/rep.2015.2
Acknowledgements
The authors acknowledge the editor and the anonymous reviewers for their valuable comments. They also thank Ben Appel, Ryan Black, Dave Ciuk, Johanna Dunaway, Ben Hansen, Carl Klarner, Cory Smidt, Matt Grossmann, Sophia Wallace, and in particular Michael Colaresi for his modeling suggestions. All remaining errors are solely the fault of the authors.


