Politicians are constantly confronted with factual information designed either to help them make political decisions or to influence their positions on topics that are important to the provider of the information.Footnote 1 However, little is known about whether (and under what conditions) politicians are influenced by facts. In this article, we study one aspect of this topic by focusing on two interrelated questions: Does evidence help politicians make informed decisions, even if the evidence is at odds with their prior beliefs? And does adding more evidence increase the likelihood that politicians will be enlightened by the information?
Research in political psychology has shown that people’s motivations influence how they reason about information.Footnote 2 People’s prior attitudes and beliefs can lead to motivated processing of information, which results in evidence and arguments being selectively accepted and rejected. Empirical studies have found that this is a particularly prevalent phenomenon among politically knowledgeable individuals with strong prior attitudes and beliefs.Footnote 3 However, it has also been shown that people are not ‘[…] at liberty to conclude whatever they want to conclude merely because they want to’.Footnote 4 In line with this argument, Redlawsk, Civettini and Emmerson provide evidence of an affective tipping point at which people are constrained by reality and can no longer ignore information that contradicts their prior beliefs.Footnote 5
Politicians, however, should be expected to hold higher standards of facts than ordinary citizens due to their electoral responsibilities and the potential impact of decisions based on inaccurate interpretations of information. They should also be expected to hold stronger attitudes and possess higher levels of political knowledge than the average citizen. Thus it remains an open question whether politicians are motivated reasoners like citizens, and whether adding more evidence will reduce their resistance to new information. To examine these questions, we use data from three randomized survey experiments that involved Danish local politicians. Furthermore, we compare the results from all experiments to responses to similar survey experiments on a representative sample of Danish citizens.
The first two experiments test the hypothesis that prior attitudes influence politicians’ interpretations of new information by presenting the politicians with quantitative information on the performance of two suppliers of public services and asking them to assess which organization performs best. The information provided is cognitively demanding but unambiguous in the sense that one – and only one – interpretation of the information is correct. The experimental groups vary as to whether or not the sectoral affiliation of the suppliers is visible to the respondents. In some groups they are presented as supplier A and B, while in other groups they are presented as public and private suppliers. By comparing the groups’ responses to the performance question with prior ideologically based attitudes on the ideal balance between public and private provision of public services (measured before the politicians were exposed to the experimental treatment), we are able to estimate the extent to which prior attitudes affect interpretations of unambiguous information.
A third experiment is designed to test the effect of adding more evidence. Again, politicians are presented with quantitative information on the performance of two suppliers of a public service and asked to assess which supplier performs best. Like in the first two experiments, the evidence is constructed to demonstrate that only one interpretation is correct. In this experiment, we vary the amount of information across experimental groups while the relative performance of the two suppliers is kept constant. This allows us to estimate whether prior attitudes influence interpretations differently depending on the amount of information disclosed.
In the following two sections, we draw on the literature on motivated reasoning to discuss the interaction between prior attitudes and evidence among politicians. Our aim here is not to test the theory of motivated reasoning, but rather to use this literature to derive testable hypotheses about how politicians process and interpret evidence. We argue that politicians are likely to be particularly prone to directionally motivated reasoning, but that they are more accustomed to processing vast amounts of complex information than most citizens. Next we discuss how to examine the interplay of information and prior attitudes. We argue that survey experiments are a useful tool to deal with missing and incomparable data, selection bias and endogeneity bias, and we present our experiments designed explicitly to deal with these issues. This is followed by the analysis. In line with our first hypothesis, we find that politicians do indeed tend to misinterpret evidence that contradicts their prior attitudes. However, contrary to our second hypothesis, prior beliefs influence interpretations more as the amount of evidence increases. Largely similar patterns are found for citizens. We conclude by discussing the limitations of our study and the implications for future research.
Motivated Political Reasoning
When faced with new information, individuals must engage in reasoning in order to interpret – and eventually act on – the information. The theory of motivated reasoning asserts that human reasoning is always motivated,Footnote 6 and distinguishes between two competing types of motives: accuracy goals and directional goals. If individuals are driven by accuracy goals, they are motivated to reach objectively true conclusions, regardless of the content and implications of those conclusions. Thus, they will carefully consider the relevant information at hand and try to make an informed decision based on the evidence. Individuals driven by directional goals, however, are motivated to reach a specific and preselected conclusion. Therefore, they will use interpretation strategies that increase the possibility of understanding the information in ways that are in accordance with their prior attitudes and beliefs. Thus if the information depicts a picture that is strongly at odds with prior attitudes and beliefs, directionally driven people will tend to reject or misinterpret the information in an attempt to reduce the discomfort of cognitive dissonance.Footnote 7 Hence, there is a tension between a drive to interpret the information accurately, on the one hand, and a drive to create consistency between prior attitudes and new information on the other hand.Footnote 8 A large body of empirical work has produced evidence of biased interpretations based on, for instance, specific self-perceptionsFootnote 9 and prior political attitudes and beliefs.Footnote 10
The extant literature has almost exclusively focused on how citizens engage in motivated reasoning. However, since politicians differ from citizens in important respects, the findings in the literature on motivated reasoning cannot be directly extrapolated to politicians without further consideration. Politicians regularly make decisions that have a huge potential impact on their electorates. Many of these decisions are based on newly obtained information. Thus politicians can be seen as professional information users who should hold higher standards of facts than ordinary citizens, and who may therefore engage in more nuanced reasoning than citizens.
However, it has been shown that politically sophisticated individuals with strong prior beliefs are more prone than others to directionally motivated reasoning.Footnote 11 For instance, Kahan finds that the disposition to engage in central and deliberative processing amplifies directionally motivated reasoning, especially for highly partisan individuals.Footnote 12 Accordingly, by assuming that politicians, on average, possess higher levels of political knowledge and stronger political beliefs than ordinary citizens, we should expect them to be more prone to directionally motivated reasoning as well. This point of view is further supported by the fact that politicians are largely expected to demonstrate consistent attitudes, and that representing their constituents is an essential part of their job description.
Based on these counteracting mechanisms, we do not have an a priori expectation that politicians should be more or less prone to motivated reasoning than the average citizen. Nonetheless, the general findings in the empirical literature based on citizens clearly show that people are often prone to motivated reasoning, and therefore we expect that politicians’ prior attitudes and beliefs influence their interpretations of new information. Specifically, we expect that:
Hypothesis 1: Politicians increasingly tend to misinterpret new information the more that information is at odds with their prior attitudes and beliefs.
Disagreement is a natural element of politics, and ideological beliefs often play an important role when various solutions to political problems are discussed. Thus it is no surprise if politicians use information politically and disagree over the implications of certain facts. However, it is a democratic problem if their interpretation of the very information is biased, in which case the disagreement is not about the political implications of the facts but about the facts themselves. If directionally motivated reasoning is indeed present in these situations, it calls into question the role of factual information and evidence in political decision making.
Can Biased Interpretations Be Reduced by Increasing the Amount of Evidence?
If politicians are biased by their prior attitudes and beliefs, an important question becomes whether these biases can be reduced, for example by presenting larger amounts of unambiguous evidence pointing towards a particular conclusion and thereby making it clearer what the right conclusion is.Footnote 13 In a classic piece, Festinger argued that although beliefs are difficult to change, because of people’s attempts to avoid cognitive dissonance, most people can be persuaded by information showing that their prior attitudes and beliefs are obviously wrong.Footnote 14 In other words, when confronted with strong and credible counterevidence, people can be persuaded even if they tend to be biased by their prior attitudes.
Redlawsk, Civettini and Emmerson find that people tend to be directionally motivated reasoners when confronted with information that is slightly at odds with their prior attitudes. Specifically, they find an attitude-strengthening effect when people are presented with slightly incongruent information compared to when they are presented with completely congruent information. However, if information is highly incongruent, it forces people to ‘take “reality” into account’Footnote 15 and update their attitudes in a more objective manner. So, while people are generally motivated to defend their prior attitudes, and may be capable of doing so by using directionally motivated reasoning when counterevidence is weak, they are forced to adjust their attitudes and beliefs if they are faced with overwhelming evidence that is at odds with these prior attitudes.
Redlawsk and colleagues thus identify an affective tipping point at which people can no longer ignore the incongruence of new information. This tipping point is defined in relative terms, which means that people are expected to process information more objectively when the share of information that is incongruent with their prior beliefs exceeds the tipping point. Thus Redlawsk and colleagues are not directly concerned with the amount of incongruent information to be processed.Footnote 16 However, based on the theory, it seems plausible to expect a lesser effect of prior attitudes on the interpretation of new information when people are presented with a lot rather than a few pieces of incongruent information.
The expectation that people can be persuaded by large amounts of evidence that contradicts their prior beliefs is supported by the persuasion literature. Based on their Elaboration Likelihood Model of Persuasion, Petty and Cacioppo argue that the amount of persuasive information affects people’s interpretations.Footnote 17 Increasing the number of arguments in a message can either enhance issue-relevant thinking and provide logical support for some conclusion,Footnote 18 or it can function as a cue following a heuristic rule that ‘length implies strength’.Footnote 19 In conclusion, when confronted with larger amounts of unambiguous information, we expect politicians to be increasingly persuaded by the evidence and therefore less inclined to stick to their prior attitudes – even if these attitudes contradict the information at hand. This in turn means that politicians’ prior attitudes are expected to matter less to their interpretation of information, the more unambiguous evidence they are presented with. Thus we expect a bigger information load to reduce the bias of interpretations and hypothesize that:
Hypothesis 2: Politicians’ prior attitudes matter less to their interpretations of new information the larger the amount of unambiguous information that points towards one single conclusion they are presented with.
The literature, however, does not provide unambiguous support for this hypothesis. Some empirical investigations of whether misperceptions and biases can be corrected by providing evidence show evidence of backfire or boomerang effects.Footnote 20 Such boomerang effects may, for instance, occur because highly partisan or ideological individuals are provoked to argue against strongly framed information.Footnote 21 Thus boomerang effects may be a particularly relevant concern for politicians and may take place to an even greater extent when politicians are presented with larger amounts of information. We will return to the concept of boomerang effects in the discussion of our empirical findings.
Empirical Setting and Design
To test our hypotheses, we need data on a large number of politicians with different prior attitudes who have been presented with different amounts of comparable new information. To obtain such data, we rely on three randomized survey experiments nested within the same survey. This method allows us to test our hypotheses with a high degree of internal validity on a large number of real politicians (Danish city councilors). Denmark has 98 municipalities, each of which has its own city council. City councils constitute the elected leadership of the municipalities and consist of politicians from widely different political parties who are collectively responsible for important welfare services like public schools, child care, elderly care and local unemployment policies. While few of the councilors are full-time politicians, the setting allows for a large-scale test among politicians who regularly make decisions that are very important to citizens’ everyday lives.Footnote 22
Emails were sent to all 2,445 city councilors in Denmark in November 2014 with an invitation to participate in a study on the role of information in municipal politics and a personal link to the survey. The data collection was finalized after a month, during which two reminders were sent to the respondents. A total of 954 (39 per cent) politicians responded. At least one member of each city council participated in the survey, and t-tests (Supplementary material Table S1) show that respondents do not differ significantly from the overall population of Danish city councilors in terms of gender, size of the city or the proportion that is a member of a municipal finance committee. However, since members of left-wing parties are slightly over-represented, we would expect our sample to be slightly more in favor of public service provision than the total population of Danish local politicians. Respondents were randomly assigned to participate in either the first or second experiment, and all respondents participated in the third experiment. All experiments were randomized independently of one another.
In addition to the politician survey, we conducted an identical survey in November 2016 with a sample representative of the Danish population with respect to gender, age and municipal residence. The sample includes responses from 1,006 members of the Danish YouGov panel. These data allow us to compare the extent to which politicians and citizens are directionally motivated reasoners. Since our research question is concerned with politicians, we focus our discussion on the results from the politician sample. However, throughout the analysis we will compare and comment on the differences in the results from the two samples.
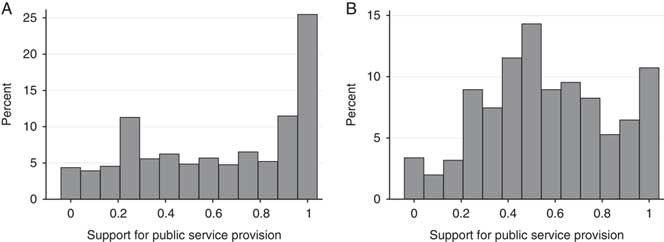
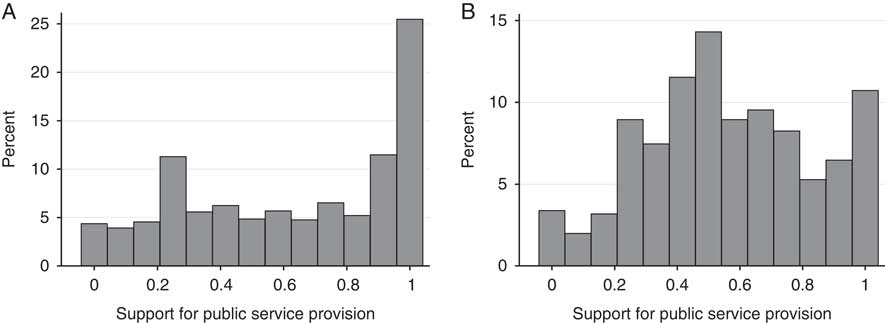
In order for us to test whether attitudes affect interpretations, respondents have to be presented with information that they have different opinions about. Furthermore, as described above, the theory of motivated reasoning suggests that respondents tend to defend their initial position because they have an emotional attachment to the topic.Footnote 23 Thus we need a case that triggers some form of emotional response from the respondents. Therefore, we chose an issue that is continuously debated in Danish politics: what role the private sector should play in the delivery of public services. Some people believe the public sector is the best supplier of public services, whereas others believe private contractors can deliver the services more efficiently.Footnote 24 The balance between public and private service provision is thus a highly contested issue for Danish city councilors, who are responsible for decisions regarding the outsourcing of municipal services. Three questions were included prior to the experiments in the survey to measure respondents’ general prior attitudes to public versus private delivery of public services, and an additive index was constructed running from 0–1, with higher values corresponding to a stronger preference for public service provision.Footnote 25 With a mean of 0.63 and a standard deviation of 0.33, prior attitudes vary substantially in the politician sample even though the distribution is somewhat skewed, with around 25 per cent of the sample scoring the maximum preference for public service provision. The citizen sample is more balanced (mean=0.56; SD=0.27). The distribution of prior attitudes is shown in Figure 1.
Distribution of pro public sector attitudes Note: the x-axis runs from 0 to 1, with 1 denoting the maximum support for public service provision.
(A) Politician sample; (B) Citizen sample.
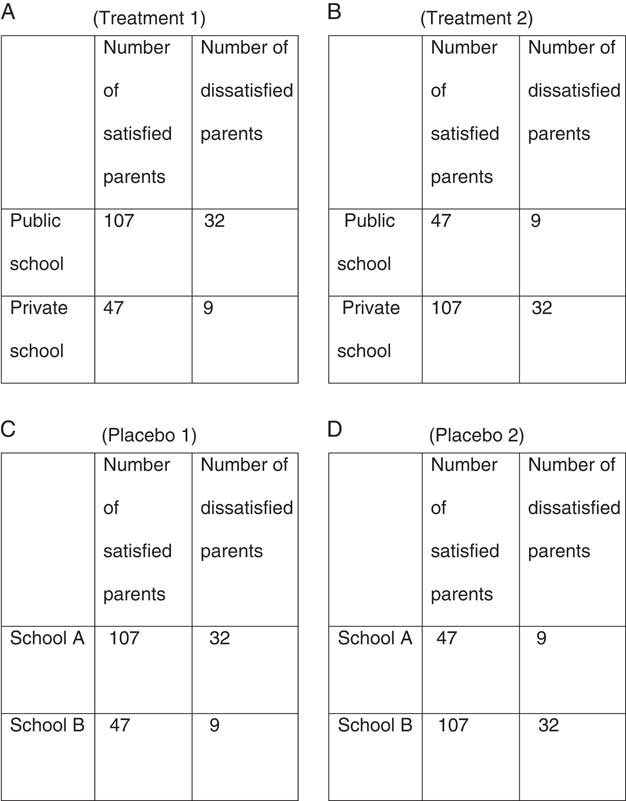
Later in the survey, respondents participated in our experiments that were all designed based on the idea of motivated numeracy.Footnote 26 Respondents were presented with fictitious information on the performance of two suppliers of a public service that Danish municipalities are responsible for (primary education in the first experiment, road maintenance in the second and rehabilitation after surgery in the third), and were asked to evaluate which supplier performs best according to the presented information. For ethical reasons, and to avoid confusing the suppliers with real organizations, we made it clear in the introductory text to the experiments that the information was fictitious. Moreover, we gave the suppliers generic names that could not be confused with specific, real suppliers. We expect people who prefer public services to be delivered by public suppliers to be biased such that their ability to correctly interpret the information is lower if the private supplier is shown to perform best, and vice versa for people who prefer private suppliers. A test of this hypothesis requires that we present our respondents with unambiguous information in the sense that the information has only one correct interpretation. Therefore, as can be seen in Figure 2, one organization was shown to be unambiguously better performing than the other, and the dependent variable in all three experiments measures whether or not respondents answer correctly, meaning that they are able to identify the organization or supplier that performs best.
Treatment and placebo groups in Experiment 1 Note: respondents were randomly assigned to one of the four conditions shown in the figure.
Experiments 1 and 2: Do Prior Attitudes Affect Interpretations?
Hypothesis 1 concerns the question of whether prior attitudes have a causal impact on respondents’ ability to correctly interpret information. To study this question, we need a design that eliminates the possibility that a correlation between prior attitudes and interpretations is spurious. This could, for instance, be the case if both our measure of prior attitudes and the ability to correctly interpret the information were correlated with general abilities to process numerical information. Since prior attitudes cannot be randomly assigned, we rely on a design that compares the ability to interpret the information correctly in treatment and placebo groups. Rather than randomly assigning prior attitudes, we randomly assign respondents to treatment groups in which prior attitudes should matter if the theory of motivated reasoning applies to placebo groups where prior attitudes should not matter according to this theory. By comparing the impact of prior attitudes in treatment groups and placebo groups, we are thus able to isolate the real effect of attitudes from spurious effects.
To ensure that our findings are not limited to one area of public service, we conducted two experiments, each of which was based on random assignment to one of four groups (two treatment groups and two placebo groups).Footnote 27 One experiment used fictitious information on parent satisfaction with a highly politicized policy area – primary schools – while the other relied on fictitious information on citizen satisfaction with suppliers of a less politicized service – road maintenance. Respondents were randomly assigned to participate in either the experiment on school satisfaction or the experiment on road satisfaction. Since the experiments on schools and roads are essentially similar apart from the service area mentioned, we focus the remainder of the discussion on the school experiment.
All groups were asked to evaluate fictitious information regarding parents’ satisfaction with two schools. The treatment and placebo groups differed regarding the presence of a sector cue. We asked the treatment groups to evaluate information on the performance of public and private schools, whereas the placebo groups were asked to evaluate the performance of schools named A and B. ‘Don’t know’ responses were not an option for any of the groups, thus the respondents were forced to provide their best estimate of which of the two schools performed best. Figure 2 presents the differences and similarities between the groups.Footnote 28
Converting the satisfaction data from absolute to relative numbers reveals that in all experimental groups one school has a satisfaction rate of 84 per cent, compared to 75 per cent for the other, and the information is therefore unambiguous in the sense that there is only one correct interpretation. The only difference between the treatment groups is that the numbers in the rows have been switched, meaning that the private school performs better in treatment 1, while the public school performs better in treatment 2. Because there is a correct and an incorrect answer, it is possible to test Hypothesis 1 by investigating the relationship between respondents’ prior attitudes and their ability to correctly interpret the information in the different experimental groups.Footnote 29
No sector cue was given to the placebo groups. Therefore, no relationship between respondents’ prior attitudes and their ability to correctly interpret the information is expected in those experimental groups according to theory (for instance, it is hard to imagine that anyone will have a general, ideologically based preference for a ‘school A’ over a ‘school B’). However, as explained above, the balance between public and private service provision is highly contested, and therefore some people prefer public schools over private ones and vice versa. As a result, we expect there to be a relationship in the treatment groups between respondents’ prior attitudes and their ability to correctly interpret the information. Respondents are expected to be more susceptible to the information when it reinforces their prior attitudes than when it does not, and thus Hypothesis 1 can be tested by investigating whether the impact of respondents’ prior attitudes is significantly stronger in treatment groups than in placebo groups.
Experiments 1 and 2: Analysis
The data from Experiments 1 and 2 are assessed using logistic regression analysis. Interaction terms between prior attitudes and whether respondents were presented with treatment or placebo group information are used to test whether attitudes have the expected (different) impact on treatment and placebo groups. The analysis is carried out in two steps for each experiment: comparing treatment group 1 with placebo group 1, and comparing treatment group 2 with placebo group 2. The findings are presented in Table 1, where Models 1–4 show findings from the politician sample, while Models 5–8 show findings from the citizen sample. Between 73 and 77 per cent of the politicians in the placebo groups provide correct answers, which is significantly higher than random guessing (p<0.001 for all placebo groups). This indicates that the politicians do attempt to investigate the information properly. Moreover, our analyses show that prior attitudes do not significantly affect success rates in any of the placebo groups (see Appendix Table A1 for significance tests within each treatment and placebo group). Thus we conclude that these groups have indeed been designed in a manner that assures that interpretations are independent of prior attitudes to public/private service provision.
The Effect of Prior Attitudes on Correct Interpretations (Logistic Regression Analysis)

Note: the dependent variable measures whether respondents identify the supplier with the highest rate of satisfaction as being the one that performs the best. Entries are logistic regression coefficients. Robust standard errors in parentheses. ***p<0.001; **p<0.01; *p<0.05 (two-sided significance tests)
The findings in Table 1 generally support the proposition that attitudes affect how politicians interpret information, and that the more this information is at odds with their prior attitudes, the more likely politicians are to misinterpret it. Thus in three out of four logistic regressions on the politician sample, the interaction terms are statistically significant and point in the direction predicted by the theory. Specifically, Models 1 and 3 show that the likelihood of interpreting information correctly when a private supplier has the highest satisfaction rate is higher for politicians who support private sector production. Conversely, Model 2 shows that the likelihood of interpreting information correctly when a public organization has the highest satisfaction rate is higher for politicians who support public sector production. Finally, the interaction term points in the expected direction but is statistically insignificant (p<0.118) in Model 4. A similar, though slightly weaker, pattern is found in the citizen sample. There is evidence of biased reasoning among citizens in the school experiment, but not in the less politicized road experiment. Further tests (reported in Table A2) show that the results from the two samples are not significantly different from one another. Thus prior attitudes appear to have an impact of a similar magnitude for both politicians and citizens.
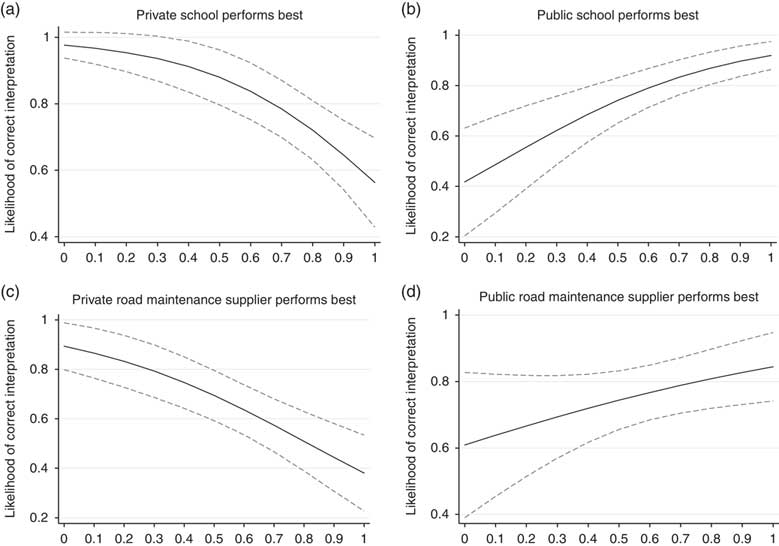
To illustrate the substantial significance of the findings, Figure 3 depicts the impact of attitudes on the share of politicians that successfully chose the best-performing supplier in the treatment groups. Panels 3a and 3b show the results for Experiment 1, while Panels 3c and 3d provide evidence from Experiment 2.
Relationship between prior attitudes and correct interpretations in treatment groups (politician sample) Note: estimated relationships with 95 per cent confidence intervals. The x-axis runs from 0 to 1, with 1 denoting the maximum support for public service provision.
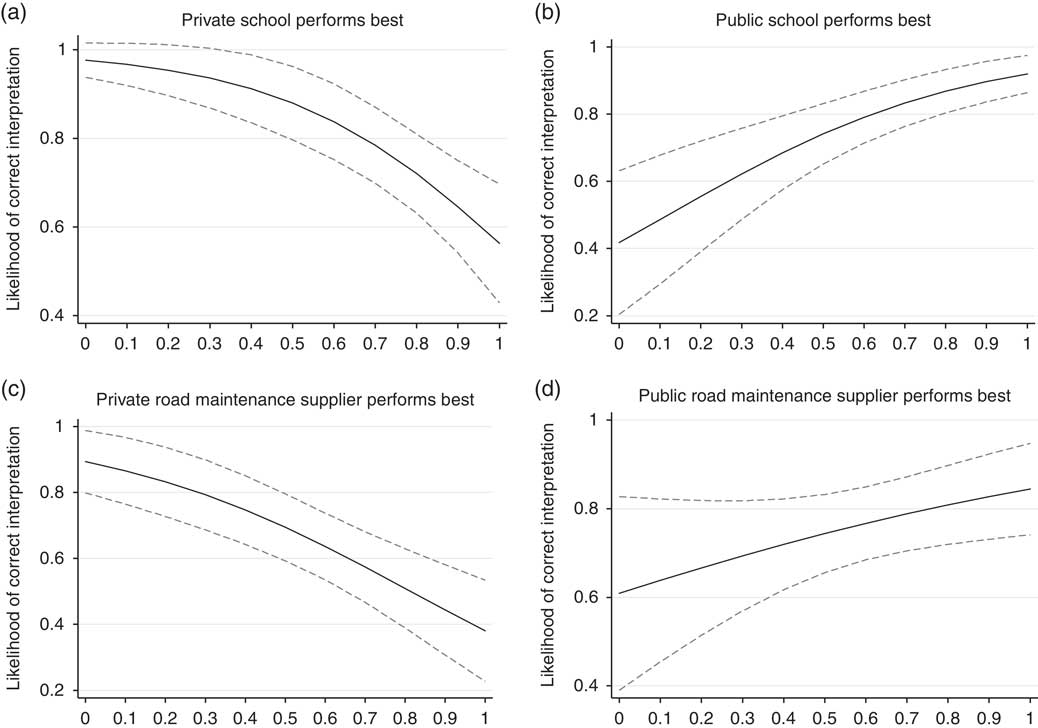
Figure 3 shows a very clear tendency for politicians to interpret information differently depending on their prior attitudes. Thus for politicians who receive information in accordance with their prior attitudes, a very high percentage (84–98 per cent) interprets the information correctly. In contrast, politicians who receive information that is most at odds with their prior attitudes only interpret the information correctly 38–61 per cent of the time. The difference in correct interpretations between those who are confirmed and those who are disconfirmed by the information thus amounts to up to 51 percentage points in Panels 3a–c. In sum, the findings lend substantial support to the theoretical expectation that it harms politicians’ ability to interpret information correctly if the information is at odds with their prior attitudes.
Experiment 3: Does the Amount of Evidence Affect Interpretation?
The third experiment tests whether the impact of prior attitudes on interpretations is contingent on the amount of evidence that politicians are presented with (Hypothesis 2). Thus the experiment is designed to create variation in the amount of information that politicians are presented with, whereas other factors – like the strength of the evidence – are kept constant across experimental groups. The information provided resembles the information given in the first two experiments: it is simplistic and unambiguous (there is only one mathematically correct answer in each experimental group). This allows us to use the same dependent variable, ‘correct answer’, that was used in Experiments 1 and 2. Again, ‘don’t know’ responses were not an option, and the respondents in all groups were therefore forced to provide their best estimate of which of two providers performed best.
Like in the first experiments, we also use attitudes to public service provision as the independent variable. However, in this experiment, we use information on whether rehabilitation after injuries has been successful or unsuccessful in private and public rehabilitation centers. In Denmark, rehabilitation is an important service for which local politicians are responsible, regardless of whether the service is provided by public or private providers.
The experiment uses simple randomization of respondents in a 3×2 factorial design in which the amount of information varies according to the number of pieces of information that politicians are presented with (1, 3 or 5). Moreover, we distinguish between experimental groups for which the relative number of successful rehabilitations is highest for either a public or private provider. This design once again allows us to take into account the possibility that prior attitudes may be correlated with the ability to correctly interpret information. In order to keep the number of experimental groups as low as possible, and since the main aim of this experiment is to examine whether the impact of attitudes differs depending on the amount of information, the experiment does not use placebo groups like in Experiments 1 and 2. The experimental design is illustrated in Figure 4.Footnote 30 It shows the information presented to respondents in the three experimental groups for which the private provider had more successful rehabilitations. The three remaining groups, which are not shown in the figure, were created by simply switching the numbers for public and private organizations.
Experimental groups in experiment 3 Note: the figure illustrates the experimental design for the three groups in experiment 3 for which the private provider had the highest relative number of rehabilitation successes.
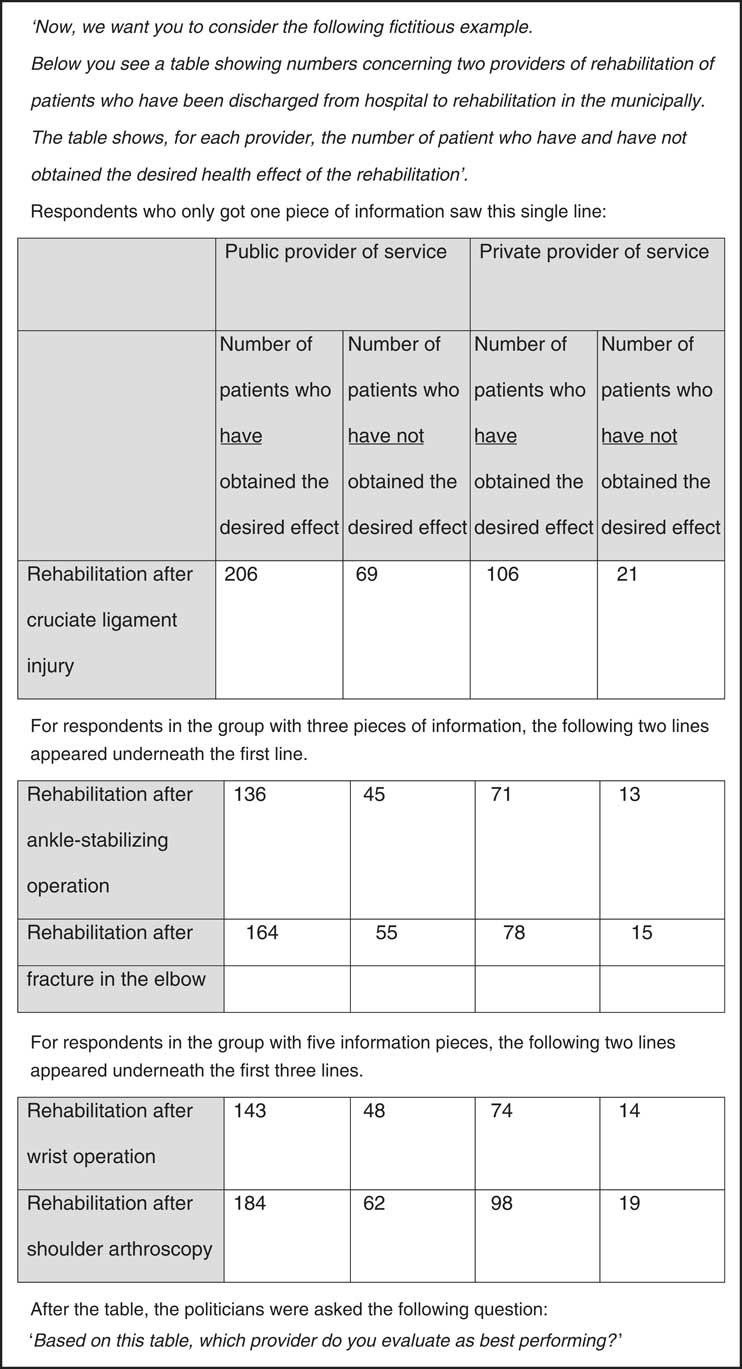
A conversion of the data shows that for all types of injuries, around 83 per cent of the rehabilitations were successful for one provider (in the example shown it is the private provider), while only about 75 per cent were successful for the other (the public provider in this example). Thus adding new pieces of information does not increase the relative strength of evidence, but only the amount of evidence in the sense that more rehabilitation services are included in the information.
Experiment 3: Analysis
In order to test the hypothesis that the impact of prior beliefs can be reduced by increasing the amount of information, we create interaction terms between prior attitudes and the amount of information received. Since our dependent variable is dichotomous, we once again rely on logistic regression analysis. The findings are presented in Table 2. The results from the politician sample are presented in Models 1 and 2, while the results from the citizen sample are presented in Models 3 and 4.
The Effect of Information Load on Interpretation (Logistic Regression Analysis)
Note: the dependent variable measures whether respondents identify the provider with the highest rehabilitation success rate as being the one that performs best. Entries are logistic regression coefficients. Robust standard errors in parentheses. ***p<0.001; **p<0.01; *p<0.05 (two-sided significance tests)
Consistent with the findings from the first two experiments, Experiment 3 shows evidence that prior beliefs affect interpretations. In both Models 1 and 2, the statistically significant coefficient for prior attitudes indicates that, among politicians who received only one piece of information, those who received information that is at odds with their prior attitudes interpret the information correctly to a much lesser extent. Moreover, the analysis lends some support to the proposition that the impact of attitudes on interpretation is contingent on the amount of information presented. The negative interaction terms in Model 1 show that the negative association between preferring the public sector and being able to correctly interpret the information becomes stronger when the amount of evidence grows. Hence, contrary to our expectations, the results suggest that the impact of attitudes tends to grow as the amount of information increases. Only the interaction term between five pieces of information and prior attitudes is significantly different from the reference group at the 0.05 level, whereas the interaction term based on three pieces of information is insignificant (p<0.068).
A similar pattern is shown by the positive coefficients for prior attitudes and the interaction terms in Model 2, although the interaction terms here are clearly insignificant. Moving to the citizen sample in Table 2 (Models 3 and 4), we do not find evidence that the impact of attitudes is moderated by the amount of information received, nor do we find evidence that the information load increases the impact of attitudes to a significantly different extent in the politician and citizen samples (see Appendix Table A3, Models 2 and 4 for the regression analysis). Moreover, across treatments, attitudes have a similar impact on interpretations in the politician and citizen samples (see Appendix Table A3 Models 1 and 3 for the regression analysis).
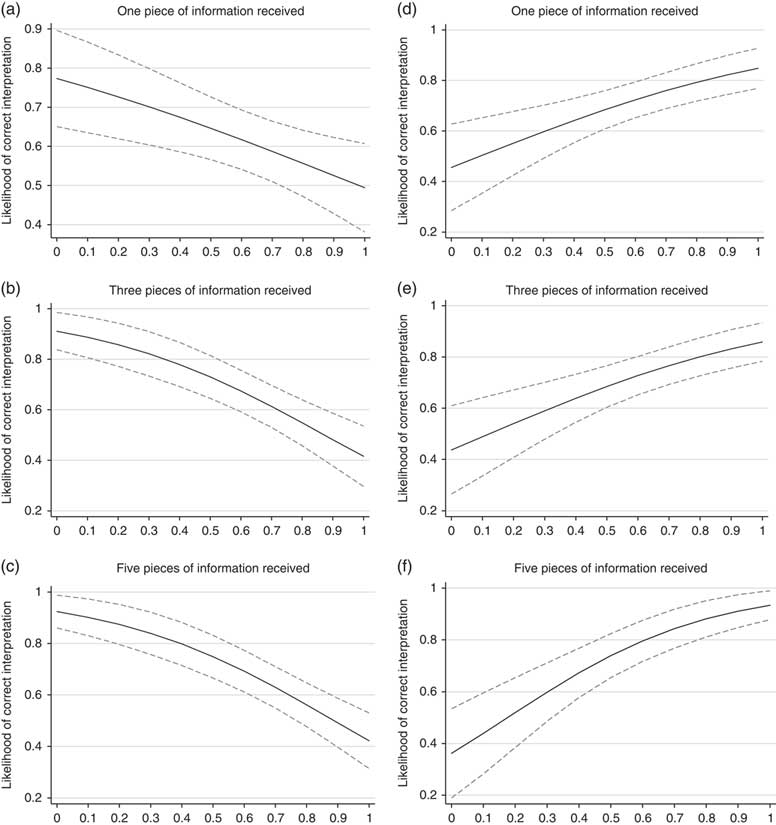
To better illustrate the findings from the politician sample, we once again distinguish between politicians who are most in favor of public and those who are most in favor of private service provision in Figure 5.
Information load, attitudes and correct interpretations (politician sample) Note: estimated relationships with 95 per cent confidence intervals. The x-axis runs from 0–1, with 1 denoting the maximum support for public service provision. (a–c) Private provider performs best; (d–f) Public provider performs best.
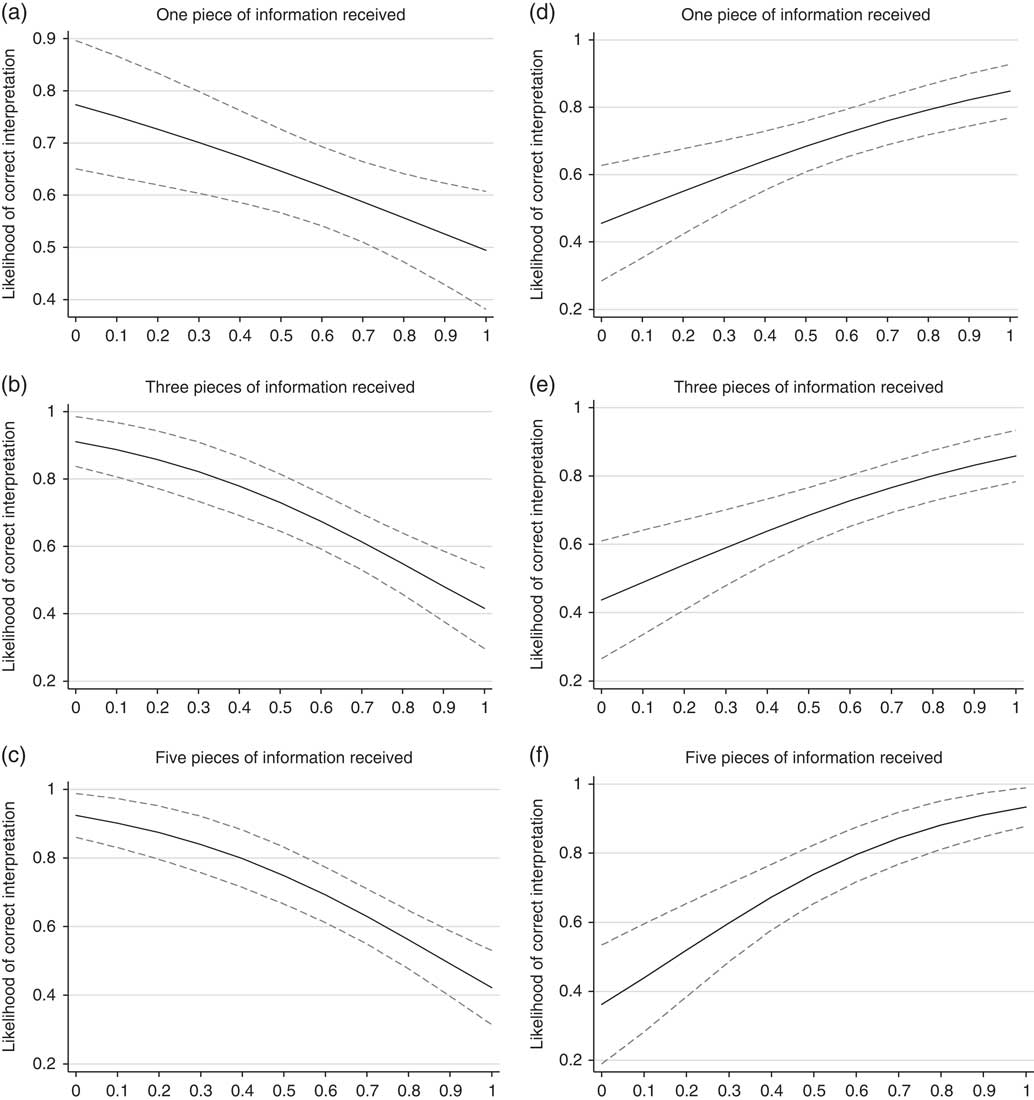
Looking first at Panels 5a–c, where the private provider performs best, the difference in correct answers between politicians whose attitudes are most in accordance and most at odds with their prior attitudes increases from 28 to 50 percentage points when increasing the amount of information from one to five pieces. An increase of roughly the same size can be observed in Panels 5d–f, where the public provider performs best. Thus the increases are of substantial magnitude. Moreover, it is clear from Figure 5 that the effect of adding more information is mainly driven by an increase in correct interpretations of the politicians who are presented with information in accordance with their prior attitudes (an increase from an estimated 77 per cent in the group that received one piece of information to 92 per cent in the group that received five pieces of information). In contrast, estimated correct interpretations of politicians who face information at odds with their prior attitudes change little.
In conclusion, the evidence does not support Hypothesis 2, according to which increasing the amount of information should reduce the impact of politicians’ attitudes. The findings are more consistent with a pattern in which the impact of attitudes grows as the amount of evidence increases. However, this conclusion should be taken with some caution since the interaction terms in Table 2, Model 2 are not statistically significant.
DISCUSSION
It is conventional scholarly knowledge that citizens’ prior attitudes and beliefs affect how they perceive and interpret new information.Footnote 31 Our analysis shows that this also applies to politicians. This is not a trivial conclusion, given that politicians hold electoral responsibilities and are used to processing large amounts of complex information related to their work. Therefore, our first main conclusion is that the interpretation of even unambiguous information in political decision making is not a neutral process, but one in which attitudes matter greatly. This finding not only applies to politicized policy areas like schools, but also to less politicized areas like road maintenance.
Moreover, our third experiment shows that attitudes matter even more when politicians are presented with increasing amounts of evidence. The findings are too inconclusive to allow for the conclusion that politicians become less able to interpret information correctly when presented with larger amounts of attitude-incongruent information. While the analysis seems to indicate that this may be the case, the decrease in respondents’ ability to interpret information correctly following an increase in the amount of counter-attitudinal evidence is statistically insignificant. Hence, in Bullock’s words, across all politicians there is evidence of increasing divergence when the amount of information increases, whereas it is less certain that this divergence comes about with increasing polarization.Footnote 32 We can therefore conclude that adding evidence has no positive impact on the extent to which a large group of politicians interprets information correctly. The ones affected are also mainly those whose prior attitudes are reinforced by the information. Like Nyhan and Reifler, who find that corrections of false and unsubstantiated beliefs among citizens may even backfire and lead to increasing misperceptions,Footnote 33 our findings introduce doubts about whether factual information supports rational political decision making, although we cannot conclude that increasing the amount of information may even decrease politicians’ ability to interpret the information correctly.
While our findings clearly demonstrate that politicians’ attitudes affect how they interpret information, they do raise the question of why this is so. The experiments are not explicitly designed to uncover the mechanisms that link attitudes to interpretations, but they do offer hints as to what is the most likely explanation. The findings in our first two experiments are consistent with directionally motivated reasoning, but it is worth mentioning alternative explanations. Most prominently, a Bayesian updating perspective would suggest that politicians, when presented with new information about public and private suppliers, should interpret the information in the context of their prior knowledge and experience with the public and private sectors.Footnote 34 Thus they may react to the new information by adjusting their attitudes, but to different degrees. If politicians have knowledge of or strong beliefs about how private and public schools in general are performing (for example, with regard to other measures than parent satisfaction), they may give weight to those beliefs as well when assessing whether a private or public organization performs best. Hence, we cannot entirely exclude the possibility that the effects observed in our first two experiments are a result of Bayesian updating, although we consider motivated reasoning to be a more likely explanation, given the fact that respondents were explicitly asked to base their assessment solely on the presented information.
Moreover, although Bayesian updating offers a potential alternative explanation of our findings in the first two experiments, it cannot explain the findings in the third experiment, in which the addition of more information makes attitudes matter more to the politicians’ interpretations. Thus according to Bayesian updating, individuals are expected to react to each new piece of information by adjusting their beliefs, although perhaps to varying degrees due to variation in the strength of people’s prior attitudes and their perception of the reliability of the available information. Instead, we find that adding information does not help politicians interpret the information correctly. Our findings even indicate that adding information may negatively affect some politicians’ ability to interpret the information correctly.
Another possible concern is that answering pre-experimental items about ideologically based attitudes towards public vs. private welfare provision may have made these attitudes extra salient in our respondents’ minds when answering our experimental items, and that this may have increased the treatment effects in our experiments. In order to make our tests as conservative as possible, a number of unrelated items were included between the attitude measurement and our experiments, but we cannot reject the possibility that the attitude items may have affected our results to some degree. However, political cues and fights over attitudes are inherent aspects of real-world policy making, and it seems unlikely that attitudes are less salient in the real-world political decision-making processes we are interested in than in our experiments. Thus, despite the possible priming effects of our attitude measurement, we consider our tests to be conservative in this respect.
Finally, it could be argued that the results are a product of heuristic decision making rather than motivated reasoning. The theory of heuristic processing suggests that individuals, when faced with complex problems, will look for cues to ease their decision making. In our case the cue would be whether an organization is public or private, and the perception of the cue would depend on the politicians’ prior attitudes and beliefs. However, regardless of whether the findings are caused by motivated reasoning, heuristic decision making or some mix of the two, it does not change the main finding that attitudes bias how politicians interpret information, and the policy implications are the same regardless of the specific psychological mechanisms behind our results.
Yet how can it be that the addition of evidence increases the divergence between politicians with different prior beliefs, even if the information is unambiguous, as in our experiment? There might be several possible explanations of our findings. First, the increase in divergence may be explained by dissonance theory, according to which people are generally motivated to avoid situations with cognitive dissonance because it represents an uncomfortable state of mind.Footnote 35 One could argue that people would experience even more cognitive dissonance if they are confronted with more (rather than less) information that is at odds with their values and beliefs. Hence, the motivation for a biased interpretation might be stronger and lead to boomerang effects. This explanation is also consistent with the finding that the ability to interpret the information correctly increases among politicians whose prior attitudes are supported by the information. For these politicians, the additional information will help to reduce uncertainty and increase their confidence in the correct interpretation.
Secondly, the addition of extra evidence may create information overload by presenting politicians with more information than they are able to cope with. The literature on information overload is concerned with the limits of people’s cognitive capacity, and studies from this literature show that too much information can reduce the quality of people’s decision making.Footnote 36 Faced with large amounts of information, people will develop strategies to avoid becoming overwhelmed by the fact that the information-processing requirements of a given situation exceed their capacity, for instance by focusing only on certain information (that is, employing a selection mechanism).Footnote 37 The overload literature suggests that such selection mechanisms are not random, but are instead biased by prior cognitive structures and expectations: ‘People tend to favor information that fits with their established way of thinking, preferring to improve their access to information already obtained at the expense of reassessing what information is really required’,Footnote 38 and this selective focus leads to the risk that ‘[…] in overload situations, important but unexpected cues are more likely to be missed’.Footnote 39
In contrast to the two previous potential explanations, which are based on heuristic peripheral processing, a third possible explanation is based on central systemic processing. Kahan provides evidence that the disposition to engage in central systemic processing may strengthen directionally motivated reasoning.Footnote 40 Increasing the load of information in our experiment may have increased the need for systemic processing (simply because there was more information to process) and thus may have led to more directionally motivated reasoning. Our study does not allow us to conclude whether the increase in divergence among politicians is due to cognitive dissonance, information overload, increased systemic processing or something else. Future research is therefore encouraged to develop designs that allow for a closer examination of the mechanisms behind the findings.
Finally, we should touch upon the extent to which the findings generalize. Information about aspects of organizational performance – like the scores on satisfaction and health care treatments that were presented to our respondents – are widespread in public sectors in many countries.Footnote 41 However, the fictitious and stylized nature of the evidence in the experiments may have implications for the external validity. In relation to this, Prior, Sood and Khanna provide evidence that partisans tend to treat factual questions like opinion questions when responding to surveys.Footnote 42 From this perspective, more accurate representations of the impact of prior attitudes may be found when more is at stake. Related to the discussion of external validity is also our pool of respondents. We focus on local politicians, who, though highly partisan, might not be pursuing a political career to the same extent as politicians running for national parliament. Therefore we encourage future research to vary the stakes in studies of the interplay between prior beliefs and evidence,Footnote 43 and to test effects on members of national parliaments as well.
CONCLUSION
This article is the first to study in large-scale survey experiments how political elites interpret information, and to compare this with a representative citizen sample. Overall, the article makes three main contributions. First, it shows that politicians, like citizens, tend to base their interpretation of new information on their prior attitudes and beliefs. Hence, a main finding is that politicians do not differ fundamentally from citizens when interpreting new evidence even though they are politically sophisticated individuals with considerable experience in processing complicated information. Overall, this finding is consistent with directionally motivated reasoning,Footnote 44 while rational approaches like Bayesian updating may explain the findings in the first two experiments but are less relevant to Experiment 3, given that adding information tends to have a negative impact even on correct interpretations for some politicians.
Secondly, the article contributes to our understanding of the role of evidence in politics. Contrary to our expectations, we find that adding more evidence increases the impact of attitudes on politicians’ interpretations of information. This effect is mainly driven by those who receive information that is in accordance with their prior attitudes and beliefs. Accordingly, evidence does not appear to persuade politicians with attitudes that are not reinforced by the information. Thus, evidence does not tend to build bridges across parties and politicians of various ideological orientations. Rather, evidence reinforces the importance of various political beliefs and may even increase political conflict.
Thirdly, the findings add to the growing literature on how contextual factors affect individual perceptions of facts and information. Previous research has focused on how perceptions and interpretations are contingent on, for instance, media coverageFootnote 45 and the distribution of economic facts.Footnote 46 Consistent with this research, the findings in this article may be interpreted as evidence that a different aspect of the information environment matters as well: political systems that produce large amounts of policy evidence may be more likely to experience differences in how the same pieces of information are interpreted by politicians with different ideological orientations.
Our findings call for further research. If adding more evidence increases the impact of attitudes, future research should focus on three questions. First, why does adding more evidence increase the impact of attitudes? Secondly, if increasing the amount of evidence does not reduce the impact of attitudes, how can we then reduce it? Thirdly, how can we ensure nuanced interpretations of evidence regardless of prior attitudes and beliefs? Regarding the latter questions, several strategies have been suggested to correct biases stemming from prior beliefs.Footnote 47 A set of promising studies has shown that holding individuals accountable for their interpretation reduces different kinds of biases.Footnote 48 However, we should be careful about extrapolating such findings to politicians, as contributors to the accountability literature have primarily relied on student and citizen samples when conducting empirical tests. Therefore future research should investigate the effect of accountability on politicians, and whether this effect is stronger under some circumstances than others. For instance, accountability could be more important if there is a real chance that it affects politicians’ chances of being re-elected. Thus we would expect stronger effects of accountability on policy areas that are more salient to large portions of the electorate.
Appendix
The Effect of Prior Attitudes on Correct Interpretations (Logistic Regression Analysis)

Differences between politician and citizen responses to experiment 1 and 2
Differences between politician and citizen responses in experiment 3