Introduction
This paper reports the first application of the concept of Social Quality to a UK data set. Social Quality is concerned with the quality of society, or social relations, and consists of both a theoretical model and an empirically tested set of measures. This testing has taken place in a range of comparative projects in Europe and Asia and its application to a domestic data set is somewhat overdue (Abbott and Wallace, Reference Abbott and Wallace2010, Reference Abbott and Wallace2012, Reference Abbott and Wallace2014; Yee and Chang, Reference Yee and Chang2011; Lin, Reference Lin2013). In order to test the applicability of the concept of Social Quality we apply it here to the substantive policy issues of low pay and the working poor. On the one hand, the prevalence of households in both work and poverty is rising (Bennett, Reference Bennett2014) and has become a significant political issue, as well as a social and moral one. On the other hand, there are features of the lives of this group, in comparison with the non-poor, that lend themselves to exploration via a Social Quality lens. In particular, while analyses concerning aspects of socio-economic security and, to some extent, social inclusion are familiar with regard to the working poor, this is not the case for social cohesion and social empowerment. To facilitate this analysis we employ Confirmatory Factor Analysis models in conjunction with the British Household Panel Survey (BHPS). These models allow various dimensions of Social Quality to be measured and then subjected to further scrutiny via regression analysis. The results reveal several striking features of the social relations of the working poor, such as the strong occupational and poverty interaction on issues such as trust, voluntarism and social networks, but also that those in higher level occupations are not spared the effects of being poor.
The British government's rhetoric over the last few years has been that any job should be a stepping stone out of poverty and that gaining qualifications and training via work experience should alleviate the worst symptoms of deprivation. Universal Credit is being introduced to ‘make work pay’ but, as we have seen, there is a growing army of reasonably qualified people in the UK on low wages, but without much prospect of ever fulfilling their potential. As such, the main aim of this paper is to look in more detail at the conditions of these people's lives through the lens of Social Quality. This concept enables us to explore in detail multiple facets of poor versus non-poor employees. In this way it might be possible to identify particular ‘pressure-points’ in the labour market which suitable policies could address at the individual, workplace or community level. This does not, of course, exonerate employers from their responsibilities. Even the Confederation of British Industries (CBI) has voiced concerns that wages are too low in Britain to sustain any long-term recovery from the current crisis:
The head of the CBI will today call for companies to start paying their staff more, saying the large number of people working for the minimum wage is a ‘serious challenge’ that business and the Government must address (Independent, 30/12/2013).
Although this concern is not shared by all CBI members (see below), it was echoed by the Chancellor of the Exchequer, in the post-General Election ‘Emergency Budget’, when he made the surprise announcement of a new ‘national living wage’, which we return to in more detail towards the end of the paper. The living wage is based on the amount an individual needs to earn in order to cover the basic costs of living. At present, more than 1,000 employers are accredited by the Living Wage Foundation, committing them to pay the living wage to employed and subcontracted staff. A mandatory national living wage is due to be introduced from April 2016 for workers aged 25 and above, initially set at £7.20 – a rise of 70p relative to the current National Minimum Wage (NMW) rate, and 50p above the increase which came into force in October 2015. The move towards a living wage has been a slow process given that calls for living wages for workers first emerged over 100 years ago with the development of trade unions in Britain.
Furthermore there is a polarisation taking place in the labour market whereby lower level occupational groups (which make up a substantial proportion of the workforce) are often educated, but tend to be very low-paid. This in itself is enough to warrant an investigation into the Social Quality of this section of society. However another aspect of poverty and employment is also worth bearing in mind before we do so. That is the so-called low-pay-no-pay cycle (LNC).
The LNC has become a strong focal point in poverty research. It refers to the phenomenon whereby a large group of people are caught in a poverty trap, but are often intermittently employed. When employed this group tend to occupy low paid and unstable jobs and frequently move on and off benefits throughout their lives to supplement their incomes (Tomlinson and Walker, Reference Tomlinson and Walker2010; Smith and Middleton, Reference Smith and Middleton2007). The ‘low-pay, no-pay’ cycle may persist during periods of high employment levels rather than simply being a consequence of weak labour demand (Hendra et al., Reference Hendra, Riccio, Dorsett, Greenberg, Knight, Phillips, Robins, Vegeris, Walter, with Hill, Ray and Smith2011). The impact of frequent movement between work and benefits may also lead to a scarring effect, and a chronic difficulty in re-establishing themselves in the labour market (Arulampalam, 2001). The people affected are often the ones found in low-paid jobs regardless of the occupational status of those jobs, an issue we return to below in the statistical models where we measure the association of low-paid occupations with Social Quality.
Assessing the Quality of the Social
The concept of Social Quality (SQ) emerged from debates in the 1990s about the neo-liberal policy direction being taken by the EU, as well as by several individual member states. In particular the idea of Europe as market-dominated was at odds with the rich heritage of welfare states which, despite their variations, reflected countless progressive social reform movements. In discussions about Economic and Monetary Union it was apparent that the critical importance of social relations had been overlooked entirely. Of course this observation itself reflected earlier critiques of economic imperialism (Walker, Reference Walker1984) and of the subordinate or ‘handmaiden’ role of social policy in relation to economic management (Titmuss, Reference Titmuss1974). It also echoed academic investigations into the nature of the social (Bhaskar, Reference Bhaskar1978; Elias, Reference Elias2000; Habermas, Reference Habermas1989). Furthermore it stood in direct opposition to those, such as Hayek (Reference Hayek1988) and his disciples who denied the existence of the social.
As well as ubiquitous economic growth oriented assessments of national well-being it was argued that attention should be given to the quality of the social environment. Thus Social Quality is defined as ‘the extent to which people are able to participate in the social, economic and cultural lives of their communities under conditions which enhance their well-being and individual potential’ (Beck et al., Reference Beck, van der Maesen and Walker1998: 3; van der Maesen and Walker, Reference Van der Maesen and Walker2012: 1). The starting point in the concept's theoretical evolution was the fundamental assumption of the essential social nature of human beings, as opposed to the individualistic economic actors of neo-liberalism. Coupled with that, secondly, is the social creation of myriad collective identities in which people achieve self-realisation. In other words individual identity is shaped by society through the process of social recognition (Honneth, Reference Honneth1995). It is in the interplay of actions towards self-realisation within the context of collectivities, or collective identities, that the social is realised. Behind this constant interplay are two sets of tensions: between individual or biographical development and societal development (micro vs. macro) and between institutions and organisations, on the one hand, and families, groups and communities on the other (system and lifeworld). For this social process to take place in any locality or society there have to be some basic requisites: social recognition or mutual respect; human rights and the rule of law (personal security); personal competence (the ability to act socially); and the openness of societal collectivities (social responsiveness) are the obvious ones.
That, in brief, is the theoretical underpinning of Social Quality (SQ). Its empirical measurement focuses on four conditional factors which regulate the extent to which people can participate under conditions that enhance their well-being and potential:
• Socio-economic security: levels of command over material and other resources over time.
• Social cohesion: the extent to which norms and values are accepted and shared.
• Social inclusion: the extent to which people have access to and are integrated into the wide variety of institutions and social relations that constitute everyday life.
• Social empowerment: the extent to which social structures, relations and institutions enhance individuals’ personal capabilities as social actors.
The relationship between these conditional factors and the framing structure of social relations referred to above may be illustrated simply (Figure 1).
The Conditional Factors of Social Quality.

This model has been operationalised successfully in cross-country comparative research in Europe (East and West) (Abbott and Wallace, Reference Abbott and Wallace2010, Reference Abbott and Wallace2012, Reference Abbott and Wallace2014) and East Asia (Yee and Chang, Reference Yee and Chang2011; Lin, Reference Lin2013) but has yet to be applied to purely British data sets. This application is overdue because Social Quality is the only comprehensive model designed specifically to evaluate the quality of society, as opposed to the variety of measures of individual quality of life (Phillips, Reference Phillips2006). Its use here is particularly pertinent because of the widely acknowledged importance of social relations to the operation of labour markets. Moreover, it allows us to distinguish some important differences in the social lives of the poor and non-poor and also within each of these groups.
Data and Methods
In order to utilise Social Quality as a concept, various poverty groups are defined and then explored using the four conditional factors of SQ set out above. In this way a picture is drawn of the social conditions and experiences of poor versus non-poor employees in the UK across the occupational spectrum. The analysis utilises data from the British Household Panel Survey (BHPS). The BHPS commenced in 1991 with an initial representative sample of around 10,000 individuals resident in some 5,000 households. These individuals have subsequently been re-interviewed each year and the sample has also been extended to include more households from Scotland and Wales and to include Northern Ireland. Booster samples have also been incorporated to combat attrition. The data analysed below are restricted to the last wave available (2008/2009) and to individuals in employment (excluding the self-employed). The BHPS is unique in that it enables a comprehensive overview of all four dimensions of Social Quality simultaneously – unlike its replacement, the UK Household Longitudinal Survey (UKHLS), which no longer has the breadth of questions within a single wave that the BHPS had. However, we employ the UKHLS for some descriptive statistics to show the important changes that are taking place in the UK labour market following the recession in 2008, for which the BHPS is obviously inappropriate. We therefore begin with some descriptive statistics related to the working poor and then commence using Structural Equation Models (SEMs), as described below, to measure dimensions of Social Quality and relate these to other conditions such as income and occupation. The individual employee is the unit of analysis.
Various features are used to identify the working poor. First of all, total household annual income before housing costs is divided by the McClement's equivalisation scale. Poor employees are then defined as occupying the bottom quintile of this equivalised income distribution. Secondly, occupational class is used to identify people in lower status jobs.
First and second order Confirmatory Factor Analysis (CFA) models
There are two fundamental types of structural equation model (SEM) that can be used to measure or test the validity of latent concepts such as social inclusion – 1st and 2nd order confirmatory factor analysis models (CFAs). A 1st order CFA simply attempts to measure underlying latent concepts. The left side of Figure 2 shows a simple CFA which has two latent unobserved variables: L1, civic participation; and L2, social networking. L1 is measured by the observed variables V1 to V4 and L2 is measured by reference to variables V5 to V7. V1 to V4 might be answers from a respondent in a survey to questions about volunteering, local community groups and so on. V5 to V7 might be answers pertaining to socialising with friends, or knowing people who can help in a crisis. Thus they are directly observable manifestations of the underlying latent concept that we are trying to measure.
A simple 1st order CFA Model and A simple 2nd order CFA Model.
The single-headed arrows in the figure represent coefficients or loadings in the model and are usually shown in standardised form after estimation much like beta coefficients in regression analysis. The covariance between civic participation (L1) and social networking (L2) is represented by the double-headed arrow. There are associated error terms which are shown as the circles labelled e1 to e7. Using statistical techniques such as maximum likelihood and making assumptions about the distributions of the variables and error terms in the model, the coefficients and covariances can be estimated. In all SEMs a variety of fit statistics are available to assess the validity of the models constructed. Usually it is assumed that the observed variables in the model are continuous and that the distribution of the variables is multivariate normal. Modern SEM software can accommodate categorical observed variables.
This basic model can be taken a stage further – a second order CFA, as shown on the right of Figure 2 where another latent variable, L3, is estimated to capture a latent concept, ‘Social inclusion’, theorised to relate simultaneously to both L1 and L2. It will be noted that L1 and L2 now have residuals associated with them (res1 and res2). Models of this kind can be made as complex as necessary to reflect real-world situations and employ many latent variables and various interactions between them. Furthermore, in both types of model, scores can be generated for the unobserved latent variables. These scores are analogous to the factor scores obtained using exploratory factor analysis. However, exploratory factor analysis would be inappropriate in this case as we already have a theoretically driven set of factors (the four domains of SQ) and therefore we impose this structure on the data.
Finally, other covariates can be applied to any or all of the latent concepts in the model. Thus controls and other causal factors, such as gender, age, housing, occupation and income, can be taken into account within the modelling framework. The size and statistical significance of such covariates can be estimated in a manner somewhat analogous to Ordinary Least Squares regression.
Results and discussion
Relating CFA to Social Quality
Using the BHPS from 2008 we have estimated models that measure the four domains of Social Quality (socio-economic security, social cohesion, social inclusion and social empowerment) as well as various sub-domains within them. For example the first domain is measured using a model shown in Figure 3. This model is a second order CFA that has 5 sub-domains feeding into the overall domain.
Example of a model of sub-domains and the overall measure of the first domain (Socio-economic security) using BHPS.
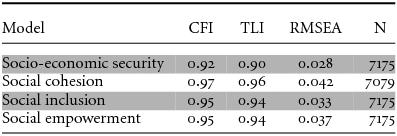
The variables employed to measure Social Quality using the four domains are shown in Table 1. First and second order CFAs were estimated and produced good-fit statistics. All variables in the models were statistically significant at the 1 per cent level. Table 2 shows the fit statistics for each 1st order model of the four domains. In general Comparative Fit Index (CFI) and Tucker-Lewis Index (TLI) indices greater than 0.9 and Root Mean Square Error of Approximation (RMSEA) figures below 0.05 are considered good. Thus we can demonstrate that the four domains and their subdomains can be measured using CFA models. Before we go on to the more detailed analysis using SEM an examination of the working poor and their occupational status is first considered.
Variables used to identify social quality
Fit statistics for the 1st order CFA models
The working poor
The prevalence of working, but poor, households in the UK is on the increase (Bennett, Reference Bennett2014). Exacerbated by the recession there appears to be a growing polarisation of the labour market. A select core is offered good pay and stable conditions with highly regarded skills and access to continuous training and self-improvement, while a growing group of peripheral, low paid workers with less than full-time or permanent labour market engagement occupy precarious labour market positions (Marx and Nolan, Reference Marx and Nolan2012). Many low-wage workers remain trapped in low-level positions that require few advanced skills and proffer few opportunities for progression (Dickens, Reference Dickens2000). The recession has intensified this due in large part to the growth of ‘involuntary’ part-time employment, low-level self-employment and temporary jobs (Leschke and Jepsen, Reference Leschke and Jepsen2011). Many of these jobs are characterised by limited training (Smith, Reference Smith2009) and lack of pension opportunities (Foster, Reference Foster2014). According to the Work Foundation (2012):
To break the figures down, we’ve looked at employment growth comparing the first quarter of 2010 with the latest quarter, April–June 2012. Total employment has grown by 670,000. This includes about 350,000 new jobs for employees and a 275,000 increase in self-employment, as well as a modest increase in people on government training schemes with a contract of employment (up 23,000) and some unpaid family workers (up 19,000). A little over half the total rise has been in part-time work (employees plus self-employed) – just under 350,000. And the number of temporary employees has increased by about 180,000 – the vast majority full-time. But what is really striking is the increase in the number of people in part-time work who say they want a full-time job – up by nearly 360,000 . [Emphases added]
Thus the UK has experienced a growing dualisation of labour (Emmenegger et al., Reference Emmenegger, Häusermann, Palier and Seeleib-Kaiser2012; Tomlinson and Walker, Reference Tomlinson, Walker, Emmenegger, Häusermann, Palier and Seeleib-Kaiser2012) which has been aggravated by poor labour market performance since the recession. This rise in involuntary part-time employment – which is intimately associated with the working poor – is also a new development for the UK not found in previous recessions.
The Work Foundation (2012) continue:
When we look back at a similar period after the 1990s recession, the stand out difference is not the rise in part-time or temporary work. Both were also features of the years between 1993 and 1995. The big difference is the increase in involuntary part-time – people taking part-time jobs because no full-time work was available. Between 1993 and 1995 involuntary part-time work increased by just under 40,000 or 5 per cent. Between 2010 and 2012, the numbers increased by 356,000 or 33 per cent.
This rise in insecure and poor-quality jobs does not only apply to the UK, but is a much wider social problem (ILO, 2013; Eurofound, 2012; EC, 2012). The combination of political-economic reforms and developments associated with neo-liberal globalisation, the increased prevalence of subcontracting in low-waged employment, together with the erosion of trade union organisation, have been particularly important in driving down wages at the bottom end of the labour market in many countries (ILO, 2008; OECD, 2011). Employees with low occupational status are highly likely to find it difficult to acquire new jobs when made unemployed and economic restructuring has resulted in higher levels of job insecurity, work intensity and psycho-social risks for those in employment (EC, 2012b). While work has often been seen as the primary route out of poverty, the majority of Northern economies have more poor people in work than not (Brady et al., Reference Brady, Fullerton and Moven Cross2010; Grover, Reference Grover2005; Wills and Linneker, 2014; Maitre et al., Reference Maitre, Nolan and Whelan2012). Although the risk of poverty is five times higher among adults in workless households than those in working households, in practice work is not a guaranteed route out of poverty. The increase in the number of low income working families is greater than the decrease in the number of workless families. (Newman, Reference Newman2011). In-work poverty has implications for people's capacity to move off benefits and can also affect employee morale, absenteeism, labour turnover and productivity (Greenwald and Stiglitz, Reference Greenwald and Stiglitz1988; Wills and Linneker, 2014). Hence calls for a national living wage have become stronger.
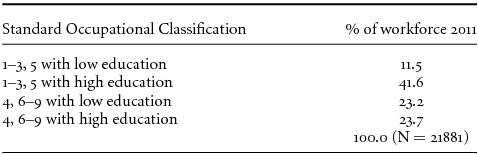
Furthermore the growing mass of low- and intermediate-level jobs is increasingly populated by well-educated employees. Table 3 shows the increase between 1991 and 2011 of highly qualified workers broken down by standard occupational classification (SOC). (These data were derived from the British Household Panel Survey (BHPS) for 1991 and UKHLS for 2011 weighted to provide British data for 1991 and UK data for 2011 (BHPS did not include Northern Ireland in 1991). The higher status occupations (SOC groups 1–3, managers, professionals and technical workers) have seen their highest qualifications increase over time. For example, 58 per cent of managers and senior occupations had A-level or higher qualifications in 1991 compared to 75 per cent in 2011. Professionals with degrees have risen from 52 per cent to 88 per cent and associate professionals with degrees have risen from 21 per cent to 65 per cent over the same period. However there are similar growth patterns in the lower occupations as well. Personal service workers with at least A-level qualifications have risen from 35 per cent in 1991 to 60 per cent in 2011; sales and customer service workers from 28 per cent to 52 per cent and even process, plant and machinery operators from 17 per cent to 34 per cent. Even the most elementary occupations have seen a rise from 13 per cent to 37 per cent. Thus in an ideological context which tells us that education is an investment for the future and will result in higher wages and superior jobs, increasing numbers of people are well qualified, but in relatively low-level and low-paid jobs.
The highest educational status of various occupational groups 1991 and 2011 (%) Percentage with various qualifications by Standard Occupational Classification – all employees (%)
Source: BHPS, 1991 and UKHLS, 2011 Authors’ analysis.
This growing group of low-level / highly qualified workers is also quite large (Table 4). Table 4 shows a crude breakdown of higher versus lower occupations depending on whether the employee has A-levels or above versus those that do not. If we categorise lower level occupations as comprising SOC major groups 4 (Administrative and secretarial occupations) plus 6–9 (personal service, sales, customer service, process, and elementary) roughly half of the UK workforce are in these jobs according to UKHLS data for 2011, and roughly half of these are relatively well qualified (college level and above). In other words around a quarter of the UK workforce is probably over-educated in terms of the work they are undertaking and this is also associated with low pay as we report below.
Proportions of employees by education (2011)
Source: UKHLS 2011 data, Authors’ analysis.
This is borne out by exploring reported wage rates (Table 5). The gap between qualified and lesser qualified workers within low level SOCs (4, 6–9) is not very large. Apart from group 6 (personal service occupations) there is only a few pence difference in the hourly rate of those with A-level qualifications and above versus the rest. In some occupations the hourly rate for qualified staff is actually lower than unqualified (SOCs 4, 8, and 9) although some of these trends may also be associated with age and associated experience and pay. Thus, for these workers having a college or better education on average makes no difference to their hourly incomes which are not much higher than minimum wage and also below the Living Wage (the minimum wage was £6.08 for those aged 21 or over in 2011; the Living Wage rate was £7.20 for those living outside London in the same year). In the higher occupations on the other hand it makes a substantial difference to have a college education or higher (almost doubling SOC group 2's hourly rate and raising groups 1 and 3 by around £4 per hour).
Average hourly wage rates (in £) by Standard Occupational Classification and education qualifications (2011)
Source: UKHLS 2011 data, Authors’ analysis.
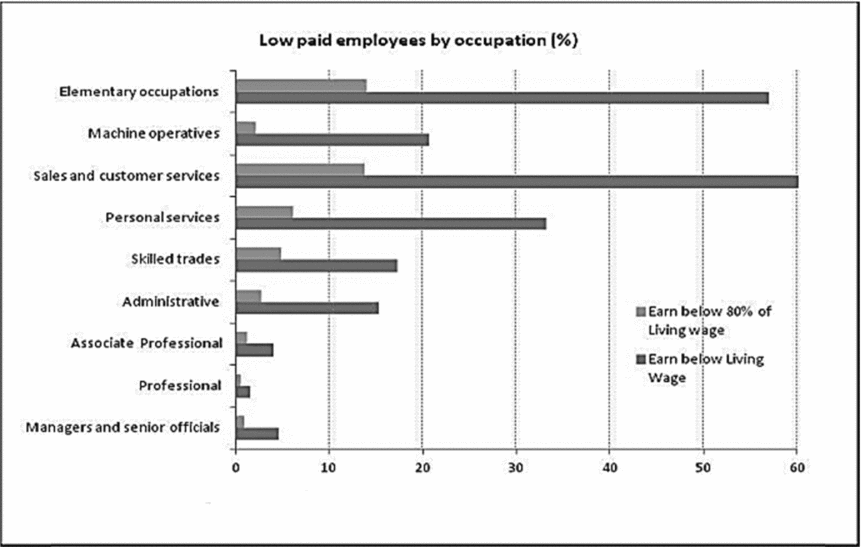
The sheer size of the low-pay problem is shown using data from the Resolution Foundation in Figure 4. Employees in the lower strata of the occupational spectrum are highly likely to be earning less than a living wage. Over half of workers in elementary occupations and sales/customer service occupations are earning less.
Low-pay Britain.
Relating these findings back to the SQ measures using second order CFA models to measure the overall domain scores for UK employees indicates the broad distribution of Social Quality across the socio-economic spectrum of those in employment. There are many broad areas of concern that we could explore with regard to employees: for example, income, occupational class and housing. Figure 5 shows the mean scores on the four domains obtained via second order CFA models broken down by income quintiles (equivalised to take into account household size) and Figure 6 shows the mean scores broken down by occupations based on the major SOC groups. ANOVA tests for equality of group means indicate that, for all four domains, there are significant differences by income quintile and occupation (p<0.05). However, social cohesion is not significant with respect to income quintiles at the 1 per cent level.
Mean scores of the four domains of social quality by equivalised income group (quintiles Q1 = lowest, Q5 = highest).
Mean scores of the 4 domains of social quality by occupation.
Further analysis of income quintiles using linear regression (not shown here) indicates that, with respect to the highest income group, all other income groups are significantly different on domains 1 and 4. Domain 3 shows significant differences between the lowest and highest income groups while there are no significant differences with respect to domain 2 (p<0.01). Thus the higher income groups tend to score significantly more highly on socio-economic security, social inclusion and social empowerment than their poorer counterparts.
Similarly using managers, directors and senior officials as a baseline, regression analysis suggests that all occupations are significantly different to managers on domain 1 (except associate professional and technical occupations); skilled trades and caring, leisure and other service occupations are significantly higher on domain 2; and all groups are significantly different on domain 4 at the 1 per cent level. No differences were found at this level on domain 3. Thus the greatest statistically significant variation across the occupational spectrum is also related to socio-economic security and social empowerment.
Clearly then there are wide disparities in the Social Quality scores across the social spectrum of employees. Taking income first (Figure 5), on three of the dimensions there is a clear disparity between those at the top of the income distribution and those at the bottom, most especially with regard to socio-economic security and social empowerment and, to a lesser extent, social inclusion. Social cohesion does not show any real pattern. In terms of occupation (Figure 6) there are clear patterns with regard to socio-economic security and social empowerment, but less clear patterns in terms of social cohesion and inclusion. As one moves up the occupational hierarchy one gains significantly in terms of socio-economic security and social empowerment, but there is clearly a divide between the professional, managerial and technical occupations and everyone else: the uppermost three SOC groupings all show above average scores and the other six groupings show less than average scores. SOC group 2 (professional occupations) have the highest scores. We further analyse occupational and income differences in more detail in the models below by interacting occupational and income variables.
Multivariate analysis of sub-domains
In order to differentiate the effects on the working poor we have estimated models with occupational and poverty controls on each subdomain of the four conditional factors of Social Quality. First the occupations were categorised into three hierarchical levels based on the SOC first digit or major groupings: professional, managerial form the first tier; technical, craft and skilled manual form the second (skilled labour) tier; administrative, caring/sales/customer service, machine operatives, plus elementary occupations form the lowest third tier.
These three tiers were further interacted with a poverty indicator (based on being in the bottom quintile of the income distribution of the sample after equivalisation as discussed above). Thus we have an indication of the differences in Social Quality experienced by each occupational group depending on whether they are also poor or not (in a relative sense). In each model the reference group is non-poor professional/managerial (tier 1).
Tables 6–9 show the coefficients, confidence intervals, standardised coefficients and fit statistics for the interactions in the models for each major dimension respectively.
Models of SQ Domain 1 (Socio-economic security).
Models of SQ Domain 2 (Social cohesion). Standardised coefficients
Models of SQ Domain 3 (Social inclusion). Standardised coefficients
Models of SQ Domain 4 (Social empowerment). Standardised coefficients
Social Quality and Low Pay
Tables 6–9 detail the effects of being poor versus non-poor in each occupational tier relative to the best stratum (non-poor tier 1). Clearly, in the majority of cases, being in a lower tier is generally less desirable than being in the top tier on most sub-domains of Social Quality. Being poor almost always has a further penalty whichever tier of the occupational structure one occupies. So, if we take economic security as an example (Table 6), being in tier 2 (and not poor) reduces this sub-domain's score by 0.149 standard deviations relative to non-poor tier 1, and being poor and in tier 2 reduces it by a total of 0.725 standard deviations. This is considerably more. In the majority of cases where the coefficients themselves are significant the confidence intervals (CIs) for poor and non-poor tiers do not overlap indicating that the differences between the coefficients are also statistically significant. Thus in the case of economic security cited above, the 95% CI for non-poor tier 2 is −0.242 to −0.043 and for poor tier 2 is −0.887 to −0.501 – a considerable difference (see Table 6).
It is also important to note that those in tier 1 occupations are not spared the effects of being poor. If one happens to have a high ranking occupation, but falls into the lowest quintile of the income distribution, one is almost always significantly worse off than non-poor colleagues on the vast majority of the Social Quality sub-domains.
Taking Table 6 as a whole, we see initially that there are occupational effects on economic security, housing and human capital across the board. Being poor has a significant further impact on security, housing and human capital. Effects are less clear with respect to health where the poor professional and managerial workers are not significantly different to their non-poor peers. The non-poor intermediate occupations are also not less healthy. It is also perhaps surprising that there are no real significant differences with regard to work security apart from a very weak effect on Tier 3 poor employees. It is, however, worth noting that the survey took place at the onset of recession when feelings of job insecurity were particularly prevalent (Eichhorst et al., Reference Eichhorst, Nielsen, Gerard, Rünstler, Kendzia, Url and Mayrhuber2011). The coefficients generally follow a pattern where the lower tier effects are worse than the upper tier which illustrates that the hierarchy in occupations according to SOC classification is reflected in Social Quality measurement.
Table 7 demonstrates that, even on issues such as trust, voluntarism and social networks, there is a strong occupational and poverty interaction effect (though not so with issues of identity). Relative to tier 1 occupations, trust generally falls as one moves down the occupational hierarchy and this is further exacerbated by poverty. Levels of voluntarism fall by occupation, but poverty makes less of a difference. Contrary to other patterns, social networking actually increases as one moves down the hierarchy and poverty does not make much of a difference to this. This implies that belonging to a neighbourhood, and having local friends and neighbours one can rely on, is actually more prevalent in disadvantaged communities relative to the more affluent tier 1 group. This reinforces other findings reported recently on social participation among the poor which show that low income households participate significantly more on certain dimensions related to neighbourhood and community than relatively wealthy households (Ferragina et al., Reference Ferragina, Tomlinson and Walker2013). Thus the Social Quality analysis raises questions about social exclusion and isolation among the working poor not being a significant problem. There is also a potential contradiction here because trust falls as social networking rises. But the trust dimension here is not related to locality or neighbourhood whereas the social network dimension is. It is also interesting to note that, in terms of a sense of identity, it is the working unskilled poor that have the highest average scores.
Further to the identity sub-dimension in Table 7, Table 8 shows that citizenship reveals a different pattern. Generally the lower occupations have lower citizenship scores and again poverty exacerbates this. Most groups have lower labour security, apart from those in tier 2 (poor or non-poor), relative to tier 1 non-poor. It is noteworthy that tier 1 poor employees are significantly less secure than their non-poor peers. In fact, of all the groups, these feel the least secure. In terms of services and social networks there are very few significant coefficients suggesting that these dimensions do not vary so much with occupation or poverty status. Thus the British system still allows reasonably equitable access to services across the spectrum of income and occupation and does not inhibit participation in social networks.
Finally, Table 9 shows strong effects with respect to knowledge and culture. Both are affected by occupation and further degraded by being in poverty (especially for tier 2). On the other hand, it appears that non-poor tier 2 and tier 3 employees have more time on their hands. In terms of labour control, poor tier 1 and non-poor tier 2 employees are not significantly different to tier 1, while the other groups have significantly less control.
A Living Wage?
The analysis of the BHPS data through a Social Quality lens has raised numerous policy issues which warrant further exploration in relation to socio-economic security, social cohesion, social inclusion and social empowerment but are beyond the confines of this paper. However, one such policy issue which has potential implications for the improvement of people's Social Quality across these different domains which will be briefly explored further relates to making work pay and the living wage. Whilst it is not possible to fully address the merits of a living wage here, it is evident that income has a considerable impact on Social Quality across the occupational spectrum. Hence the relevance of the living wage to Social Quality debates. This is particularly important because the analysis shows that, irrespective of occupation, low pay affects SQ along several dimensions. Most notably (in terms of the size of the modelling effects) in relation to economic security, housing, human capital, trust, voluntary activity, citizenship, knowledge, and culture.
For more than 100 years there have been demands for living wages for workers in Britain (Grover, Reference Grover2005). In Britain neo-liberalism, particularly since the 1980s, resulted in a concerted attack on entry-level wages through the abolition of Wages Councils and changes to social security, which caused benefit levels to be eroded. The wages of the poorest were lower in real terms in the mid-1990s than they had been 20 years previously. It was within this context that the National Minimum Wage (NMW) was introduced in 2002 by New Labour. At the same time the idea of a living wage was pursued in the East End of London by The East London Community Organisation (TELCO) with the support of the public sector union UNISON (Bennett, Reference Bennett2014). The living wage is ‘designed to reflect the local cost of living and the real cost of life. Rather than leaving wage setting to the laws of supply and demand, a living wage is designed to re-balance the moral economy, setting an ethical minimum that reflects and supports the real costs of living’ (Wills and Linneker, 2014: 183). Pennycook and Whittaker (Reference Pennycook and Whittaker2012) found one in five workers earning below the living wage nationally (they use a low pay threshold of two-thirds of gross median hourly pay).
Some living wage supporters call for the NMW to be raised to a living wage level while others advocate asking employers, including government departments and private sector companies, to pay the living wage voluntarily (Bennett, Reference Bennett2014). The dozen or so local fairness commissions that have been established in the past five years have all recommended payment of the living wage by both public and private employers (New Economics Foundation, 2015) and some have gone further to argue for broader fair employer codes of good practice (see, for example, The Sheffield Fairness Commission, 2013). It has been argued on the one hand that higher wages have an impact on affordability, competitiveness and unemployment (see MacPherson, Reference MacPherson2002 in relation to the USA) and, on the other, that it increases living standards, self-esteem and work–life balance for employees, in addition to improvements in productivity, recruitment and retention for employers (Living Wage Foundation, 2012).
The surprise announcement of a national ‘living wage’ for those over the age of 25, in the July 2015 Budget, cut through this debate and dismayed some employers, especially those in the retail sector where low pay is endemic. The existing living wage is currently set by the Low Wage Foundation at £7.85 per hour (£9.15 per hour in London) and is £1.15 or 17% above the NMW. The new ‘living wage’ will start at £7.20 per hour in April 2016 (still below the real living wage), or 55% of median earnings, and is expected to rise to £9 an hour by 2020 (the Low Pay Commission, which has set the NMW since its inception, has been asked by the Chancellor to increase the rate to 60% of median earnings by 2020). Thus, while the label ‘living wage’ is a deliberate political misnomer, the NMW has been boosted and this will undoubtedly benefit many of the low paid, although not those under 25. But this rise will not be sufficient to offset the cuts in the tax credits of working families made in the same Budget. In fact, because of these cuts, the new NMW plus (rather than ‘Living Wage’) will have to increase more rapidly than suggested by the Chancellor if the target of 60 per cent of median earnings is to be reached by 2020. While it is obviously premature to attempt an evaluation of the impact of the NMW plus, it is a progressive step to bring low pay closer to the level of the living wage. At the same time a key theme of the July 2015 budget was the further residualisation of the welfare state. Thus, in broad social policy terms, NMW plus is also a continuation of the process of shifting responsibility from the state to employers that began in earnest in the 1980s (Hill and Walker, Reference Hill, Walker, Farrell and Hay2014). This leaves completely open the question of the optimum balance between distribution and redistribution (wages and social security) in order to ensure that incomes are at least sufficient to live on and recognise variations in need.
Furthermore, in practice, even a living wage will not eradicate poverty (and by extension the associated issues concerning Social Quality investigated above). While 6.1 million people in ‘working households’ are in poverty in the UK (Aldridge et al., Reference Aldridge, Kenway, MacInnes and Parekh2012) this does not always mean that the worker involved has a low hourly wage. Neither do all such low-paid workers live in households in poverty. There are also concerns that living wages have a close affinity to the male breadwinner model, with ‘fundamental questions about whether women should be expected to comply to androcentric institutional forms and roles to secure their well-being, an expectation that exists in both living wages and the “making work pay” strategy’ (Grover, Reference Grover2005: 24). However, our findings, which link poor performance among various Social Quality domains with low income among those working, indicate that a genuine living wage is likely to have a positive effect on Social Quality by raising the incomes of a significant proportion of the working poor.
Conclusion
The use of Social Quality as a focal point has revealed highly interesting patterns concerning the state of employees and particularly poverty-stricken employees across the social spectrum in Britain. It has exposed important variations in Social Quality experienced by different occupational groups and uncovered significant occupational and poverty interaction effects on key dimensions. In addition, the exploration of poverty through a Social Quality lens indicates the possibilities presented by such an approach for future policy analysis. For instance, it would be possible to explore other socio-demographic variables in a similar model including age, gender and ethnicity to assess how particular groups experience Social Quality within an employment context.
This research has shown that there are often significant differences in Social Quality within occupations that are strongly related to income levels. Utilising a Social Quality model and BHPS data has allowed us to explore in great detail the differences between several sub-dimensions. In terms of poverty per se poor employees are worse off in terms of economic security, housing, health, human capital, trust, voluntarism, citizenship, knowledge and culture whichever part of the employment structure they belong to. Even those in the so-called upper level of the labour market (professional, managerial occupations which require reasonably high levels of skill and motivation) are significantly worse off on these dimensions if they are low paid.
There is thus evidence emerging that not only is the labour market seriously skewed in terms of qualifications (that there is a growing mass of relatively able, educated and skilled workers in poorly paid and unskilled jobs – often part-time – with few prospects) but that, even at the top of the occupational hierarchy, low pay has a potentially deleterious impact on the lives of these employees. Couple this with high economic inactivity rates and high unemployment and there is a serious handicap to economic growth and the problems of reducing the welfare budget are not going to recede.
One initial obvious policy conclusion that has been briefly explored is the idea that employers should be encouraged, as the CBI suggests, to pay significantly more than the minimum wage and be encouraged to pay at least the Living Wage to their employees. This may be particularly pertinent for a growing number of workers with decent qualifications on low wages with student debt. Those in the lower tiers of the occupational structure also need more help to escape from the low-pay-no-pay cycle so prevalent among this group. This requires more targeted training and assistance at the workplace and an acknowledgement by government that the quality of jobs matters. The problems revealed in the analysis here will not abate without better quality full-time employment opportunities being generated.