


Introduction
Scholars have extensively examined how neighbourhood-level diversity affects multiple dimensions of social capital, often using the conceptualisation proposed by Robert Putnam, who describes social capital as a form of public good (Putnam, Reference Putnam2000). According to this definition, social capital is present in cohesive and well-functioning communities and absent in divided and socially withdrawn ones. Putnam famously claimed that ethnic diversity generally “hunkers down” social capital, leading people to trust others less and to withdraw from collective life (2007). The alleged negative effect of diversity on social and civic life has been extensively tested over the past 15 years. However, the existing studies primarily relied on survey-based evidence showing the relationship between self-reported individual membership in different types of associations and neighbourhood-level diversity. There is a remarkable lack of aggregate level analysis on the relationship between civil society infrastructure and diversity despite Putnam’s focus on community-level social capital. If the claim that diversity “erodes” civic life is correct, we should observe a negative relationship between these two measures. To our knowledge, such a test has not been systematically conducted in the European context. Our interest in studying distribution of CSOs links to the UK tradition of voluntary sector studies where, since the early 2000s, researchers examined unevenness of CSO density at the neighbourhood level. Importantly, to date, such studies have focused on the relationship between CSO density and neighbourhood deprivation, not addressing its relationship with diversity. In this paper, we bring together the social capital and diversity literature with the voluntary sector and deprivation research to examine whether there is evidence for the negative relationship between ethnic diversity and prevalence of CSOs on the aggregate, neighbourhood level.Footnote 1
Overview of the Literature
Social capital in the version proposed by Putnam (Reference Putnam2000) is a property of communities rather than individuals. His research and multiple bivariate analysis of the US data show negative correlations between social capital measured at aggregate community level and ethnic diversity. As he notes, such correlation can be explained by either compositional effect of an area or by contextual effect. To examine whether diversity has a negative contextual effect, Putnam uses both survey and administrative data from the US and attempts an individual level analysis, controlling for both socio-demographic characteristics and neighbourhood level factors. He concludes that social capital is eroded by ethnic diversity, even when controlling for individual and community level factors such as education, income, or crime. In other words, there is a negative contextual effect on social capital brought by diversity, beyond the sum of individual level characteristics. However, a growing bulk of evidence from subsequent studies suggests that the negative relationship between social capital and diversity significantly diminishes and becomes either statistically insignificant or miniscule when other neighbourhood level factors are accounted for (Meer & Tolsma, Reference Meer and Tolsma2014).
Much of Putnam's US-based work analysed associational membership as a convenient measure because “associations tend to gather data on themselves and, therefore, it is easier to gather data on associations” (Putnam, Reference Putnam2001, p. 5). In his summary index of social capital (2000: 291), two out of 14 indicators measure civil society density. Despite Putnam’s emphasis on social capital as a community level rather than individual level resource, the UK-based studies inspired by his framework have solely looked at individual level membership in voluntary associations, and have not examined the aggregate community level relationship between CSOs density and ethnic diversity. This gap in scholarship is likely to be a consequence of two factors. First, studies of social capital and those of the voluntary sector tend to be treated as separate fields. Secondly, quantitative research on social capital has traditionally used survey-based, individual level data, whereas quantitative research on the voluntary sector tends to rely on administrative registers of formal charities.
In comparison with survey-based social capital research, aggregate level voluntary sector studies evolved more recently. In the UK, the first systematic analysis of geographical unevenness of formal CSOs across regions was done by Mohan and Rolls (Reference Mohan and Rolls2006) who found that higher-income regions are characterised by higher density of formal CSOs compared to lower-income regions. In addition, rural areas tend to have more organisations per capita but rural organisations are three times smaller in terms of income compared to those located in urban areas. Since this initial mapping, subsequent aggregate level analysis of formal CSOs have focused on the relationship between community disadvantage and civil society density. In a recent paper by McDonnell et al. (Reference McDonnell, Mohan and Norman2020), the authors also addressed the long-term trends of the relationship between density of CSOs and deprivation. Overall, these studies consistently found that there is a negative relationship between formal civil society and aggregate level disadvantage. To illustrate the impact of deprivation, Clifford (Reference Clifford2018) estimates that the density of CSOs in the 5 per cent least deprived neighbourhoods is twice as high as in the most deprived ones.
Although we do not have any existing estimates on the relationship between CSO density and diversity, we know that the UK has generally a relatively high participation rate of ethnic minorities and that minority-specific civic organisations constitute a large part of the overall non-for-profit sector (Richards, Reference Richards2015). These individual level statistics on participation rates or even the information on the composition of the civil society sector do not tell us, however, whether neighbourhood level diversity is positively or negatively related to the density of CSOs. The relatively high national level of participation among ethnic minorities might not be evenly distributed across areas with different demographic characteristics (i.e. ethnic minorities might participate at different rates depending on how diverse their communities are).
There are only a few Swedish studies that can inform our expectations in relation to geographical distribution of CSOs. For example, Wijkström and Lundström (Reference Wijkström and Lundström2002) found that in 1992 more than half of the approximately 2,600 major foundations had been registered in one of the three metropolitan areas, whereas smaller CSOs were somewhat more evenly distributed between urban and rural areas. Perhaps the most relevant here is the study by Lundåsen (Reference Lundåsen2004), who finds that, in contrast to the UK literature, municipalities with a higher level of associational density are also more economically deprived. On diversity, Lundåsen finds that the CSO density is negatively related to the share of foreign-born residents. This means that at the municipal level, the density of organisations is higher in more deprived, less diverse, non-metropolitan areas. Because the data was aggregated at the municipal level, indicators of economic deprivation (mean income level) were likely confounded with the urban–rural divide. Whereas immigrant-dense municipalities tend to have higher income levels, the opposite is true for immigrant-dense neighbourhoods, so Lundåsen’s findings may not hold for smaller geographical areas.
Hypotheses
Our main test concerns the “hunkering down” hypothesis proposed by Putnam (Reference Putnam2007), according to which we should observe a negative bivariate relationship between civil society density and neighbourhood diversity (H1).
H1
Neighbouhrood density of formal civil society organisations is negatively associated with neighbourhood level of ethnic diversity.
For Putnam, this expectation can be derived from ethnic conflict theory (Blalock, 1967), which asserts that the increasing size of ethnic minority out-groups leads to the increase of perceived ethnic threat. In turn, the increase in perceived threat might result in lower social trust, lower willingness to cooperate and lower engagement in civic life. Higher population diversity can be also challenging for CSOs formation because diverse populations might lack common cultural understandings, solidarity and effective tools for social control that are present in more homogenous communities (2007). On the other hand, the Weisbrod’s demand heterogeneity hypothesis suggests that higher population diversity should result in greater density of CSOs (Weisbrod, Reference Weisbrod and Phelps1975). This is because heterogeneous populations have more diverse needs that cannot be met by the government who caters its services to the ‘median’ voter. In turn, in more diverse communities, there is a greater incentive to form CSOs that can fill in the void left by the state. As discussed, there is no consensus in the literature on whether population diversity leads to more or less civicness or social trust. The empirical studies on aggregate level distribution of CSOs, predominantly based in the US, suggest that there might be a positive association between population heterogeneity and non-for-profit sector size but that the effect size is rather small (for a meta-analysis see Lu, Reference Lu2020). On the other hand, the studies concerning individual level outcomes such as volunteering or trust, suggest that living in diverse communities does not have much of an effect if we control for deprivation (van der Meer & Tolsma, Reference Meer and Tolsma2014). Given the importance of deprivation in studying the link between diversity and social capital as well as the negative association between deprivation and density of CSOs in the UK, we derive the following hypotheses:
H2
If neighbourhood level density of formal civil society organisations operates in the same way as individual level participation is civil society, we should find that the negative effect of neighbourhood diversity (H1) on density of CSOs largely disappears when neighbourhood deprivation is controlled for.
H3
Alternatively, the negative effect of deprivation on density of formal civil society organisations might be amplified in diverse neighbourhoods, creating a “double whammy effect”.
Civil Society Context in the UK and Sweden
In this section we discuss key characteristics of country-specific contexts that can affect the relationship between ethnic diversity, deprivation, and density of CSOs. It is beyond the scope of this paper to formulate formal expectations about the role of country-specific contexts as our main goal is to test the generalisability of the patterns across countries. However, we acknowledge that country-specific contexts can help with the interpretation of the results, a point to which we come back in the final section.
Social Capital and Civil Society
The UK, our first case study, has high and stable levels of trust and volunteering and ranks in the first quarter in the international comparative studies of social capital (i.e. Falk et al., Reference Falk, Becker, Dohmen, Enke, Huffman and Sunde2018). Traditionally, the British voluntary sector has been dominated by service provision charities aiming to fill the gap left by insufficient welfare state (Craig, Reference Craig2011; Harris, Reference Harris2018). In 2020, the main purpose of one in five organisations was to provide social services, followed by cultural and recreational services (15%) and religious activities (10%). Since the early 2000s, government funding continues to decline, and, in 2020 it amounted to 15.4% of the total civil society sector income (NCVO, 2022a, 2022b). Sweden, our second case study, has one of the highest levels of generalised trust and associational activity in the world (Henriksen et al., Reference Henriksen, Strømsnes, Svedberg, Henriksen, Strømsnes and Svedberg2019). In 2020, 16% of funding for the civil society sector came from governmental funding (Statistics Sweden, 2022). In contrast to some countries in Western Europe, where CSOs often concentrate on areas such as health care and education, Swedish CSOs developed more in the field of culture, leisure, and advocacy, and membership-based CSOs are more dominant. This legacy is present to this day with the two largest groups being organisations operating in the field of culture and leisure (25%) and tenants associations, social and societal development (31%) (Lundström & Svedberg, Reference Lundström and Svedberg2003; Statistics Sweden, 2020). As in other Nordic countries, Swedish CSOs are primarily engaged in expressive rather than service functions and activities such as advocacy, recreation, and related fields (Scaramuzzino, Reference Scaramuzzino2012). Over the last decades, Swedish civil society has been undergoing changes. In recent years, civil society has professionalised, and organisations have moved towards a tendency to employ fewer members, while the majority of the members behave more like clients who buy services. These changes have been described as a shift from voice to service (Kings, Reference Kings2011; Lundström & Wijkström, Reference Lundström and Wijkström1995).
Migration and Diversity
Our two case studies also have different migration histories, which affect the resources available in ethnically diverse communities for the development of civil society organisations. In the UK, there is a long tradition of post-colonial migration from South Asia, the Caribbean, and Africa since the 1950s, as well as a strong tradition of the inflow of highly skilled migrants, and more recently, a high inflow of Eastern European migrants from the new EU member states (Amoranitis and Manco, Reference Amoranitis and Manço2010). In contrast, Sweden does not have a similar colonial past and remained a relatively homogenous country until the 1970s. For a long time, the most numerous migrant groups were work migrants from within the Nordic region. From the 1970s, Sweden started receiving an increasing number of asylum seekers from war-torn zones such as Chile and Iran, in the 1990s from Yugoslavia, and more recently from Afghanistan, the Horn of Africa, and the Middle East. After 2004, another large group of migrants emerged consisting of EU workers, mostly from Poland (Frohnert & Byström, Reference Frohnert and Byström2017).
Although the two countries have comparable shares of foreign-born (14% for UK and 20% for Sweden, OECD, 2022), there is a large difference in the proportion of refugees. In the UK, refugees constituted only around 6% of all immigrants in 2019 (Sturge, Reference Sturge2021), while in Sweden, in 2007 this figure was close to 40% (Bevelander, Reference Bevelander2009). In the UK, many of the first-generation migrants speak English and are highly educated, and those with post-colonial ties are familiar with the UK political and educational structure, which makes navigating the British system easier. Sweden, on the other hand, has received refugees from countries which have a relatively low score of the UN Human Development Index (HDI) (Bevelander & Irastorza, Reference Bevelander and Irastorza2021) and immigrants rarely speak Swedish upon their arrival.
Ethnic and migrant civil society organisations
Ethnic and migrant civil society sector started emerging in post war Britain in the form of self-help organisations established by postcolonial migrants from the Caribbeans and South Asia (Craig, Reference Craig2011). The primary activity of such organisations was to provide services (educational, welfare, cultural, religious) to migrant and ethnic minority populations to fill the gap left by insufficient welfare state. The British migrant and ethnic minority sector largely developed in parallel to the mainstream civil society sector, and has been much more reliant on self funding rather than public funding. The organisations led by ethnic minorities are sometimes referred to as “BME third sector” to highlight that they constitute a separate part of the civil society. Marginalisation of minority-specific issues within predominantly white organisations is often cited as the main reason for the lack of mainstream involvement of many ethnic minority organisations (Craig, Reference Craig2011). This, however, often leads to further marginalisation of minority-led organisations, which struggle to access mainstream funding for its activities (BECON, 2004; Civil Society Futures, 2018). In Sweden, the role of ethnic and migrant organisations has undergone significant changes over time (Berovi, 2004). In the early phase, emphasis was put on preservation of culture, and participation in consultations, according to the Swedish corporatist model. In the 2000s, a new framework of state support for ethnic organisations required that they show how their activities benefit integration. This requirement was further emphasised in recent years by the conservative government alliance (2006–2014), which reduced grants to ethnic organisations that focused on issues specific to a given ethnic group, such as cultural preservation. Changes to the grant system led to more ethnic and migrant organisations turning to integration work and collaboration with local municipalities (Frödin & Fredholm, Reference Frödin and Fredholm2021; Scaramuzzino, Reference Scaramuzzino2012).
These differences between our two case study contexts have certainly influenced the evolution of CSOs in diverse areas. Arguably, however, if we observe a similar relationship between the density of CSOs and diversity in both countries, we could be more convinced that it is indeed the diversity that affects the distribution of CSOs. On the contrary, if the relationship between the density of CSOs and diversity is different in the UK and Sweden, it might suggest that factors other than diversity might be more important for determining the geographical distribution of CSOs.
Data, Measures, Methods
For information on CSOs in the UK, we use the data from the 2018 Charity Commission register of formal non-for-profit organisations.Footnote 2 This is complemented with Census 2011 and Office of National Statistics data aggregated at Lower Super Output Area (LSOA). We define a neighbourhood at LSOA-level, which is a geographical unit most often used for neighbourhood level studies in the UK. LSOAs have on average a population of 1,500 people and, in total, there are 34,753 such units in England and Wales. We restrict our sample to England and Wales because Scotland and Northern Ireland are not included in the Charity Commission registers. In Sweden, we use official statistics provided by the Statistics Sweden on registered not-for-profit associations (Swedish ideella föreningar) from 2018, aggregated at neighbourhood units called DeSO. There are 5,984 such neighbourhood areas which have between 700 and 2,700 residents. Other variables are derived from 2016 Swedish register data containing economic, demographic and geographical information on all persons resident in Sweden (Statistics Sweden’s Business Register, 2018; Charity Commission register, 2018).
Our dependent variable is the neighbourhood density of active CSOs per 1000 people. To maximise comparability across the UK and Swedish samples of registered CSOs, we conduct our main analysis on active, formalised organisations. In the UK active, formalised CSO is defined as a registered organisation which reported having at least some income in the past 3 years (2016–2018),Footnote 3 and in Sweden as a registered, non-profit association with either some registered income or registered employees. Excluding organisations without declared income or employees in Sweden enables us to address some of the differences in the registered CSOs pool in the two countries. In particular, in Sweden it is common to register small neighbourhood associations such as flat owners’ associations or hobby groups, which would not appear in the UK Charity Commission register due to higher registration barriers (i.e., the £5,000 minimum annual income threshold and more formalised annual reporting requirements). Similarly, excluding CSOs which either did not report annual income or reported having no income in the past three years from the UK database, allows to exclude organisations that did not fulfil the formal requirement of annual reporting for three consecutive years. This could indicate that such organisations finished or changed their statutory activities but did not inform the Charity Commission about the change. Restricting both databases to active, formalised CSOs makes our analysis more comparable; however, the downside of such restriction, even if necessary, is that our analysis focuses on larger and better resourced CSOs. We are also not including unregistered organisations which, as Gleeson and Bloemraad (Reference Gleeson and Bloemraad2013) show, might be particularly prevalent and underrepresented in formal registers in minority communities. As a robustness check, we also repeated all the analysis on all types of organisations (without any restrictions), and the results appeared similar. In the online Appendix, we include the correlation tables (A1 and A2) which show how all CSOs are correlated with active CSOs and other key variables.
Our measure of diversity is based on the country of birth rather than ethnicity since ethnicity is not recorded in Swedish registers. To capture how diverse a neighbourhood is, we use the index of ethno-linguistic fractionalization, calculated over a detailed country of birth groups. These groups (38 in the UK and 43 in Sweden) reflect the most sizable sending countries. The diversity index ranges from 0 to 1 and is best interpreted as the likelihood that two individuals selected at random from a neighbourhood will be from the same group (values closer to 0 means less diversity, values closer to 1 more diversity).
To measure levels of neighbourhood deprivation we use indicators which are easily comparable between the two countries: share of adults who are unemployed, share of people without educational qualifications, and share of adults who receive means tested benefits. To build an index of deprivation, we used the principal component analysis, which is similar to the way Index of Multiple Deprivation (IMD) is constructed in the UK (MHCLG, 2019a, 2019b). For ease of interpretation, we normalise these indices so that an index of 0 refers to the lowest deprivation and 1 to the highest deprivation. Because our analysis of density of active CSOs by deprivation deciles revealed that the relationship between deprivation and density of CSOs in Sweden is non-linear (Fig. 2), in the regression analysis, we add squared index of deprivation. We also include two indicators of socio-demographic profile of the neighbourhoods: share of people aged 65 plus and population density. Finally, we control for population stability-share of residents at the same address in previous year, as we expect that more stable communities might have a better civil society infrastructure, and the share of students because we know that student hubs may have high residential turnover but also high propensity for forming and registering associations as this is usually encouraged by the universities.
We test our hypotheses in two steps. First, we inspect the bivariate relationships to explore correlations between density of active CSOs and our key variables. If the correlations between CSO density and neighbourhood diversity are negative, we would find support for our H1. In the second step, we apply OLS regression predicting density of active CSOs at the neighbourhood level with diversity and deprivation as key explanatory variables while controlling for the neighbourhood level characteristics described above. If the relationship between CSO density and diversity is negative without controlling for deprivation but changes into non-significant after controlling for deprivation, we would find support for H2. In contrast, if the diversity effect is negative and the deprivation effect is negative while both factors as well as their interaction are added to the models, this would suggest that our ‘double whammy’ from H3 is true. Finally, we run additional sensitivity tests to check whether the relationship between diversity and civil society density varies in urban and rural places, places with different levels of recent demographic change, and places with a more/less supportive political environment. These additional tests allow us to see whether the patterns observed on the country level are likely to be the same regardless of within country, regional differences that shape the local nature of diversity.
Results
Distribution of CSOs
The average density of CSOs is about six times higher in Sweden than in the UK. Based on the 2018 Charity Commission data, we find a total number of 166,854 organisations, which gives approximately 2.6 organisations per 1000 people. In Sweden, based on the list provided by Statistics Sweden, there were 160,594 non-profit organisations, which gives approximately 16 organisations per 1000 people. These differences correspond to the fact that membership and participation in civic associations is more common in Sweden than in the UK as it has been confirmed in earlier research, but also to the different threshold for registering a CSO (Gesthuizen et al., Reference Gesthuizen, Meer and Scheepers2009). In relation to active and formalised CSOs, Sweden still has a higher density compared to the UK, but the difference is much attenuated. In the 2018 Charity Commission register, we found 120,104 active CSOs, which gives the density of around 1.8 organisations per 1000 people, whereas in Sweden the number of formalised CSOs was 29,142, which gives the density of 2.82 organisations per 1000 people.
Diversity and Active, Formalised CSOs
Next, we examine the bivariate correlation between diversity and density of active, formalised CSOs. In the UK, contrary to H1, we find that diversity is positively associated with the density of active CSOs (R2 = 0.053). This finding contrasts with the expectations derived from the traditional social capital literature, especially given that diverse areas in the UK continue to be more disadvantaged compared to areas identified as typically White British (MHCLG, 2019a, 2019b). Having said this, the relationship between area deprivation and diversity is much weaker in the UK than in Sweden (see Table A1 and A2 in the online Appendix). Part of the explanation for the positive correlation between diversity and active CSO density is likely due to foreign born residents being on average better educated than those born in the UK (ONS, 2022). In contrast, in Sweden, we observe a negative relationship between diversity and density of active CSOs (R2 = − 0.09), which is in line with our H1. In both countries, however, the bivariate association between neighbourhood diversity and density of active CSOs is rather weak.
Multivariate Analysis
In the next step, to test H1 and H2 further, we explore whether neighbourhood diversity has an independent effect on civil society density after controlling for a range of neighbourhood level characteristics.
In the UK, OLS regression (Model 1, Table 1) with key socio-demographic neighbourhood level controls shows similar results to the bivariate findings, which suggests that there is no significant confounding between neighbourhood diversity and our key socio-demographic controls. In particular, neighbourhood level diversity is still positively associated with density of active CSOs, which is in contrast to our H1. In contrast, in Sweden (Table 2, Model 1), we see that higher diversity is associated with lower density of active CSOs, which is in line with our H1 and the patterns found in the bivariate analysis.
The UK, OLS model predicting density of active CSOs (per 1000 persons) in neighbourhoods (LSOA); Active only; England and Wales
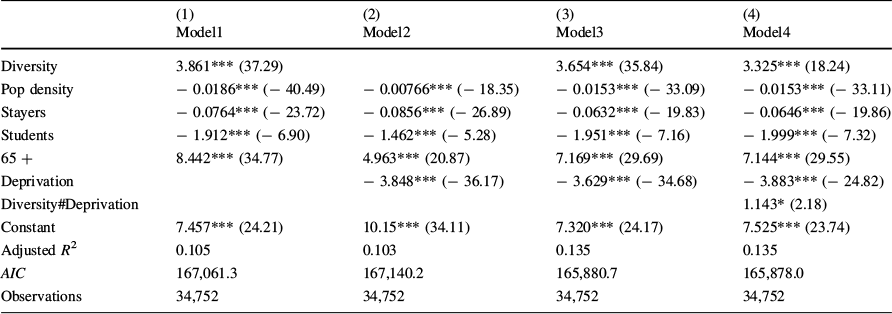
(1) |
(2) |
(3) |
(4) |
|
|---|---|---|---|---|
Model1 |
Model2 |
Model3 |
Model4 |
|
Diversity |
3.861*** (37.29) |
3.654*** (35.84) |
3.325*** (18.24) |
|
Pop density |
− 0.0186*** (− 40.49) |
− 0.00766*** (− 18.35) |
− 0.0153*** (− 33.09) |
− 0.0153*** (− 33.11) |
Stayers |
− 0.0764*** (− 23.72) |
− 0.0856*** (− 26.89) |
− 0.0632*** (− 19.83) |
− 0.0646*** (− 19.86) |
Students |
− 1.912*** (− 6.90) |
− 1.462*** (− 5.28) |
− 1.951*** (− 7.16) |
− 1.999*** (− 7.32) |
65 + |
8.442*** (34.77) |
4.963*** (20.87) |
7.169*** (29.69) |
7.144*** (29.55) |
Deprivation |
− 3.848*** (− 36.17) |
− 3.629*** (− 34.68) |
− 3.883*** (− 24.82) |
|
Diversity#Deprivation |
1.143* (2.18) |
|||
Constant |
7.457*** (24.21) |
10.15*** (34.11) |
7.320*** (24.17) |
7.525*** (23.74) |
Adjusted R 2 |
0.105 |
0.103 |
0.135 |
0.135 |
AIC |
167,061.3 |
167,140.2 |
165,880.7 |
165,878.0 |
Observations |
34,752 |
34,752 |
34,752 |
34,752 |
t statistics in parentheses
*P < 0.05, **P < 0.01, ***P < 0.001
Sweden, OLS model predicting density of active CSOs (per 1000 persons) in neighbourhoods (DeSO); Active only
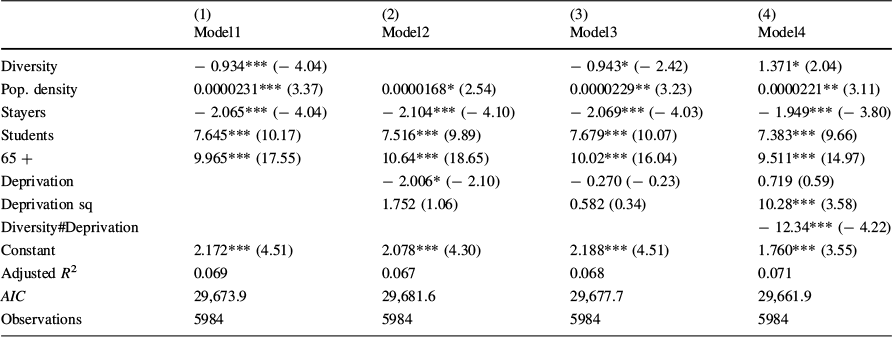
(1) |
(2) |
(3) |
(4) |
|
|---|---|---|---|---|
Model1 |
Model2 |
Model3 |
Model4 |
|
Diversity |
− 0.934*** (− 4.04) |
− 0.943* (− 2.42) |
1.371* (2.04) |
|
Pop. density |
0.0000231*** (3.37) |
0.0000168* (2.54) |
0.0000229** (3.23) |
0.0000221** (3.11) |
Stayers |
− 2.065*** (− 4.04) |
− 2.104*** (− 4.10) |
− 2.069*** (− 4.03) |
− 1.949*** (− 3.80) |
Students |
7.645*** (10.17) |
7.516*** (9.89) |
7.679*** (10.07) |
7.383*** (9.66) |
65 + |
9.965*** (17.55) |
10.64*** (18.65) |
10.02*** (16.04) |
9.511*** (14.97) |
Deprivation |
− 2.006* (− 2.10) |
− 0.270 (− 0.23) |
0.719 (0.59) |
|
Deprivation sq |
1.752 (1.06) |
0.582 (0.34) |
10.28*** (3.58) |
|
Diversity#Deprivation |
− 12.34*** (− 4.22) |
|||
Constant |
2.172*** (4.51) |
2.078*** (4.30) |
2.188*** (4.51) |
1.760*** (3.55) |
Adjusted R 2 |
0.069 |
0.067 |
0.068 |
0.071 |
AIC |
29,673.9 |
29,681.6 |
29,677.7 |
29,661.9 |
Observations |
5984 |
5984 |
5984 |
5984 |
t statistics in parentheses
*P < 0.05, **P < 0.01, ***P < 0.001
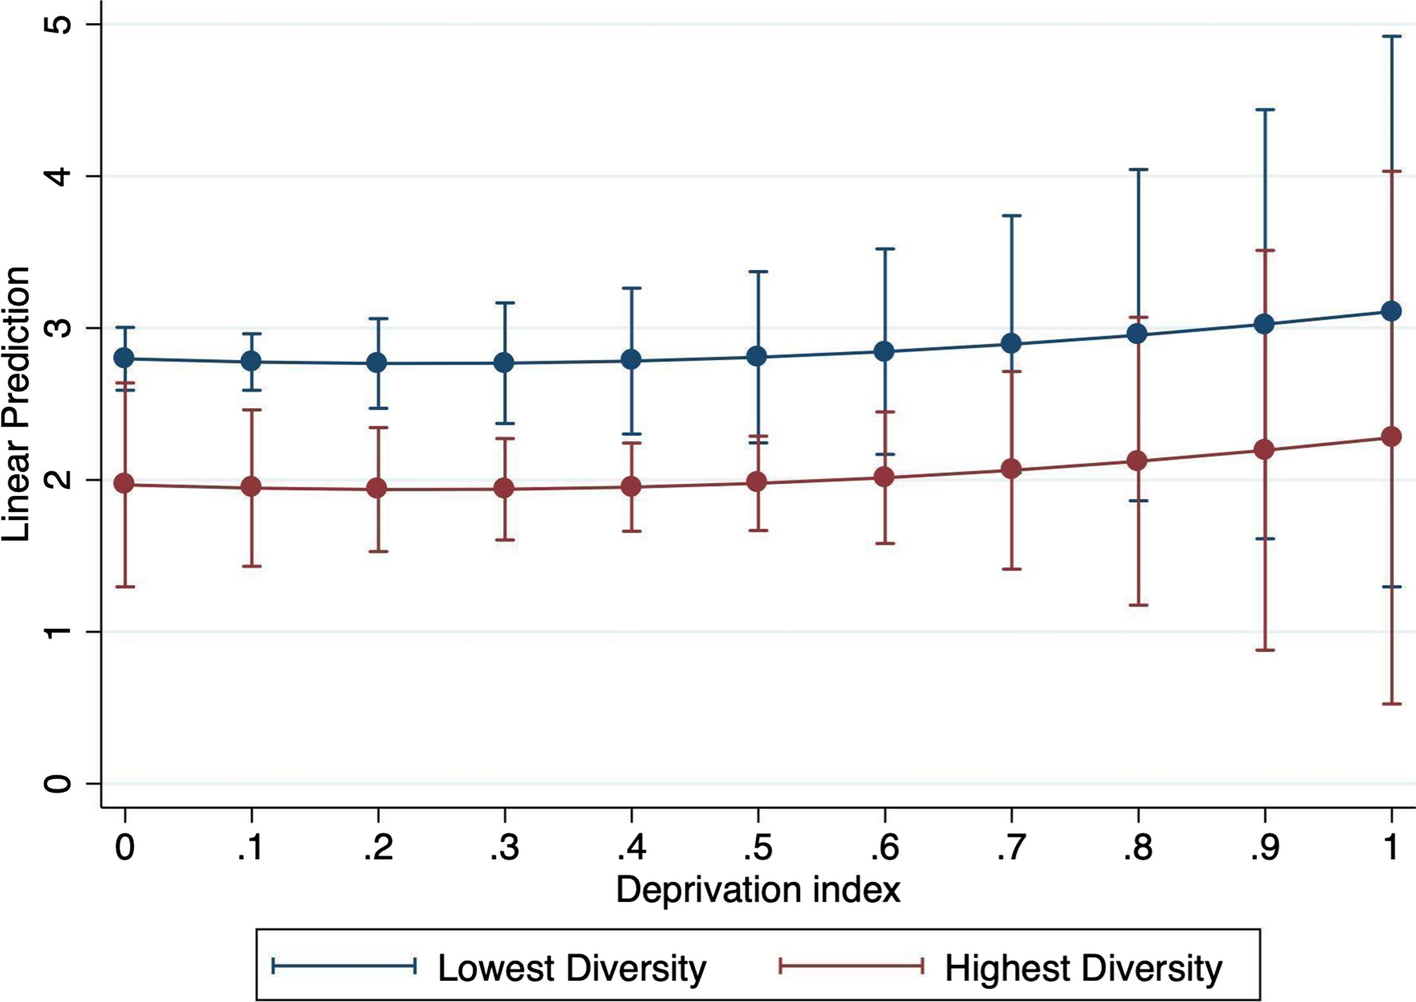
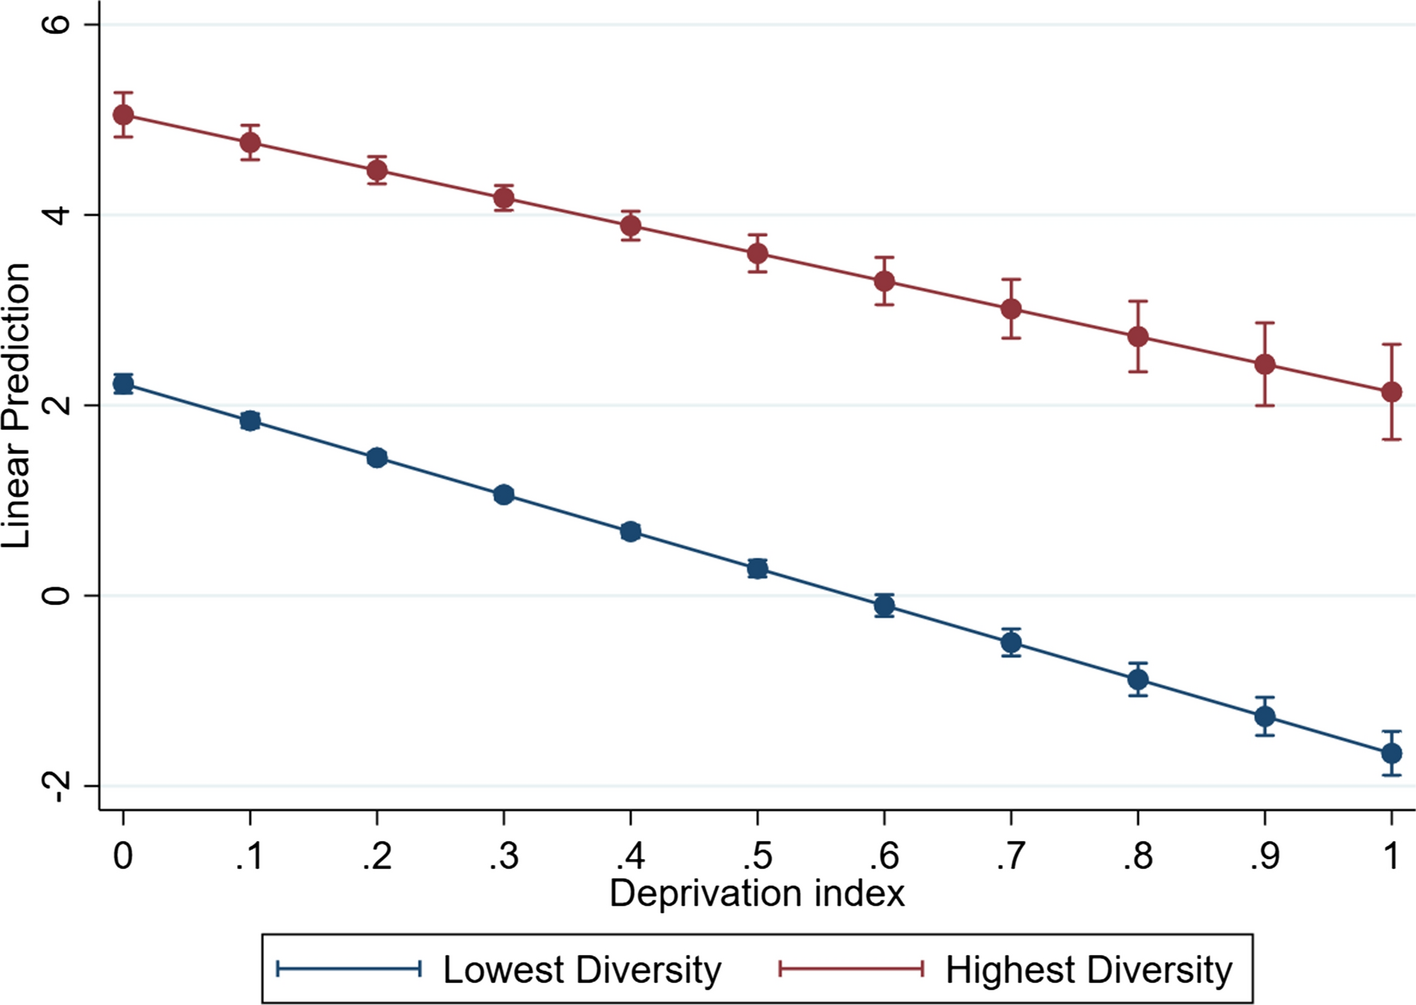
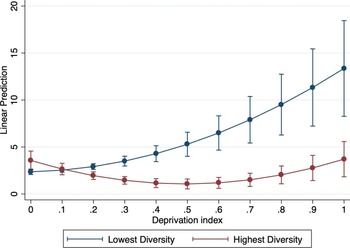
In Model 2 (Table 1 for the UK, Table 2 For Sweden), we analyse how deprivation is related to the density of active CSOs after key socio-demographic characteristics are controlled for. In the UK, deprivation has a negative effect; whereas in Sweden, the squared term of deprivation is non-significant and the linear term is significant at 0.05 level. In Model 3, we look at diversity and deprivation simultaneously to test the potential confounding effect between the two (H2). In the UK (Table 1), the effect of deprivation remains negative (in line with the past social capital literature) and the effect of diversity remains positive (in contrast to previous social capital literature and both our H1 and H2). The higher prevalence of organisations in diverse areas is shown in Fig. 1, where we see that neighbourhoods with high diversity have higher levels of predicted active CSO density in comparison to neighbourhoods with low diversity in both more and less deprived UK neighbourhoods. In Sweden (Table 2, Model 3), on the other hand, diversity is still negatively associated with CSO density, which is in contrast to our H2. The gap in the expected active CSO density in Sweden is illustrated in Fig. 2, where we see that higher diversity is associated with lower density of active CSOs; and that neighbourhoods with high and low deprivation have similar CSO density.
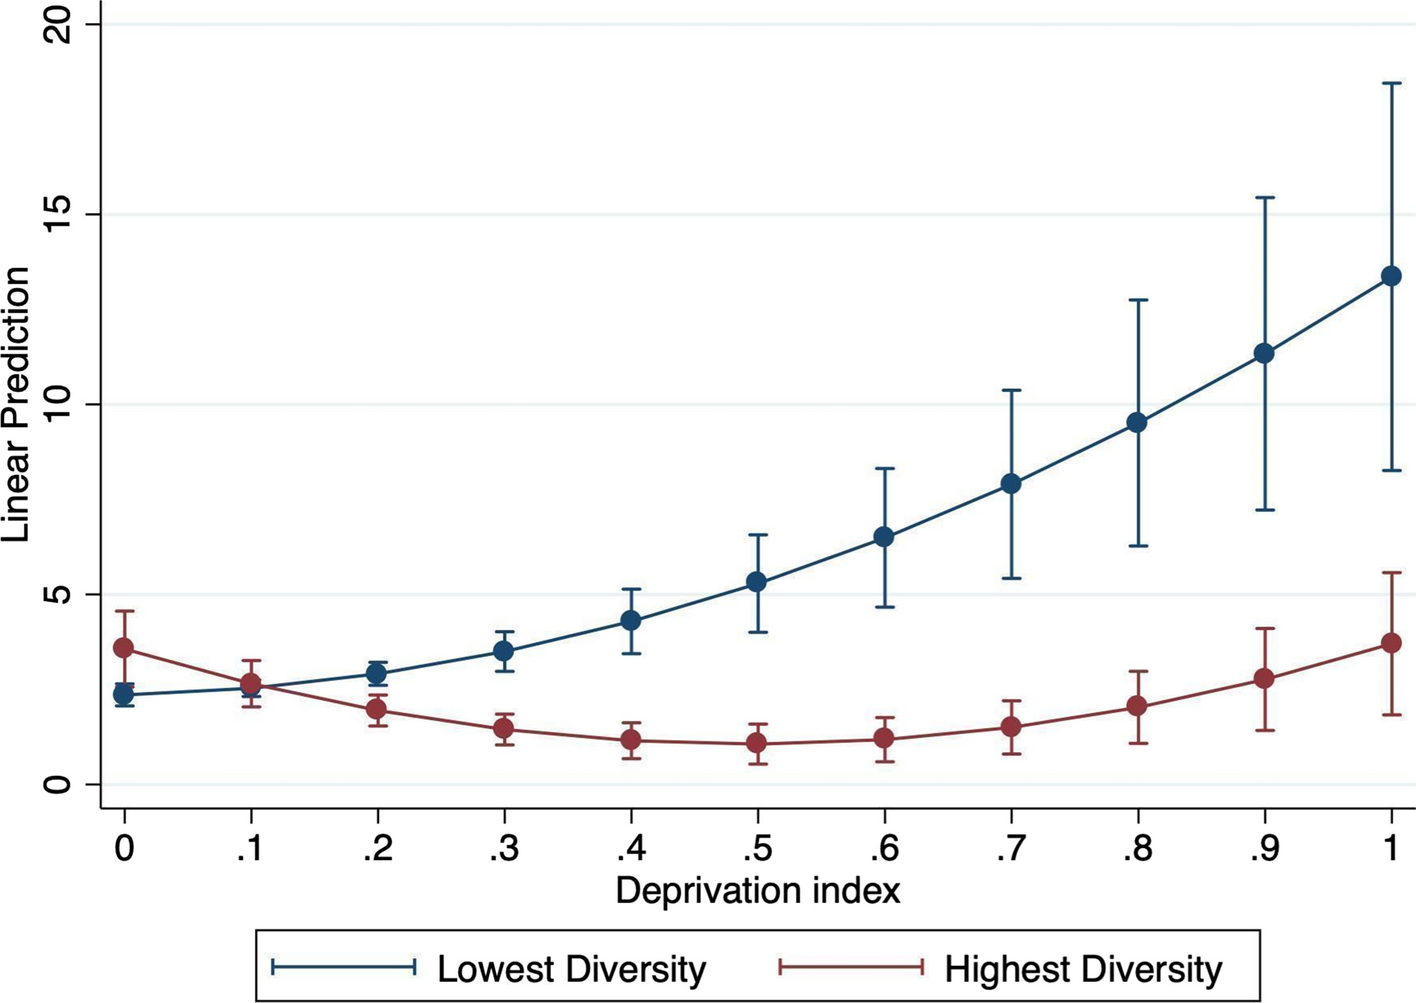
Predicted density of active CSOs per 1,000 persons in the UK by deprivation, based on Model 3

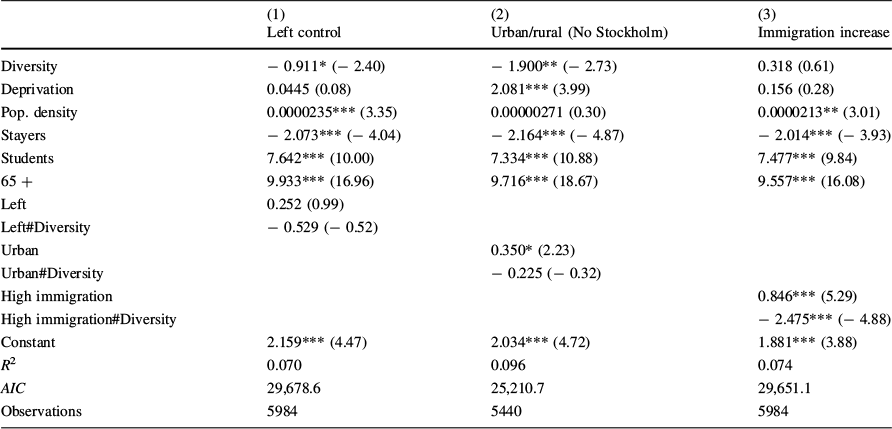
Predicted density of active CSOs per 1,000 persons in Sweden by deprivation, based on Model 3
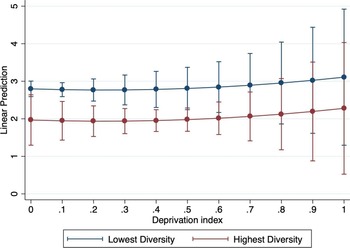
Lastly, in Model 4, we examine the interaction effect between diversity and deprivation. In the UK, the interaction effect is negligible (see Table 1 and Fig. 3). This means that deprivation has a similarly dampening effect on active CSO density in both diverse and non-diverse UK neighbourhoods and therefore, we find no support for our H3. In Sweden, however, the interaction term is statistically significant meaning that the effect of deprivation varies depending on the level of diversity (Model 4, Table 2). As illustrated in Fig. 4, there is a non-linear relationship between deprivation and CSO density in the most diverse neighbourhoods. In diverse places, we observe a slightly higher predicted CSO density in the most and the least deprived neighbourhoods, compared to the neighbourhoods with medium levels of deprivation. However, there is a clear positive relationship between deprivation and CSO density in the most homogenous neighbourhoods, confirming the patterns from the bivariate analysis. Taken together, these results do not support our ‘double whammy’ hypothesis (H3) which predicted that the lowest density of CSOs should be found at the intersection of the highest diversity and highest deprivation. In contrast, we found that in Sweden (Fig. 4), the lowest density of CSOs is found in the most diverse neighbourhoods with the medium levels of deprivation; whereas in the UK, deprivation has equally negative effects in diverse and non-diverse neighbourhoods.
Predicted density of active CSOs per 1,000 persons in the UK by deprivation, based on Model 4
Predicted density of active CSOs per 1,000 persons in Sweden by deprivation, based on Model 4
Sensitivity Analysis
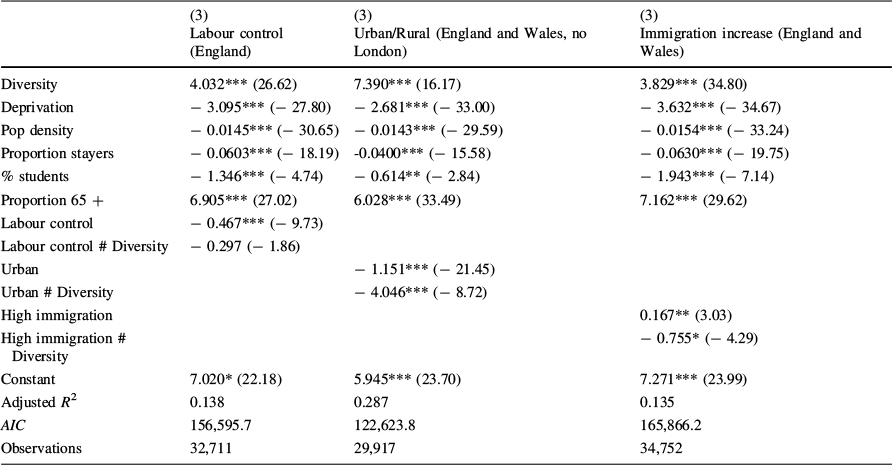
In this section, we describe three additional robustness checks which address the potential role of politics, urban–rural divide and recent changes of immigrant share in shaping the diversity-civil society relationship. For instance, coalitions controlled by conservative and neo-liberal parties (generally considered as less supportive of pro-diversity initiatives) tend to invest less into financing civil society initiatives in deprived areas (Clifford, Reference Clifford2021; Odmalm, Reference Odmalm2007), which might discourage minority and immigrant organisations. On the other hand, minority civil society activity could be stronger in places with less favourable political climates because civic resources are deployed more where the need is greater (Morales & Giugni, Reference Morales and Giugni2011). Therefore, we could observe the positive relationship between diversity and CSO density to be stronger in either a more favourable political climate (funding argument) or in a less favourable one (greater need argument). Additionally, it could be that urban and rural areas differ in their ability to accommodate diversity. Cities are a natural point of entry for immigrants and minority CSOs are more likely to be established there. In rural contexts, neighbourhoods experiencing more recent increase in diversity could lack the means to establish civil society infrastructure. Similar to this point is the novelty of immigration argument. Areas which experienced particularly high levels of immigration in recent years could lack sufficient time to build capacity to address needs and challenges faced by an increasingly diverse population (Newman, Reference Newman2013). Therefore, we could observe a more negative relationship between diversity and density of active CSOs in both rural areas and in areas with a high recent increase in immigrant population.
First, to assess local political climate, we compile a list of local authorities (UK) and municipalities (Sweden) controlled by different political parties in 2018 and classify areas controlled by the left leaning parties (Labour party in the UK and Left coalitions as assessed by Municipalities and Regions Swedish authority) as those potentially more favourable for immigrant and ethnic minorities. Second, we divide neighbourhoods into rural or urban based on official classifications used in both countries. For the analysis of the urban–rural divide, we exclude the capital cities because they are likely to disproportionately drive the association for urban neighbourhoods. Finally, to assess the pace of immigration increase in an area, we use changes in the share of foreign-born at the local authority level in the UK between 2011 and 2016; and changes in the share of foreign-born between 2006 and 2016 in neighbourhoods in Sweden. We classify increase as high if it is above the median value for change.
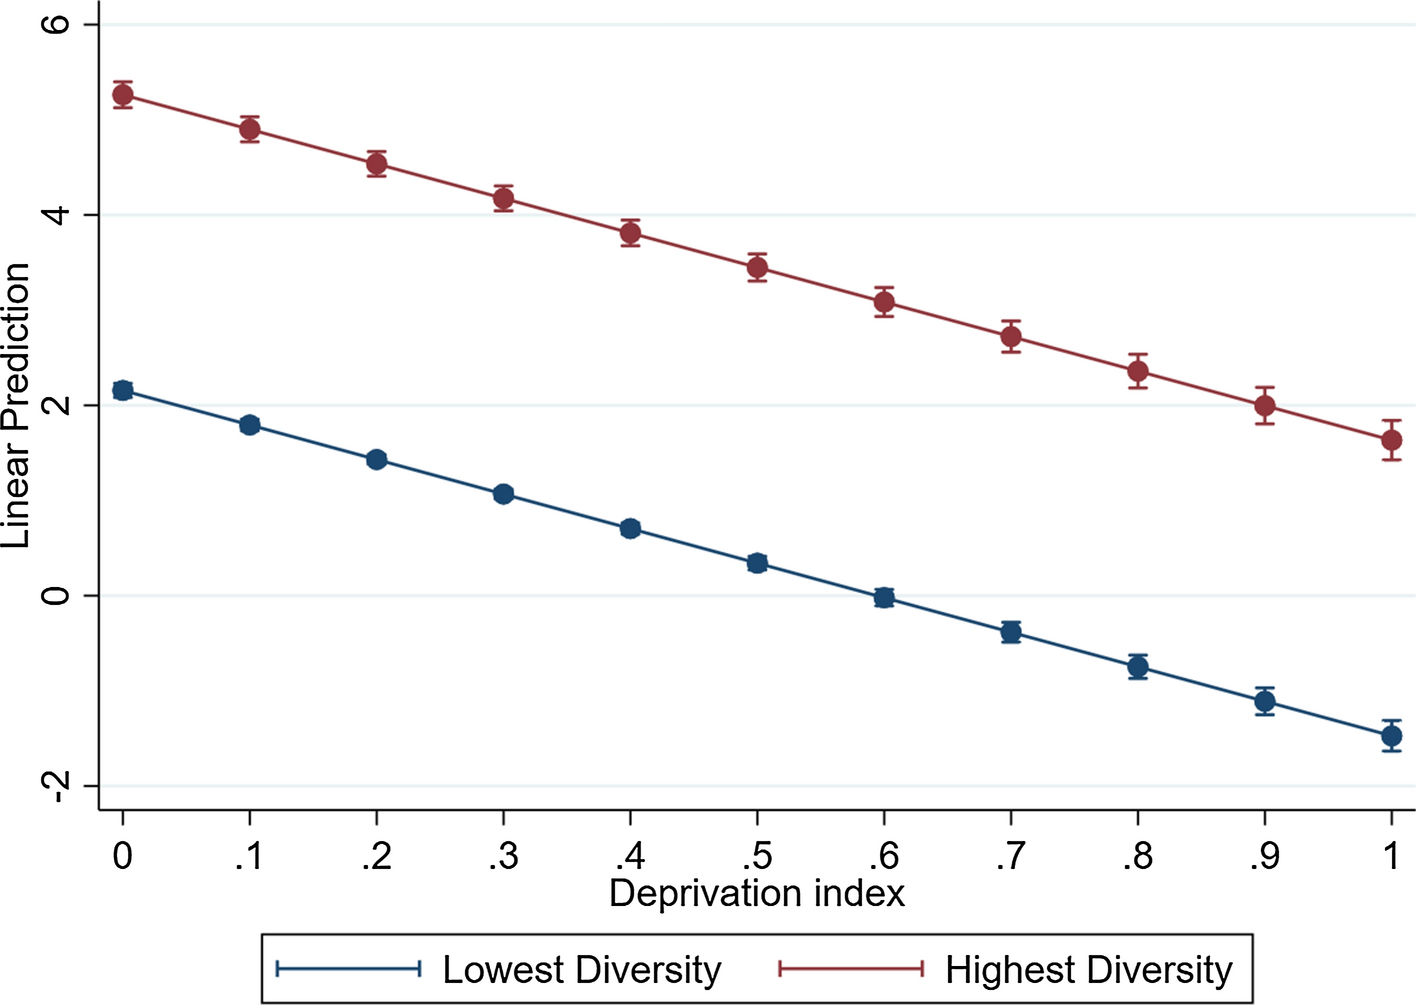
We run OLS models with interaction terms between diversity and a set of binary indicators of presence of left-leaning coalition, urbanity, and a high increase of foreign born residents. The results from the interaction analysis are shown in Tables 3 and 4. Overall, we see that the effect of diversity observed for all neighbourhoods in the UK and Sweden prevails regardless of the interactions with specific local area characteristics (except for the last model for Sweden), which suggests that regional differences are unlikely to have altered the results of our country level analysis. That said, the non-significant effect of diversity in the last model for Sweden (Table 4), suggests that the negative effect of diversity in Sweden might be primarily driven by areas that experienced a higher recent increase of foreign-born residents.
Sensitivity analysis for density of active CSOs per 1000 people in England and Wales

(3) |
(3) |
(3) |
|
|---|---|---|---|
Labour control (England) |
Urban/Rural (England and Wales, no London) |
Immigration increase (England and Wales) |
|
Diversity |
4.032*** (26.62) |
7.390*** (16.17) |
3.829*** (34.80) |
Deprivation |
− 3.095*** (− 27.80) |
− 2.681*** (− 33.00) |
− 3.632*** (− 34.67) |
Pop density |
− 0.0145*** (− 30.65) |
− 0.0143*** (− 29.59) |
− 0.0154*** (− 33.24) |
Proportion stayers |
− 0.0603*** (− 18.19) |
-0.0400*** (− 15.58) |
− 0.0630*** (− 19.75) |
% students |
− 1.346*** (− 4.74) |
− 0.614** (− 2.84) |
− 1.943*** (− 7.14) |
Proportion 65 + |
6.905*** (27.02) |
6.028*** (33.49) |
7.162*** (29.62) |
Labour control |
− 0.467*** (− 9.73) |
||
Labour control # Diversity |
− 0.297 (− 1.86) |
||
Urban |
− 1.151*** (− 21.45) |
||
Urban # Diversity |
− 4.046*** (− 8.72) |
||
High immigration |
0.167** (3.03) |
||
High immigration # Diversity |
− 0.755* (− 4.29) |
||
Constant |
7.020* (22.18) |
5.945*** (23.70) |
7.271*** (23.99) |
Adjusted R 2 |
0.138 |
0.287 |
0.135 |
AIC |
156,595.7 |
122,623.8 |
165,866.2 |
Observations |
32,711 |
29,917 |
34,752 |
t statistics in parentheses
*P < 0.05, **P < 0.01, ***P < 0.001
Sensitivity analysis for density of active CSOs per 1000 people in Sweden
(1) |
(2) |
(3) |
|
|---|---|---|---|
Left control |
Urban/rural (No Stockholm) |
Immigration increase |
|
Diversity |
− 0.911* (− 2.40) |
− 1.900** (− 2.73) |
0.318 (0.61) |
Deprivation |
0.0445 (0.08) |
2.081*** (3.99) |
0.156 (0.28) |
Pop. density |
0.0000235*** (3.35) |
0.00000271 (0.30) |
0.0000213** (3.01) |
Stayers |
− 2.073*** (− 4.04) |
− 2.164*** (− 4.87) |
− 2.014*** (− 3.93) |
Students |
7.642*** (10.00) |
7.334*** (10.88) |
7.477*** (9.84) |
65 + |
9.933*** (16.96) |
9.716*** (18.67) |
9.557*** (16.08) |
Left |
0.252 (0.99) |
||
Left#Diversity |
− 0.529 (− 0.52) |
||
Urban |
0.350* (2.23) |
||
Urban#Diversity |
− 0.225 (− 0.32) |
||
High immigration |
0.846*** (5.29) |
||
High immigration#Diversity |
− 2.475*** (− 4.88) |
||
Constant |
2.159*** (4.47) |
2.034*** (4.72) |
1.881*** (3.88) |
R 2 |
0.070 |
0.096 |
0.074 |
AIC |
29,678.6 |
25,210.7 |
29,651.1 |
Observations |
5984 |
5440 |
5984 |
t statistics in parentheses
*P < 0.05, **P < 0.01, ***P < 0.001
Discussion and Conclusions
Our point of departure was the “hunkering down” hypothesis predicting the negative impact of diversity on different forms of civicness, including the prevalence of formal CSOs. Our results show that the negative association between diversity and density of formal CSOs is not universal across different country contexts. In the UK, diversity is positively associated with the density of CSOs, whereas in Sweden the opposite is true. Additionally, in Sweden, the relationship between deprivation and CSO density seem to be moderated by the level of diversity. In homogenous neighbourhoods, deprivation appears positively related to CSO density; whereas in diverse neighbourhoods, there is no clear linear relationship between deprivation and CSO density after other neighbourhood level characteristics are accounted for. Taken together, we find no support for the “double whammy” hypothesis (H3) in the UK and weak evidence in favour of it in Sweden (present only in bivariate analysis). Instead, we find that, in the Swedish context, civil society infrastructure as measured by CSO density is particularly developed in deprived and homogenous neighbourhoods.
It is important to note that our analysis relies on official registers of civil society organisations, which miss out some important aspects of civil society such as everyday activism. For instance, Sampson (Reference Sampson2012) shows that the overlap between official registers of CSOs and everyday activism (including protest activism and collective action) is of moderate strength. Similarly, ethnographic studies of non-formal civil society reveal a wide range of initiatives that happen below the radar of civil society registers, especially in places where ethnic minority groups tend to be overrepresented (Soteri-Proctor and Alcock, Reference Scaramuzzino2012; Elgenius et al., Reference Elgenius, Phillimore, Borkowska and Kawalerowicz2022; Kings, Reference Kings2011). Additionally, using CSOs’ registered addresses as a proxy for area of operation is prone to a measurement error. For example, larger CSOs might register their offices in central urban locations, and smaller ones might register at private residential addresses of one of the members.
Despite the above limitations, we believe that our study provides some important insights. In light of our findings, we conclude that the relationship between diversity and density of CSOs is most likely affected by other factors such as national level contexts in which CSOs operate. Some of the key contextual factors that were likely to influence the relationship between diversity, deprivation, and density of CSOs in our case studies have been discussed in the “Civil society context in the UK and Sweden” section and are also summarised in Table A4 in the online Appendix. We believe that the two particularly important factors are: the dominant civil society tradition and types of CSOs; and the history and type of migration in the two countries. For example, in the UK, civil society has a strong tradition of addressing racial tensions and having an active ethnic minority non-for-profit sector since the 1960s. British ethnic minority organisations have long been recognised as important actors, often serving as a middleman between the state and minority communities (Bailey, Reference Bailey2020; Elgenius, Reference Elgenius, Jacobsson and Korolczuk2017). In Sweden, on the other hand, migrant or ethnic minority organisations have a lower prominence and less agency because of the importance of the state in shaping expectations about the role of such organisations (Frödin & Fredholm, Reference Frödin and Fredholm2021; Odmalm, Reference Odmalm2004). Additionally, the UK has a much longer tradition of diverse migration (including highly skilled and postcolonial migration) and has been minimally affected by the influx of refugees. On the other hand, Sweden has received a significant number of refugees from countries with a relatively low score of the UN Human Development Index (HDI) (Bevelander & Irastorza, Reference Bevelander and Irastorza2021), who do not have support networks in Sweden and usually face a language barrier upon arrival. The type of migrants, the shorter history of ethnic diversity in Sweden, and the somewhat tighter relationship between ethnic organisations and the state have likely negatively affected the ability of migrants to establish their own CSOs in diverse areas (especially without state support). In sum, our findings suggest that diversity and/or deprivation per se are not the main drivers that shape the distribution of CSOs. Instead, the country-specific contexts such as the tradition of civil society sectors, including the most prevalent types of organisations, and the nature of diversity shaped by migration history might be more important for determining the geographical distribution of CSOs.
Funding
Open access funding provided by Stockholm University. This research was supported by the Swedish Research Council for Health, Working Life and Welfare (FORTE) under grant number (grant number 2018-00181) and the Economic and Social Research Council (grant number ES/S012486/1).
Declarations
Conflict of interest
The authors have no conflicts of interest to declare that are relevant to the content of this article.
Ethical Approval
The authors comply with ethical standard outlined by the journal (Committee on Publication Ethics guidelines). We confirm that the manuscript is not under review at another journal, and that this work has not been published before.


 Open access