


Introduction
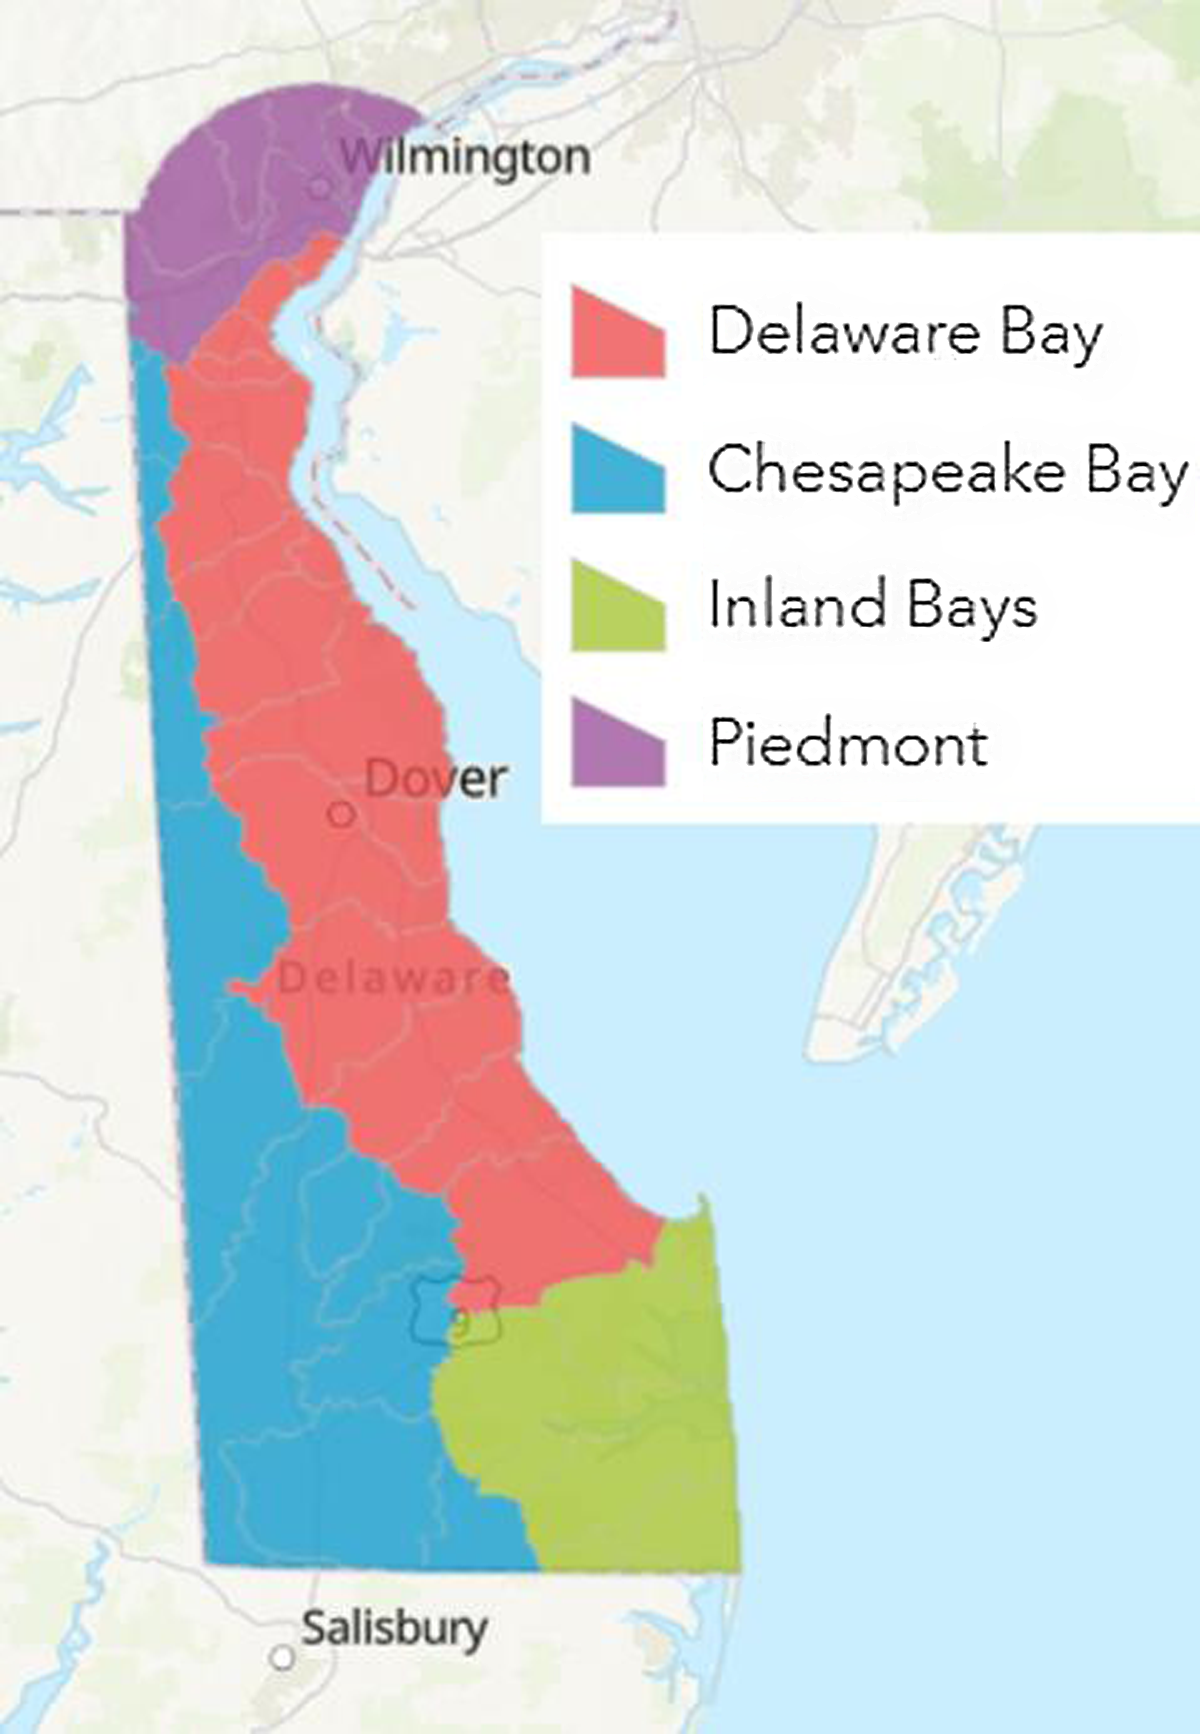
The state of Delaware is located on the eastern seaboard of the United States, bordering the states of Pennsylvania to the north, New Jersey to the northeast, and Maryland to the west and south. It is divided into four major water basins shown in the map in Fig. 1: Piedmont, Delaware Bay, Chesapeake Bay, and Inland Bays. The latter three are named for the water bodies into which their rivers flow. Recreational anglers from Delaware and the nearby states fish in the waters in all four of these basins for warmwater fish such as bass, carp, catfish, sunfish, perch, and pickerel. There is also put-and-take (stocked) trout fishing at several streams and saltwater fishing in the Atlantic Ocean, Delaware Bay, and several inland bays. This analysis focuses on the warmwater fishing in the state.
Delaware water basins.
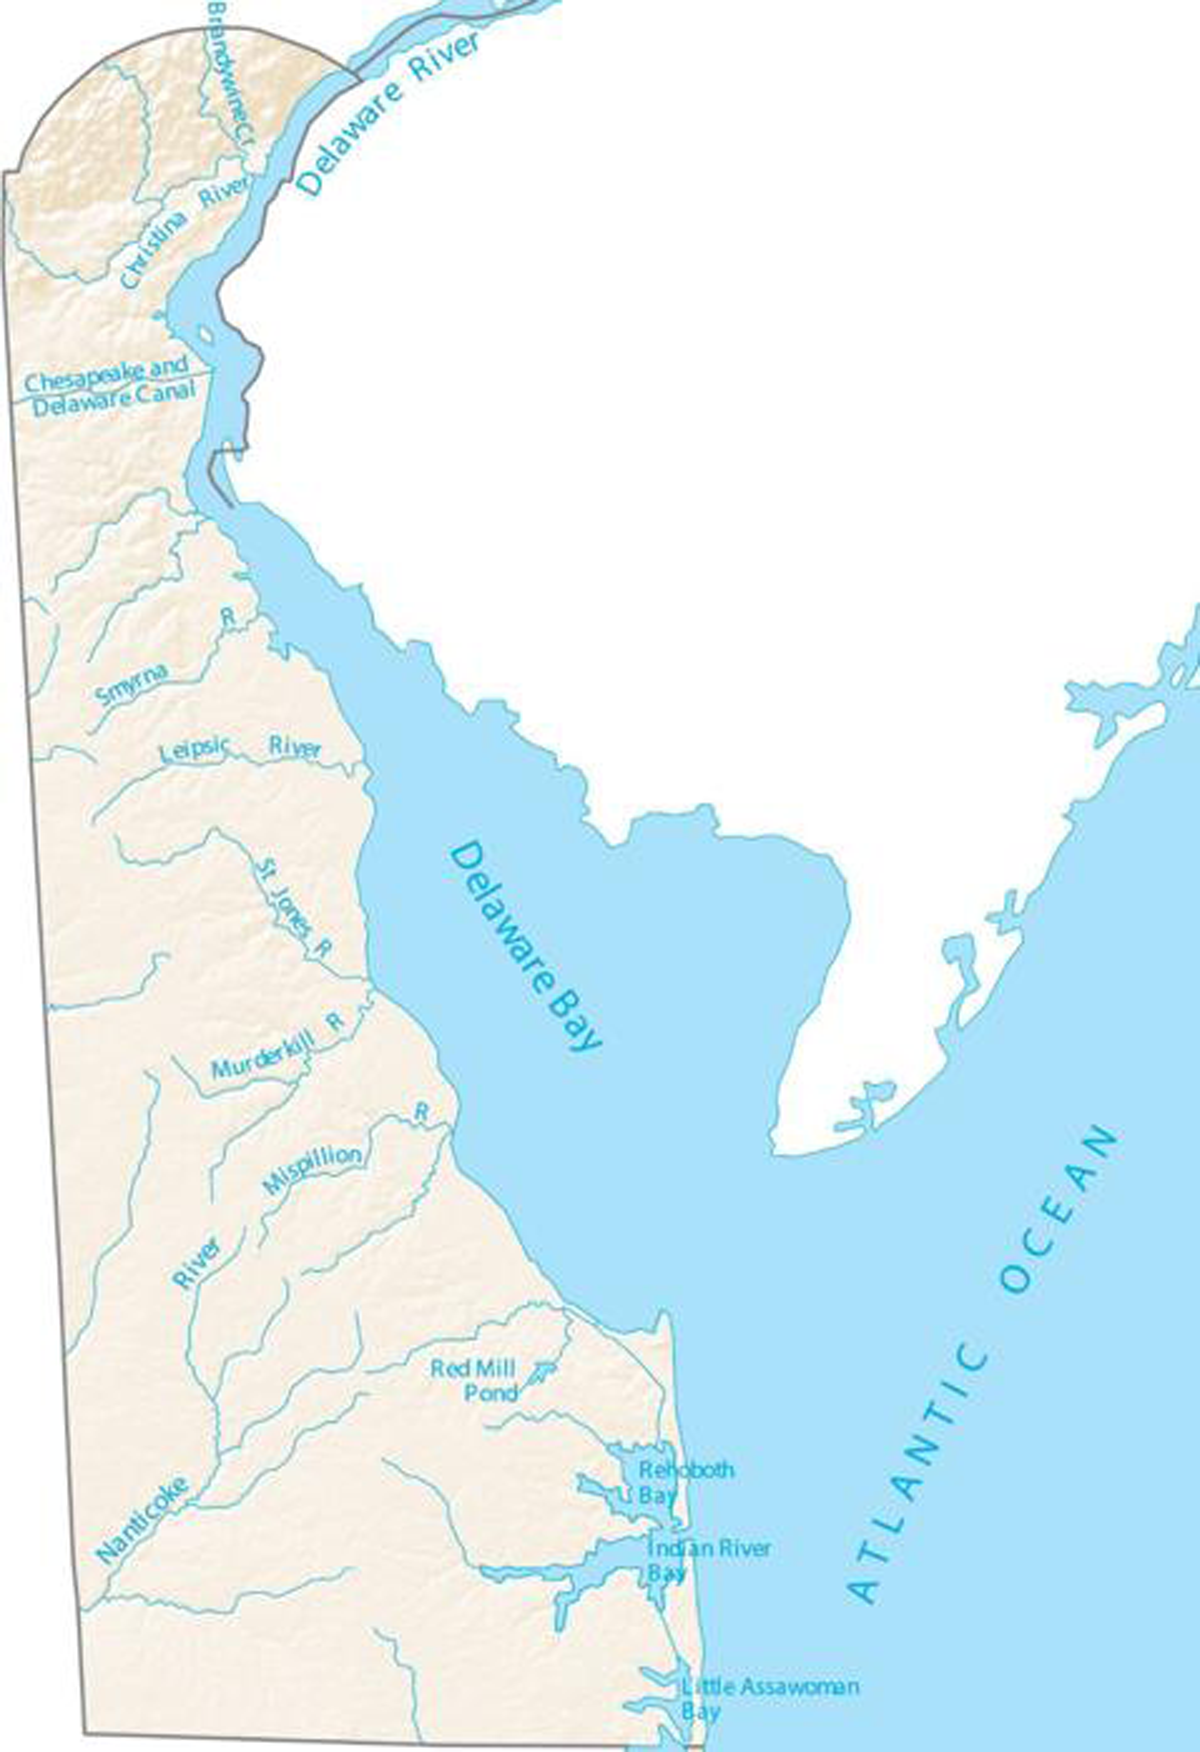
In 2018 (the year of our analysis), about 82,000 people held recreational fishing licenses to fish legally in the state. There are over one hundred water bodies for warmwater fishing including ponds, rivers, and streams. The better-known ponds include Becks, Lums, and Trap Ponds. Sheerness Pond in the center of the state is the largest at 250 acres. Figure 2 is a map of the major rivers.
Major rivers in Delaware.
The freshwater bodies are managed by the Delaware Division of Fish & Wildlife (DFW). DFW surveys the angler population every five years Apni) to learn where people are fishing and what they are catching. This paper is an analysis of that survey data to provide economic content for their management decisions (Stetzar et al. Reference Stetzar, Newlin and Glanden2019). Specifically, our purpose is to estimate a recreation demand model and then use the model to estimate the benefits associated with improvements in fishing conditions that might be realized through resource management and restoration decisions. These include actions that might improve the catch of fish (through habitat management, water quality improvements, etc.), increase the diversity of species (introduced species, or expansion of species through habitat management, etc.), improve access (added boat ramps), and/or improve the appearance of the water (pollution control measures to reduce sediments and algae growth). The model will accommodate valuation of these types of outcomes for comparison to costs and can do so on a waterbody-specific or subbasin-specific basis.
Economists have been studying recreational fishing demand using the travel cost model for decades (for an early example see Vaughan and Russell (Reference Vaughan and Russell1982)). RUM models are mostly commonly used for valuing quality changes like fishing since they explicitly set up angler choice as being among sites with varying quality levels and thereby reveal values for those different levels of quality. Melstrom et al. (Reference Melstrom, Lupi, Esselman and Stevenson2015) provide a nice discussion of RUM applications for freshwater fishing, which includes a table with a list of other studies. Train (Reference Train1998) is a nice application to the basic layout of the approach typically used. In these contexts, the RUM model is a model of the choice of where to go fishing or site choice. The attributes of sites that govern choice of site include a measure of travel cost and other important attributes such as size (acres, river miles, etc.), environmental quality, facilities present, regulations, land cover, fish quality, etc. Fishing quality can be measured as fish catch, fish presence/absence, fish abundance, biomass, stocking, etc. For some different examples of specification and attribute selection see Jones and Lupi (Reference Jones and Lupi2000), Parsons and Hauber (Reference Parsons and Hauber1998), Murdock (Reference Murdock2006), and Ji et al. (Reference Ji, Herriges and Kling2014). The fish quality variable equips the model for policy analysis related to fisheries management. In some applications, researchers will also account for the specific species of fish targeted. This can be done with separate species models or interactions of target with catch rate (Melstrom et al. Reference Melstrom, Lupi, Esselman and Stevenson2015). Sometimes researchers have modeled the choice of species along with site choice or even separate models by species. Recreational fishing studies have also been conducted in the context of measuring the benefits of water quality improvements (Tay and McCarthy Reference Tay and McCarthy1994) and the effects of fish consumption advisories (Jakus et al. Reference Jakus, Bevelhimer and Fly1997).
To account for trip frequency in RUM models of recreational fishing, two approaches have been used by researchers: linked and repeated choice. In the first, a multinomial logit model in one of its many forms is used for modeling the site choice, and a count data trip frequency model is appended to this model to account for the number of trips (Hausman et al. Reference Hausman, Leonard and McFadden1995, Parsons et al. Reference Parsons, Kang, Leggett and Boyle2009). The second approach is repeated choice model which incorporates nonparticipation as an alternative in a choice set (Lew and Larson Reference Lew and Larson2011). Mathematically the two approaches have been shown to be nearly the same (Parsons et al. Reference Parsons, Jakus and Tomasi1999). We used the linked version here.
Our contribution to this literature is to show that rather sophisticated models of fishing behavior, which have been developed over the past three decades, can be estimated using data conventionally gathered by state agencies and then, in turn, be used to assist in the management of fisheries. We expect many states to have similar data, can estimate like models, and can begin to redesign their surveys for even more sophisticated economic models. Still, much can be done with rather typical “where fished” and “what caught” data and that is our message.
As just noted, we use a linked site choice – trip frequency recreation demand model. The site choice portion of the model is a Travel Cost Random Utility Maximization Model, and the trip-frequency portion is a Count Data Negative Binomial Model. Our response data includes trip information from 1961 anglers with a choice set of 118 rivers, streams, and ponds. The focus is on warmwater fishing (bass, perch, etc.) and the model has three key policy variables around which we consider several welfare scenarios – catch rate of fish, diversity of species (number of different species at a site), and water clarity. We begin by laying out our model, then we discuss the data and present results.
The linked model
The site choice portion of our model is a Random Utility Maximization (RUM) Model and considers where an angler goes fishing as a function of the characteristics of the site and trip cost to reach the site. The trip-frequency portion of the model is a Count Data Negative Binomial (NB) Model and considers how often an angler goes fishing as a function of the characteristics of the respondent and an inclusive value, which is a composite measure capturing the overall quality of the sites in a respondent’s choice set including the cost of reaching the sites. The inclusive value is constructed from the site choice stage of the model. We lay out the RUM and NB Models in turn below.
Site choice model
In our Site Choice Model, we assume an angler has decided to make a fishing trip and is deciding which fishing site to visit. Each angler
 $i$
(
$i$
(
 $i = 1,2, \ldots, N)$
has a set of
$i = 1,2, \ldots, N)$
has a set of
 $\;J$
sites
$\;J$
sites
 $\left( {j = 1,2, \ldots, \;J} \right)$
from which to choose on each choice occasion (a day) in a season. A trip to site
$\left( {j = 1,2, \ldots, \;J} \right)$
from which to choose on each choice occasion (a day) in a season. A trip to site
 $j$
gives angler
$j$
gives angler
 $i$
a site utility
$i$
a site utility
 ${U_{ij}}$
. Utility takes the form
${U_{ij}}$
. Utility takes the form
 $${U_{ij}} = {V_{ij}}\left( {{Q_{ij}}} \right) + {e_{ij}}$$
 ${Q_{ij}}$
is a vector of site j’s characteristics perceived by person i and believed to affect the quality of a person’s visit to the site. In our models
${Q_{ij}}$
is a vector of site j’s characteristics perceived by person i and believed to affect the quality of a person’s visit to the site. In our models
 ${Q_{ij}}$
includes trip cost, type of site, fish catch, diversity of species, and other attributes.
${Q_{ij}}$
includes trip cost, type of site, fish catch, diversity of species, and other attributes.
 ${V_{ij}}$
is the “observable” part of an angler’s utility (to the researcher that is) and
${V_{ij}}$
is the “observable” part of an angler’s utility (to the researcher that is) and
 ${e_{ij}}$
is the “unobservable” part of utility. We assume a person chooses the site that gives maximum utility, so the theory of choice for each respondent
${e_{ij}}$
is the “unobservable” part of utility. We assume a person chooses the site that gives maximum utility, so the theory of choice for each respondent
 $i$
is Max{
$i$
is Max{
 ${V_{i1}}\left( {{Q_{i1}}} \right) + {e_{i1}}$
, ……,
${V_{i1}}\left( {{Q_{i1}}} \right) + {e_{i1}}$
, ……,
 ${V_{iJ}}\left( {{Q_{iJ}}} \right) + {e_{iJ}})$
}. Given the unobservable component of utility (
${V_{iJ}}\left( {{Q_{iJ}}} \right) + {e_{iJ}})$
}. Given the unobservable component of utility (
 ${e_{ij}}$
), this outcome (maximizing utility or choice of site) is stochastic from the perspective of researchers and can be expressed as a probability of visiting the chosen site. This probability has the form
${e_{ij}}$
), this outcome (maximizing utility or choice of site) is stochastic from the perspective of researchers and can be expressed as a probability of visiting the chosen site. This probability has the form
 $$Prob{\left( k \right)_i} = Prob({V_{ik}} + {e_{ik}} \gt {V_{ij}} + {e_{ij}})\;\forall ij$$
where
 $Prob{\left( k \right)_i}$
is the probability angler
$Prob{\left( k \right)_i}$
is the probability angler
 $i$
chooses site k. Each angler then has a
$i$
chooses site k. Each angler then has a
 $Prob{\left( k \right)_i}$
for each site in his/her choice set. If we assume the error terms are independently and identically distributed as a type I extreme value variate, then we have the well-known multinomial logit model (McFadden 1974) for this probability
$Prob{\left( k \right)_i}$
for each site in his/her choice set. If we assume the error terms are independently and identically distributed as a type I extreme value variate, then we have the well-known multinomial logit model (McFadden 1974) for this probability
 $$Prob{\left( k \right)_i} = {{exp\left( {{V_{ik}}} \right)} \over {\sum\nolimits_{j = 1}^J e xp({V_{ij}})}}$$
If we assume the observable part of the utility function is linear in the site attributes, we have
 ${V_{ij}} = \alpha t{c_{ij}} + \beta {x_j}$
, where
${V_{ij}} = \alpha t{c_{ij}} + \beta {x_j}$
, where
 $t{c_{ij}}\;$
is angler
$t{c_{ij}}\;$
is angler
 $i$
’s trip cost for reaching site j and
$i$
’s trip cost for reaching site j and
 ${x_j}$
is a vector of other attributes believed to matter in anglers’ choice. Again,
${x_j}$
is a vector of other attributes believed to matter in anglers’ choice. Again,
 ${x_j}$
includes things like fish catch rate, species diversity, clarity of the water, ease of access, etc. Using equation (3) and the linear form for site utility gives the likelihood of observing the pattern of visits realized in our data set is
${x_j}$
includes things like fish catch rate, species diversity, clarity of the water, ease of access, etc. Using equation (3) and the linear form for site utility gives the likelihood of observing the pattern of visits realized in our data set is
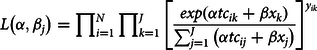 $$L\left( {\alpha, {\beta _j}} \right) = \prod\nolimits_{i = 1}^N{\prod\nolimits_{k = 1}^J {{{\left[ {{{exp\left( {\alpha t{c_{ik}} + \beta {x_k}} \right)} \over {\sum\nolimits_{j = 1}^J {\left( {\alpha t{c_{ij}} + \beta {x_j}} \right)} }}} \right]}^{{y_{ik}}}}} } $$
where
 ${y_{ik}} = 1$
if person
${y_{ik}} = 1$
if person
 $i$
visits site
$i$
visits site
 $k$
,
$k$
,
 ${y_{ik}} = 0$
otherwise. The parameters in the utility function are estimated by choosing the values of
${y_{ik}} = 0$
otherwise. The parameters in the utility function are estimated by choosing the values of
 $\alpha, \;\beta $
that maximize this likelihood function or, put differently, that maximize that likelihood of predicting the patterns of visits observed. Then using the estimated parameters, we can construct a person
$\alpha, \;\beta $
that maximize this likelihood function or, put differently, that maximize that likelihood of predicting the patterns of visits observed. Then using the estimated parameters, we can construct a person
 $i$
’s expected utility of a fishing trip on a given choice occasion as (see Train (Reference Train2009, p. 55))
$i$
’s expected utility of a fishing trip on a given choice occasion as (see Train (Reference Train2009, p. 55))
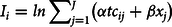 $${I_i} = ln\mathop \sum \nolimits_{j = 1}^J \left( {\alpha t{c_{ij}} + \beta {x_j}} \right)$$
This is sometimes referred to as an inclusive value or log-sum. It is used to “link” the site choice model to the trip frequency to which we turn now.
Trip frequency model
The site choice model considers an angler’s choice of site on a given choice occasion given we know that angler is taking a trip. The Trip Frequency Model considers the total number of trips a person makes over a season. In this way, when we consider fishing-quality improvements, we can account for both changes in the site chosen (perhaps shifting to a fishing-quality-improved site) and the number of trips taken in a season (perhaps increasing the number of trips if the chance of catching fish is better).
Following Hausman et al. (Reference Hausman, Leonard and McFadden1995), we consider a Trip Frequency Model with the form
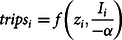 $$trip{s_i} = f\left( {{z_i},{{{I_i}} \over { - \alpha }}} \right)$$
where
 $trip{s_i}$
is the number of fishing trips taken by person
$trip{s_i}$
is the number of fishing trips taken by person
 $i$
over the season,
$i$
over the season,
 ${z_i}$
is a vector of respondent characteristics (income, age), and
${z_i}$
is a vector of respondent characteristics (income, age), and
 ${I_i}$
is the expected utility of a fishing trip estimated from the site choice model (the log-sum term in equation (5)). We divide the log-sum by −
${I_i}$
is the expected utility of a fishing trip estimated from the site choice model (the log-sum term in equation (5)). We divide the log-sum by −
 $\alpha $
, the travel cost coefficient in the choice model. This converts the inclusive value to monetary terms – so we have the expected value of a trip. This is a simple monotonic transformation that only changes the interpretation of the coefficient. A respondent’s value of a fishing trip will increase as the fishing sites quality and count of fishing nearby increases; therefore, we expect
$\alpha $
, the travel cost coefficient in the choice model. This converts the inclusive value to monetary terms – so we have the expected value of a trip. This is a simple monotonic transformation that only changes the interpretation of the coefficient. A respondent’s value of a fishing trip will increase as the fishing sites quality and count of fishing nearby increases; therefore, we expect
 $trip{s_i}$
to increase with
$trip{s_i}$
to increase with
 ${I_i}/\! \!-\! \alpha $
(see Parsons et al. Reference Parsons, Kang, Leggett and Boyle2009 for a discussion and graph). Given that trips are inherently measured as counts or integers, we use a count data model to estimate equation (6). We assume (6) has the form
${I_i}/\! \!-\! \alpha $
(see Parsons et al. Reference Parsons, Kang, Leggett and Boyle2009 for a discussion and graph). Given that trips are inherently measured as counts or integers, we use a count data model to estimate equation (6). We assume (6) has the form
 $$E(trip{s_i}) = {\mu _i} = exp\left\{ {\gamma {z_i} + \delta \left( {{I_i}/ \!\!-\! \alpha } \right)} \right\}$$
and then using a Negative Binomial form we have
 $$trip{s_{ij\;}}\sim NB(trip{s_{i\;}}|\;{\mu _j},\theta ) = {{{\it \Gamma} \left( {trip{s_{i\;}} + \;\theta } \right)} \over {{\it \Gamma} \left( \theta \right){\it \Gamma} (trip{s_{j\;}} + \;{\it 1})}} \cdot {\left( {{\theta \over {{\mu _i} + \;\theta }}} \right)^\theta } \cdot {\left( {{{{\mu _i}} \over {{\mu _i} + \;\theta }}} \right)^{{\mu _i}}}$$
where
 $\theta $
is the dispersion parameter controlling for overdispersion,
$\theta $
is the dispersion parameter controlling for overdispersion,
 ${\mu _j}$
is the expected number of trips defined by our trip equation (7) and the variance is
${\mu _j}$
is the expected number of trips defined by our trip equation (7) and the variance is
 ${\mu _j}\left( {1 + a{\mu _j}} \right),$
where
${\mu _j}\left( {1 + a{\mu _j}} \right),$
where
 $a = {1 \over \theta }$
. This is a Negbin 2 version of the Negative Binomial (Cameron and Trivedi Reference Cameron and Trivedi1986). Using a Negative Binomial instead of the simpler Poisson allows us to relax the constraint of the mean equaling the variance for the distribution of trips. When we tested for this in the data, the equality was rejected.
$a = {1 \over \theta }$
. This is a Negbin 2 version of the Negative Binomial (Cameron and Trivedi Reference Cameron and Trivedi1986). Using a Negative Binomial instead of the simpler Poisson allows us to relax the constraint of the mean equaling the variance for the distribution of trips. When we tested for this in the data, the equality was rejected.
Welfare effects of improved fishing
We consider several scenarios for improving the quality of fishing in our model. We refer to the improved fishing-quality scenarios as small, medium, and large improvements in site quality. These involve improving the catch rate of fish, diversity of species of fish, and clarity of the water. We will describe these in detail in our results section. We report seasonal per person and aggregate welfare measures (scaled to the population).
A per-trip value for an improvement in site quality is the log-sum difference from our site choice model
 $$\Delta {w_i} = \left\{ {ln\;\Big(\mathop \sum \nolimits_{j = 1}^J exp\Big( {\alpha t{c_{ij}} + \beta x_j^*} \Big) - ln\;\Big(\mathop \sum \nolimits_{j = 1}^J exp\Big( {\alpha t{c_{ij}} + \beta {x_j}} \Big)} \right\}/ \!- \!\alpha $$
where
 $x_j^*$
is a vector of site attributes where the improvements are realized, which can be one or more attributes over any subset or full set of sites (Train Reference Train2009, p. 56). The log-sum difference is equal to the difference in the expected utility of a trip with the improvement (
$x_j^*$
is a vector of site attributes where the improvements are realized, which can be one or more attributes over any subset or full set of sites (Train Reference Train2009, p. 56). The log-sum difference is equal to the difference in the expected utility of a trip with the improvement (
 $x_j^*$
) and without the improvement (
$x_j^*$
) and without the improvement (
 ${x_j}$
). From equation (5), we can also see that equation (9) is
${x_j}$
). From equation (5), we can also see that equation (9) is
 $\left\{ {I_i^* - {I_i}} \right\}/ \!- \!\alpha $
, where
$\left\{ {I_i^* - {I_i}} \right\}/ \!- \!\alpha $
, where
 $I_i^* = ln\;\Big(\mathop \sum \nolimits_{j = 1}^J exp\Big( {\alpha t{c_{ij}} + \beta x_j^*} \Big)$
. We estimate this value for every respondent for every trip across all scenarios.
$I_i^* = ln\;\Big(\mathop \sum \nolimits_{j = 1}^J exp\Big( {\alpha t{c_{ij}} + \beta x_j^*} \Big)$
. We estimate this value for every respondent for every trip across all scenarios.
The per-trip values are converted to seasonal values by multiplying
 $\Delta {w_i}$
by the total number of trips a person takes plus any additional trips associated with the improvement. The trip frequency model predicts the increase in trips. Following Parsons et al. (Reference Parsons, Kang, Leggett and Boyle2009) our seasonal measure has the form
$\Delta {w_i}$
by the total number of trips a person takes plus any additional trips associated with the improvement. The trip frequency model predicts the increase in trips. Following Parsons et al. (Reference Parsons, Kang, Leggett and Boyle2009) our seasonal measure has the form
 $$\Delta {W_i} = \left\{ {\Delta {w_i} \cdot trip{s_i}} \right\} + \left\{ {{1 \over 2} \cdot \Delta {w_i} \cdot \left( {trips_i^* - trip{s_i}} \right)} \right\}$$
The first term in the brackets on the right-hand side of this expression is the increased value of existing trips due to water quality improvements and the second term is the value associated with the change in number of trips taken. The first term on the right-hand side is the value researchers report if they do not incorporate a trip-frequency portion model. For all the scenarios we also report aggregate estimates in annual terms statewide, which arete
 $\Delta A = {L \over N}.\left\{ {\sum\nolimits_{i = 1}^N \Delta {W_i}} \right\}$
, where
$\Delta A = {L \over N}.\left\{ {\sum\nolimits_{i = 1}^N \Delta {W_i}} \right\}$
, where
 $L$
is the number of licensed anglers and
$L$
is the number of licensed anglers and
 $N$
is the number of anglers in our sample (participants and nonparticipants).
$N$
is the number of anglers in our sample (participants and nonparticipants).
Survey, sampling, and data
Survey and sampling
Our data are from the 2018 Delaware Freshwater Fishing Survey. The survey is conducted every five years (since 1978) by the Delaware Division of Fish and Wildlife (DFW). The survey is sent to a random sample of Delaware recreational fishing license holders. It includes all recreational anglers with a Fishman’s Information Network number — residents and nonresidents. This is the universe of legal anglers in state waters. The survey gives the anglers the option to complete a paper or online version. The DFW provided us with 1,961 completed usable survey responses. They reported a response rate of 23%. See Stetzar et al. (Reference Stetzar, Newlin and Glanden2019) for details. For our purposes, the survey provides a count of trips taken by waterbody during 2018 and the total number of fish caught at each waterbody. This is the core information needed for our analysis. Respondents also reported their favorite species to target, months of fishing, and if they typically fish by boat or shore. The survey has no demographic questions.
Survey response data
Table 1 shows the breakdown of fishing by type of fishing. Warmwater fishing is the most popular with nearly half of license holders taking at least one warmwater fishing trip in 2018. This is followed by 32% participating in saltwater fishing and 11% participating in cold-water fishing. Footnote 1 Respondents’ age and income are shown in Table 2. Since income is not reported in the survey we use the mean income of households in the respondent’s zip code as a proxy. This is the extent of the demographic data in the survey. We include all anglers from Delaware and its bordering states in the analysis – Maryland, New Jersey, Pennsylvania, and Virginia. These states are within driving distance for a day trip and account for over 95% of the anglers. As shown in Table 3, 75% of the warmwater anglers are from Delaware.
Type of fishing in Delaware in 2018*
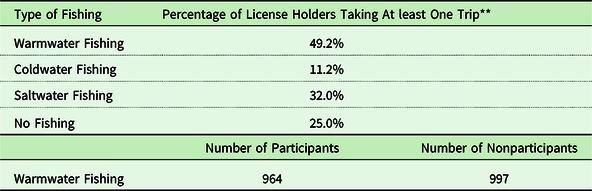
* The sample population is all persons holding Delaware fishing licenses in 2018.
** 102 anglers (5%) participated in both warmwater and cold-water fishing.
Survey respondent characteristics in 2018
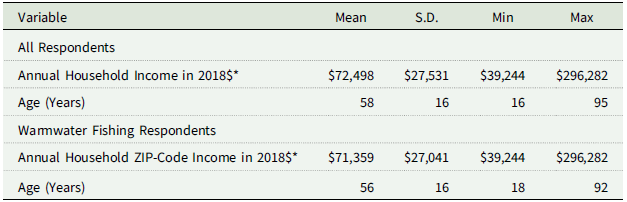
* The household income data is obtained from the IRS Statistics of Income website using the anglers’ residence zip codes (https://www.irs.gov/statistics/soi-tax-stats-statistics-of-income).
Respondent distribution by state of residence in 2018
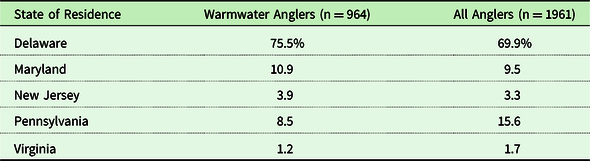
Note: Warmwater anglers include all respondents who took at least one warmwater fishing trip.
All anglers include all license holders in 2018.
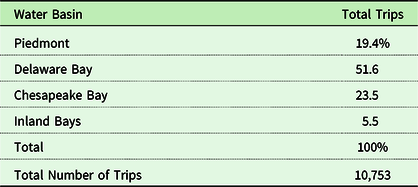
Our analysis includes participants (anglers who went warmwater fishing in 2018) and nonparticipants (anglers who held a Delaware fishing license but did not go warmwater fishing in 2018). As shown at the bottom of Table 1, about half of the sample are warmwater fishing participants. The other half are anglers who went saltwater or cold-water fishing only or who did not go fishing in 2018. Table 4 is a frequency distribution of the number of trips taken to go warmwater fishing conditioned on an angler taking at least one warmwater trip. As shown 48% took less than five trips. About 33% took between 5 and 20 trips and 18% took more than 20 trips. Table 5 is a frequency distribution of where anglers went fishing by water basin. The basins are shown in Fig. 1. The Delaware Bay Water Basin is the most popular destination with 52% of all trips followed by the Chesapeake Bay Water Basin with 24%. About 60% of the population of Delaware lives in the Piedmont Water Basin in the north where the City of Wilmington is located.
Annual trip frequency of fishing in 2018
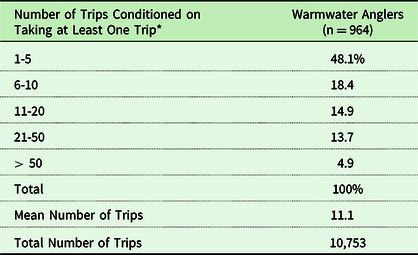
* As shown in Table 1, about half of all respondents are nonparticipants in warmwater fishing.
Distribution of warmwater fishing trips by water basin in 2018
Trip cost data
Trip cost is the “price” of a trip. We define trip cost as the sum of out-of-pocket travel cost and time cost for an angler to reach and return home from a fishing site, which is the convention in travel cost demand studies. More specifically, the trip cost for the individual
 $i$
visiting site
$i$
visiting site
 $j$
is defined as
$j$
is defined as
 $$TripCos{t_{ij}}\; = \;\left( {c \cdot dis{t_{ij}}} \right) + \left( {wag{e_i} \cdot tim{e_{ij}}} \right) + fe{e_j}$$
where
 $c$
is per mile vehicle cost,
$c$
is per mile vehicle cost,
 $dis{t_{ij}}$
is the round trip distance to site
$dis{t_{ij}}$
is the round trip distance to site
 $j$
for individual
$j$
for individual
 $i$
;
$i$
;
 $wag{e_i}$
is the individual
$wag{e_i}$
is the individual
 $i$
’s opportunity cost of an hour defined as
$i$
’s opportunity cost of an hour defined as
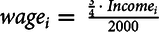 $wag{e_i} = \;{{{3 \over 4}\; \cdot \;Incom{e_i}} \over {2000}}$
;
$wag{e_i} = \;{{{3 \over 4}\; \cdot \;Incom{e_i}} \over {2000}}$
;
 $Incom{e_i}$
is individual
$Incom{e_i}$
is individual
 $i$
’s annual income;
$i$
’s annual income;
 $tim{e_{ij}}$
is a round trip travel time for individual
$tim{e_{ij}}$
is a round trip travel time for individual
 $i$
taking trip to site
$i$
taking trip to site
 $j$
; and
$j$
; and
 $fe{e_j}$
is the park entrance fee for site
$fe{e_j}$
is the park entrance fee for site
 $j$
.
$j$
.
Vehicle operating cost is from the 2018 American Automobile Association.Footnote
2
It includes the cost of gas, maintenance, and tire wear expense. We assume a medium-sized car is used. Also, following Hang et al. (Reference Hang, McFadden, Train and Wise2016), we exclude depreciation in our computation. This gives us a cost of 19 cents per mile for
 $c$
. For time cost we use ¾ of an angler’s imputed wage (but include 1/3 and 1.0 of the wage as a sensitivity analysis). This follows Fezzi et al. (Reference Fezzi, Bateman and Ferrini2014) on the implicit value of time traveling to a recreation site and what we detect as a trend toward higher values of time in the literature. Since we do not have wage or income data at the individual level to estimate the imputed wage (
$c$
. For time cost we use ¾ of an angler’s imputed wage (but include 1/3 and 1.0 of the wage as a sensitivity analysis). This follows Fezzi et al. (Reference Fezzi, Bateman and Ferrini2014) on the implicit value of time traveling to a recreation site and what we detect as a trend toward higher values of time in the literature. Since we do not have wage or income data at the individual level to estimate the imputed wage (
 $wag{e_i}$
), we use the average income for angler’s zip code from IRS Statistics of Income website and divide by 2000, the expected hours of work in a year. This is standard in travel cost demand models.
$wag{e_i}$
), we use the average income for angler’s zip code from IRS Statistics of Income website and divide by 2000, the expected hours of work in a year. This is standard in travel cost demand models.
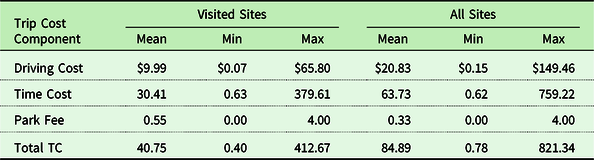
For everyone in the data set, the distance and time to each of the 118 fishing destinations was computed using PC*Miler. The 5-digit zip codes of the respondent’s address were used as origins, and the fishing site’s geographical coordinates (latitude and longitude of a central point) were used for destinations. Multiplying distance by per-mile vehicle operating costs gives the driving expense for a fishing trip shown in Table 6. Mean total trip cost to the visited sites is $41 of which $30 is time cost and $10 is out-of-pocket operating cost. Mean trip cost to all sites in the choice set is more than twice as high as the cost of visiting the chosen sites. This shows a travel cost model (downward-sloping demand function) is at work.
Trip cost by cost components for fishing trips
Site characteristic data
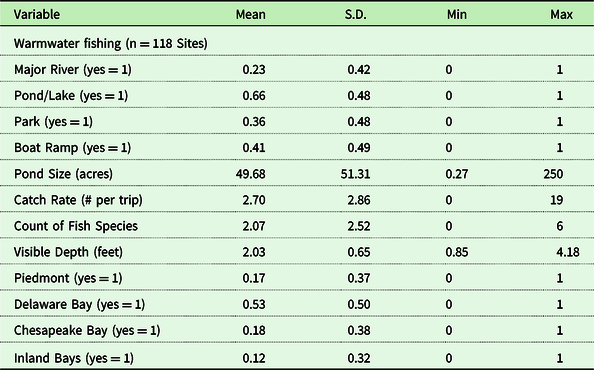
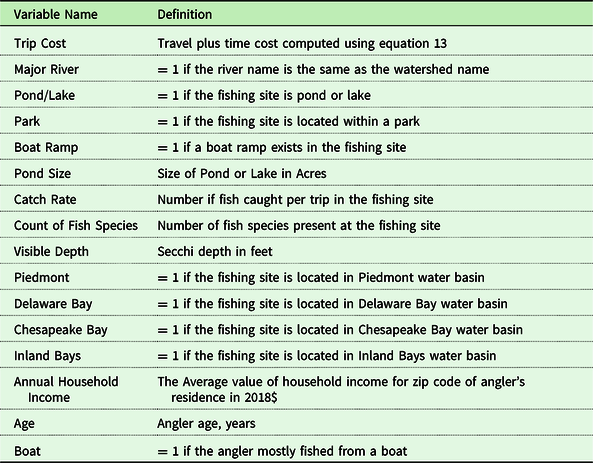
The sites in our Site Choice Model include 118 rivers, streams, lakes, and ponds in the state. This includes all public sites (except for a few small sites not used for fishing and private ponds). Table 7 is a list of characteristics of the sites. These are the characteristics used in our site choice model. Of the 118 sites, 66 percent are ponds or lakes, and 36 percent are located in state parks or in close proximity to local parks. A river that passes through a park is considered to have park access. The average pond is 49 acres. River size is harder to measure. There are long-narrow and short-wide rivers, for example. Instead, we use a binary variable Major River, where we define major as having one of Delaware’s 45 subwater basins named after the river. So, the Brandywine Creek, Christina River, and Nanticoke River, for example, are major rivers. About 41% of the sites have boat ramp access of some sort. Our three policy variables include catch rate of fish, count of species, and water clarity. Catch rate of fish is the number of fish caught per trip as measured by the DFW. Count of species is the number of different species reported as having been caught at each site or otherwise reported as being present. Water clarity is a Secchi Depth measure. It is the mean of all measures taken in 2018 by the Department of Natural Resources and Environmental Control.
Descriptive statistics for fishing sites in Delaware in 2018
*See Table 8 for definitions.
Sources: Delaware Surf Fishing, Delaware Angler Mail Survey 2018, Maryland Delaware Atlas & Gazetteer, National Water Quality Monitoring Council, Delaware Department of Natural Resources and Environmental Control, Google Maps.
Estimation results and welfare simulations
Estimation results
The estimation results for two versions of our site choice model (referred to as short and long) are shown in Table 8. The Short Model uses a limited number of covariates and a Long Model uses the full complement. The Short Model includes trip cost, our three policy variables, and four fixed effects for the four water basins in the states, which we believe capture shared unobserved characteristics such as nearby communities and natural cover. The Long Model includes these variables as well as more detailed site characteristics (presence of boat ramp, location in a park, size, etc. shown in Table 9) and an interaction term with boat (a fixed effect for anglers who mostly go boat fishing) for selected variables. The latter interactions allowed boat-oriented anglers to have different preferences over some of the attributes – trip cost, boat ramp, and pond. We also included alternative-specific constants for the three most popular sites in each basin. We experimented with finer levels of fixed effects down to individual alternative-specific constants on each site before settling on the three most popular sites within each basin. Using finer levels led to convergence problems.
Site choice model*
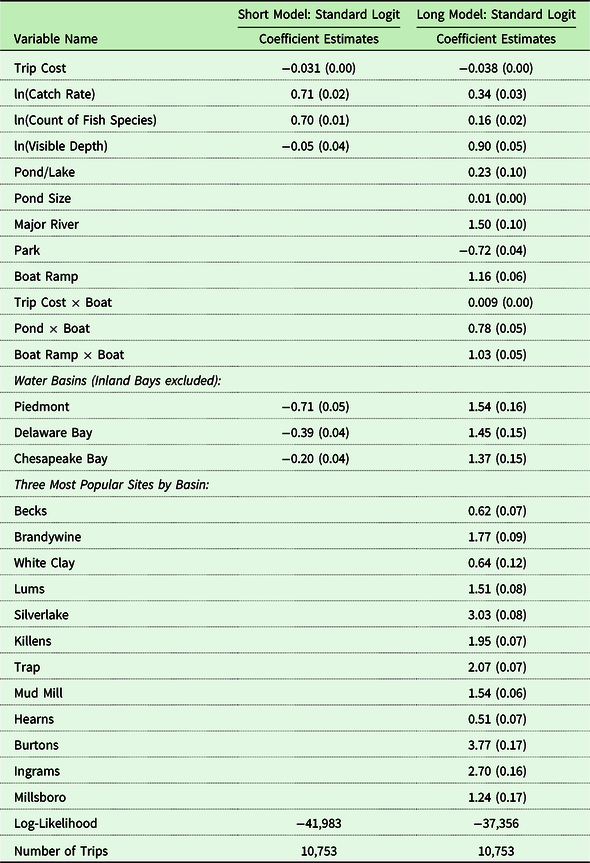
* Standard errors are in the parenthesis. With the exception of ln(Visible Depth) in the Short Model, all coefficients are statistically significant at 5% level or better.
Variable definitions
The trip cost coefficient is negative and significant in both models. In the Short Model, the trip cost coefficient implies a per-trip value of $32 (=1/.031). In the Long Model, the per-trip value is $26 (=1/.038).Footnote 3 The lower value with the Long Model implies that trip cost has some correlation with added covariates in the model showing the importance of their inclusion. We also introduced an interactive term (Trip Cost * Boat) for boat anglers thinking they may have different sensitivity to trip cost. Indeed, they are less sensitive to trip cost and so have a higher per-trip value of $34 (=1/(0.038–0.009)). Our values are on the lower end of the range reported in the literature. For example, in discussing a database compiled by the US Forest Service, Melstrom et al. (Reference Melstrom, Kaemingk, Cole, Whitehead, Chizinski and Pope2023) write “as of 2017 the database reported 120 freshwater fishing valuation studies with 913 different value estimates (Rosenberger et al. Reference Rosenberger, White, Kline and Cvitanovich2017). The mean estimate is US$82 per day (inflated to 2021 dollars), with a range of $6 to $525.” Boardman et al. (Reference Boardman, Greenberg, Vining and Weimer2018, p. 483) report the value of a fishing trip at $58 in 2016$. That our estimates are on the lower end is not surprising. Delaware’s warmwater freshwater fishing sites are good but of only local significance and driven down in value by the presence of good saltwater and cold-water substitutes nearby.
The coefficients are all significant (or nearly so) and tell a sensible story. Anglers prefer lakes/ponds to rivers/streams and larger versions of each. Sites with parks are less preferred than sites without. This may capture a congestion effect and parks are usually more oriented toward other types of recreation like picnics, family outings, walking, etc. Boat ramp increases the likelihood of being chosen as a site and even more so for people who use a boat to fish frequently. Boat anglers are also more likely to go to a lake/pond than a river/stream. The water basin fixed effect variables also work as expected. The Inland Bay area is the excluded group. Interestingly, the three basin variables are negative in the Short Model and positive in the Long Model. This is due to the three most popular sites in the Inland Bays dominating trips to that basin relative to the other basins. So, once accounted for in the Long Model, the other water basin coefficients become positive versus the Inland Bays. The 12 alternative-specific constants are all positive as expected given that these are the most popular sites in each water basin.
Finally, all three policy variables are all positive and significant. All three are also lower in absolute terms and relative to the trip cost in the Long Model. The conditional value of catching one more fish decreases as the number of fish caught increases. Going from 1 to 2 fish is worth about $9 in the Long Model, while going from 5 to 6 fishes is worth about $2. The variable enters the model as ln(Catch Rate). We also estimated models with catch rates of bass separate from and interacted with bass as a targeted species, and they uniformly perform poorer than using a simple catch. Anglers appeared to consistently care about catching more fish, but not so much as which kind among the warmwater species present the Delaware’s freshwaters. This was confirmed by fisheries resource managers in that state – at least they were not surprised by the result. Anglers did care, however, about the diversity of species that are present. Going from 1 to 2 species is worth about $4 while going from 5 to 6 is worth less than $1 (again the variable entered as a logged term). Water quality (measured as clarity) also figures in an anglers’ preferences when selecting a site. We chose to use clarity as a measure in the model because other attributes important for fishery abundance and diversity would implicitly already be captured in our two fish variables (higher dissolved oxygen levels leading to more fish abundance and so higher catch), but view/amenity effects are not. The coefficient on water clarity is positive in the Long Model and negative in the Short Model suggesting that its effect is picking up the effects of other attributes and wider regional differences in the Short Model. The conditional value of going from 1 foot to 2 feet of visibility is worth about $23 while going from 5 to 6 feet is worth about $5.
The results for the trip-frequency portion of the linked model are shown in Table 10. We only present estimates here corresponding to the Long Model (i.e., we use the inclusive value from the Long Model). As shown the number of trips decreases with age and income and increases with the expected value of the trip (
 ${I_i}/ \!\!-\! \alpha $
). The coefficient on the inclusive value term will be used to predict the change in trips due to site quality improvements. The coefficient of .01 on the inclusive value implies that for a $10 increase in the expected value of trip, the number of trips taken increases by about 10%. Now, we turn to the simulations for several selected improvements in fishing quality.
${I_i}/ \!\!-\! \alpha $
). The coefficient on the inclusive value term will be used to predict the change in trips due to site quality improvements. The coefficient of .01 on the inclusive value implies that for a $10 increase in the expected value of trip, the number of trips taken increases by about 10%. Now, we turn to the simulations for several selected improvements in fishing quality.
Trip frequency model
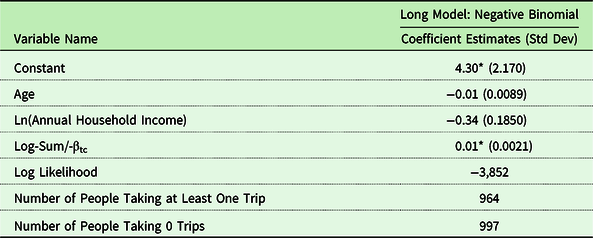
* Significant at 5% level.
Welfare simulations
We consider three welfare scenarios in our simulations – small, medium, and large water quality improvements. These are configured using our three policy variables as follows
-
Small → Catch rate increases by 1 fish per trip and Secchi Depth increases by 1 foot
-
Medium → Catch rate increases by 3 fish per trip, Secchi Depth increases by 2 feet, and fish species count increases by 1 fish
-
Large → Catch rate increases by 6 fish per trip, Secchi Depth increases by 3 feet, and fish species count increases by 2 fish
We consider these improvements over selected waterbodies, selected river systems (some major rivers and their tributaries and nearby ponds), basin-wide for the four basins, and statewide. We present the welfare effects in seasonal per person and aggregate terms. The aggregate measure scales the sample estimates up to the population, which in our case is all holders of a 2018 fishing license (82,000 potential warmwater anglers). The small improvement is certainly within the range of plausible policy scenarios the state might consider with existing resources. These might include increased enforcement of existing regulations, some minimal targeted buffering around ponds and streams, and improved management practices on farms in the center and southern part of the state. The medium improvement would increase these commitments and include sewer overflow and runoff management in cities and towns as well as tightening existing regulations on point sources, restoring fish habitat (wetlands, etc.), cleanup of brownfields, and removal of toxins such as PCBs. The specific actions necessary will vary by the circumstances at each waterbody but most should be able to reach our medium improvement, which we assume would also improve conditions for cold-water fishing. In many cases, the time frame would be beyond five years. The large improvement is extensive and may in some cases hit physical and practical constraints that prevent realization, but we wanted to explore the upper bounds. Some river systems, especially in rural south have potential to reach large improvement levels. The results are shown in Table 11.
Welfare scenarios for water quality improvement scenarios, $2018
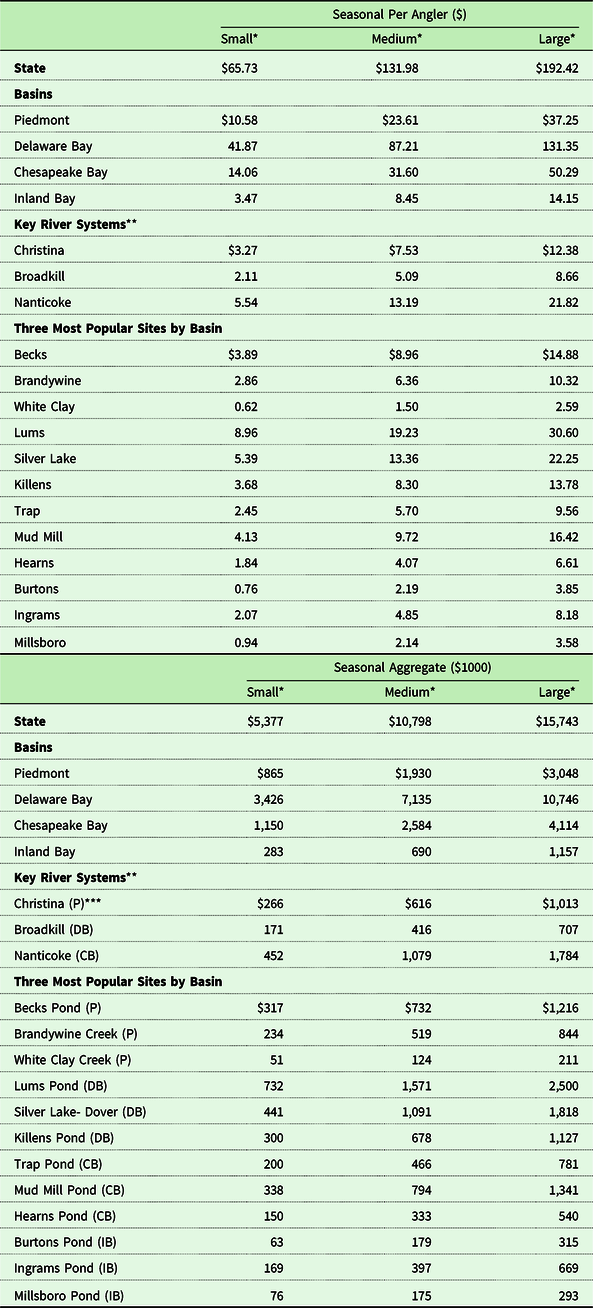
* Small Improvement: Catch Rate increases by 1 fish and Secchi depth increases by 1 ft.; Medium Improvement: Catch Rate increases by 3 fish, Secchi depth increases by 2 ft. and fish species count increases by 1 fish.; Large Improvement: Catch Rate increases by 6 fish, Secchi depth increases by 3 ft. and fish species count increases by 2 fish.
** Christina River System: Christina River, Red Clay River, White Clay River, Mill Creek, Pike Creek; Broadkill River System: Broadkill River, Diamond Pond, Red Mill Pond, Wagamons Pond; Nanticoke River System: Nanticoke River, Broad Creek, Chipmans Pond, Concord Pond, Craigs Pond, Fleetwood Pond, Horseys Pond, Portsville Pond, Records Pond, Williams Pond.
*** P = Piedmont, DB = Delaware Bay, CB = Chesapeake Bay, IB = Inland Bay.
First, consider the statewide effects. These range from $65 per person per year for the small improvement to $192 per person per year for the large improvement. Keep in mind that these average seasonal values include all license holders in our data set (participants and non-participants in warmwater fishing) since everyone has some positive probability of visiting every site. The seasonal aggregate welfare effects range from $5.4 million for the small improvement to $15.7 million for the large improvement. These translate to asset values of $180 million and $523 million for improving all the state’s waters (assuming the improvement holds indefinitely, a discount rate of 3%, and no change in the number of anglers).
For the basin-wide effects, all the values are, of course, lower. They are everywhere highest for the Delaware Bay. The water bodies of notable interest in the Delaware Bay Basin include Lums Pond, Silver Lake, and Killens Pond. These are among the most heavily visited sites in the state for fishing. As shown in Table 12, the Delaware Bay has more fishing sites than the other basins, which is in part driving the results. The Delaware Bay Basin’s aggregate annual values range from $3.4 for the small improvement to $10.7 million for the large improvement. These are more than twice the values for any of the other basin-wide improvements and translate to asset values of $113 and $357 million. The Chesapeake Bay Basin is the second most valuable among the basins with aggregate annual values ranging from $1.1 to $4.1 million.
Number of Ponds and Rivers by Basin
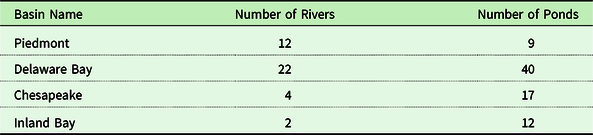
Table 11 also shows results for three selected major river systems. These each include the river and all its tributaries and nearby hydrologically related ponds. The footnote in Table 11 indicates the rivers and ponds included in each. The Nanticoke River System (south) has the largest values, followed by the Christina (north), and Broadkill (central). Table 11 also shows the values for three selected single water bodies in each basin.
We have no cost estimates to place alongside our benefit scenarios. These would require localized cost analyses, which are beyond the reach of this study. We offer the model as a tool the state can use when specific management scenarios are under consideration. In some cases, our existing scenarios may provide rough estimates of the range of values to expect depending on the changes and water bodies considered. One interesting statewide policy development is legislation that provides $50 million to a trust fund for funding for clean water projects. How this will be targeted is uncertain, but our results could help to identify projects with the largest payoff at least in terms of fishing benefits.
Summary and conclusion
We estimated a recreational demand model for warmwater fishing in the state of Delaware. Delaware has over 100 freshwater sites (rivers, streams, and ponds) managed by the Delaware Division of Fish & Wildlife. As part of their management efforts, they survey the angler population every five years. This paper is an effort to analyze their survey data to provide economic content for their management decisions. We estimated models separately for warmwater and cold-water fishing. The cold-water model, which is focused on stocking fish, is the subject of a separate paper (Parsons and Dalvand Reference Parsons and Dalvand2023).
We estimated a linked site choice – trip frequency model in the realm of Random Utility Theory with the three policy variables: fish catch per trip, diversity of species, and water clarity. Using this model and combinations of these policy variables we considered a variety of hypothetical scenarios – two spanning the domain of “realistic” improvements and one case of somewhat dramatic improvement. These simulations resulted in consumer surplus estimates ranging from $5 to $16 million per year for a statewide improvement. In more targeted improvement scenarios for key river systems under consideration for management initiatives, aggregate consumer surplus ranged from $51 thousand to $2 million depending on the scenario and river system. The Nanticoke River System in southern Delaware had the highest values for a river ranging from $0.5 to $2 million. Lum Ponds, located in the north-central part of the state had the highest values for any pond/lake – $0.7 to $2.5 million.
A sizable new tax policy in the state is poised to provide funds for cleaning up waterbodies in the state, if/when these are directed at fishing resources, our research may be useful in identifying cost-effective uses. For example, anglers place a higher-than-expected amenity value on water clarity. So, merely attacking greater fish catch beyond the current baseline, may not be as desirable as shear cleanliness depending on the relative costs of achieving those outcomes. Diversity of species also matters more than we expected, so introducing new species as opposed to trying to boost the catch of an existing species is worth considering. Finally, there are regional differences that may signal directing funds in certain ways. The Nanticoke River System, which is already a popular fishing site and is not near population centers tend to show proportionally higher values than other similar systems in the north closer to population centers. Finally, there are specific discussions on going about a major revival of Christina River system in the north. Our analysis here has direct use in this case.
Our estimates also generated a conventional per-trip value for fishing, which is a commonly used measure to transfer across applications. Our estimates range from $26 per trip for shore fishing to $34 per trip for boat fishing.
Finally, our findings are the first estimates we are aware of for freshwater recreational fishing in Delaware. Additional applications of this data set may include a comparison of mixed logit models with the current models in order to examine the efficacy of these models and to determine how accounting for different patterns of substitution would alter the models’ outputs.
Acknowledgments
We thank Scott Newlin and Edna Stetzar of the Delaware Department of Natural Resources and Environmental Control for providing the data, encouraging the study, sharing insights, and continually showing an interest in economic analysis of the fisheries in the state.
Funding statement
This publication was made possible by the National Science Foundation EPSCoR Grant No. 1757353 (RII-4, Began Oct. 2018) and the State of Delaware. Any opinions, findings, and conclusions or recommendations expressed in this material are those of the author(s) and do not necessarily reflect the views of the National Science Foundation.
Competing interests
None to report.


 Open access